Article

An Optimal Power Flow Solution of a System Integrated with Renewable Sources Using a Hybrid Optimizer

1
Electrical Engineering Department, Wah Engineering College, University of Wah, Wah Cantt 47040, Pakistan
2
Department of Mechanical Engineering, HITEC University Taxila, Taxila, Rawalpindi 47080, Pakistan
3
Department of Information and Communication Engineering, Soonchunhyang University, Asan 31538, Korea
4
Department of Computer Science and Engineering, Soonchunhyang University, Asan 31538, Korea
*
Author to whom correspondence should be addressed.
Sustainability 2021, 13(23), 13382; https://doi.org/10.3390/su132313382
Submission received: 22 October 2021 / Revised: 25 November 2021 / Accepted: 29 November 2021 / Published: 3 December 2021

Abstract

:
A solution to reduce the emission and generation cost of conventional fossil-fuel-based power generators is to integrate renewable energy sources into the electrical power system. This paper outlines an efficient hybrid particle swarm gray wolf optimizer (HPS-GWO)-based optimal power flow solution for a system combining solar photovoltaic (SPV) and wind energy (WE) sources with conventional fuel-based thermal generators (TGs). The output power of SPV and WE sources was forecasted using lognormal and Weibull probability density functions (PDFs), respectively. The two conventional fossil-fuel-based TGs are replaced with WE and SPV sources in the existing IEEE-30 bus system, and total generation cost, emission and power losses are considered the three main objective functions for optimization of the optimal power flow problem in each scenario. A carbon tax is imposed on the emission from fossil-fuel-based TGs, which results in a reduction in the emission from TGs. The results were verified on the modified test system that consists of SPV and WE sources. The simulation results confirm the validity and effectiveness of the suggested model and proposed hybrid optimizer. The results confirm the exploitation and exploration capability of the HPS-GWO algorithm. The results achieved from the modified system demonstrate that the use of SPV and WE sources in combination with fossil-fuel-based TGs reduces the total system generation cost and greenhouse emissions of the entire power system.

1. Introduction

Due to the rapid increase in energy demand, the impact of optimization in power flow is significant. Optimization enables effective and inexpensive power flow operation in the electrical system. It is helpful to keep in mind that most of the power system problems regularly need to optimize two or more different objectives due to their nonlinear nature. The fundamental OPF problem is the optimal allocation of real power and voltages of generators by changing the control parameters, so as to ensure the optimization of a particular objective during the operation of electric power flow in the system [1]. In the optimization process, system equality and inequality constraints such as power flow equilibrium, generator capacity, line capacity, generation and load bus voltages must be fulfilled [2].
Various OPF formulation techniques have been developed and used over the past two decades to optimize the operation of power flow in electrical power systems, and each technique is equipped with a distinct mathematical feature and has different computational requirements [3,4]. To optimally manage the energy resources of customers and their energy demand profiles, an effective technique called demand side management (DSM) can be used [5]. Due to the intermittent nature of renewable energy sources (RES) such as wind energy (WE) and solar photovoltaic (SPV) sources, the complexity of OPF has increased and become a challenging problem for researchers after the incorporation of RES into the system [6]. The probabilistic nature of SPV and WE sources needs to be taken into account to ensure a reliable and effective integration of these RES into the electrical power system [7].
Various conventional methods have been used for optimization of power flow in electrical power systems such as Newton’s method, the interior point method (IP) [8], linear programming (LP) [9], quadratic programming (QP) [10] and nonlinear programming (NLP) [11]. To minimize cost with nonlinear pricing, a mixed integer quadratic programming energy scheduling algorithm has been used by researchers in [12] for the scheduling of energy activities in smart homes with controllable loads, renewable energy sources and energy storage systems. All these conventional methods have shown excellent results to solve OPF problems, though these methods are insufficient for large systems with non-differentiable and non-convex objective functions due to their extensive calculation and high reliance on the early assumption values.
To cope with the weaknesses of conventional techniques, the domain of numerical optimization has suffered a surge over the past few years with the emergence and development of various evolutionary algorithms [13]. Over the last few years, various evolutionary algorithms such as differential evolution (DE) [14], moth flame optimization (MFO) [15], the genetic algorithm (GA) [16], the barnacle mating optimizer (BMO) [17], particle swarm optimization (PSO) [18], the moth swarm algorithm (MSA) [19], glowworm swarm optimization (GSO) [20] and the gravitational search algorithm (GSA) [21] have been applied to solve different optimization problems in power systems. An efficient Harris hawk optimization (HHO) has been applied for the optimization of modern distribution framework reconfiguration where the effectiveness of the algorithm has been validated on the IEEE 33 and 85 bus systems [22]. A water cycle algorithm (WCA) has been used for the optimization, sizing and setting of distributed generations. The results have been tested on IEEE 33 and 69 bus systems [23].
Recently, several metaheuristic algorithms have been hybridized to enhance the global search capability and to eliminate the chance of trapping the solution at the local optimal point in various metaheuristic algorithms. In Reference [20] the author used a hybrid PSO and GSA algorithm for an OPF solution considering different objectives such as the minimization of cost, power losses and voltage stability improvement in the network. Other hybrid algorithms that have been used for OPF solutions are the hybrid DE and harmony-search algorithm (DE-HSA) [21], the hybrid artificial bee colony and DE algorithm [22] and the hybrid Harris hawk and DE (HH-DE) algorithm [23].
This paper proposes the utilization of a newly developed hybrid optimizer named particle swarm gray wolf optimizer (HPS-GWO) to solve OPF problems. This optimizer is integrated with a WE and SPV source taking into consideration the balance and imbalance constraints. Minimization of total generation cost with valve point effect, emission and system power losses are the three objective functions to be optimized in each optimization case. The execution of the suggested technique is carried and examined on the modified IEEE 30 bus test case. The rest of this paper has the following structure: Section 2 explains the mathematical formulation of the OPF problem, and Section 3 provides details of the proposed HPS-GWO. Section 4 provides a description of the simulation results obtained through the proposed method, while the conclusions of the study are offered in Section 5.

2. Mathematical Formulation of OPF Problem

Mathematically, the problem OPF can be formulated as a nonlinear optimization problem. The key purpose of the OPF is to reduce the total generation cost of the system by choosing suitable values of the control variables subjected to various system constraints. Mathematically, the OPF problem is expressed in the form:
Minimize   F ( x , y )
Subject to equality and inequality constraints:
h ( x , y ) = 0 g ( x , y ) 0
where x represents the control variables while y represents the state variables. Consideration of the state variable is also important for the security of the electrical system. The adopted system consists of thermal generators and WT and SPV sources; therefore, the total generation cost is the sum of the cost of all these sources, which are described in the subsequent subsections. Moreover, replacing thermal generators with RES, the generation at a bus should not breach line capacity constraints; in this research, the same approach of replacing thermal generators with RES was adopted as in References [24,25]. The online diagram of the modified IEEE 30-bus test case under consideration is provided in Figure 1.

2.1. Cost Model of TGs

The cost function of TGs with valve point effect is expressed as:
C T G = i = 1 n T a i + b i + c i P T G i 2 + | d i × sin { e i × ( P T G i min P T G i ) } |
where the values of coefficients a, b, c, d and e are given in Table 1.
The emission from TGs can be calculated by the following expression.
E e m i = [ i = 1 n T ( α i + β i P T G i + γ i P T G i 2 ) × 0.01 + ω i e ( μ T i P T G i ) ]
where values of the emission coefficients are mentioned in Table 2.
The emission cost in $/h can be calculated as below:
C e m i = C t × E e m i
where Ct is the carbon tax applied on a per unit ton of emission from TGs.

2.2. Cost Model of SPV Source

The cost function of the SPV source can be expressed as:
C s , k = h k × P s s c h , k
In this equation the direct cost coefficient of the SPV source is represented by hk. Other details related to the cost function of the SPV source are provided in [24].

2.3. Cost Model of WE Source

The cost function formulation of the WE source is expressed in the form:
C w , j = g w , j × P w s c h , j
where the direct cost coefficient of the WE source is represented by gw. Detailed discussion on the cost function formulation can be found in [24].

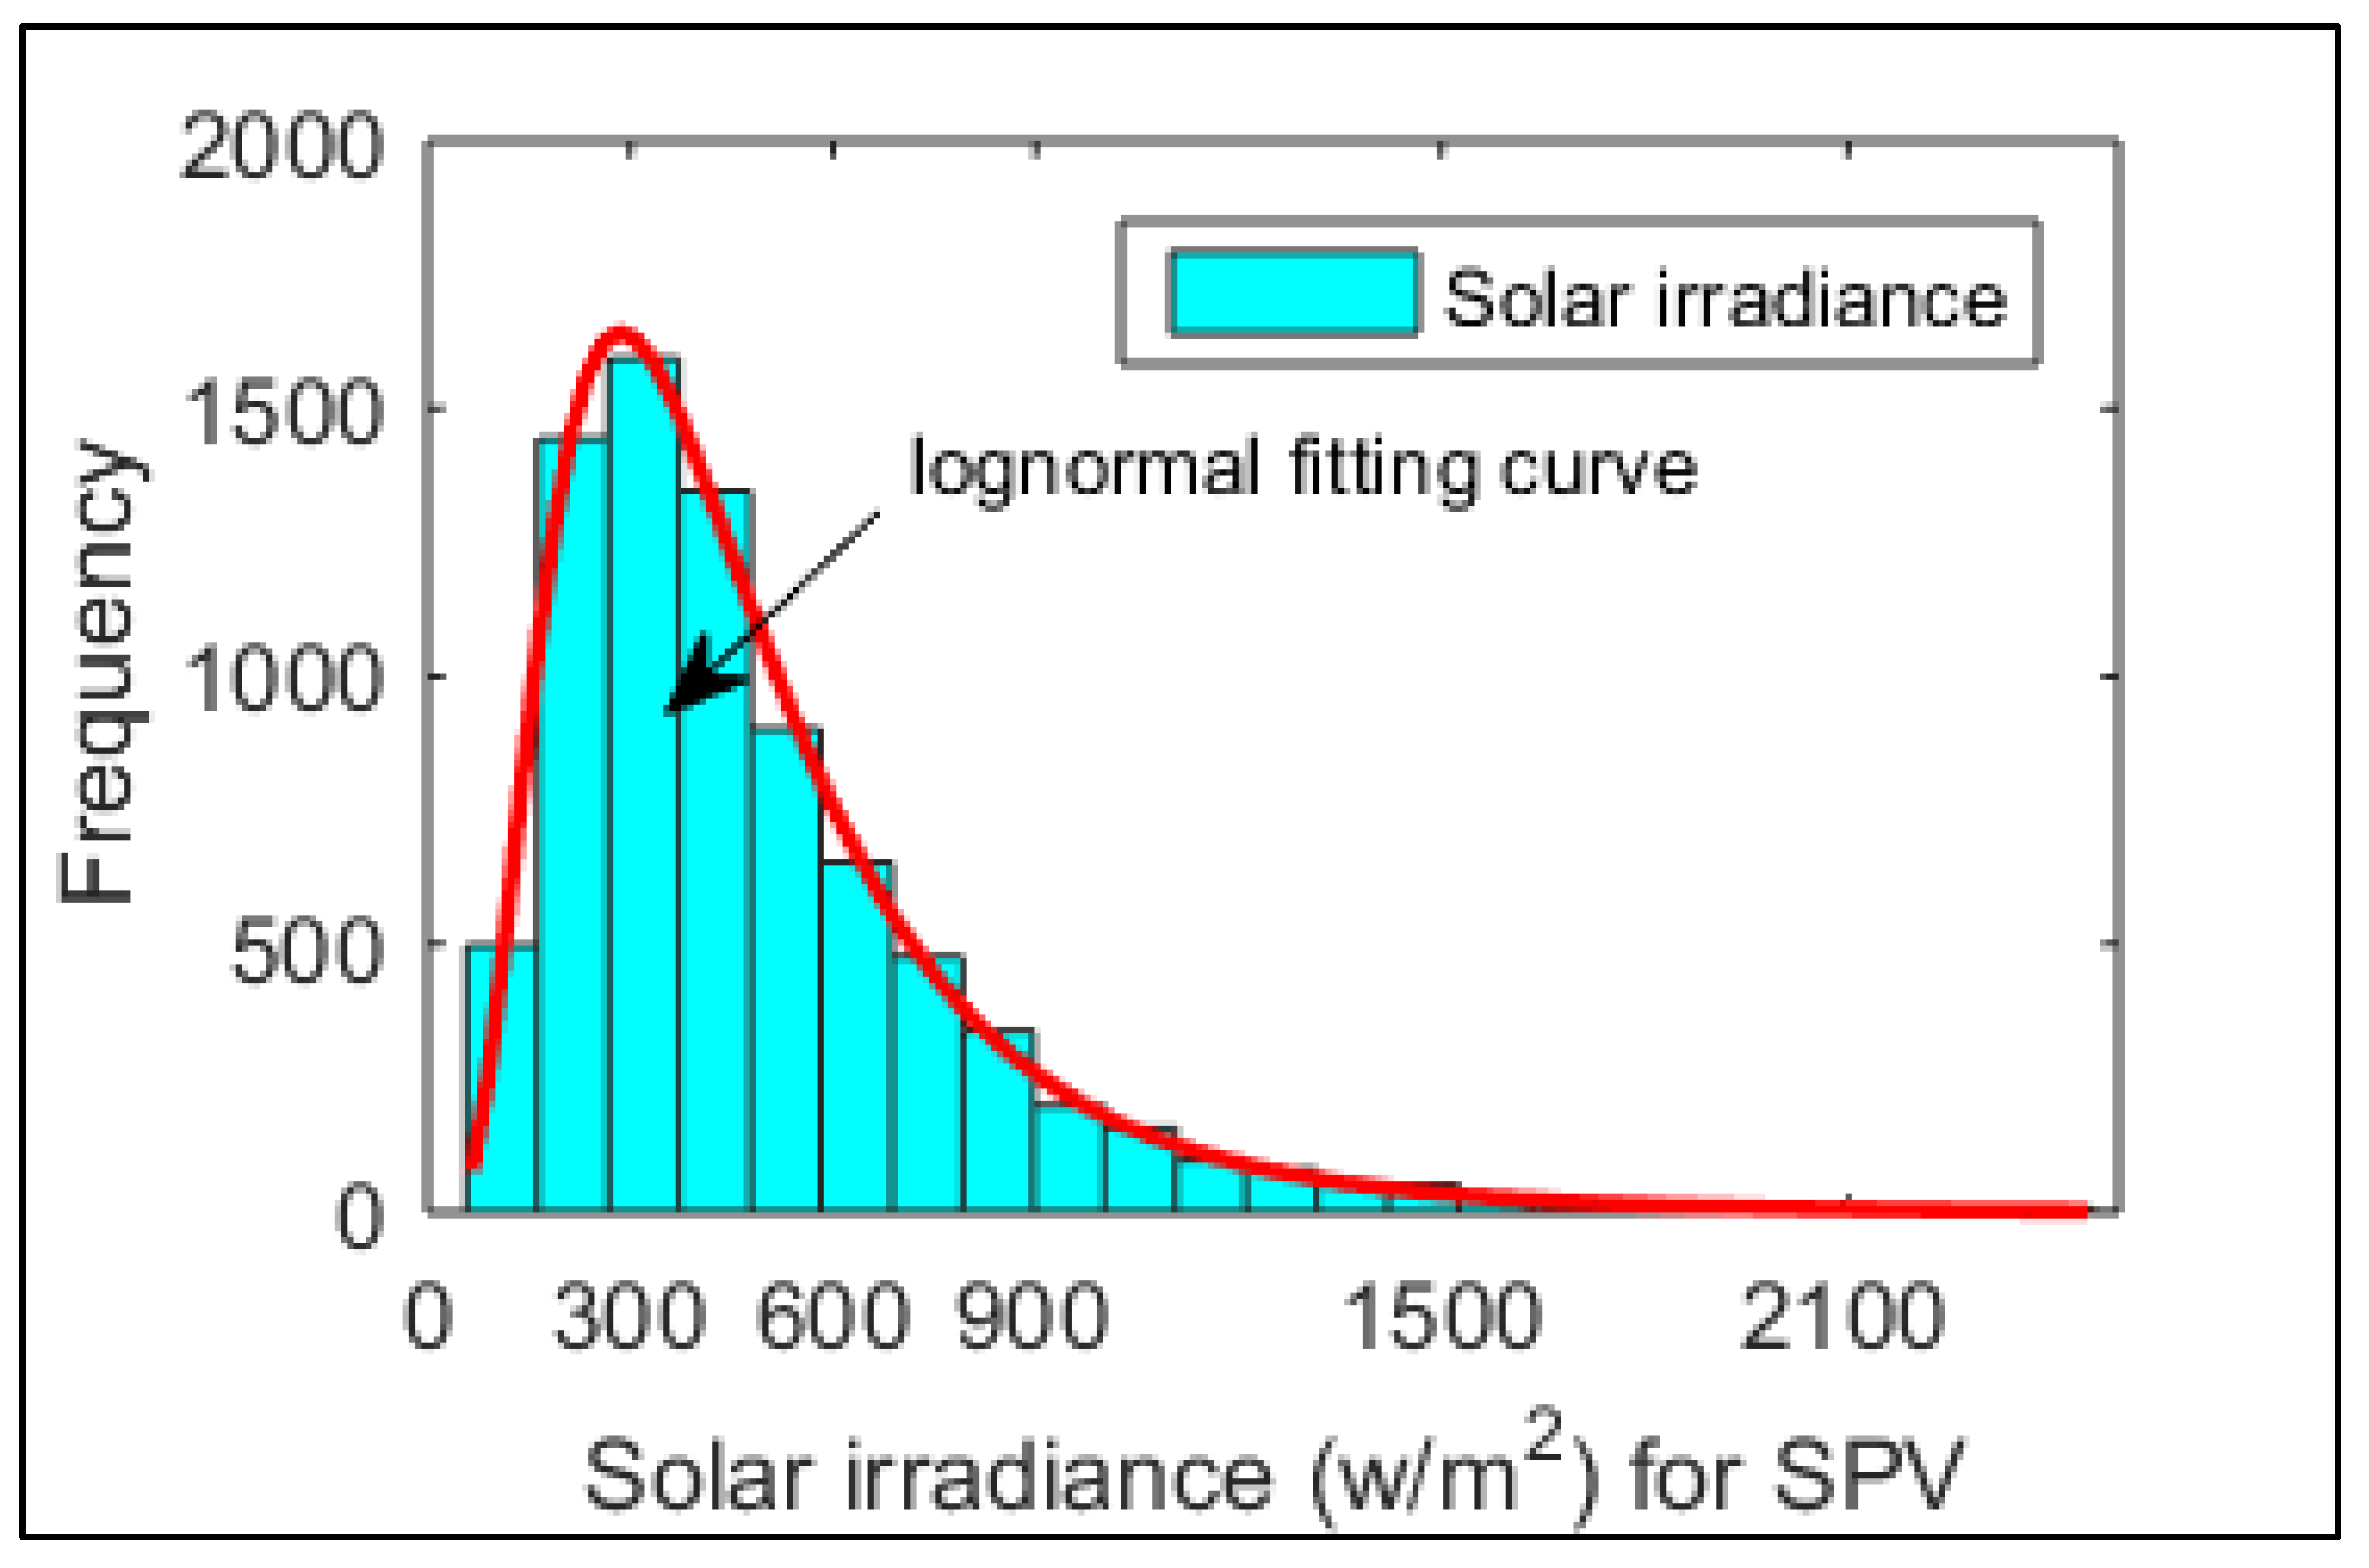
2.4. Uncertainty Model of SPV and WE Sources

The output power of SPV and WE sources relies on solar irradiance and wind speed, respectively. There may be a state in which the schedule power is less than the actual power or a state in which the output power of these sources is greater than scheduled power, which is termed as overestimation and underestimation, respectively. Reserve and penalty cost function for SPV and WE sources can be expressed as:
C R s , k = K R s , k ( P s s c h , k P s a c , k ) = K R s , k f s ( P s a c , k < P s s c h , k ) [ P s s c h , k E ( P s a c , k < P s s c h , k ) ]
C P s , k = K P s , k ( P s a c , k P s s c h , k ) = K P s , k f s ( P s a c , k > P s s c h , k ) [ E ( P s a c , k > P s s c h , k ) P s s c h , k ]
where KRs is the reserve cost coefficient of the SPV source.
C R w , j = K R w , j ( P w s c h , j P w a c , j ) = K R w , j 0 P w s c h , j ( P w s c h , j P w a c , j ) f ( p w , j ) d p w , j
C P w , j = K P w , j ( P w a c , j P w s c h , j ) = K P w , j P w s c h , j P w r , j ( P w , j P w s c h , j ) f w ( p w , j ) d p w , j
where KRw is the reserve cost coefficient of the WE source. The values of reserve cost coefficients for SPV and WE sources are provided in Table 2 and Table 3. A detailed discussion on SPV and WE sources, reserve and penalty cost can be found in [24]. After running 8000 Monte Carlo scenarios, the lognormal and Weibull PDF frequency distribution were plotted as shown in Figure 2 and Figure 3, respectively.
The output power of WT as a function of wind speed can be modeled as shown in Equation (12).
P w ( v ) = { 0 ,                       f o r     v < v i n   a n d   v < v o u t P w r ,                                               f o r   v i n v v r P w r ,                                         f o r   v r v v o u t  
where vr, vin and vout represent the rated, cut in and cut out wind speeds of WT, respectively.
The output power of the SPV source which is a function of solar irradiance (G) can be mathematically modeled as shown in Equation (13).
P S P V ( G ) = { P s r ( G 2 G s t d R c ) f o r   0 < G < R c P s r ( G 2 G s t d R c ) f o r   G R c
Rc represents an irradiance point, the value of which was set to 120 W/m2 in this study.

2.5. Objective Functions for Optimization

Two objective functions for optimization were considered in this study: total generation cost with the valve point effect and power losses in the system.
Total generation cost without levying carbon tax can be expressed as:
F 1 = C T G + j = 1 N w [ C w , j + C R w , j + C P w , j ] + k = 1 N s [ C s , k + C R s , k + C P s , k ]
Total generation cost after levying carbon tax can be expressed as:
F 2 = C T G + j = 1 N w [ C w , j + C R w , j + C P w , j ] + k = 1 N s [ C s , k + C R s , k + C P s , k ] + C e m i
Power losses in the network can be calculated through the following expression:
P l o s s = i = 1 n l j 1 n l G i j V i 2 + V j 2 2 V i V j cos ( δ i j )
Voltage deviation (p.u.) can be calculated through the following expression.
V D = p = 1 n l | 1 V l p |
where Vlp represents load bus voltage in per unit.

3. HPS-GWO for OPF Solution

In this study the HPS-GWO algorithm was utilized for the optimization of the two objective functions stated in the previous section. The PSO draws inspiration from the social behavior of gathering birds, while the GWO simulates the hunting and governance chain of command of gray wolves. Hybridization of PSO with GWO enhances the exploitation capability in PSO with the exploration capability of GWO.

4. Results and Discussion

Two objective functions for optimization were considered in this study: total generation cost with valve point effect and power losses in the system. The simulation results were obtained while ensuring a number of equality, inequality and security constraints, details of which can be found in [15]. Three metaheuristic algorithms, namely PSO, GWO and HPS-GWO, were utilized for the optimization of both objectives.

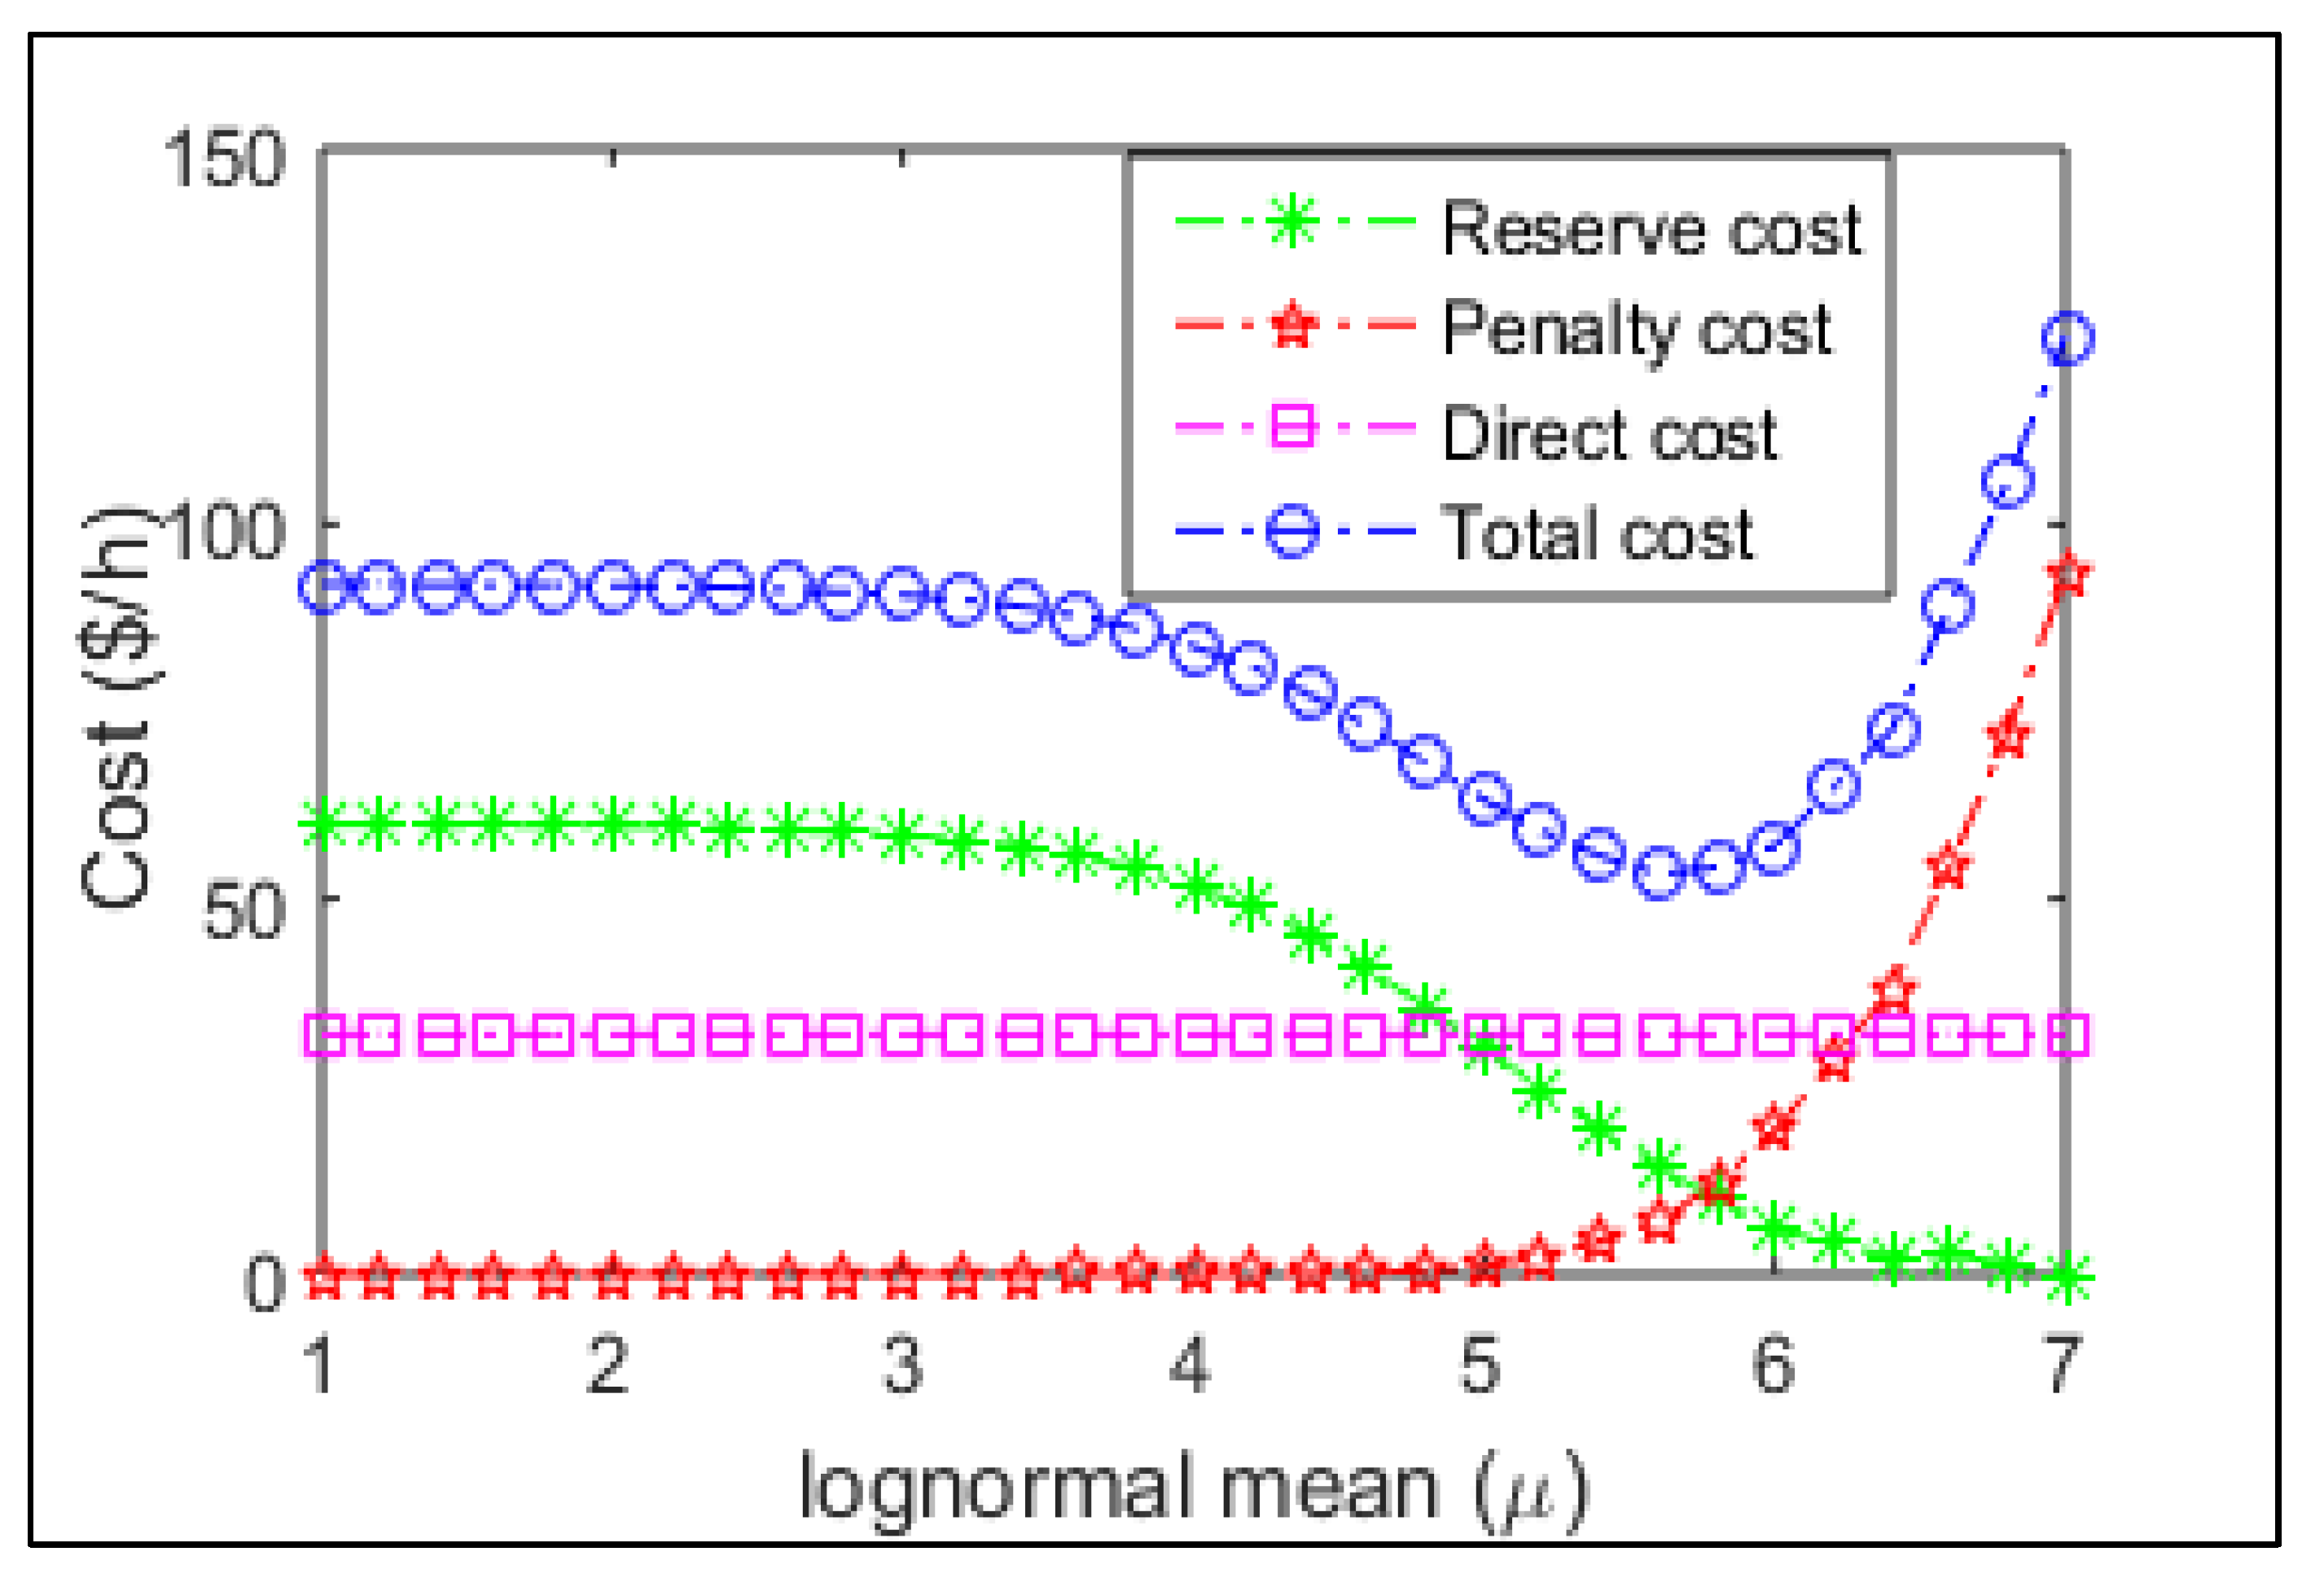
4.1. Case 1: SPV and WE Source Cost vs. PDF Parameters

In this case SPV and WE source total cost, that is the sum of penalty cost, reserve cost and direct cost, are plotted against a PDF parameter. In the case of the SPV source, the PDF parameter mean (µ) varies from 1 to 7 at a fixed value of standard deviation ẟ = 0.6, whereas in the case of the WE source the PDF scale parameter (c) varies from 2 to 18 at a fixed value of shape parameter k = 2. The results show that a minimum total cost of the SPV source is observed at µ = 5.8, while the minimum total cost of the WE source is observed at c = 9, as illustrated in Figure 4 and Figure 5, respectively.

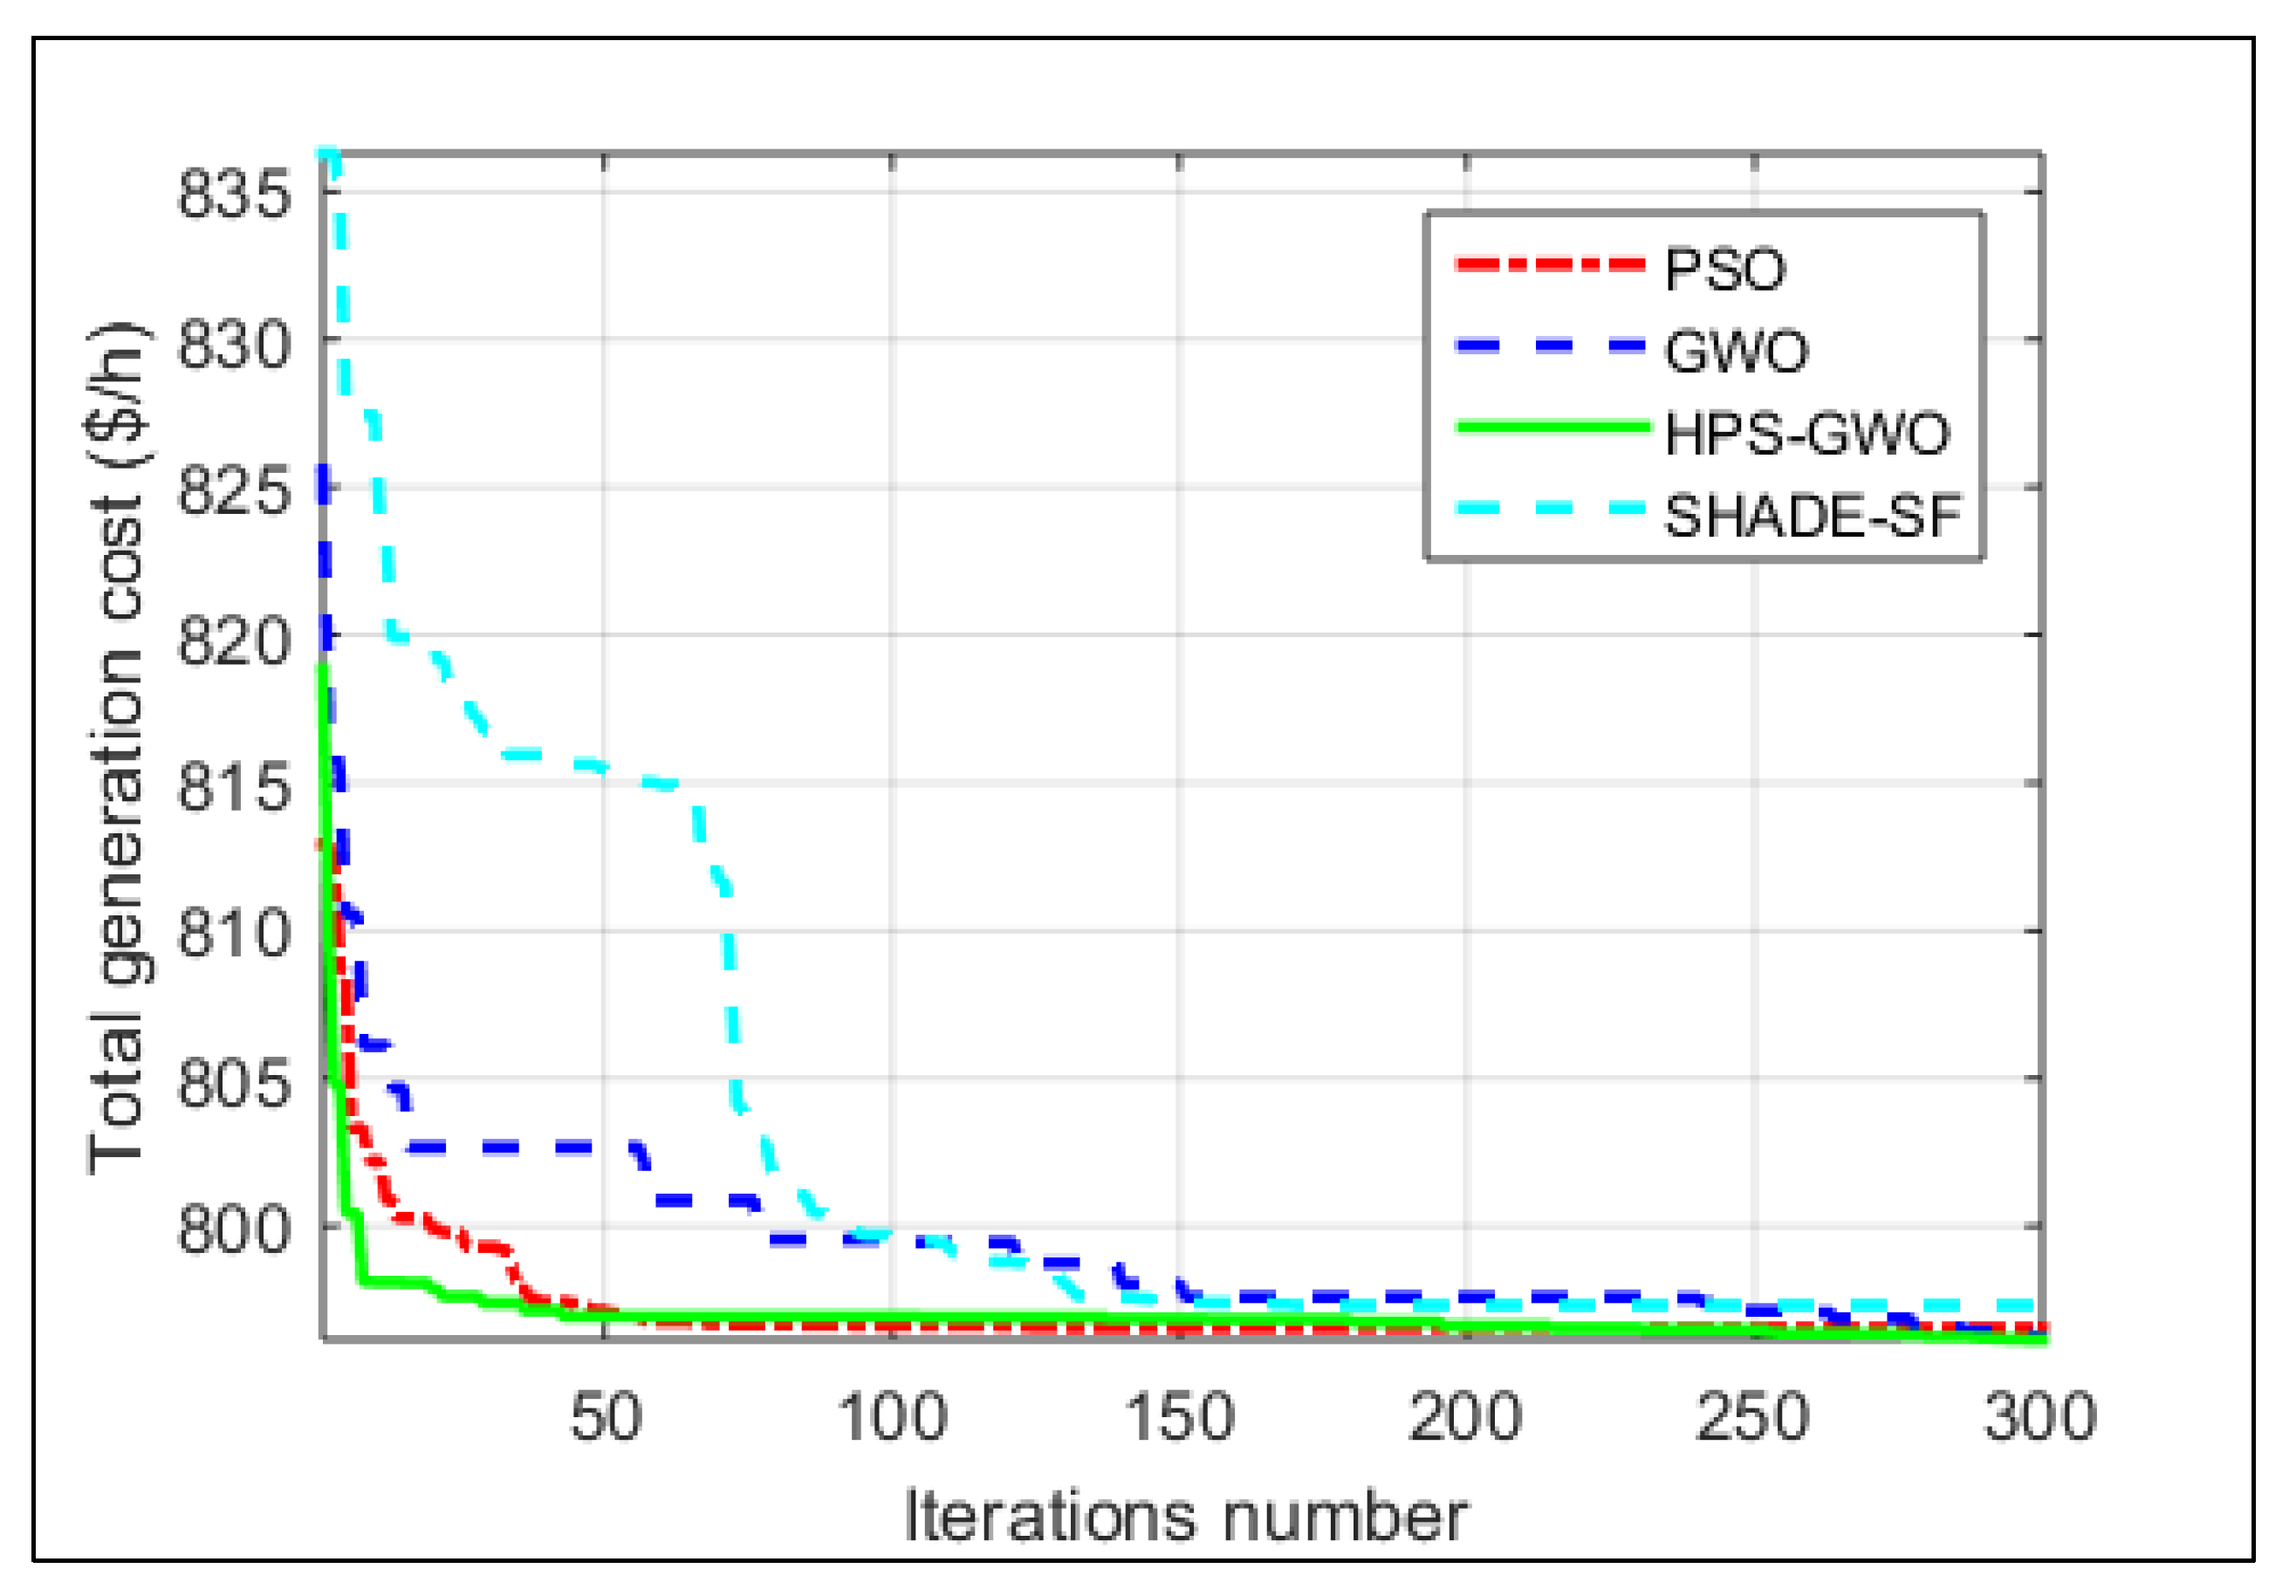
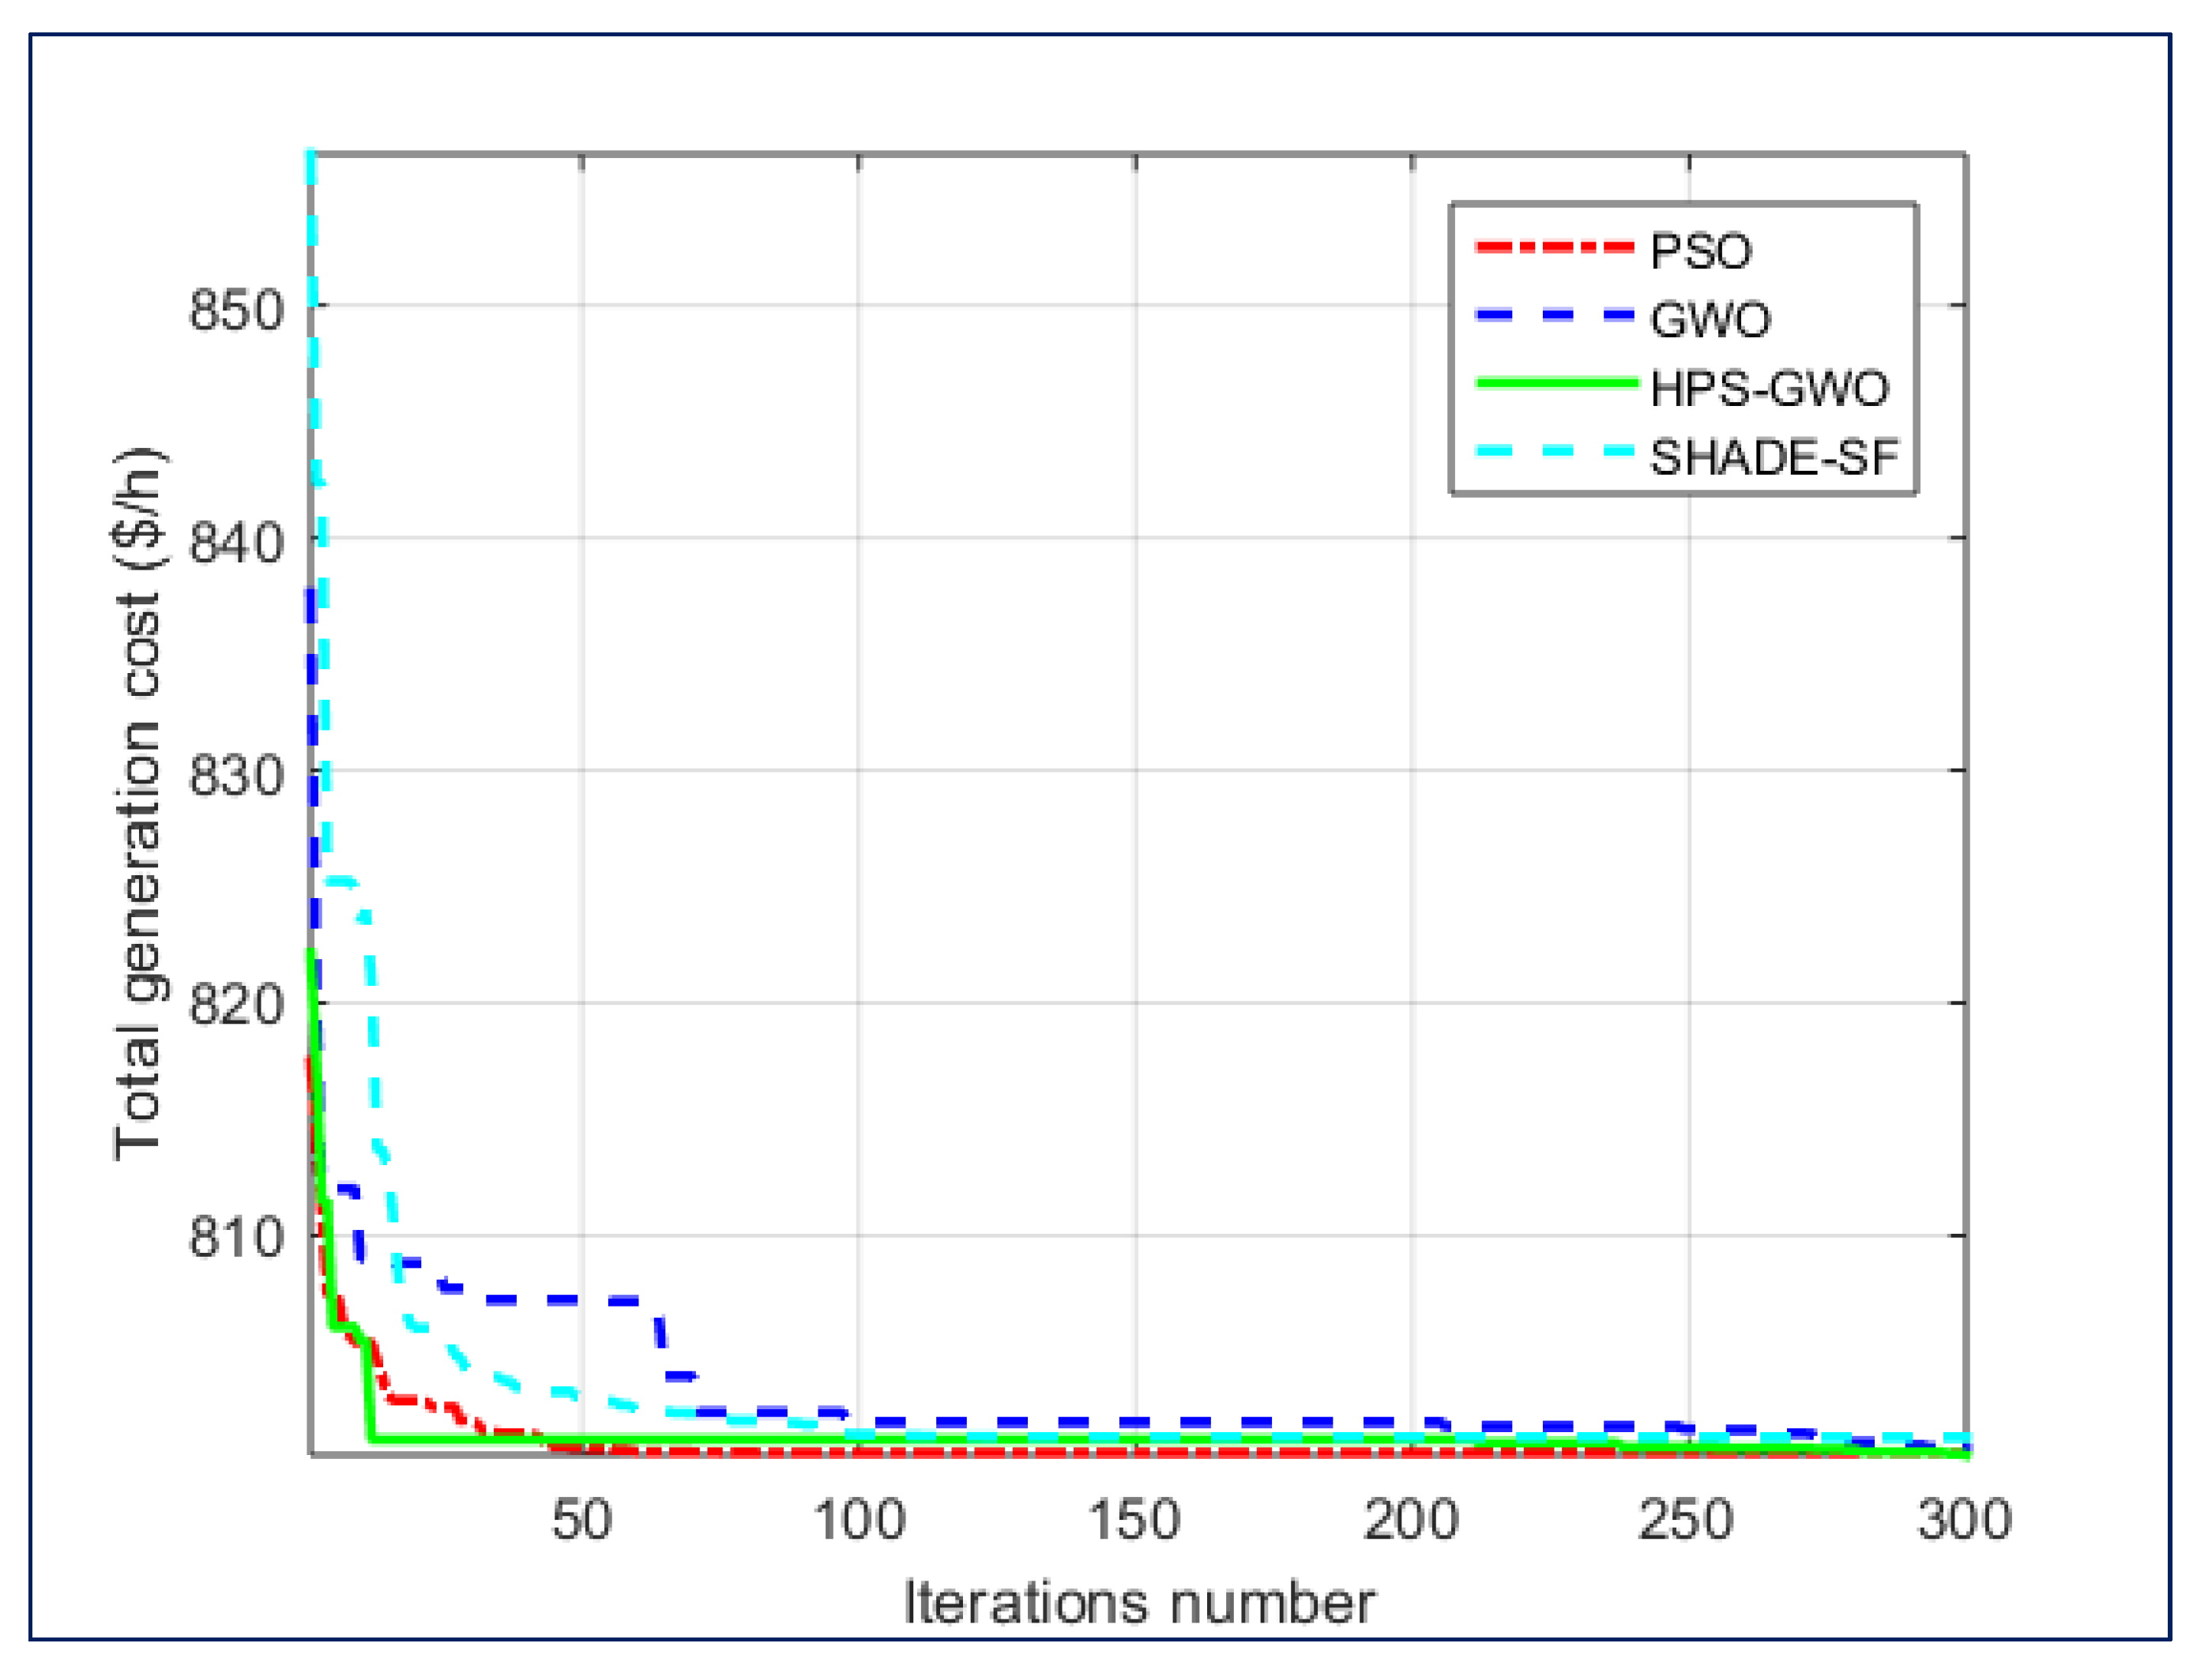
4.2. Case 2: Minimization of Total Generation Cost

In this case total generation cost of the system with the valve point effect was optimized. Each algorithm was run 5 times for 300 iterations, and the best values of the control variables and other constraints variables achieved are shown in Table 4. The minimum cost was achieved by HPS-GWO followed by GWO, PSO and SHADE-SF, as indicated by bold in Table 4. The minimum power losses in the network were achieved by SHADE-SF followed by HPS-GWO, GWO and PSO, while minimum emission was achieved by PSO followed by HPS-GWO, GWO and SHADE-SF. The convergence curve for the mentioned algorithms is shown in Figure 6, indicating that the suggested HPS-GWO has a better and steady convergence curve as compared to PSO, GWO and SHADE-SF.

4.3. Case 3: Minimization of Total Generation Cost with Carbon Tax on Emission

In this case total generation cost was optimized, while a carbon tax of 20 $/ton was imposed on emission from TGs [26,27,28,29]. The statistical data obtained after simulation of 300 iterations for every optimization algorithm are shown in Table 5. The results presented in Table 5 clearly indicate that the proposed HPS-GWO offers effective and steady solutions in comparison to PSO, SHADE-SF and GWO algorithms. The convergence curves obtained for every optimization algorithm are presented in Figure 7. It has been noted that the emissions were reduced and power penetration from RES was increased after imposing a carbon tax on emission from TGs.

5. Conclusions

In this paper, a solution towards OPF integrated with RES such as SPV and WE sources is proposed. The HPS-GWO was applied to solve the OPF problem considering various system constraints. The stochastic nature of SPV and WE sources was modeled using lognormal and Weibull PDFs, respectively. A modified IEEE 30-bus test system was considered to verify the efficiency of the suggested HPS-GWO. The simulation results show that the proposed HPS-GWO achieved a minimum total generation cost as compared to PSO, GWO and SHADE-SF, and the HPS-GWO has a steady and fast convergence curve as compared to PSO, GWO and SHADE-SF algorithms. It was further concluded that the emissions were reduced by 0.00104 ton/h after imposing a carbon tax on emission from TGs, while penetration from SPV and WE sources increased. A solution to the OPF problem by combining the SPV, WE and hydro energy sources for other IEEE test systems is a potential subject of future research work.

Author Contributions

Conceptualization, M.R., A.H. and H.M.; methodology, M.R., A.H., H.M. and M.A.K.; software, M.R. and H.M.; validation, A.H. and H.M.; formal analysis, M.A.K. and K.A.; investigation, M.A.K. and K.A.; resources, Y.N.; data curation, B.-G.K. and Y.N.; writing—M.R. and M.A.K.; writing—review and editing, M.A.K. and B.-G.K.; visualization, Y.N. and B.-G.K.; supervision, H.M. and A.H.; project administration, M.A.K.; funding acquisition, Y.N. and B.-G.K. All authors have read and agreed to the published version of the manuscript.

Funding

This work was supported by the Soonchunhyang University Research Fund and University Innovation Support Project.

Institutional Review Board Statement

Not applicable.

Informed Consent Statement

Not applicable.

Data Availability Statement

Not applicable.

Conflicts of Interest

The authors declare no conflict of interest.

Nomenclature

Abbreviations
OPFOptimal power flow K Rs Reserve cost coefficient for SPV source
PSOParticle swarm optimization K Ps Penalty cost coefficient for SPV source
GWOGray wolf optimization K gw Direct cost coefficient for WE source
HPS-GWOHybrid particle swarm gray wolf optimizer K Rw Reserve cost coefficient for WE source
RESRenewable energy sources K Pw Penalty cost coefficient for WE source
PDFProbability density function f G ( s ) Probability of solar irradiance (W/m2)
p.u.Per unit f υ ( w ) Probability of wind speed(m/s)
SPVSolar photovoltaic σ Lognormal PDF standard deviation
WEWind energyµLognormal PDF mean
SymbolsGSolar irradiance in W/m2
P TG Thermal generator real power k Weibull PDF shape parameter
P WG Wind energy source real power c Weibull PDF scale parameter
P SPV Solar photovoltaic source real power P loss Power losses in the network
P sr Rated power output of SPV sourceV.DCumulative voltage deviation
P wr Rated power output of WE sourceCemiEmission cost
SHADESuccess history based adaptive differential
evolution
SFSuperiority of feasible solutions
K hs Direct cost coefficient for SPV source

References

  1. Rosales-Muñoz, A.A.; Grisales-Noreña, L.F.; Montano, J.; Montoya, O.D.; Perea-Moreno, A.J. Application of the Multiverse Optimization Method to Solve the Optimal Power Flow Problem in Direct Current Electrical Networks. Sustainability 2021, 13, 8703. [Google Scholar] [CrossRef]
  2. Shabbir, M.; Siddiqi, A.; Yapanto, L.; Tonkov, E.; Poltarykhin, A.; Pilyugina, A.; Petrov, A.; Foroughi, A.; Valiullina, D. Closed-Loop Supply Chain Design and Pricing in Competitive Conditions by Considering the Variable Value of Return Products Using the Whale Optimization Algorithm. Sustainability 2021, 13, 6663. [Google Scholar] [CrossRef]
  3. Khunkitti, S.; Siritaratiwat, A.; Premrudeepreechacharn, S. Multi-Objective Optimal Power Flow Problems Based on Slime Mould Algorithm. Sustainability 2021, 13, 7448. [Google Scholar] [CrossRef]
  4. Liao, Q.; Yang, J.; Zhou, Y. Sustainable Scheduling of an Automatic Pallet Changer System by Multi-Objective Evolutionary Algorithm with First Piece Inspection. Sustainability 2019, 11, 1498. [Google Scholar] [CrossRef] [Green Version]
  5. Barbato, A.; Capone, A. Optimization Models and Methods for Demand-Side Management of Residential Users: A Survey. Energies 2014, 7, 5787–5824. [Google Scholar] [CrossRef]
  6. Ngoko, B.O.; Sugihara, H.; Funaki, T. Optimal power flow considering line-conductor temperature limits under high penetration of intermittent renewable energy sources. Int. J. Electr. Power Energy Syst. 2018, 101, 255–267. [Google Scholar] [CrossRef]
  7. Morshed, M.J.; Ben Hmida, J.; Fekih, A. A probabilistic multi-objective approach for power flow optimization in hybrid wind-PV-PEV systems. Appl. Energy 2018, 211, 1136–1149. [Google Scholar] [CrossRef]
  8. Momoh, J.A.; El-Hawary, M.E.; Adapa, R. A review of selected optimal power flow literature to 1993. II. Newton, linear programming and interior point methods. IEEE Trans. Power Syst. 1999, 14, 105–111. [Google Scholar] [CrossRef]
  9. Momenitabar, M.; Mattson, J. A Multi-Objective Meta-Heuristic Approach to Improve the Bus Transit Network: A Case Study of Fargo-Moorhead Area. Sustainability 2021, 13, 10885. [Google Scholar] [CrossRef]
  10. Coskun, S.; Huang, C.; Zhang, F. Quadratic programming-based cooperative adaptive cruise control under uncertainty via receding horizon strategy. Trans. Inst. Meas. Control. 2021. [Google Scholar] [CrossRef]
  11. Alhumaid, Y.; Khan, K.; Alismail, F.; Khalid, M. Multi-Input Nonlinear Programming Based Deterministic Optimization Framework for Evaluating Microgrids with Optimal Renewable-Storage Energy Mix. Sustainability 2021, 13, 5878. [Google Scholar] [CrossRef]
  12. Carli, R.; Dotoli, M. Energy scheduling of a smart home under nonlinear pricing. In Proceedings of the 53rd IEEE Conference on Decision and Control, Los Angeles, CA, USA, 15–17 December 2014; pp. 5648–5653. [Google Scholar] [CrossRef]
  13. Biswas, P.P.; Suganthan, P.N.; Mallipeddi, R.; Amaratunga, G.A. Optimal power flow solutions using differential evolution algorithm integrated with effective constraint handling techniques. Eng. Appl. Artif. Intell. 2018, 68, 81–100. [Google Scholar] [CrossRef]
  14. El Ela, A.A.; Abido, M.; Spea, S. Optimal power flow using differential evolution algorithm. Electr. Power Syst. Res. 2010, 80, 878–885. [Google Scholar] [CrossRef]
  15. Taher, M.A.; Kamel, S.; Jurado, F.; Ebeed, M. An improved moth-flame optimization algorithm for solving optimal power flow problem. Int. Trans. Electr. Energy Syst. 2019, 29, e2743. [Google Scholar] [CrossRef]
  16. Osman, M.; Abo-Sinna, M.; Mousa, A.A. A solution to the optimal power flow using genetic algorithm. Appl. Math. Comput. 2004, 155, 391–405. [Google Scholar] [CrossRef]
  17. Sulaiman, M.H.; Mustaffa, Z.; Mohamad, A.J.; Saari, M.M.; Mohamed, M.R. Optimal power flow with stochastic solar power using barnacles mating optimizer. Int. Trans. Electr. Energy Syst. 2021, 31, e12858. [Google Scholar] [CrossRef]
  18. Abido, M.A. Optimal power flow using particle swarm optimization. Int. J. Electr. Power Energy Syst. 2002, 24, 563–571. [Google Scholar] [CrossRef]
  19. Elattar, E.E. Optimal Power Flow of a Power System Incorporating Stochastic Wind Power Based on Modified Moth Swarm Algorithm. IEEE Access 2019, 7, 89581–89593. [Google Scholar] [CrossRef]
  20. Dogra, R.; Gupta, N. Glowworm Swarm Optimization technique for optimal power flow. Adv. Electr. Electron. Eng. 2014, 4, 155–160. [Google Scholar]
  21. Duman, S.; Güvenç, U.; Sönmez, Y.; Yörükeren, N. Optimal power flow using gravitational search algorithm. Energy Convers. Manag. 2012, 59, 86–95. [Google Scholar] [CrossRef]
  22. Helmi, A.M.; Carli, R.; Dotoli, M.; Ramadan, H.S. Ramadan. Efficient and Sustainable Reconfiguration of Distribution Networks via Metaheuristic Optimization. IEEE Trans. Autom. Sci. Eng. 2021, 1–17. [Google Scholar] [CrossRef]
  23. Muhammad, M.A.; Mokhlis, H.; Naidu, K.; Amin, A.; Franco, J.F.; Othman, M. Distribution Network Planning Enhancement via Network Reconfiguration and DG Integration Using Dataset Approach and Water Cycle Algorithm. J. Mod. Power Syst. Clean Energy 2020, 8, 86–93. [Google Scholar] [CrossRef]
  24. Radosavljević, J.; Klimenta, D.; Jevtić, M.; Arsić, N. Optimal Power Flow Using a Hybrid Optimization Algorithm of Particle Swarm Optimization and Gravitational Search Algorithm. Electr. Power Compon. Syst. 2015, 43, 1958–1970. [Google Scholar] [CrossRef]
  25. Biswas, P.P.; Suganthan, P.; Amaratunga, G.A. Optimal power flow solutions incorporating stochastic wind and solar power. Energy Convers. Manag. 2017, 148, 1194–1207. [Google Scholar] [CrossRef]
  26. Reddy, S.S. Optimal power flow using hybrid differential evolution and harmony search algorithm. Int. J. Mach. Learn. Cybern. 2018, 10, 1077–1091. [Google Scholar] [CrossRef]
  27. Li, Y.; Wang, Y.; Li, B. A hybrid artificial bee colony assisted differential evolution algorithm for optimal reactive power flow. Int. J. Electr. Power Energy Syst. 2013, 52, 25–33. [Google Scholar] [CrossRef]
  28. Birogul, S. Hybrid Harris Hawk Optimization Based on Differential Evolution (HHODE) Algorithm for Optimal Power Flow Problem. IEEE Access 2019, 7, 184468–184488. [Google Scholar] [CrossRef]
  29. Yao, F.; Dong, Z.Y.; Meng, K.; Xu, Z.; Iu, H.H.-C.; Wong, K.P. Quantum-Inspired Particle Swarm Optimization for Power System Operations Considering Wind Power Uncertainty and Carbon Tax in Australia. IEEE Trans. Ind. Inform. 2012, 8, 880–888. [Google Scholar] [CrossRef]
Figure 1. Adopted IEEE 30-bus test case with modification.
Sustainability 13 13382 g001
Figure 2. Lognormal frequency distribution of SPV source.
Sustainability 13 13382 g002
Figure 3. Weibull frequency distribution of WT source.
Sustainability 13 13382 g003
Figure 4. SPV total cost vs. lognormal mean (µ).
Sustainability 13 13382 g004
Figure 5. WT total cost vs. Weibull scale parameter (c).
Sustainability 13 13382 g005
Figure 6. Convergence curve of HPS-GWO for OPF problem.
Sustainability 13 13382 g006
Figure 7. Case 3: Convergence curve of for OPF problem.
Sustainability 13 13382 g007
Table 1. Cost and emission coefficients of thermal generators.
Bus# P G min ( M W ) P G max ( M W ) abcdµΩeαβγ
15020002.000.00375180.00022.8570.0374.091−5.5546.490
2208001.750.0175160.00053.3330.0382.543−6.0475.638
8103503.250.00834120.0022.000.0455.326−3.5503.380
11103003.000.025130.000018.000.0424.258−5.0944.586
Table 2. Weibull parameters and cost coefficients for WT.
Bus #Pwr (MW)Scale Factor (c)Shape Factor (k)Weibull MeanDirect Cost Coeff.Reserve Cost Coeff.Penalty Cost Coeff.
57592V = 7.976 m/sKgw,5 = 1.6KRw,5 = 3KPw,5 = 1.5
Table 3. Lognormal parameters and cost coefficients for SPV source.
Bus #Psr (MW)Mean (µ)Standard Deviation (σ)Lognormal MeanCoefficient for Direct CostCoefficient for Reserve CostCoefficient for Penalty Cost
13505.80.6G = 483 W/m2Khs,13 = 1.6KRs,13 = 3KPsw,13 = 1.5
Table 4. Case 2 simulation results.
ParametersLower LimitUpper LimitPSOGWOHPS-GWOSHADE-SF
Swing GeneratorPTG1(MW)50140134.908135.661135.112124.156
Control VariablesPTG2(MW)208043.54641.02942.64534.883
PWT5(MW)07550.84551.00149.77946.985
PTG8(MW)103510.00010.61010.00010.000
PTG11(MW)103010.00010.09410.02530.000
PSPV13(MW)05040.08541.36142.01842.830
V1(p.u.)0.951.101.1001.1001.1001.070
V2(p.u.)0.951.101.9011.0891.0911.056
V5(p.u.)0.951.101.0711.0741.0711.035
V8(p.u.)0.951.101.0961.1001.0971.097
V11(p.u)0.951.101.1001.0941.1001.100
V13(p.u.)0.951.101.1001.0951.0921.053
Generator Reactive PowerQTG1(MVAr)−20150−12.332−13.435−6.721−3.397
QTG2(MVAr)−206018.23027.1844.77310.439
QWT5(MVAr)−303524.61118.84135.00021.969
QTG8(MVAr)−154040.00040.00040.00040.000
QTG11(MVAr)−105018.46417.99817.86230.000
QSPV13(MVAr)−202523.68922.14422.23516.357
Objective FunctionsGen. cost ($/h)--796.556796.254796.164797.324
Emission (ton/h)--0.195920.197030.196280.924
Ploss (MW)--5.98455.98415.98325.453
Table 5. Case 3 simulation results.
ParametersLower LimitUpper LimitPSOGWOHPS-GWOSHADE-SF
Swing GeneratorPTG1(MW)50140134.908135.119134.400125.123
Control VariablesPTG2(MW)208042.56440.83042.20538.093
PWE5(MW)07550.56651.44251.21148.562
PTG8(MW)103510.00010.16610.29410.000
PTG11(MW)103010.00010.00010.02030.000
PSPV13(MW)05041.34141.96940.52537.094
V1(p.u.)0.951.101.1001.1001.1001.071
V2(p.u.)0.951.101.0901.0891.0911.057
V5(p.u.)0.951.101.0711.0711.0741.036
V8(p.u.)0.951.101.0991.0921.0891.085
V11(p.u)0.951.101.1001.0981.1001.100
V13(p.u.)0.951.101.1001.1001.1001.051
Generator Reactive PowerQTG1(MVAr)−20150−12.297−13.141−17.772−3.151
QTG2(MVAr)−206018.11414.72937.80310.776
QWE5(MVAr)−303524.62627.5889.71521.943
QTG8(MVAr)−154040.00040.00040.00040.000
QTG11(MVAr)−105018.44318.90218.83530.000
QSPV13(MVAr)−202523.76125.00024.05215.664
Objective functionsGen. cost ($/h)--800.6517800.8232800.5614801.320
Emission (ton/h)--0.195970.196340.195240.997
Ploss (MW)--5.97876.00135.94365.471
Publisher’s Note: MDPI stays neutral with regard to jurisdictional claims in published maps and institutional affiliations.

