Article

Digital Health and Care Study on Elderly Monitoring

by
Maksym Gaiduk
1,2,*,
Ralf Seepold
1,3,
Natividad Martínez Madrid
3,4,* and
Juan Antonio Ortega
2
1
Ubiquitous Computing Laboratory, HTWG Konstanz, 78462 Konstanz, Germany
2
Computer Science Department, University of Seville, 41012 Seville, Spain
3
Institute of Digital Medicine, I.M. Sechenov First Moscow State Medical University, 119435 Moscow, Russia
4
School of Informatics, Reutlingen University, 72762 Reutlingen, Germany
*
Authors to whom correspondence should be addressed.
Sustainability 2021, 13(23), 13376; https://doi.org/10.3390/su132313376
Submission received: 14 October 2021 / Revised: 13 November 2021 / Accepted: 24 November 2021 / Published: 2 December 2021
(This article belongs to the Special Issue Sustainable Technology and Elderly Life)

Abstract

:
Sustainable technologies are being increasingly used in various areas of human life. While they have a multitude of benefits, they are especially useful in health monitoring, especially for certain groups of people, such as the elderly. However, there are still several issues that need to be addressed before its use becomes widespread. This work aims to clarify the aspects that are of great importance for increasing the acceptance of the use of this type of technology in the elderly. In addition, we aim to clarify whether the technologies that are already available are able to ensure acceptable accuracy and whether they could replace some of the manual approaches that are currently being used. A two-week study with people 65 years of age and over was conducted to address the questions posed here, and the results were evaluated. It was demonstrated that simplicity of use and automatic functioning play a crucial role. It was also concluded that technology cannot yet completely replace traditional methods such as questionnaires in some areas. Although the technologies that were tested were classified as being “easy to use”, the elderly population in the current study indicated that they were not sure that they would use these technologies regularly in the long term because the added value is not always clear, among other issues. Therefore, awareness-raising must take place in parallel with the development of technologies and services.

1. Introduction

According to the United Nations, technologies are one of the enablers of achieving sustainability objectives around the world [1]. Concerning the health monitoring of the elderly, new technologies can provide new ways to improve the quality of life for these people without worsening conditions for future generations, which is the goal of sustainable development. In recent years, there has been a steady evolution of home health systems, with a concurrent increase in understanding that sustainability is essential for the development of new systems [2]. Among the reasons for this is that they are able to provide several benefits to different user groups. For example, home health technologies could be used in rural areas where traditional healthcare providers are more challenging to reach. This could lead to decreasing the necessity of travelling to hospitals/family doctors, resulting in resources being saved. These types of technology could be especially beneficial for the older generation. As a result, they could serve to increase the quality of life of this population [3] and could also simultaneously reduce inequality, which is one of the goals stated by the United Nations [1].
Furthermore, home health technologies could be used, for example, to continuously monitor the health conditions of older people in their home environment [4]. This could result in people staying in their own homes longer rather than moving to an assisted environment, as described in reference [5]. According to the United Nations, this would help to overcome economic and social challenges, which is also one of the sustainable development goals set by the United Nations [1].
The topic of sustainable technologies for the elderly has seen significant developments in recent years, as described in reference [6]. In that study, scientific publications in this domain were analysed, and the conclusion that was drawn indicated that technologies for the elderly can, among other things, improve connections with society and health professionals but could also enable the early detection of health problems and could enhance wellbeing.
Another paper [7] describes digital services in relation to the sustainability of elder care. It also concludes that technologies can provide many benefits if used appropriately. However, it is not always necessary to develop and use new technologies because older technologies can be used in new and innovative ways in certain cases.
There are already numerous devices on the market that can be used to measure various biomedical or health-related signals and values in patients, including, for example, heart signals, blood oxygen saturation, respiration, muscle movement, temperature, falls, and sleep patterns [8,9]. To date, these devices and their associated applications have only been used to a limited extent for various reasons. In practice, it is apparent that assistive technologies face a multitude of barriers [10]. They usually only offer isolated solutions: each device often has its own app and data collection method. There is great potential for these technologies if they choose to use integrated data (fusion of data), which is hardly the case at present.
However, the barriers to these types of applications are not only technological or business-related. Two other aspects play a significant role: first, the user has to consider about data protection: how are the data transmitted and stored? Specifically, how are they stored and used in the data centre (in the “cloud” of the service providers)? How can privacy be protected through anonymization or pseudonymization, if necessary, but how can they also serve the advancement of science? Particularly, these questions represent a major cross-border challenge, as they are heavily dependent on national legislation.
On the other hand, current devices and systems do not always consider the aspects of user-friendliness sufficiently (both in terms of usability and user experience) [11,12,13,14,15,16]. These systems need an intuitive concept of use, often not only for the patient but also for his or her social environment or (informal) caregivers, patient groups, or other social groups. This is organized and perceived differently in different countries and therefore represents a further challenge. The accessibility of technologies is another significant point to consider [17].
Numerous scientific publications have dealt with the topic of the technology acceptance model to answer the question of which aspects of implementation and use lead to an increase in acceptance [18,19]. The results of this research should provide a scientific basis for planning how certain technologies are used.
The presented work focuses on a conceptual home health system that emphasizes certain health domains that can be implemented with AAL approaches. Stress and sleep are the baseline health phenomena for the analysis of technologies. The choice of areas is not arbitrary and is justified by their relevance. Stress is perceived as an extreme burden by up to 30% of the population; it leads to serious chronic diseases or is prevalent in many cases [20]. It is known that a large proportion of sleep disorders is related to stress, some of which are already chronic, and only 35% of US citizens describe their sleep quality as being “good”, while 22% describe it as “moderate”, and 12% describe it as “poor” [21]. Furthermore, obstructive sleep apnoea is believed to affect approximately 936 million people between the ages 30–69 years old worldwide, according to an AHI criterion of five or more apnoea events per hour and the AASM criteria [22]. Many sleep disorders, such as sleep apnoea, could be detected with a home sleep monitoring system, allowing early therapy and ultimately enhancing health and quality of life [23,24]. Other sleep disorders, particularly in the elderly, are increasingly recognized as essential challenges, and methods for overcoming these problems are being investigated [25]. To improve personal well-being, various rehabilitation techniques could be used preventively or therapeutically. The effect of rehabilitation could, in turn, provide indirect or, in some cases, direct feedback through the measurement of stress and sleep parameters [26].
The importance of the selected topics is also confirmed by the presence of other publications such as [27], where systems that are not only able to monitor stress and sleep but that are also able help users in the struggle against stress and poor sleep quality are described. In this work, the system design is described in detail, and an evaluation is performed with eight subjects, the results of which demonstrated positive feedback from the users as far as the system’s usability is concerned.
To be successful and user friendly, sustainable health services should be universal and should accompany the patient or user through the entire cycle: counselling, planning, implementation, operation, and support. People are in charge of providing such services, and AAL technologies support and offer those services. Fairness, non-discrimination, and user acceptance strongly influence the sustainability of solutions, but cost-effective implementation and pricing models and transparency also play an important role [28].
The main objective of the present work is to find out which aspects play an important role in the development of health monitoring systems for the elderly to enable their sustainable use as well as the simultaneous increase of user acceptance. To facilitate 24 h monitoring, two types of devices were selected for assessment: one that can be placed in the bed to monitor vital signs during the night, and another that is worn on the arm to measure heartbeats during the day. General and as well as device-specific recommendations should also be drawn up as best they can. Another important research question to be clarified is whether existing home health technologies (objective measurement) can ensure a sufficient level of accuracy in the recording and analysis of health parameters compared to the sleep medicine questionnaires (subjective measurement) that are commonly used in multiple areas in measuring, for example, sleep quality. Another objective is to investigate whether older people are in favour of the use of sustainable technologies if the relevant aspects are taken into account during their implementation.

2. Materials and Methods

Because the objectives of this work can best be achieved through an evaluation of practical implementation, conducting a field study with a subsequent analysis of the results was chosen as the primary approach. In the following subsections, the general study design is first presented in detail, followed by an explicit description of the methods used to address study queries. It is important to mention that the presented domain “Sleep” was analysed both quantitatively and qualitatively, whereas the domain “Stress” was included exclusively in the qualitative measurement. For this purpose, a device was used that represents, by example, the group of devices for cardiac activity measurement that can also be used for stress measurement after the appropriate analysis, which is explained in more detail in the last subsection of the “Materials and Methods” section. However, direct stress measurement was not carried out in the context of the described study. This has led to differences in the level of detail in the description of these two areas.

2.1. Study Design

Since a specific target group was identified for the study, the following inclusion criteria were elaborated for application in the selection of study participants:
  • Age over 65 years old.
  • Most of the household work is completed independently.
  • In addition, the following exclusion criteria were considered:
  • Unable to perform leg training seated with an exercise trainer for about 20 min for a maximum of 10 days over a two-week period.
  • Unable to stand up, walk 3 m, walk back 3 m, and sit down again without the active assistance of another person.
  • Unable to understand and complete paper format questionnaires.
  • Advanced dementia.
A group of 10 individuals (five men and five women) participated in the study. One of them lived in a residential community for older adults, and nine others lived in their own homes. The mean age of the participants was 72.5 years age, with a standard deviation (SD) of 6.2. The mean weight of the study participants was 80.8 kg (SD = 12.6), while the mean height was 167.6 cm (SD = 7.9).
To the best of our knowledge, the study participants did not have severe acute illnesses. They received all of the study information in advance (for example, a detailed description of the procedure, study objectives), and participation was voluntary and could be terminated at any time without giving a reason. All of the study participants received a written consent form, and the participants read and signed a data protection form after the study organizers had answered any remaining questions. The study procedure, including study information and consent forms, was reviewed by ethics officers from the HTWG Konstanz and the University of Applied Sciences Kempten, Germany.
The expected duration of the study was 14 days. On the first day, the study organizers installed and explained all of the necessary technical solutions in the participants’ homes:
  • The sleep monitoring device was placed under the mattress across the bed. According to the device’s instruction manual, its position should be approximately below the chest area, as described in reference [29].
  • The device for monitoring the heartbeat was put on the arm of the test person, and the organizers explained how to use and charge it.
  • A third hardware element was installed at the subjects’ homes to ensure that the used devices had proper Internet connectivity through an access point with an Internet-capable sim card. Therefore, the system was able to function autonomously and was not dependent on the Wi-Fi network of the test subjects.
Furthermore, interviews with general questions (age, sex, height, weight, and health status) were also conducted on the first day of the study. Any possible questions about the study procedure or the use of the equipment were also answered. To conduct the study as realistically as possible, the subjects were asked to continue with their regular daily routine and to contact the organizers only if they had any questions or problems. The questionnaires to be completed every day were explained and given to the subjects:
  • Sleep diary.
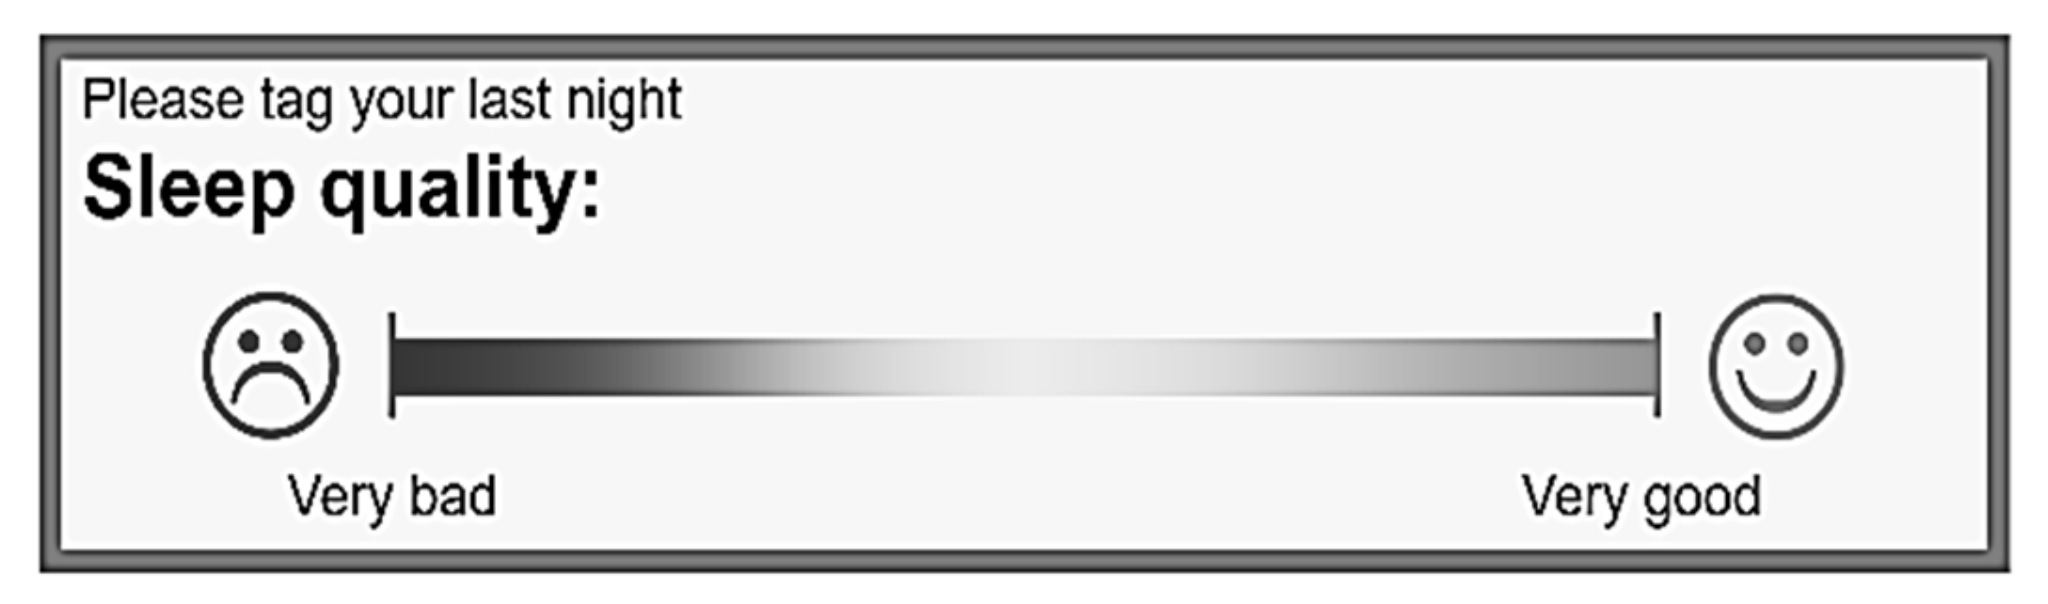
  • Graphical questionnaire on sleep quality.
The participants used the devices for 14 days. During this time, they were visited every 3–4 days by one of the study organizers (public welfare AWO staff) to check if everything was going well or if there were any problems or questions.
On the last (15th) day of the study, the study organizers collected the technical solutions, and the final questionnaires were filled out together with the participants in the form of an interview:
  • Pittsburgh Sleep Quality Index.
  • Questionnaire to assess the acceptance of the technologies used, including free-form comments.
All the devices and questionnaires mentioned above are presented in detail in the following sections.

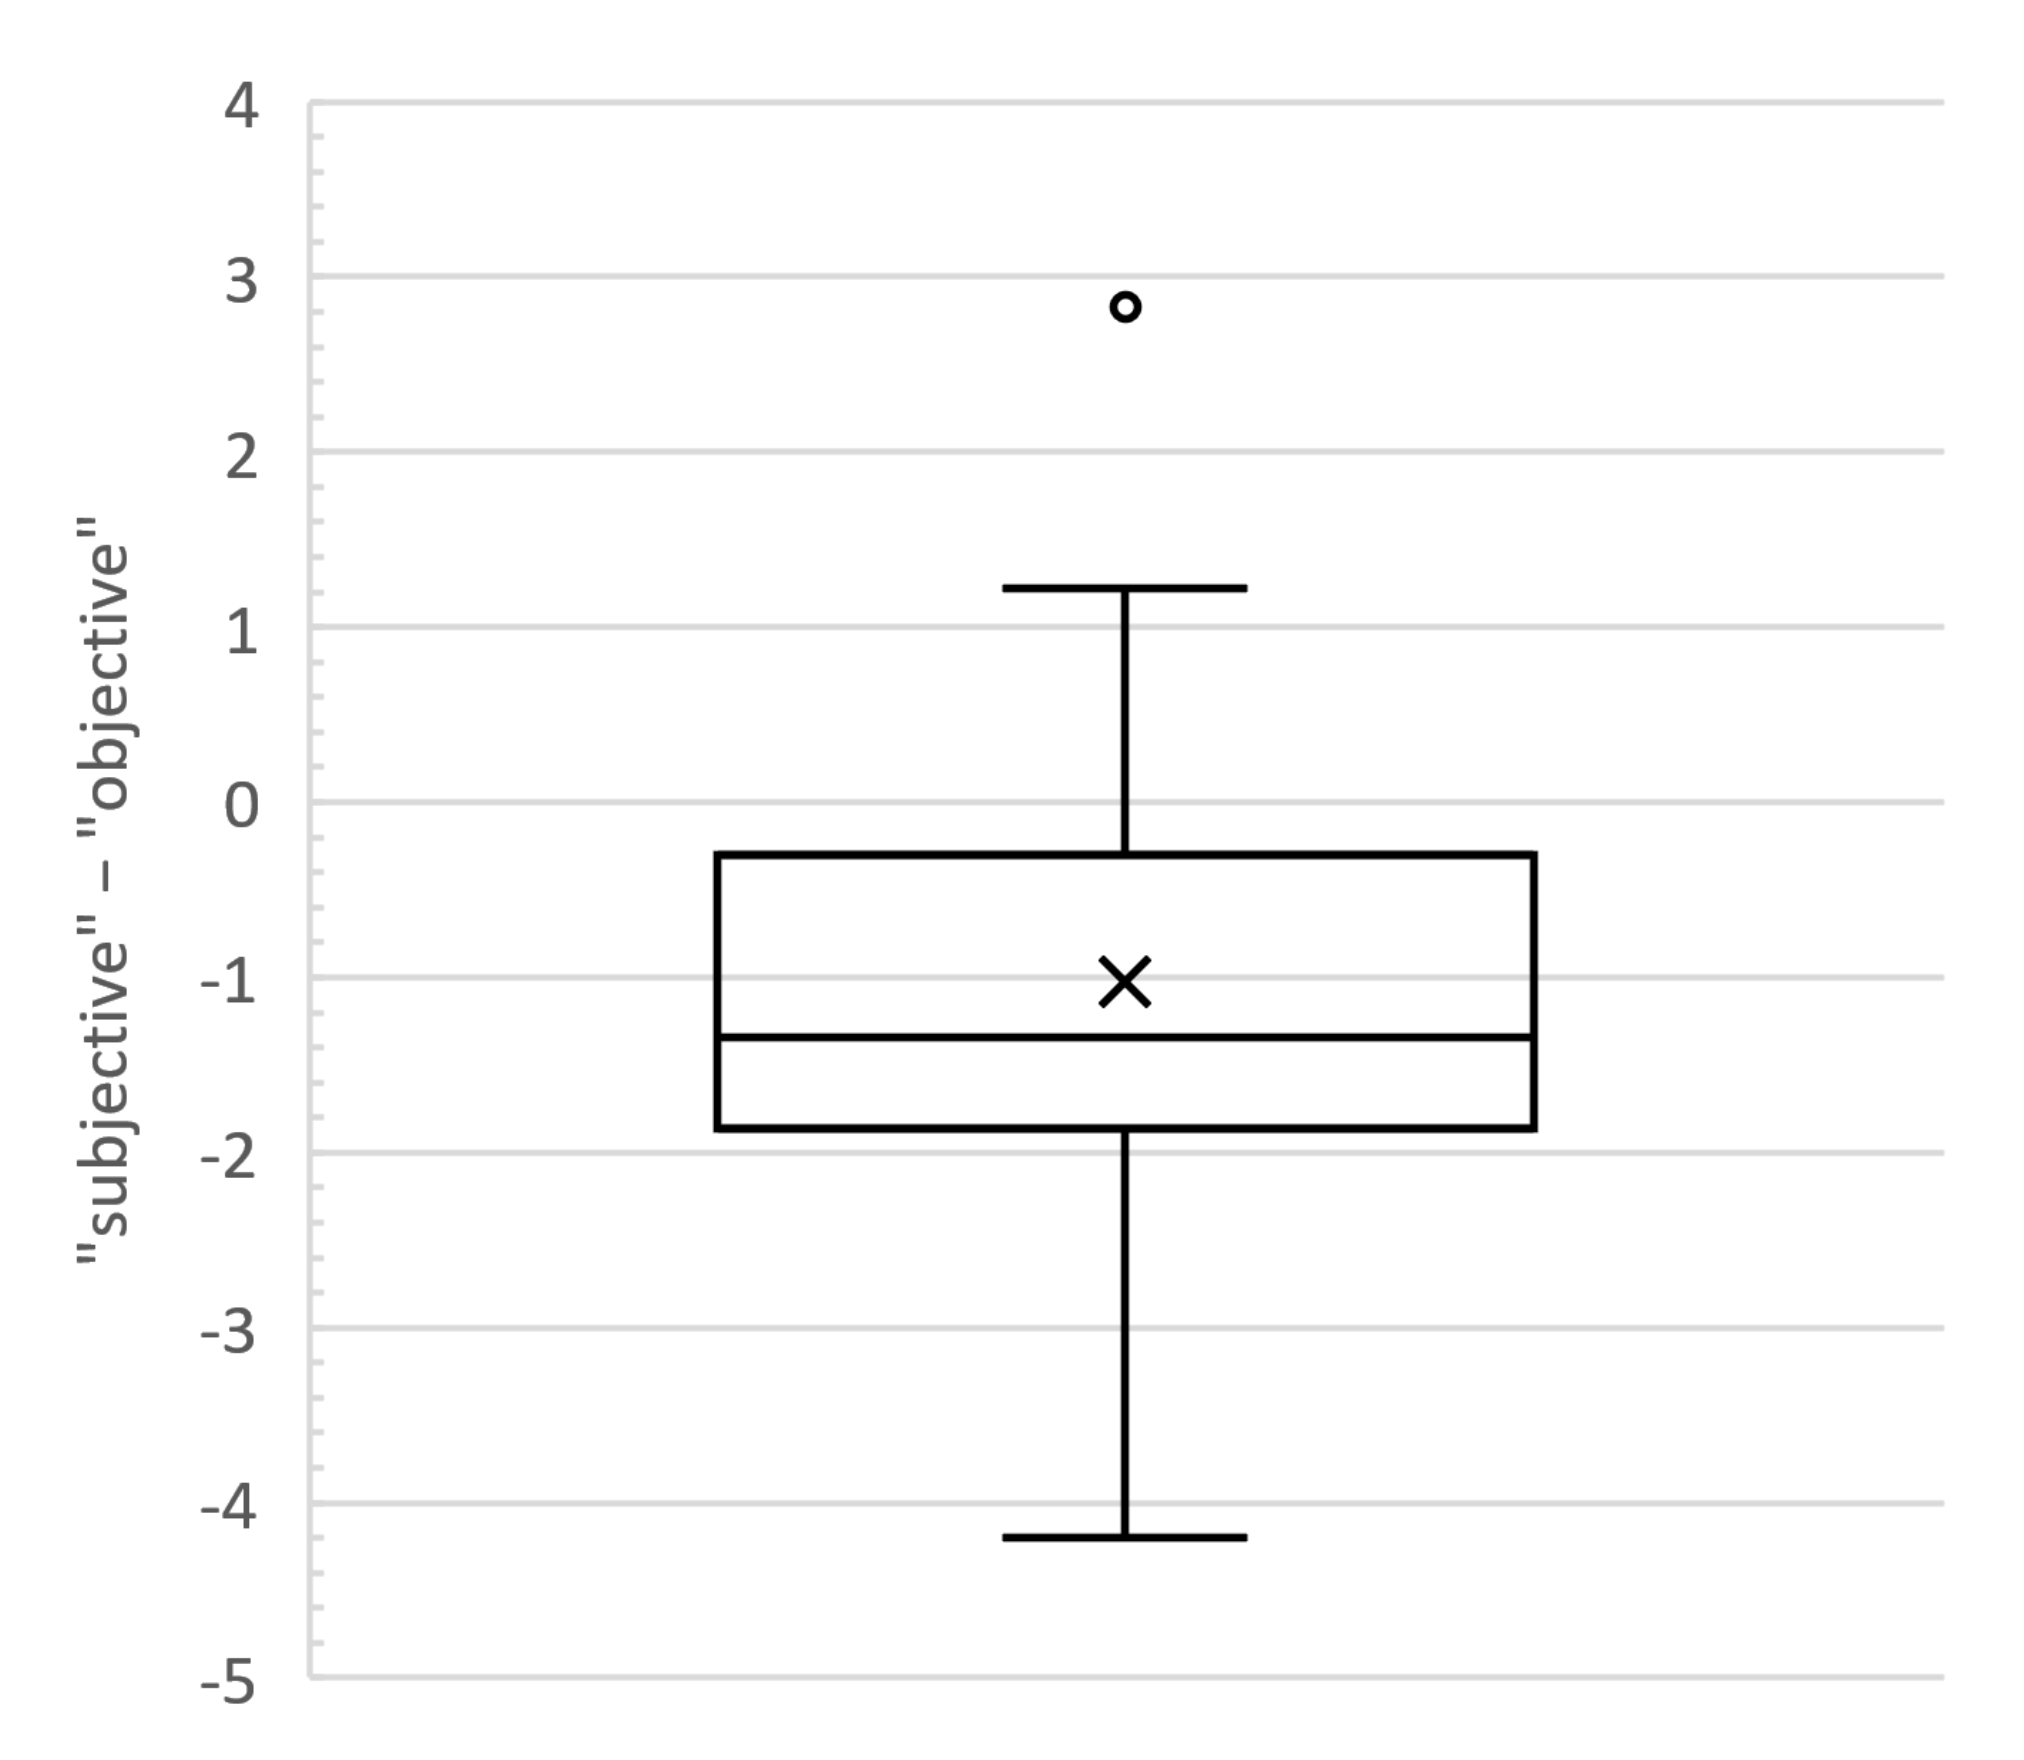
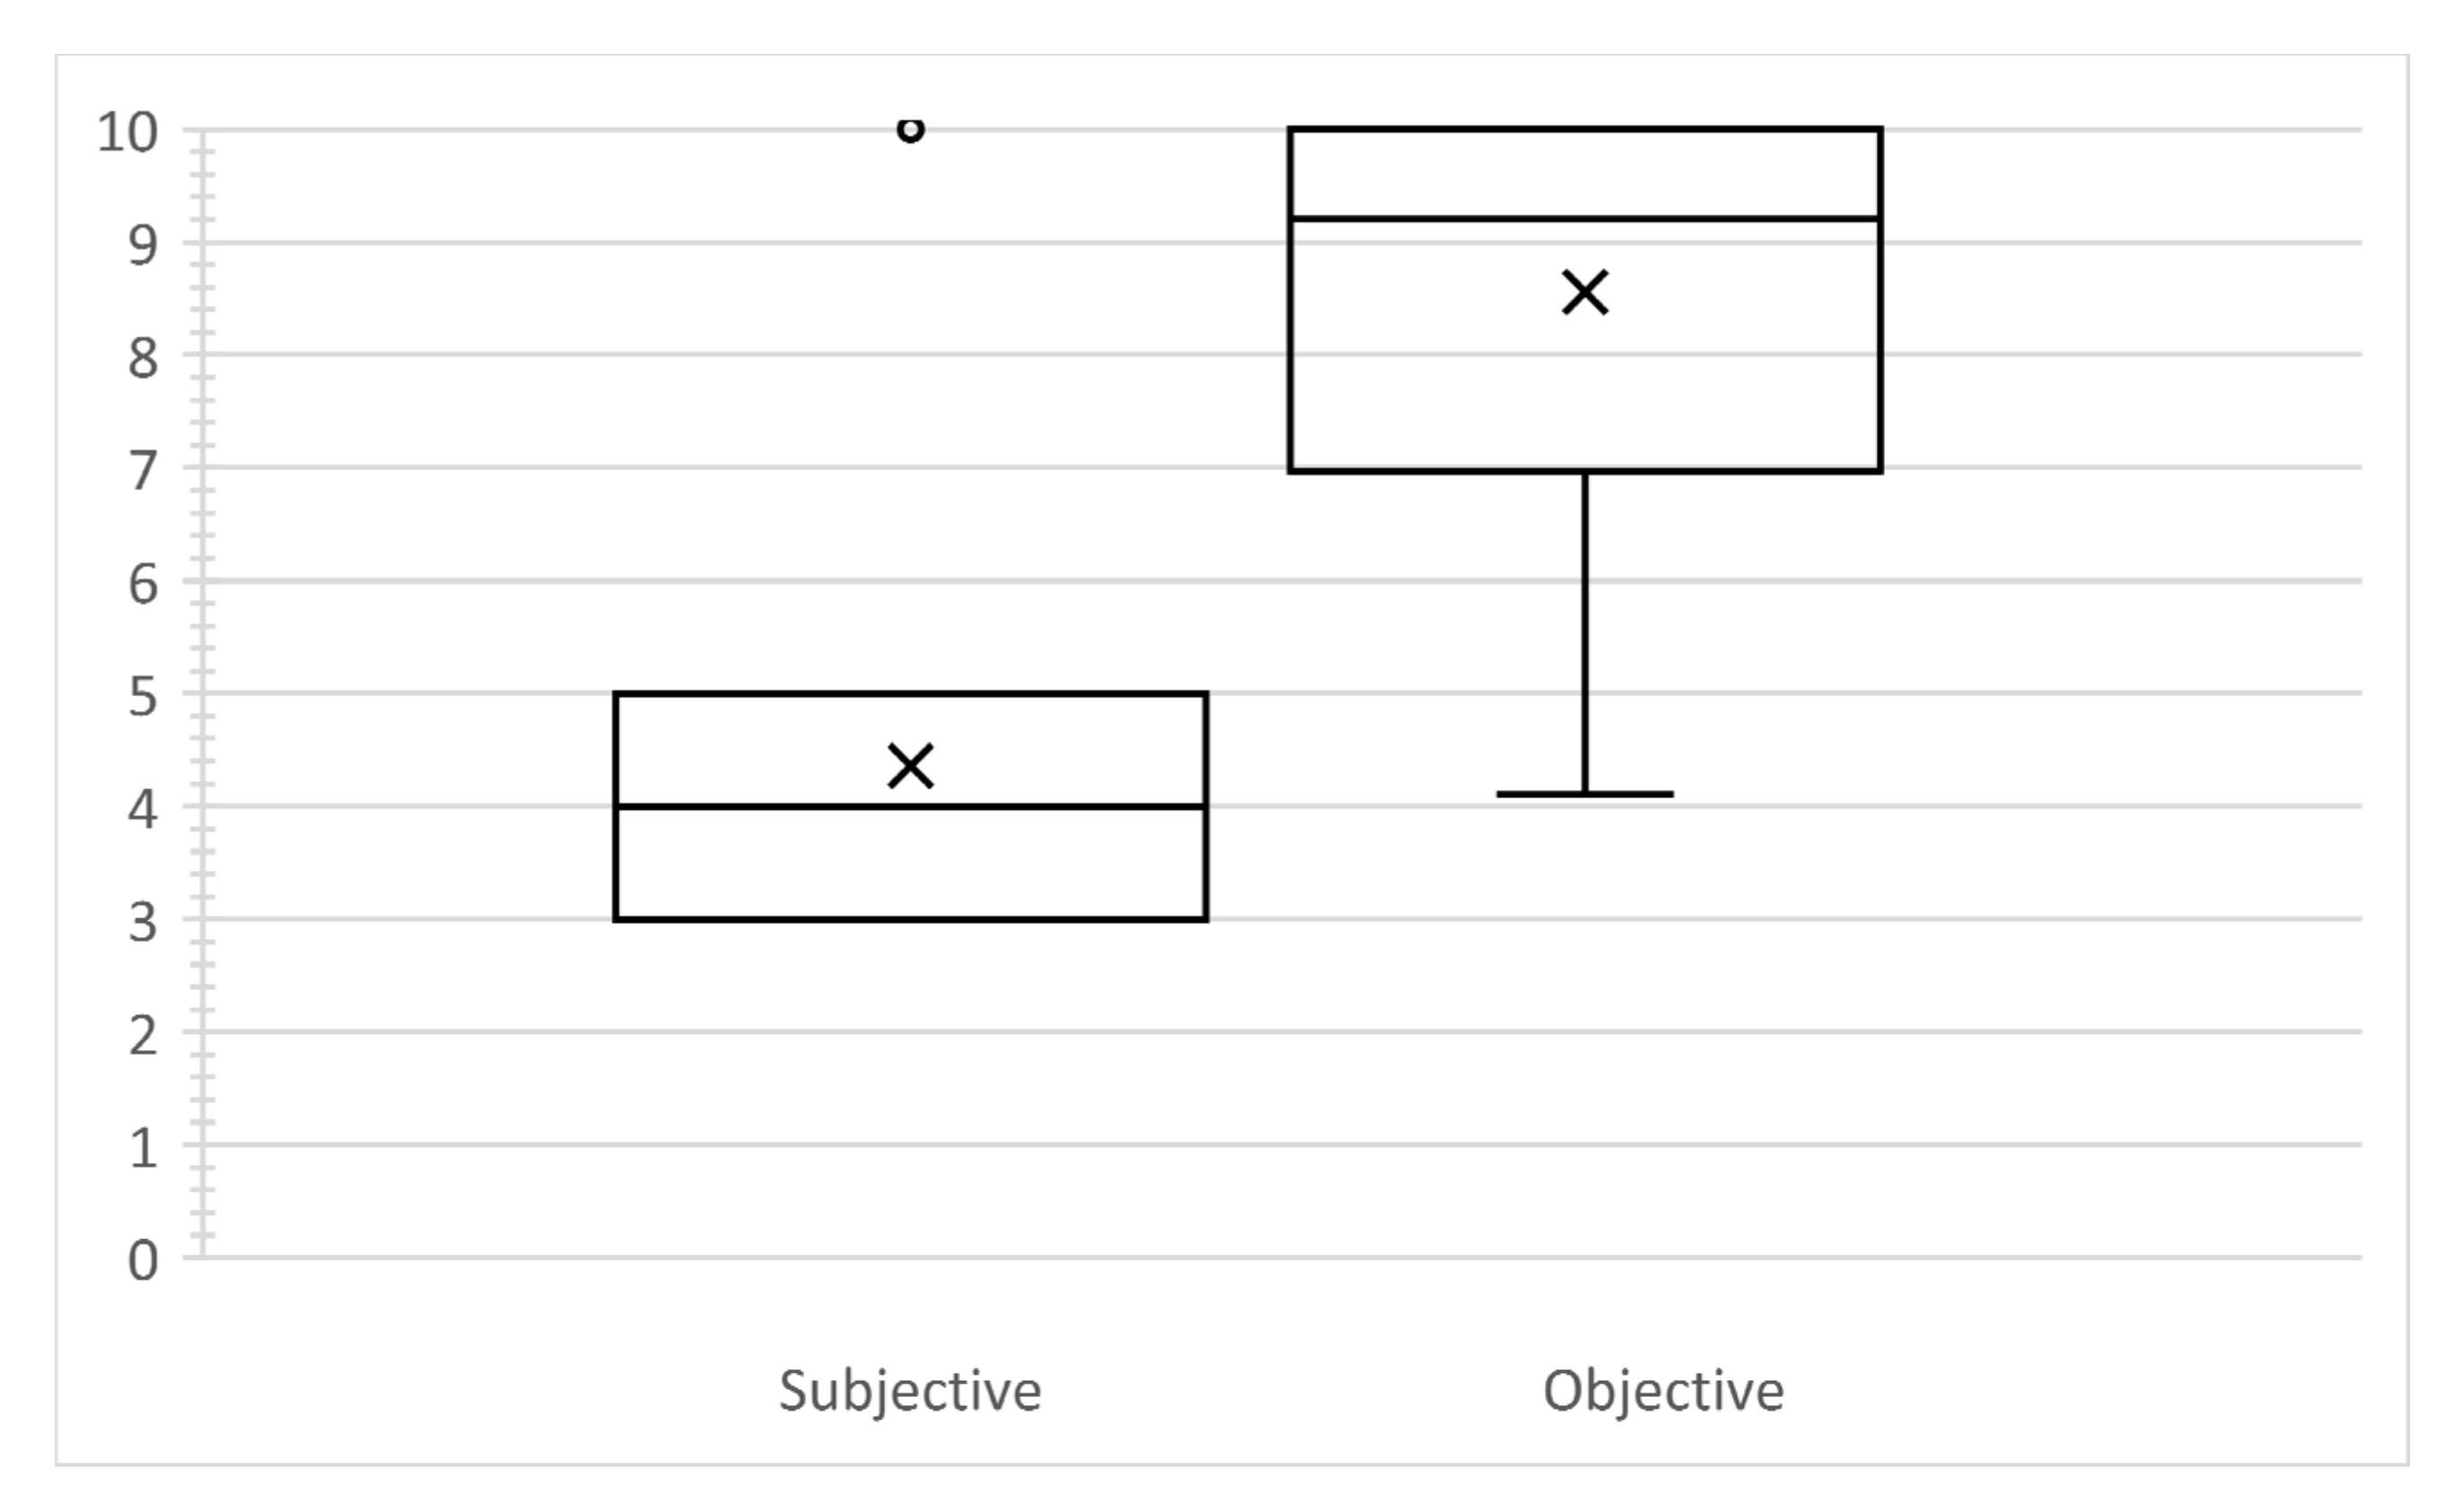
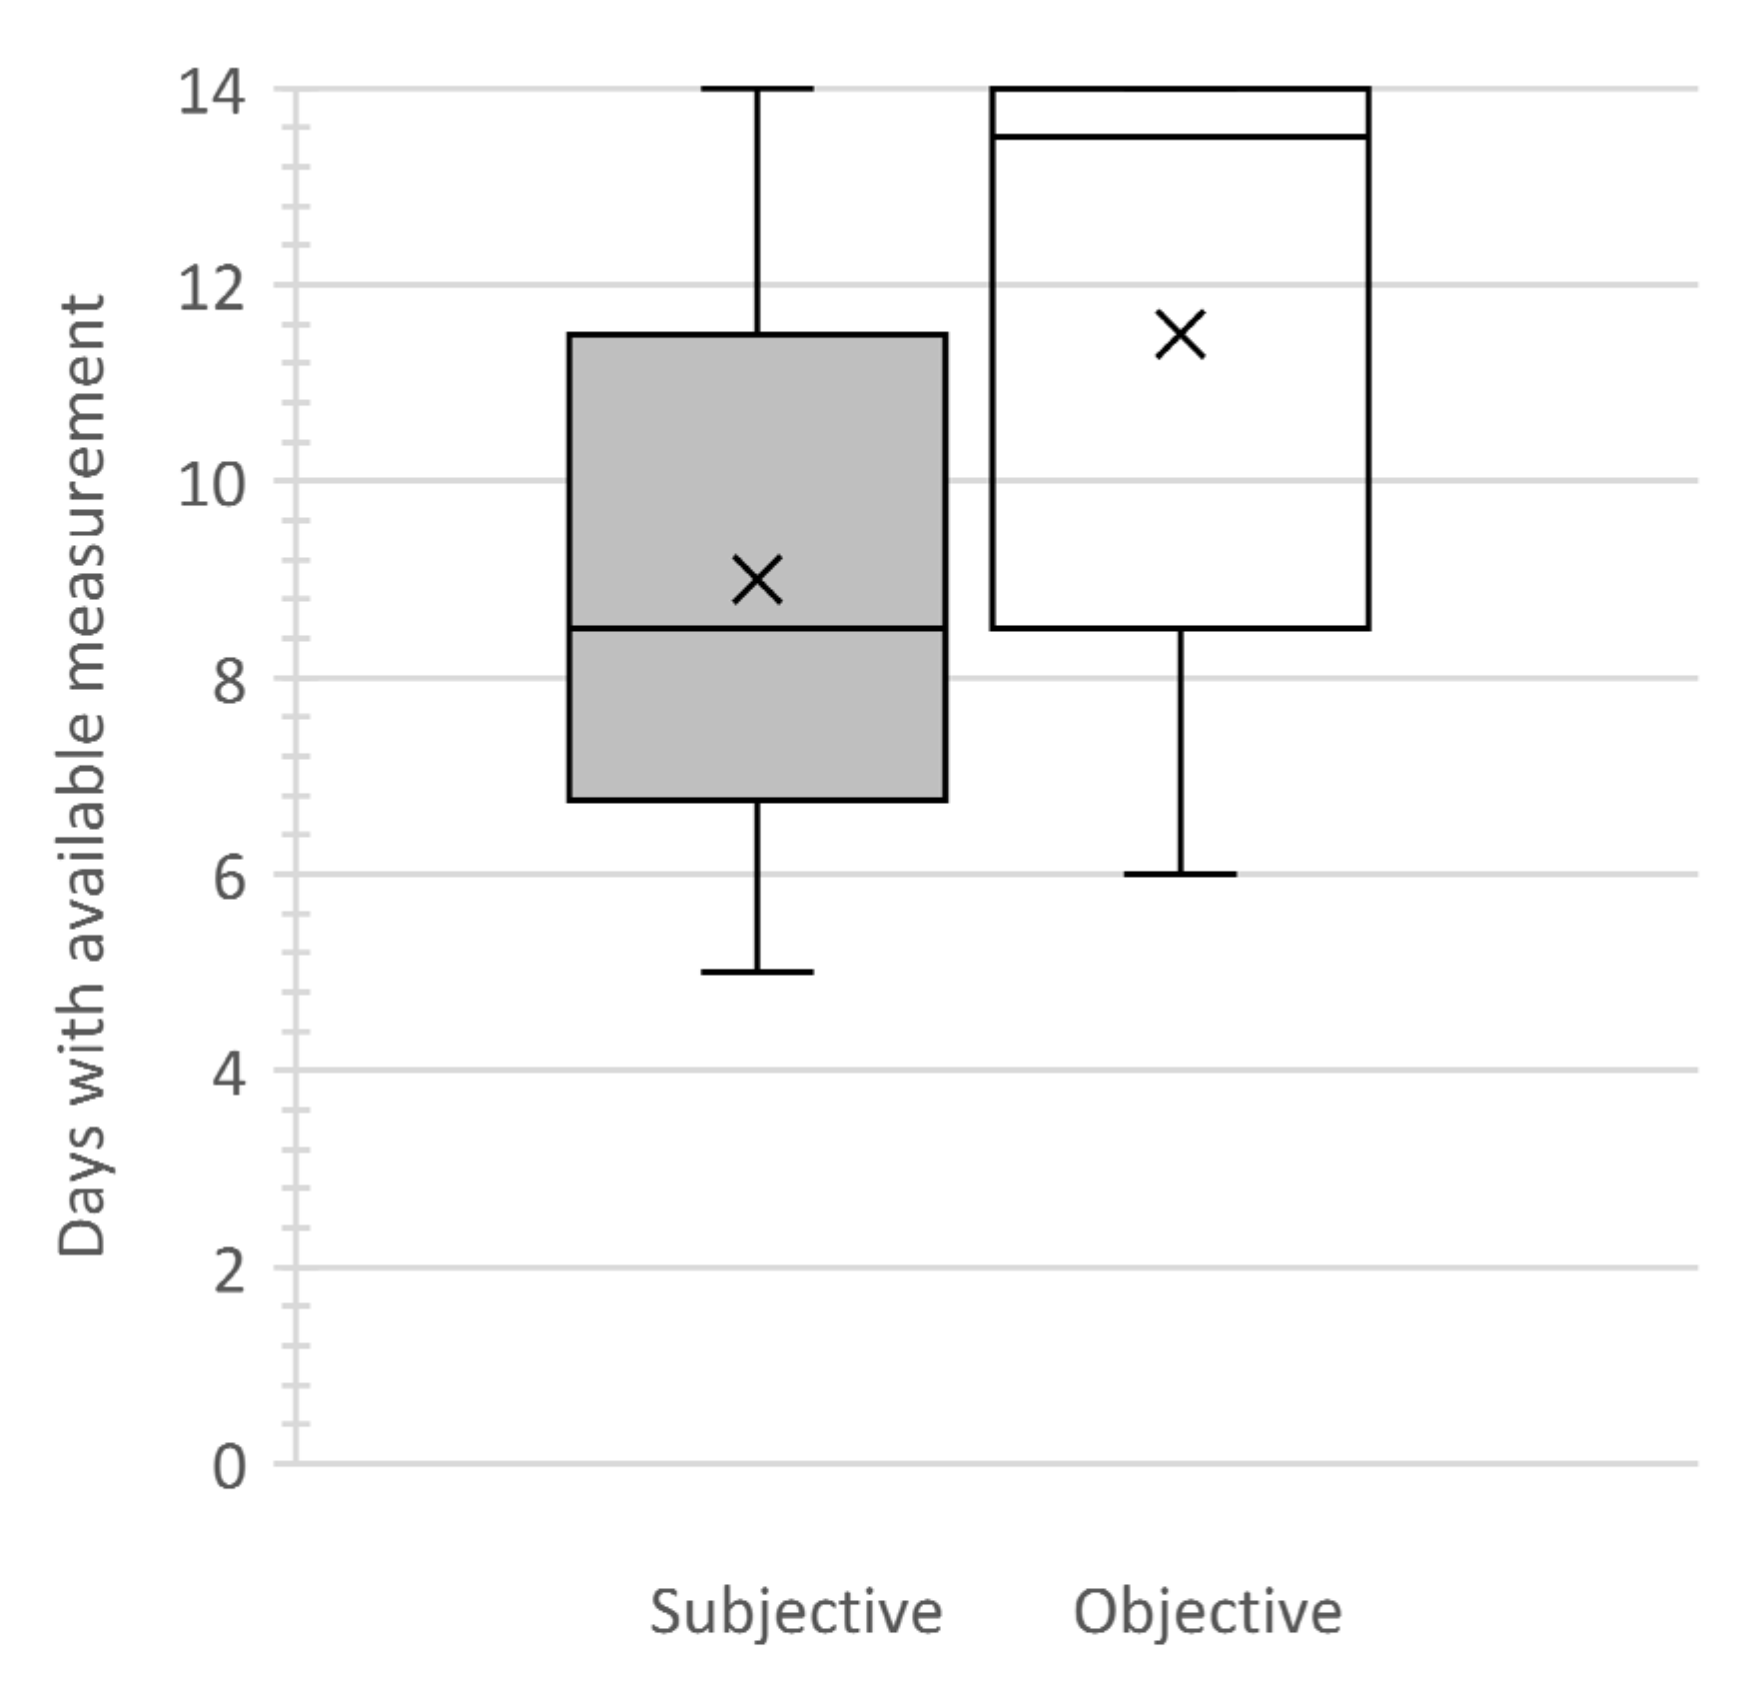
2.2. Subjective and Objective Measurement Using Home-Health Technologies

As mentioned above, one of the study’s objectives was to determine whether existing technologies can guarantee results that are sufficiently accurate compared to health-related questionnaires. For this purpose, sleep analysis was selected as an essential health field that can also be monitored in a home environment [30]. There are two significant types of measurement for sleep-related data: objective and subjective [31]. In the case of subjective measurement, the person’s perception is measured. Typically, different questionnaires or sleep diaries are used for this purpose [32]. In objective measurement, health-related values are measured with the appropriate sensors [33].
In sleep medicine, subjective measurement is often used to measure some parameters, such as sleep quality in the detection and treatment of insomnia [34]. Therefore, it was essential to determine whether an objective measurement was able to provide results that were comparable to subjective measurement. For this purpose, we compared the two types of measurement over two weeks [31]. We asked the test subjects to fill out a daily questionnaire determining their sleep quality for subjective measurement. For this, we prepared a graphical representation of sleep quality, as shown in Figure 1 [31]. Subjects were asked to mark the spot on the graph that best corresponded to their perceived sleep quality each morning. After collecting the completed questionnaires, the graph was divided into ten sections, and a number between 1 and 10 corresponding to sleep quality was derived.
The technology that was used to measure objective sleep quality was the EmFit QS+ system [35]. This device has been described and evaluated in several scientific publications [36,37]. It uses a ballistocardiography approach and can measure several sleep-related parameters (such as heart rate, respiratory rate, sleep quality, and identification of sleep stages). One of the important points that was considered when selecting the technology was the possibility of automatic functioning without the need for user action. The following formula, Formula (1), which proposed by the EmFit company and evaluated in several scientific publications, was used to calculate sleep quality [31,35,36,37]:
S l e e p   Q u a l i t y   =   [ ( t o t a l   s l e e p   d u r a t i o n   +   ( d u r a t i o n   o f   R E M     0.5 )   +   ( d u r a t i o n   o f   D e e p S l e e p     1.5 ) 8.5     ( 0.5     a w a k e   d u r a t i o n   /   3600 + n u m b e r   o f   a w a k e n i n g s   /   15 ) ] / 10
The result is a value between 0.1 and 10, which can be directly compared to the subjective measurement of sleep quality described above. We conducted and finally evaluated the recordings with the selected device for the two weeks of the study, which is described in detail in the “Results” section. Any other system that provides a measurement of sleep duration [38] and sleep stages [39] could be used instead of the device used to calculate objective sleep quality.
The use of technologies for the subjective measurement of health-related parameters is also possible. For this purpose, technologies (for example, smartphones, smart watches, or tablets) can be used to fill in the questionnaires [40,41]. This can bring advantages in achieving direct and automatic data transmission and evaluation because of the electronic form of the data collected from the first moment. However, this approach was out of the scope of the study performed and could be considered in future work.
We selected sleep analysis as an example field of home health technologies for the study. To address whether this field is relevant for determining health status, we decided to use a recognized method for determining sleep quality. This would allow us to determine if there is an underdiagnosis of sleep-related disorders that could be overcome with the broad approach of sustainable technologies. Our method of choice was the Pittsburgh Sleep Quality Index (PSQI) [42]. It is commonly used for the assessment of sleep quality in sleep disorders, especially insomnia. This is a recognized questionnaire in professional circles and has undergone multiple evaluations [43,44]. We used a German version of the questionnaire proposed by reference [45].
Standardization in the true sense does not exist for the PSQI. PSQI classification results from the cut-off value of 5; it was calculated in the original work [42] based on the classification of people with sleep disorders and healthy individuals. A total of 18 items are used for quantitative evaluation. They were assigned to seven components, each assuming a value range from 0 to 3. The total score results from the summation of the component scores and can range from 0 to 21. A higher score corresponds to a lower quality of sleep. There is an empirically determined cut-off value (of 5) that allows a division into “good” and “bad” sleepers. A representative study for the German-speaking area [46] surveyed 1049 participants. Here, a proportion of 32.1% of the participants had a PSQI total score > 5. This survey might be used to compare the findings within our study.

2.3. Acceptance of Technologies by the Elderly

Since the acceptance of technologies plays an essential role in their widespread use, this aspect was addressed in the study. Based on the literature review, several points were selected to be considered during the implementation period in order to enable an evaluation afterward:
  • The technologies should be self-explanatory and should not require extensive training.
  • The devices should function automatically as much as possible;
  • The devices should be comfortable and safe to use.
To allow a comprehensive analysis, the following methods were selected:
  • Surveying with a questionnaire.
  • Free conversations with test participants to receive unstructured feedback.
  • Systematic analysis of occurrences and irregularities during the study.
In preparing the questionnaire, an emphasis was placed on ease of use, safety during use, and readiness and suitability of the technologies for regular use. It was also planned to analyse whether there were any difficulties with the use of the devices and the reasons for those difficulties. For this purpose, in addition to answering the standardised questions, the test subjects were asked to provide a free comment (related to the respective device) in case of irregularities/problems with one of the devices being used. Questions were asked during the visits that took place over the 14 days and on the last day, together with the final questionnaire.
To evaluate the acceptance of technologies for different health-related concerns, the system was used that not only included the EmFit QS+ sleep analysis device described above but also included the Polar OH1 heart rate monitor. This kind of device (photoplethysmography based on PPG) can be applied to measure stress levels, which was not performed as part of the presented study. Currently, heart rate variability is often used to detect stress [47,48]. However, existing studies have shown that heart rate variability may be often substituted by pulse rate variability (which can be obtained by PPG measurement), especially at rest [49]. Moreover, some studies have presented the possibility of stress detection by analysing pulse rate variability [50]. However, it is important to note that the Polar OH1 device in this study was used exclusively for qualitative and not quantitative measurement and should only represent a wearable that should be placed on the upper or lower arm and that could be used for stress measurement after appropriate analysis. During the study, the OH1 was to be placed on the right upper or lower arm daily for a fortnight. When the sensor was close to the provided smartphone with the app installed and when new data were available, it paired with the application, and the data were collected for future analysis. The test subjects only had to place the sensor on the upper arm and turn it on by pressing a button. It was also necessary to charge the sensors at night. No other actions were required from the test subjects.

3. Results

After the quantitative analysis of the sleep measurement as well as the qualitative analysis of the devices for both the sleep and heart rate measurements were conducted, a set of results was obtained, which are presented below.
The difference between subjective and objective sleep quality measurement was analysed. Figure 2 shows a corresponding box plot diagram for the ten participants. The vertical axis represents the average differences between subjective and objective measurement for all of the subjects who participated in the study. We can see a clear tendency to underestimate subjective sleep quality compared to the value measured with the electronic device. This underestimation remains relatively stable, with a median value of approximately 13% and a mean value of approximately 10%. However, there are also individuals for whom the difference between objectively and subjectively measured sleep quality is notably more significant. This fact should be taken into account when planning the use of technologies to measure sleep quality. For two subjects, there are significant differences in the number of objective and subjective measurements available. For these subjects in particular, there can be discrepancies in the evaluation of the differences between the subjective and objective measurement, which can also lead to some variation in the results. With the total number of available recordings (115–objective and 90–subjective), it is nevertheless to be assumed that the results are also transferable to the overall population, which is also confirmed below with the calculation of margin of error.
To give an idea of the possible differences between objective and subjective measures of sleep quality, the comparison of the measured values (possible values are in the interval from 1 to 10) for a subject with the most significant differences participating in the study is shown in Figure 3.
It can be seen that the median value of sleep quality for the total two-week study period is more than twice as high for the objective measurements taken with the help of an electronic device (approximately 9.2 points of sleep quality) than it is for the subjective measurements taken with the questionnaire (approximately four points of sleep quality). When analysing these results, one can identify two main reasons for this difference: firstly, if there is a large difference between the number of recordings available for both (objective and subjective) measurement methods, then there is more a likelihood that the difference that is measured is greater; secondly, since different parameters are measured in the objective and subjective measurements, the perceived sleep quality may differ significantly from the measured one because measurement with a device cannot take into account all aspects that have an impact on human perception. People typically do not divide sleep quality into the sum of parameters but perceive an overall impression.
The results of the PSQI survey are shown in Table 1. From this, it can be seen that there were significantly more people identified themselves as “bad” sleepers than in the previous study reported in reference [46]. There may be several reasons for this, such as:
  • The study by reference [46] analysed a broad demographic. In our study, only subjects over 65 years of age were included. Therefore, the results may differ significantly due to the different age groups.
  • About 20 years has passed between the study conducted by reference [46] and our study. During this period, the prevalence of sleep-related disorders may have been changed.
The results of the interviews that were conducted at the end of the study are presented in box plots in Figure 4 and Figure 5. Furthermore, the results are analysed and discussed in the following text.
As a result of the analysis of the box plots in Figure 4, the following conclusions can be drawn:
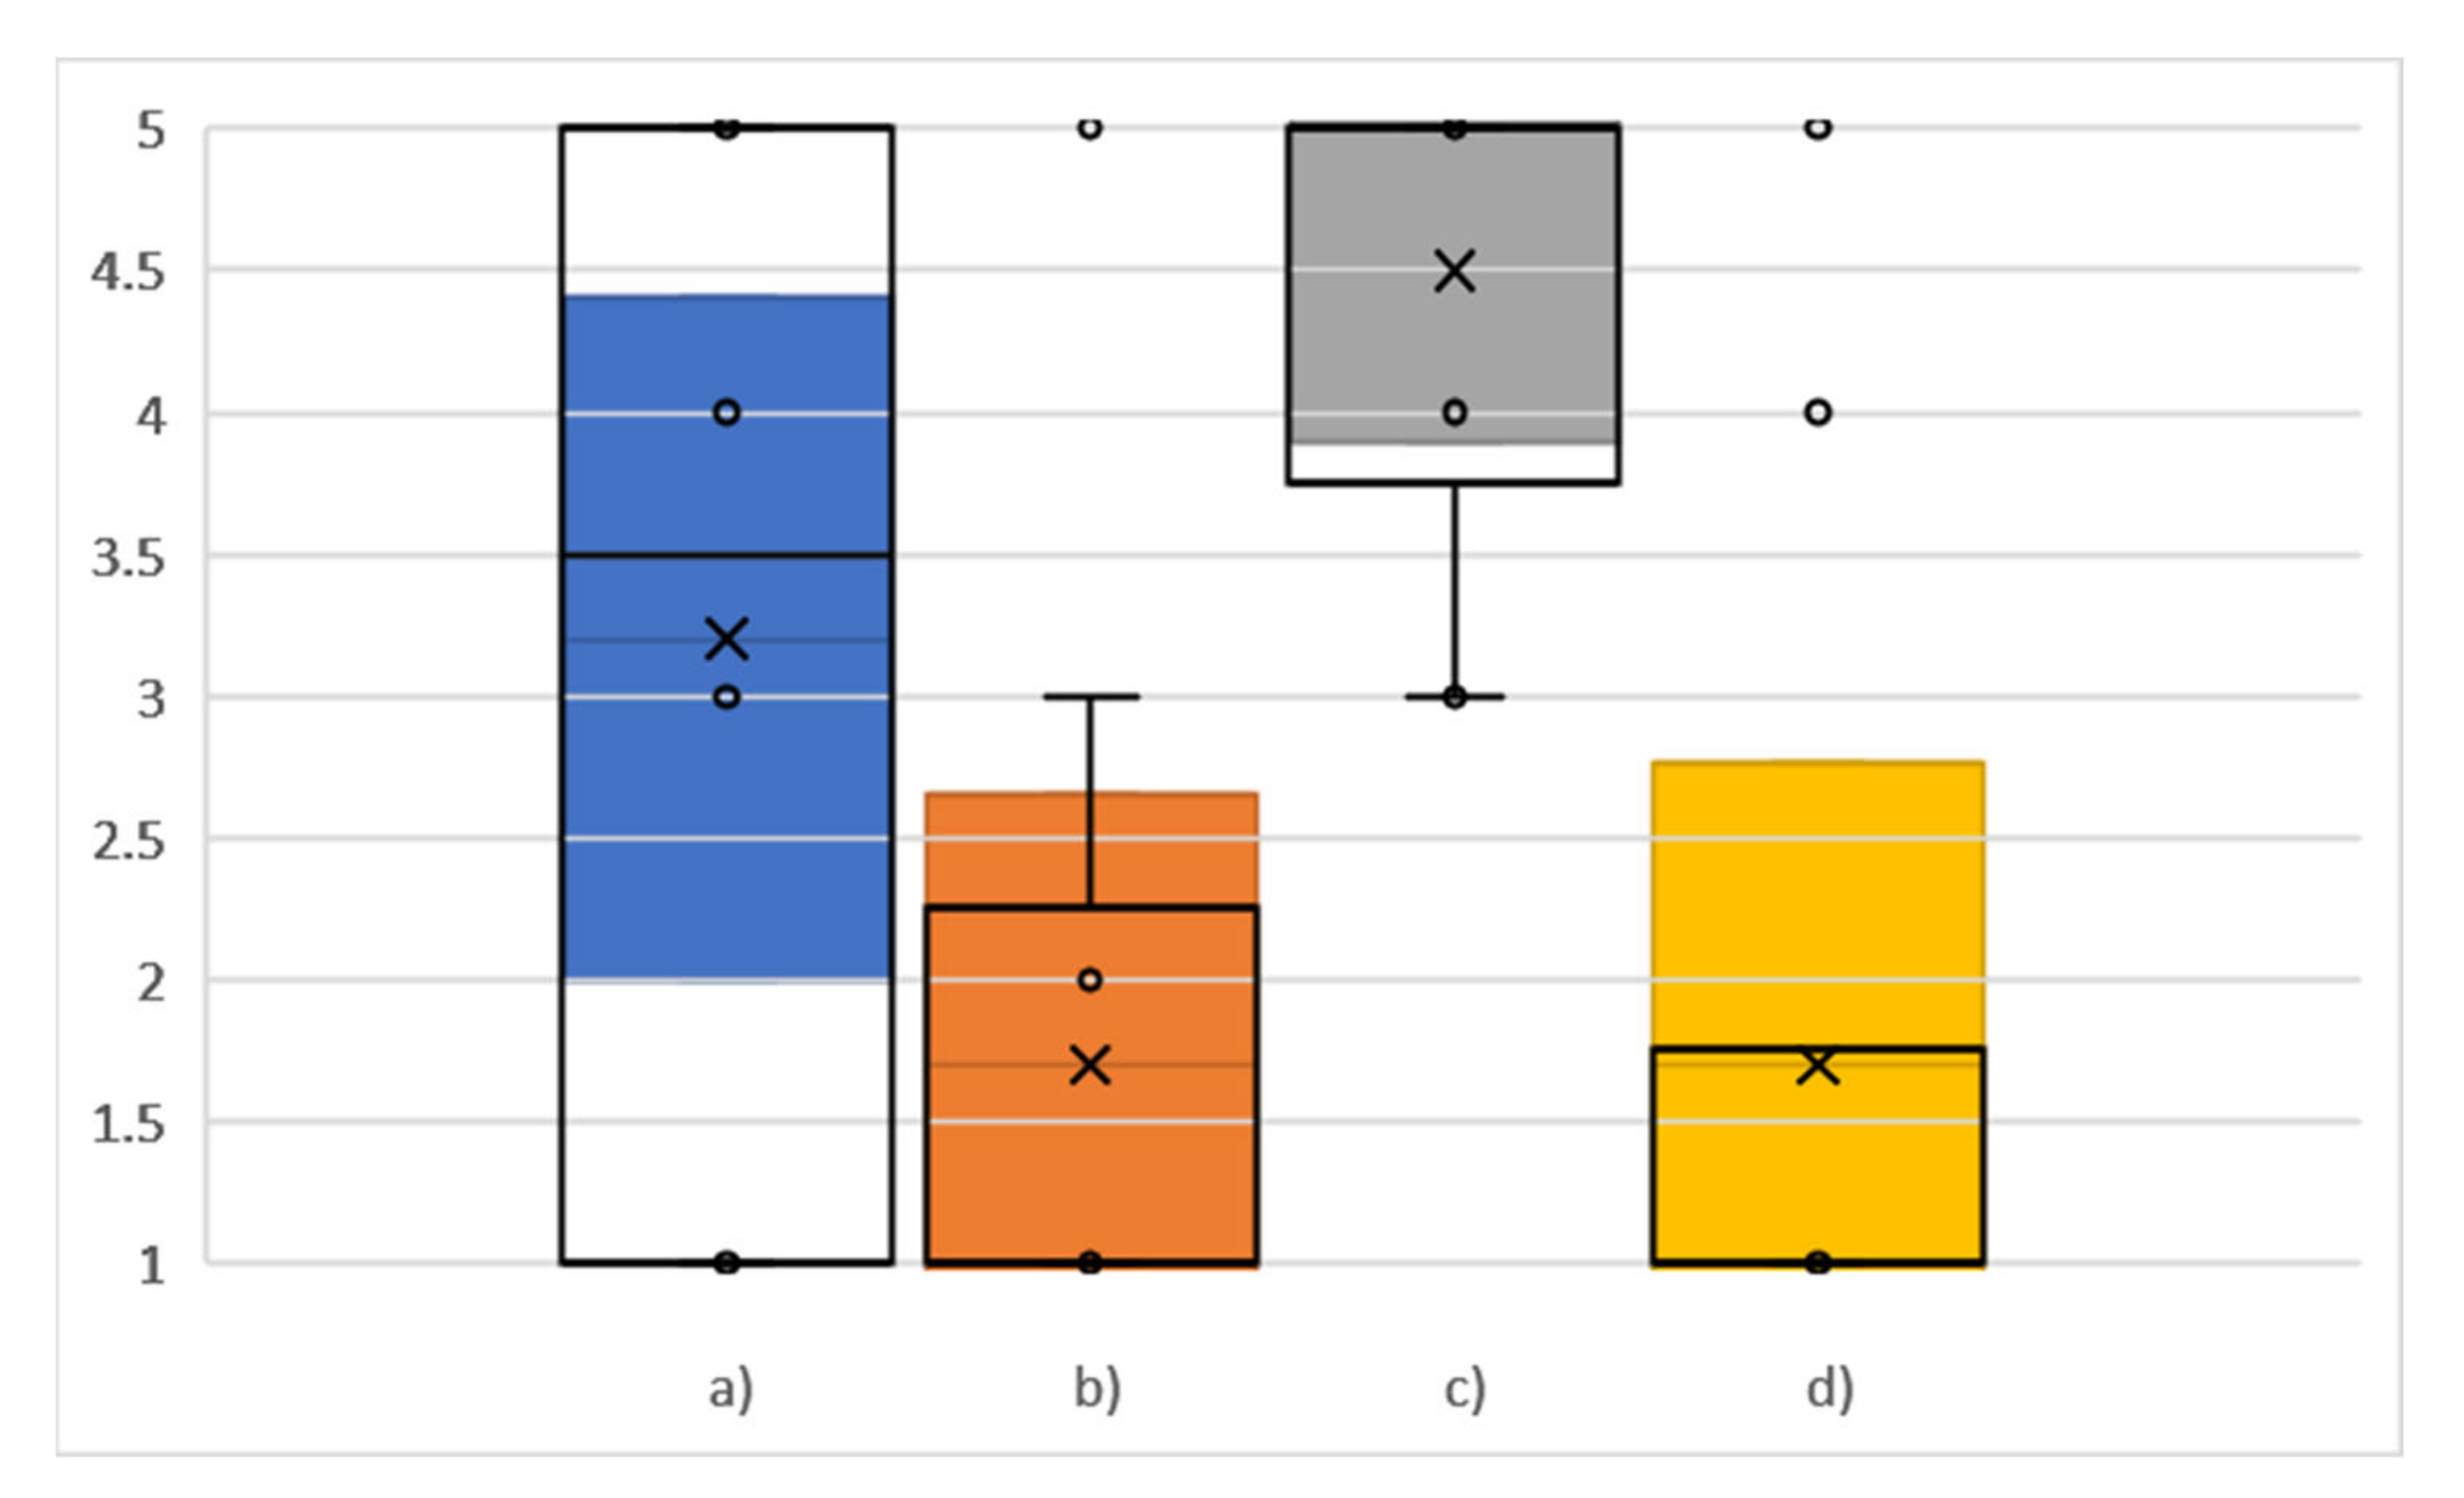
  • There was no agreement among test participants on whether they would use the devices regularly. It should be noted that the devices were used over a two-week period, which, among other things, means that the subjects did not have long-term experience with the devices and therefore could not assess whether they would use the devices regularly in the long term well.
  • The questions regarding the complexity of the devices, ease of use, and the need for support to use the devices, there is a clear trend in the answers, which is more in favour of the devices being relatively easy to use independently without external support. Moreover, despite the novelty of these types of devices for the subjects, no unnecessary complexity was perceived. According to the technology acceptance model, these points indicate that the proposed concept can increase acceptance [51].
Analysing Figure 5, one can see that at several points, an obvious conclusion can be drawn that:
  • The subjects do not believe that there are too many inconsistencies (confusing or unclear functions or components) with the devices utilized.
  • According to the subjects’ opinions, the majority of people can quickly learn how to handle the devices.
  • The operation of the devices is not very complicated according to the subjective perception of the test participants. However, it should be noted that several people noticed some irregularities in the functioning of the proposed devices, which are described in detail below.
  • There was no concern about safety while using the equipment. This means that the perceived risk of using the technologies was relatively low, which according to references [52,53], is essential for the acceptance of technologies.
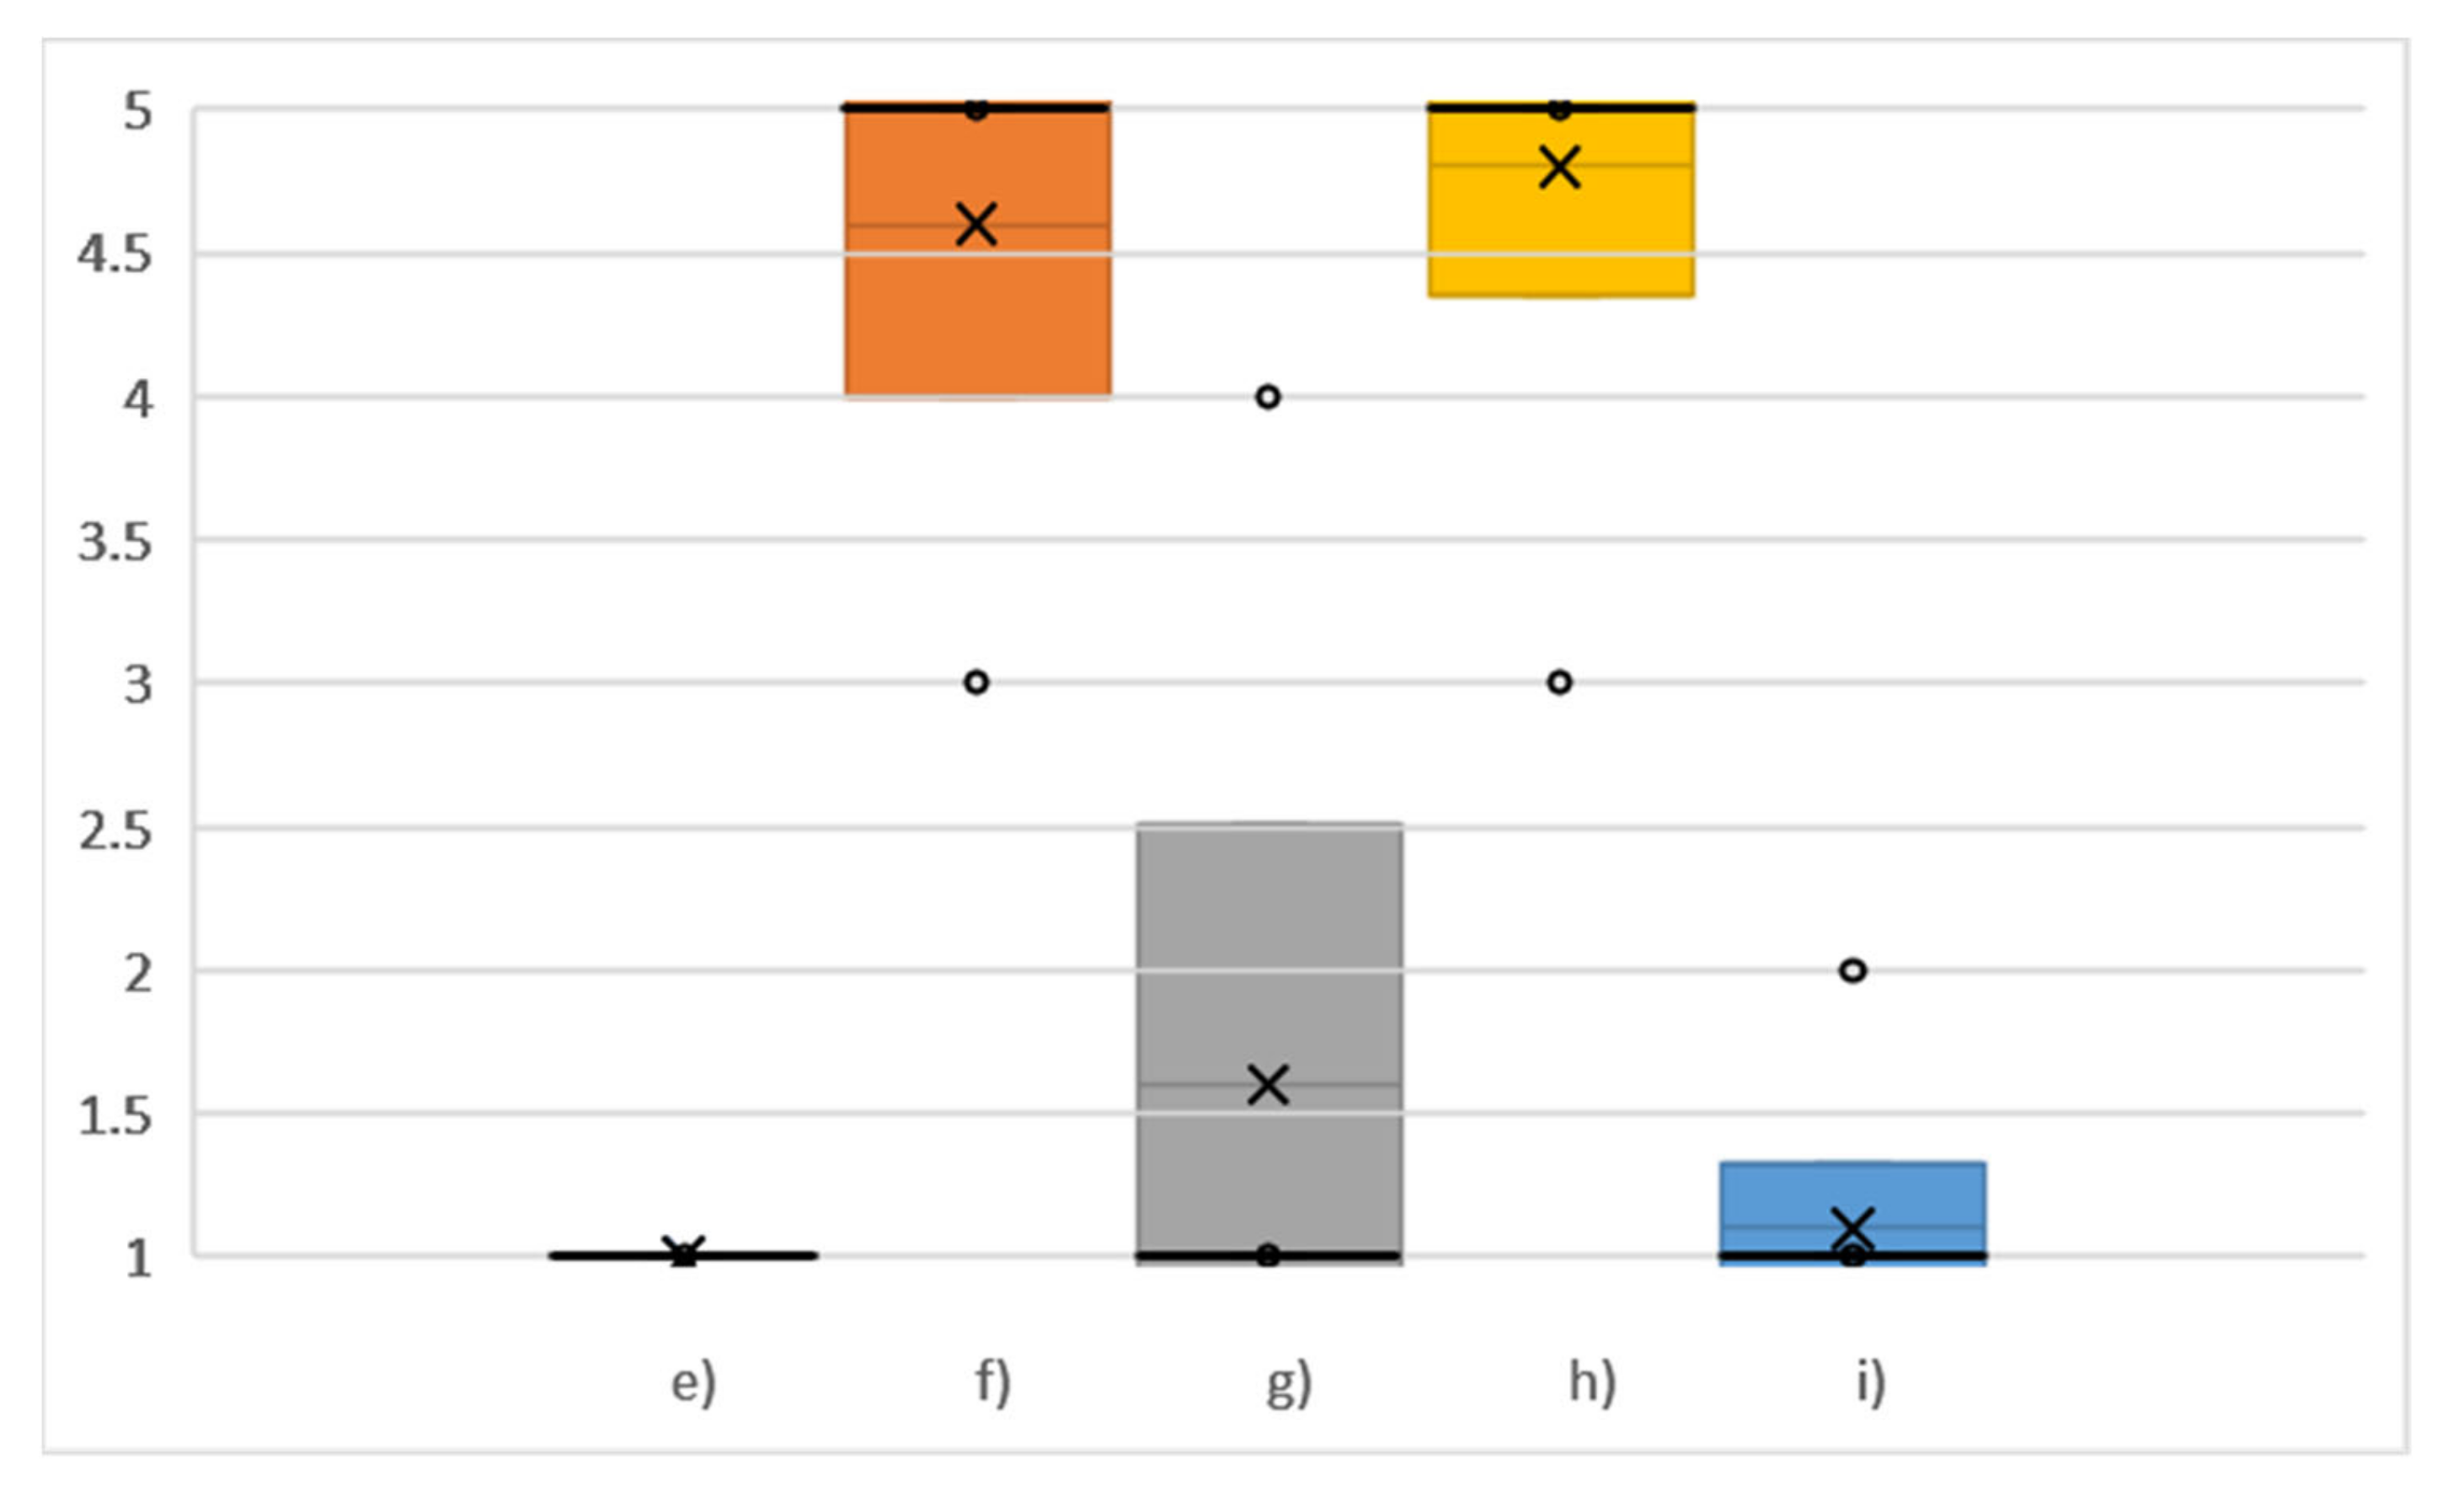
  • It was possible to use the devices without having to learn much new information beforehand. In summary, from the answers to question (e), question (b), and question (c), it can be concluded that the presented concept, where the subjects had to interact with the devices as little as possible, gives a sense of simplicity to users, which can also lead to an increase in the acceptance of such systems [54,55,56].
When interpreting the results obtained from the surveys, it can be said that the two-week study periods provided the test subjects with sufficient information to be able to assess the ease and safety of using the devices, which can be seen from the fairly clear answers. On the other hand, the strong variance and tendency towards “not sure” in the answers to the question of whether the test participants could imagine using the devices regularly shows us that a significantly longer period of use or familiarization is necessary in order to obtain a clear answer to this question.
Another point that can be observed is the fact that there is at least one outlier in the majority of answers to the questions. There may be different reasons for this. One of them is that it is possible that some questions were misunderstood, resulting in a reverse answer being given. For example, instead of “strongly agree”, the answer becomes “strong disagree”. This could be caused by the fact that some questions deliberately include two variants in questionnaires to make sure that people answer the questions consciously, the so-called control mechanism. In individual cases, it can lead to misunderstandings or show us that people answer some questions without understanding them precisely. In general, however, it helps to exclude the questions that are not carefully considered by the participants before answering to be excluded from the analysis. Another explanation for the presence of the outliers could be the fact that the individual rare occurrences with the devices, which only happened to a single person, led to this being very distinct from the majority opinion. This could be, for example, a technical malfunction that only occurs once to one person.
A total of 10 participants participated in the study due to the targeting of a specific group of users and the use of not only questionnaires but also the use and installation of the hardware for several devices to be used over a fortnight. Considering this fact, the question arises as to whether the difference to the expected results by the entire population would differ greatly. This point needs to be subject to deep scientific discussion in order to make a well-founded statement. In the following, this question is analysed and supported by statistical evaluation.
To forecast a maximum possible deviation between the results of a study carried out with a sample (ten people in our case) and the entire population, the parameter called “margin of error” is typically used. We have also followed this scientifically recognized approach. According to references [57,58], we calculated the value of the margin of error for each question. For that, (2) was used:
d = t N n N 1   S 2 n
where t is the Student’s t-critical value for normal distribution, N is the size of the population, n is the sample size, and S is the population standard deviation.
Considering the fact that the population size is substantially larger than the used sample size, N n N 1 tends towards «1». Due to the impossibility of calculating the standard deviation of the entire population, S can be replaced by s (standard deviation of the sample). Taking into account the mentioned factors, Equation (1) can be transformed as follows:
d = t s n
The t value for the sample size of 10 with 9 degrees of freedom and for the significance level α = 0.05 (for the confidence level of 95%) can be found in the corresponding table and is equal to ±2.262156 (two-tailed). Knowing this, the margin of error for every question was calculated with Equation (2).
The results with a confidence level of 95% are presented in Table 2. The possible range of a mean value for the entire population according to the calculation of the margin of error is represented in Figure 4 and Figure 5, with a coloured rectangle representing each question. Analysing that, even in the case of the maximum possible deviation of the mean value for the entire population from the sample mean according to margin of error calculation, for all of the interview questions except for “I can imagine using the devices regularly”, the values still indicate clear agreement or disagreement with the corresponding question, which was also the case for the sample from the current study. This is due to the fact that the responses are very homogeneous and provide us with a clear picture, even with the available number of test persons. Out of that, taking into account the performed margin of error calculation, the results of the study conducted with 10 subjects may be extrapolated to an entire elderly population and can provide a significant scientific added value due to the clear and explicit distribution of the responses. Therefore, it can be stated that no meaningful difference in the results is expected in cases where the study is performed with a large sample size, even for the entire population.
Similarly, the margin of error value can be calculated for the obtained difference between objective and subjective measurement. Performing the calculations according to (3), the margin of error for this measurement with 10 subjects is equal to 1.35, which means that for a 95% confidence level, the mean value of difference for the entire elderly population would be within the interval −2.37–0.33 (−1.02 for the sample of 10 subjects). This means that even in the case of the maximal possible deviation of the mean value of the difference between the objective and subjective measurement, there will still be a clear correlation between these two methods of measurement for the entire population, and the difference will be between 3.3% and 23.7% (0.7–21.1% for a 90% confidence level). This allows one to extrapolate the results of the study conducted with 10 subjects to the entire elderly population with the confidence level mentioned and by considering possible deviations. Based on a statistical evaluation performed using the margin of error calculation, the study results with 10 subjects provide high qualitative and scientifically significant results. It is also important to mention that although only 10 subjects participated in the study, the total number of test nights for the calculation of the difference between subjective and objective measurements was equal to 140, which is a significant number and also increases the reliability of the results that were obtained, as the exact number of evaluation nights (and not only the number of subjects) is relevant for the calculation of the differences between the two types of measurement.
Although the survey results have shown that test persons see the proposed technologies as easy to use, some irregularities can be observed when analysing the available recordings. As shown in Table 3, neither for the objective measurement nor for the subjective measurement of sleep quality are all recordings for all 14 days of the study available.
If we visualize the number of available recordings as in Figure 6 and analyse them, we can see significantly more recordings with the objective method. This is because the test participants did not have to make any extra effort. After all, the device automatically took recordings. In the case of subjective measurement, the subjects had to tag a perceived sleep quality on their own. However, even in terms of the objective measurements, there were some days where there were no recordings. According to the interviews that were conducted, there were two main reasons for this: the subject did not sleep in the bed that night, or the device was turned off from the power socket, which was not necessary but allowed. Sometimes, as the subjects self-reported, they forgot to plug the device back into the socket before going to bed.
There was only one person who filled out the questionnaire on all 14 days. All of the device recordings were also available for this person. Furthermore, although the questionnaire was created, there was an attempt to make it as simple and as motivating as possible. That is why the graphic form was chosen. It follows that the more effort a method requires from the user (even if it is minimal), the more incompleteness there will be in the data collected.
It is important to address the fact that there is a certain imbalance between the number of objective and subjective measurements in order to assess whether this led to a distortion of the results when evaluating the differences between the objective and subjective measurements presented above. We have a total of 115 nights for the objective measurement and 90 nights for the subjective measurement, which corresponds to a difference of only about 20%. For the majority of people, there are more objective measurements than subjective ones. However, it is important to note that there are also people who have more subjective measurements than objective ones, which means that the differences in evaluation can exist in both directions, but this affects the overall evaluation less than a one-sided shift in the number of measurements. Since the total number of nights is significant (as there is an imbalance exactly in the number of night measurements and not in the number of subjects) in our study and since the evaluation is already statistically significant both at 90 and 115 nights independently, it can be assumed that this imbalance only plays a minor role in the overall evaluation. Another important point is that the difference in the number of subjective/objective measurements is relatively small for most subjects. Only in two subjects (9 and 10) are significant differences present in the number of objective and subjective measurements. These two subjects are mainly responsible for the imbalance (18 out of 25 nights of total difference). With these subjects in particular, there are indeed discrepancies in the evaluation. However, the overall evaluation should remain statistically significant.
Another important finding is that 50% of the test subjects noticed anomalies in the functioning of the home health devices. After a detailed analysis of these reports, it turned out that the main reason for this was the Polar OH1 heart rate measurement device. There were two main problems with it:
  • Firstly, the switching button was tiny and partially placed in the device’s body. This made it difficult for the subjects to press the button, especially when their fine motor skills were not perfect.
  • The second problem was the lack of direct feedback from the device. Therefore, the test subjects did not immediately recognize whether the device was already switched on or not. After evaluating the test results, we found that several recordings were only a few seconds long. This means that the subjects switched on the device, but because they were unsure whether it worked, they tried to switch on the device again, which eventually led to the device being turned off.
It is important to note that the evaluation mainly tried to cover the general points that would also be transferable to other technologies, e.g., the automatic functioning of the system without the need of user actions or the need for feedback from the device will be equally relevant for other technologies. Nevertheless, it is not excluded that, in case of using another system, there may be some differences, which are also listed further in limitations.

4. Conclusions

The study allowed us to collect and analyse relevant data on the use of technologies for older adults. Several conclusions that provide new information to the scientific community can be drawn from the evaluation and are presented below.
One of the questions to be addressed in the study framework was whether an objective measurement with an electronic device could replace a subjective measurement of sleep quality, which is typically conducted through the use of a questionnaire. The analysis that was carried out confirms the possibility of this substitution when it comes to evaluating the sleep quality of a group of people and when the overall average result is of interest. For example, it could be used to conduct a comprehensive study of sleep quality in a region or among a specific subset of people. Considering the accuracy obtained for each person, a substitution is not recommended because it has been shown that the differences between the two measurement methods may be extreme in some infrequent exceptional cases. It is important to note that the results of the study do not mean that a subjective measurement will produce more accurate results. It only means that in some people, the results will differ significantly, and in the practice of sleep medicine, a subjective measurement of several sleep parameters has been the most commonly used method (e.g., for the detection of insomnia [59]). Therefore, this method is a standard procedure, and because it has been used for such a long time, health care professionals have a great deal of experience in evaluating and interpreting these kinds of measurements. For some other measurements, objective measurement methods are used in sleep medicine, for example, for the detection of sleep phases [60]. Therefore, a combination of subjective and objective measurements can currently be recommended to obtain a comprehensive analysis of sleep that includes its different characteristics.
Another critical point examined in the study is whether the elderly are comfortable with the existing technologies for measuring health-related parameters and which aspects should be considered when implementing home health systems.
The concept of implementing the technologies created for the study had a few key points:
  • The use of devices that required minimal action on the part of the users. For example, no actions are required except (voluntary) for the unplugging and subsequent re-plugging of the sleep analysis device into the power socket. In the case of the device measuring heart rate during the day, only pressing a button was necessary, and the evaluation of the study showed that even this minimal necessary action led to problems. A possible solution would be to use a device with a more prominent and easier-to-use button to turn it on.
  • The technologies should be self-explanatory, and no complex training or support from a third person should be necessary. This goal was achieved according to the results of the interview, as explained in detail below.
  • When using electronic devices, there should be a sense of safety. This means that the devices should not contain any parts that could be considered dangerous. Additionally, users should be assured that when using the technologies, they cannot be easily broken. For this, the devices should be robust enough and have as few as possible easily breakable parts.
Another point that was not considered when planning the concept, but which became apparent during the evaluation, is that direct feedback from the devices to the user would increase the feeling that the device was working correctly. This would also help to avoid certain operating errors. The experiences during the study are in line with the usability heuristics known from reference [61].
A significant result was obtained when subjectively measuring sleep quality with PSQI—60 % of the test subjects were identified as “bad” sleepers. This clearly shows that the broad use of sleep monitoring technologies would enhance early diagnosis because many test subjects were not even aware that they might have sleep problems that could be treated. Additionally, currently, when the constant development of technologies and algorithms allows new and less invasive methods to detect sleep stages [62], it is possible to make this early detection easier and more convenient for users.
By directly comparing objective and subjective measurement methods, it can be seen that in the case of automatic measurement using technologies, it is possible to expect better data completeness and consistency than the manual filling out of questionnaires. This may ultimately lead to more relevant data being collected and analysed early, improving the quality of life and possibly the users’ health.
The test subjects used the provided devices for a fortnight and finally gave their assessment during an interview. The results allowed us to conclude that the proposed concept is a successful model in terms of the simplicity of independent device operation o and a sense of security when using them. However, the test subjects were not sure as to whether they would use the devices regularly. One explanation for this is that the benefits of using these devices are not always clear to the subjects—there was feedback that they did not think that using these devices would improve their quality of life. To overcome this barrier, a sustained educational effort is needed to communicate clearly and understandably the potential benefits the elderly population using such types of technology. Without this development of motivation to use the technologies, widespread use is complicated, even though handling is not necessarily a big problem, as the conducted study has shown.
There are some limitations in the work presented:
  • Only a few technologies could be used and evaluated within the study framework. Therefore, it cannot be excluded that the results could deviate with a different selection of devices. However, it is always necessary to select a specific subset of technologies because it is impossible to test all available devices at once.
  • The number of test subjects was limited to 10. In order to obtain statistically relevant data, the period of 14 days was chosen for the study, resulting in a total of 140 person-days of study. In addition, the same proportion of male and female test subjects was ensured. Furthermore, the proposed study contained a certain type of usability testing, which included questionnaires and a free-form interview to understand if there were any problems with the usability of devices. According to reference [63], only 10 ± 2 subjects are necessary to discover 80% of usability problems. Moreover, the analysis of the transferability of the results to the entire population of persons aged 65 and older with the approach of the statistical parameter “margin of error” was carried out and presented in the section “Results”. The margin of error scientifically confirmed the significance of the results that were obtained.
  • Since the study target group was people aged 65 years of age and older, the results cannot be directly transferred to other age groups.
  • The technologies were not connected to a common platform that could be accessed by the participants directly. Therefore, it was impossible to assess whether the possibility of directly viewing the results of the recordings by the test subjects could have a positive impact on acceptance.
To overcome the limitations mentioned above and to gather additional valuable information, the next step could be planning and organizing a new extended study. This could involve more subjects and could allow a wider range of technologies connected to a common platform to be tested. Furthermore, further work could be conducted on the selection and design of questionnaires for the collection of relevant data for analysis.

Author Contributions

Conceptualization, M.G., R.S. and N.M.M.; methodology, M.G.; validation, M.G; formal analysis, M.G.; investigation, M.G.; resources, M.G. and R.S.; data curation, M.G.; writing—original draft preparation, M.G.; writing—review and editing, R.S., N.M.M. and J.A.O.; visualization, M.G.; supervision, R.S. and J.A.O.; project administration, R.S., M.G.; funding acquisition, R.S. All authors have read and agreed to the published version of the manuscript.

Funding

This research was funded by the EU Interreg V-Program “Alpenrhein-Bodensee-Hochrhein”: Project “IBH Living Lab Active and Assisted Living”, grants ABH40, ABH41, and ABH66. This research was also partially funded by the Carl Zeiss Foundation (project number: P2019-03-003), by the German Federal Ministry for Economic Affairs and Energy, ZiM project “Sleep Lab at Home” (SLaH) grant: ZF4825301AW9 and grant PGC2018-102145-B-C21, funded by MCIN/AEI/ 10.13039/501100011033 and by “ERDF A way of making Europe”, funded by the Ministry of Science, Research and the Arts Baden-Württemberg and supported by the Open Access Publication Fund of the HTWG Konstanz University of Applied Sciences.

Institutional Review Board Statement

Ethical review and approval were waived for this study, based on the review by ethics officers from the HTWG Konstanz and the University of Applied Sciences Kempten, Germany.

Informed Consent Statement

Informed consent was obtained from all subjects involved in the study.

Acknowledgments

We thank the caregivers of the Workers’ Welfare Association (AWO) Schwarzwald-Baar e.V. for their contribution in conducting the study.

Conflicts of Interest

The authors declare no conflict of interest.

References

  1. United Nations General Assembly. Transforming Our World: The 2030 Agenda for Sustainable Development; United Nations: New York, NY, USA, 2015. [Google Scholar]
  2. Haken, I.T.; Ben Allouch, S.; Van Harten, W.H. The use of advanced medical technologies at home: A systematic review of the literature. BMC Public Health 2018, 18, 284. [Google Scholar] [CrossRef] [PubMed] [Green Version]
  3. Nedungadi, P.; Jayakumar, A.; Raman, R. Personalized Health Monitoring System for Managing Well-Being in Rural Areas. J. Med. Syst. 2017, 42, 22. [Google Scholar] [CrossRef] [PubMed]
  4. Wang, J. Mobile and Connected Health Technologies for Older Adults Aging in Place. J. Gerontol. Nurs. 2018, 44, 3–5. [Google Scholar] [CrossRef] [PubMed] [Green Version]
  5. Guan, K.; Shao, M.; Wu, S. A Remote Health Monitoring System for the Elderly Based on Smart Home Gateway. J. Healthc. Eng. 2017, 2017, 5843504. [Google Scholar] [CrossRef] [PubMed]
  6. Morato, J.; Sanchez-Cuadrado, S.; Iglesias, A.; Campillo, A.; Fernández-Panadero, C. Sustainable Technologies for Older Adults. Sustainability 2021, 13, 8465. [Google Scholar] [CrossRef]
  7. Pekkarinen, S.; Melkas, H.; Hyypiä, M. Elderly Care and Digital Services: Toward a Sustainable Sociotechnical Transition. In Human-Centered Digitalization and Services; Toivonen, M., Saari, E., Eds.; Springer: Singapore, 2019; pp. 259–284. ISBN 978-981-13-7724-2. [Google Scholar]
  8. Malwade, S.; Abdul, S.S.; Uddin, M.; Nursetyo, A.A.; Fernandez-Luque, L.; Zhu, X.K.; Cilliers, L.; Wong, C.-P.; Bamidis, P.; Li, Y.-C.J. Mobile and wearable technologies in healthcare for the ageing population. Comput. Methods Programs Biomed. 2018, 161, 233–237. [Google Scholar] [CrossRef] [PubMed]
  9. Conti, M.; Orcioni, S.; Madrid, N.M.; Gaiduk, M.; Seepold, R. A Review of Health Monitoring Systems Using Sensors on Bed or Cushion. In Bioinformatics and Biomedical Engineering; Rojas, I., Ortuño, F., Eds.; Springer International Publishing: Cham, Switzerland, 2018; pp. 347–358. ISBN 978-3-319-78758-9. [Google Scholar]
  10. Sovacool, B.K.; Del Rio, D.F. Smart home technologies in Europe: A critical review of concepts, benefits, risks and policies. Renew. Sustain. Energy Rev. 2020, 120, 109663. [Google Scholar] [CrossRef]
  11. Asghar, I.; Cang, S.; Yu, H. Usability evaluation of assistive technologies through qualitative research focusing on people with mild dementia. Comput. Hum. Behav. 2018, 79, 192–201. [Google Scholar] [CrossRef]
  12. Wildenbos, G.; Jaspers, M.; Schijven, M.; Peute, L. Mobile health for older adult patients: Using an aging barriers framework to classify usability problems. Int. J. Med. Inform. 2019, 124, 68–77. [Google Scholar] [CrossRef] [PubMed]
  13. Cifter, A.S. Blood Pressure Monitor Usability Problems Detected Through Human Factors Evaluation. Ergon. Des. Q. Hum. Factors Appl. 2017, 25, 11–19. [Google Scholar] [CrossRef]
  14. Sultan, M.; Kuluski, K.; McIsaac, W.J.; Cafazzo, J.A.; Seto, E. Turning challenges into design principles: Telemonitoring systems for patients with multiple chronic conditions. Health Inform. J. 2019, 25, 1188–1200. [Google Scholar] [CrossRef]
  15. Carayon, P.; Hoonakker, P. Human Factors and Usability for Health Information Technology: Old and New Challenges. Yearb. Med. Inform. 2019, 28, 071–077. [Google Scholar] [CrossRef] [PubMed]
  16. Agnisarman, S.O.; Madathil, K.C.; Smith, K.; Ashok, A.; Welch, B.; McElligott, J.T. Lessons learned from the usability assessment of home-based telemedicine systems. Appl. Ergon. 2017, 58, 424–434. [Google Scholar] [CrossRef] [PubMed]
  17. Moon, N.W.; Baker, P.M.; Goughnour, K. Designing wearable technologies for users with disabilities: Accessibility, usability, and connectivity factors. J. Rehabil. Assist. Technol. Eng. 2019, 6, 205566831986213. [Google Scholar] [CrossRef] [Green Version]
  18. Taherdoost, H. A review of technology acceptance and adoption models and theories. Procedia Manuf. 2018, 22, 960–967. [Google Scholar] [CrossRef]
  19. Rahimi, B.; Nadri, H.; Afshar, H.L.; Timpka, T. A Systematic Review of the Technology Acceptance Model in Health Informatics. Appl. Clin. Inform. 2018, 9, 604–634. [Google Scholar] [CrossRef] [Green Version]
  20. Thoits, P.A. Stress and Health: Major Findings and Policy Implications. J. Health Soc. Behav. 2010, 51 (Suppl. 1), S41–S53. [Google Scholar] [CrossRef] [PubMed] [Green Version]
  21. Knutson, K.L.; Phelan, J.; Paskow, M.J.; Roach, A.; Whiton, K.; Langer, G.; Hillygus, D.S.; Mokrzycki, M.; Broughton, W.A.; Chokroverty, S.; et al. The National Sleep Foundation’s Sleep Health Index. Sleep Health 2017, 3, 234–240. [Google Scholar] [CrossRef] [PubMed]
  22. Benjafield, A.V.; Ayas, N.T.; Eastwood, P.R.; Heinzer, R.; Ip, M.S.M.; Morrell, M.J.; Nunez, C.M.; Patel, S.R.; Penzel, T.; Pépin, J.-L.; et al. Estimation of the global prevalence and burden of obstructive sleep apnoea: A literature-based analysis. Lancet Respir. Med. 2019, 7, 687–698. [Google Scholar] [CrossRef] [Green Version]
  23. Uddin, B.; Chow, C.-M.; Su, S. Classification methods to detect sleep apnea in adults based on respiratory and oximetry signals: A systematic review. Physiol. Meas. 2018, 39, 03TR01. [Google Scholar] [CrossRef]
  24. Gaiduk, M.; Orcioni, S.; Conti, M.; Seepold, R.; Penzel, T.; Madrid, N.M.; Ortega, J.A. Embedded system for non-obtrusive sleep apnea detection*. In Proceedings of the 2020 42nd Annual International Conference of the IEEE Engineering in Medicine & Biology Society (EMBC), Montreal, QC, Canada, 20–24 July 2020; Volume 2020, pp. 2776–2779. [Google Scholar] [CrossRef]
  25. Gulia, K.K.; Kumar, V.M. Sleep disorders in the elderly: A growing challenge. Psychogeriatrics 2018, 18, 155–165. [Google Scholar] [CrossRef] [PubMed]
  26. Sugaya, N.; Arai, M.; Goto, F. The effect of vestibular rehabilitation on sleep disturbance in patients with chronic dizziness. Acta Otolaryngol. 2017, 137, 275–278. [Google Scholar] [CrossRef] [PubMed]
  27. Leonidis, A.; Korozi, M.; Sykianaki, E.; Tsolakou, E.; Kouroumalis, V.; Ioannidi, D.; Stavridakis, A.; Antona, M.; Stephanidis, C. Improving Stress Management and Sleep Hygiene in Intelligent Homes. Sensors 2021, 21, 2398. [Google Scholar] [CrossRef] [PubMed]
  28. Littlejohns, P.; Kieslich, K.; Weale, A.; Tumilty, E.; Richardson, G.; Stokes, T.; Gauld, R.; Scuffham, P. Creating sustainable health care systems. J. Health Organ. Manag. 2019, 33, 18–34. [Google Scholar] [CrossRef] [PubMed] [Green Version]
  29. Gaiduk, M.; Seepold, R.; Ortega, J.A.; Madrid, N.M. Comparison of sleep characteristics measurements: A case study with a population aged 65 and above. Procedia Comput. Sci. 2020, 176, 2341–2349. [Google Scholar] [CrossRef]
  30. Park, K.S.; Choi, S.H. Smart technologies toward sleep monitoring at home. Biomed. Eng. Lett. 2019, 9, 73–85. [Google Scholar] [CrossRef] [PubMed]
  31. Gaiduk, M.; Seepold, R.; Madrid, N.M.; Ortega, J.A.; Conti, M.; Orcioni, S.; Penzel, T.; Scherz, W.D.; Perea, J.J.; Alarcón, Á.S.; et al. A Comparison of Objective and Subjective Sleep Quality Measurement in a Group of Elderly Persons in a Home Environment. In Applications in Electronics Pervading Industry, Environment and Society; Saponara, S., de Gloria, A., Eds.; Springer International Publishing: Cham, Switzerland, 2021; pp. 286–291. ISBN 978-3-030-66728-3. [Google Scholar]
  32. Ibáñez, V.; Silva, J.; Cauli, O. A survey on sleep questionnaires and diaries. Sleep Med. 2018, 42, 90–96. [Google Scholar] [CrossRef] [PubMed]
  33. Ibáñez, V.; Silva, J.; Cauli, O. A survey on sleep assessment methods. PeerJ 2018, 6, e4849. [Google Scholar] [CrossRef] [PubMed] [Green Version]
  34. Harvey, A.G.; Stinson, K.; Whitaker, K.; Moskovitz, D.; Virk, H. The Subjective Meaning of Sleep Quality: A Comparison of Individuals with and without Insomnia. Sleep 2008, 31, 383–393. [Google Scholar] [CrossRef] [PubMed] [Green Version]
  35. Merilahti, J.; Saarinen, A.; Pärkkä, J.; Antila, K.; Mattila, E.; Korhonen, I. Long-Term Subjective and Objective Sleep Analysis of Total Sleep Time and Sleep Quality in Real Life Settings. Annu. Int. Conf. IEEE Eng. Med. Biol. Soc. 2007, 2007, 5202–5205. [Google Scholar] [CrossRef] [PubMed]
  36. Huysmans, D.; Borzée, P.; Testelmans, D.; Buyse, B.; Willemen, T.; van Huffel, S.; Varon, C. Evaluation of a Commercial Ballistocardiography Sensor for Sleep Apnea Screening and Sleep Monitoring. Sensors 2019, 19, 2133. [Google Scholar] [CrossRef] [PubMed] [Green Version]
  37. Kortelainen, J.M.; van Gils, M.; Pärkkä, J. Multichannel Bed Pressure Sensor for Sleep Monitoring. In Proceedings of the 39th Computing in Cardiology, Krakow, Poland, 9–12 September 2012; pp. 313–316. [Google Scholar]
  38. Gaiduk, M.; Seepold, R.; Penzel, T.; Ortega, J.A.; Glos, M.; Madrid, N.M. Recognition of Sleep/Wake States analyzing Heart Rate, Breathing and Movement Signals. Annu. Int. Conf. IEEE Eng. Med. Biol. Soc. 2019, 2019, 5712–5715. [Google Scholar] [CrossRef]
  39. Gaiduk, M.; Penzel, T.; Ortega, J.A.; Seepold, R. Automatic sleep stages classification using respiratory, heart rate and movement signals. Physiol. Meas. 2018, 39, 124008. [Google Scholar] [CrossRef] [PubMed]
  40. Tonetti, L.; Mingozzi, R.; Natale, V. Comparison between paper and electronic sleep diary. Biol. Rhythm. Res. 2016, 47, 743–753. [Google Scholar] [CrossRef]
  41. Jungquist, C.R.; Pender, J.J.; Klingman, K.J.; Mund, J. Validation of Capturing Sleep Diary Data via a Wrist-Worn Device. Sleep Disord. 2015, 2015, 758937. [Google Scholar] [CrossRef] [PubMed] [Green Version]
  42. Buysse, D.J.; Reynolds, C.F., III; Monk, T.H.; Berman, S.R.; Kupfer, D.J. The Pittsburgh sleep quality index: A new instrument for psychiatric practice and research. Psychiatry Res. 1989, 28, 193–213. [Google Scholar] [CrossRef]
  43. Backhaus, J.; Junghanns, K.; Broocks, A.; Riemann, D.; Hohagen, F. Test–retest reliability and validity of the Pittsburgh Sleep Quality Index in primary insomnia. J. Psychosom. Res. 2002, 53, 737–740. [Google Scholar] [CrossRef]
  44. Carpenter, J.S.; Andrykowski, M.A. Psychometric evaluation of the pittsburgh sleep quality index. J. Psychosom. Res. 1998, 45, 5–13. [Google Scholar] [CrossRef]
  45. Riemann, D.; Backhaus, J. Behandlung von Schlafstörungen. In Materialien für die Psychosoziale Praxis; Psychologische Verlags Union: Weinheim, Germany, 1996. [Google Scholar]
  46. Zeitlhofer, J.; Schmeiser-Rieder, A.; Tribl, G.; Rosenberger, A.; Bolitschek, J.; Kapfhammer, G.; Saletu, B.; Katschnig, H.; Holzinger, B.; Popovic, R.; et al. Sleep and quality of life in the Austrian population. Acta Neurol. Scand. 2000, 102, 249–257. [Google Scholar] [CrossRef]
  47. Scherz, W.D.; Seepold, R.; Madrid, N.M.; Crippa, P.; Ortega, J.A. RR interval analysis for the distinction between stress, physical activity and no activity using a portable ECG. Annu. Int. Conf. IEEE Eng. Med. Biol. Soc. 2020, 2020, 4522–4526. [Google Scholar] [CrossRef]
  48. Castaldo, R.; Montesinos, L.; Melillo, P.; James, C.; Pecchia, L. Ultra-short term HRV features as surrogates of short term HRV: A case study on mental stress detection in real life. BMC Med. Inform. Decis. Mak. 2019, 19, 12. [Google Scholar] [CrossRef] [Green Version]
  49. Schäfer, A.; Vagedes, J. How accurate is pulse rate variability as an estimate of heart rate variability? A review on studies comparing photoplethysmographic technology with an electrocardiogram. Int. J. Cardiol. 2013, 166, 15–29. [Google Scholar] [CrossRef] [PubMed]
  50. Zubair, M.; Yoon, C. Multilevel mental stress detection using ultra-short pulse rate variability series. Biomed. Signal. Process. Control. 2020, 57, 101736. [Google Scholar] [CrossRef]
  51. Li, J.; Ma, Q.; Chan, A.H.; Man, S. Health monitoring through wearable technologies for older adults: Smart wearables acceptance model. Appl. Ergon. 2019, 75, 162–169. [Google Scholar] [CrossRef] [PubMed]
  52. Dowling, G.R.; Staelin, R. A Model of Perceived Risk and Intended Risk-Handling Activity. J. Consum. Res. 1994, 21, 119–134. [Google Scholar] [CrossRef]
  53. Yang, H.; Yu, J.; Zo, H.; Choi, M. User acceptance of wearable devices: An extended perspective of perceived value. Telemat. Inform. 2016, 33, 256–269. [Google Scholar] [CrossRef]
  54. Choi, J.; Kim, S. Is the smartwatch an IT product or a fashion product? A study on factors affecting the intention to use smartwatches. Comput. Hum. Behav. 2016, 63, 777–786. [Google Scholar] [CrossRef]
  55. Davis, F.D. Perceived Usefulness, Perceived Ease of Use, and User Acceptance of Information Technology. MIS Q. 1989, 13, 319–339. [Google Scholar] [CrossRef] [Green Version]
  56. Karahoca, A.; Karahoca, D.; Aksöz, M. Examining intention to adopt to internet of things in healthcare technology products. Kybernetes 2018, 47, 742–770. [Google Scholar] [CrossRef]
  57. Cochran, W.G. Sampling Techniques, 3rd ed.; Wiley: New York, NY, USA, 1977; ISBN 0-471-16240-X. [Google Scholar]
  58. Moore, D.S.; McCabe, G.P.; Craig, B.A. Introduction to the Practice of Statistics, 6th ed.; W.H. Freeman: New York, 2009; ISBN 978-1-4292-1623-4. [Google Scholar]
  59. Riemann, D.; Baglioni, C.; Bassetti, C.; Bjorvatn, B.; Groselj, L.D.; Ellis, J.G.; Espie, C.A.; Garcia-Borreguero, D.; Gjerstad, M.; Gonçalves, M.; et al. European guideline for the diagnosis and treatment of insomnia. J. Sleep Res. 2017, 26, 675–700. [Google Scholar] [CrossRef] [PubMed]
  60. Berry, R.B.; Quan, S.F.; Abreu, A.R.; Bibbs, M.L.; DelRosso, L.; Harding, S.M.; Mao, M.-M.; Plante, D.T.; Pressman, M.R.; Troester, M.R.; et al. The AASM Manual for the Scoring of Sleep and Associated Events: Rules, Terminology and Technical Specifications; Version 2.6; American Academy of Sleep Medicine: Darien, IL, USA, 2020. [Google Scholar]
  61. Nielsen, J. Enhancing the explanatory power of usability heuristics. In Proceedings of the SIGCHI conference on Human Factors in Computing Systems Celebrating Interdependence-CHI ′94, Boston, MA, USA, 24–28 April 1994; Adelson, B., Dumais, S., Olson, J., Eds.; ACM Press: New York, NY, USA, 1994; pp. 152–158. [Google Scholar]
  62. Gaiduk, M.; Perea, J.J.; Seepold, R.; Madrid, N.M.; Penzel, T.; Glos, M.; Ortega, J.A. Estimation of Sleep Stages Analyzing Respiratory and Movement Signals. IEEE J. Biomed. Health Inform. 2021. (Early Access). [Google Scholar] [CrossRef] [PubMed]
  63. Hwang, W.; Salvendy, G. Number of people required for usability evaluation. Commun. ACM 2010, 53, 130–133. [Google Scholar] [CrossRef]
Figure 1. Graphical questionnaire to determine sleep quality. Reprinted with permission from Gaiduk et al. (2021). © Springer 2021 [31].
Sustainability 13 13376 g001
Figure 2. Analysis of the differences between objective and subjective measures of sleep quality for ten subjects. Negative values—subjective sleep quality is underestimated.
Sustainability 13 13376 g002
Figure 3. Comparison of subjective and objective measurements for a subject with the most significant differences between two measurement methods.
Sustainability 13 13376 g003
Figure 4. Box plot of the interview results. 1—totally disagree, 5—strongly agree: (a) I can imagine using the devices regularly. (b) I find the devices to be unnecessarily complicated. (c) I find the devices easy to use. (d) I think I would need technical support to use the devices.
Sustainability 13 13376 g004
Figure 5. Box plot of the interview results. 1—totally disagree, 5—strongly agree: (e) I find that there are too many inconsistencies in the devices. (f) I can imagine that most people learn to handle the devices quickly. (g) I find the operating of the devices very complicated. (h) I felt very safe using the devices. (i) I had to learn many things before I could handle the devices.
Sustainability 13 13376 g005
Figure 6. Box plot representing the number of days with available measurements for all subjects for both approaches.
Sustainability 13 13376 g006
Table 1. PSQI screening results.
PSQI ValuePercentage
≤540%
>560%
Table 2. Margin of error calculation.
MeasureQuestion
(a)(b)(c)(d)(e)(f)(g)(h)(i)
SD1.68651.33750.84981.49440.00000.84331.26490.63250.3162
Mean3.20001.70004.50001.70001.00004.60001.60004.80001.1000
Sample standard error0.53330.42300.26870.47260.00000.26670.40000.20000.1000
Margin of error1.20650.95680.60791.06910.00000.60320.90490.45240.2262
Table 3. Availability of measurements per person (study duration—14 days).
MeasurementSubject
12345678910
Subjective81014911137756
Objective76141414149101314
Publisher’s Note: MDPI stays neutral with regard to jurisdictional claims in published maps and institutional affiliations.

