
Circular Business Processes in the State-of-the-Practice: A Survey Study


Abstract
:1. Introduction
2. Background
2.1. Circular Economy
2.2. The 6R Framework
2.2.1. Reduce
2.2.2. Reuse
2.2.3. Recycle
2.2.4. Recover
2.2.5. Redesign
2.2.6. Remanufacture
2.3. The SCOR Model
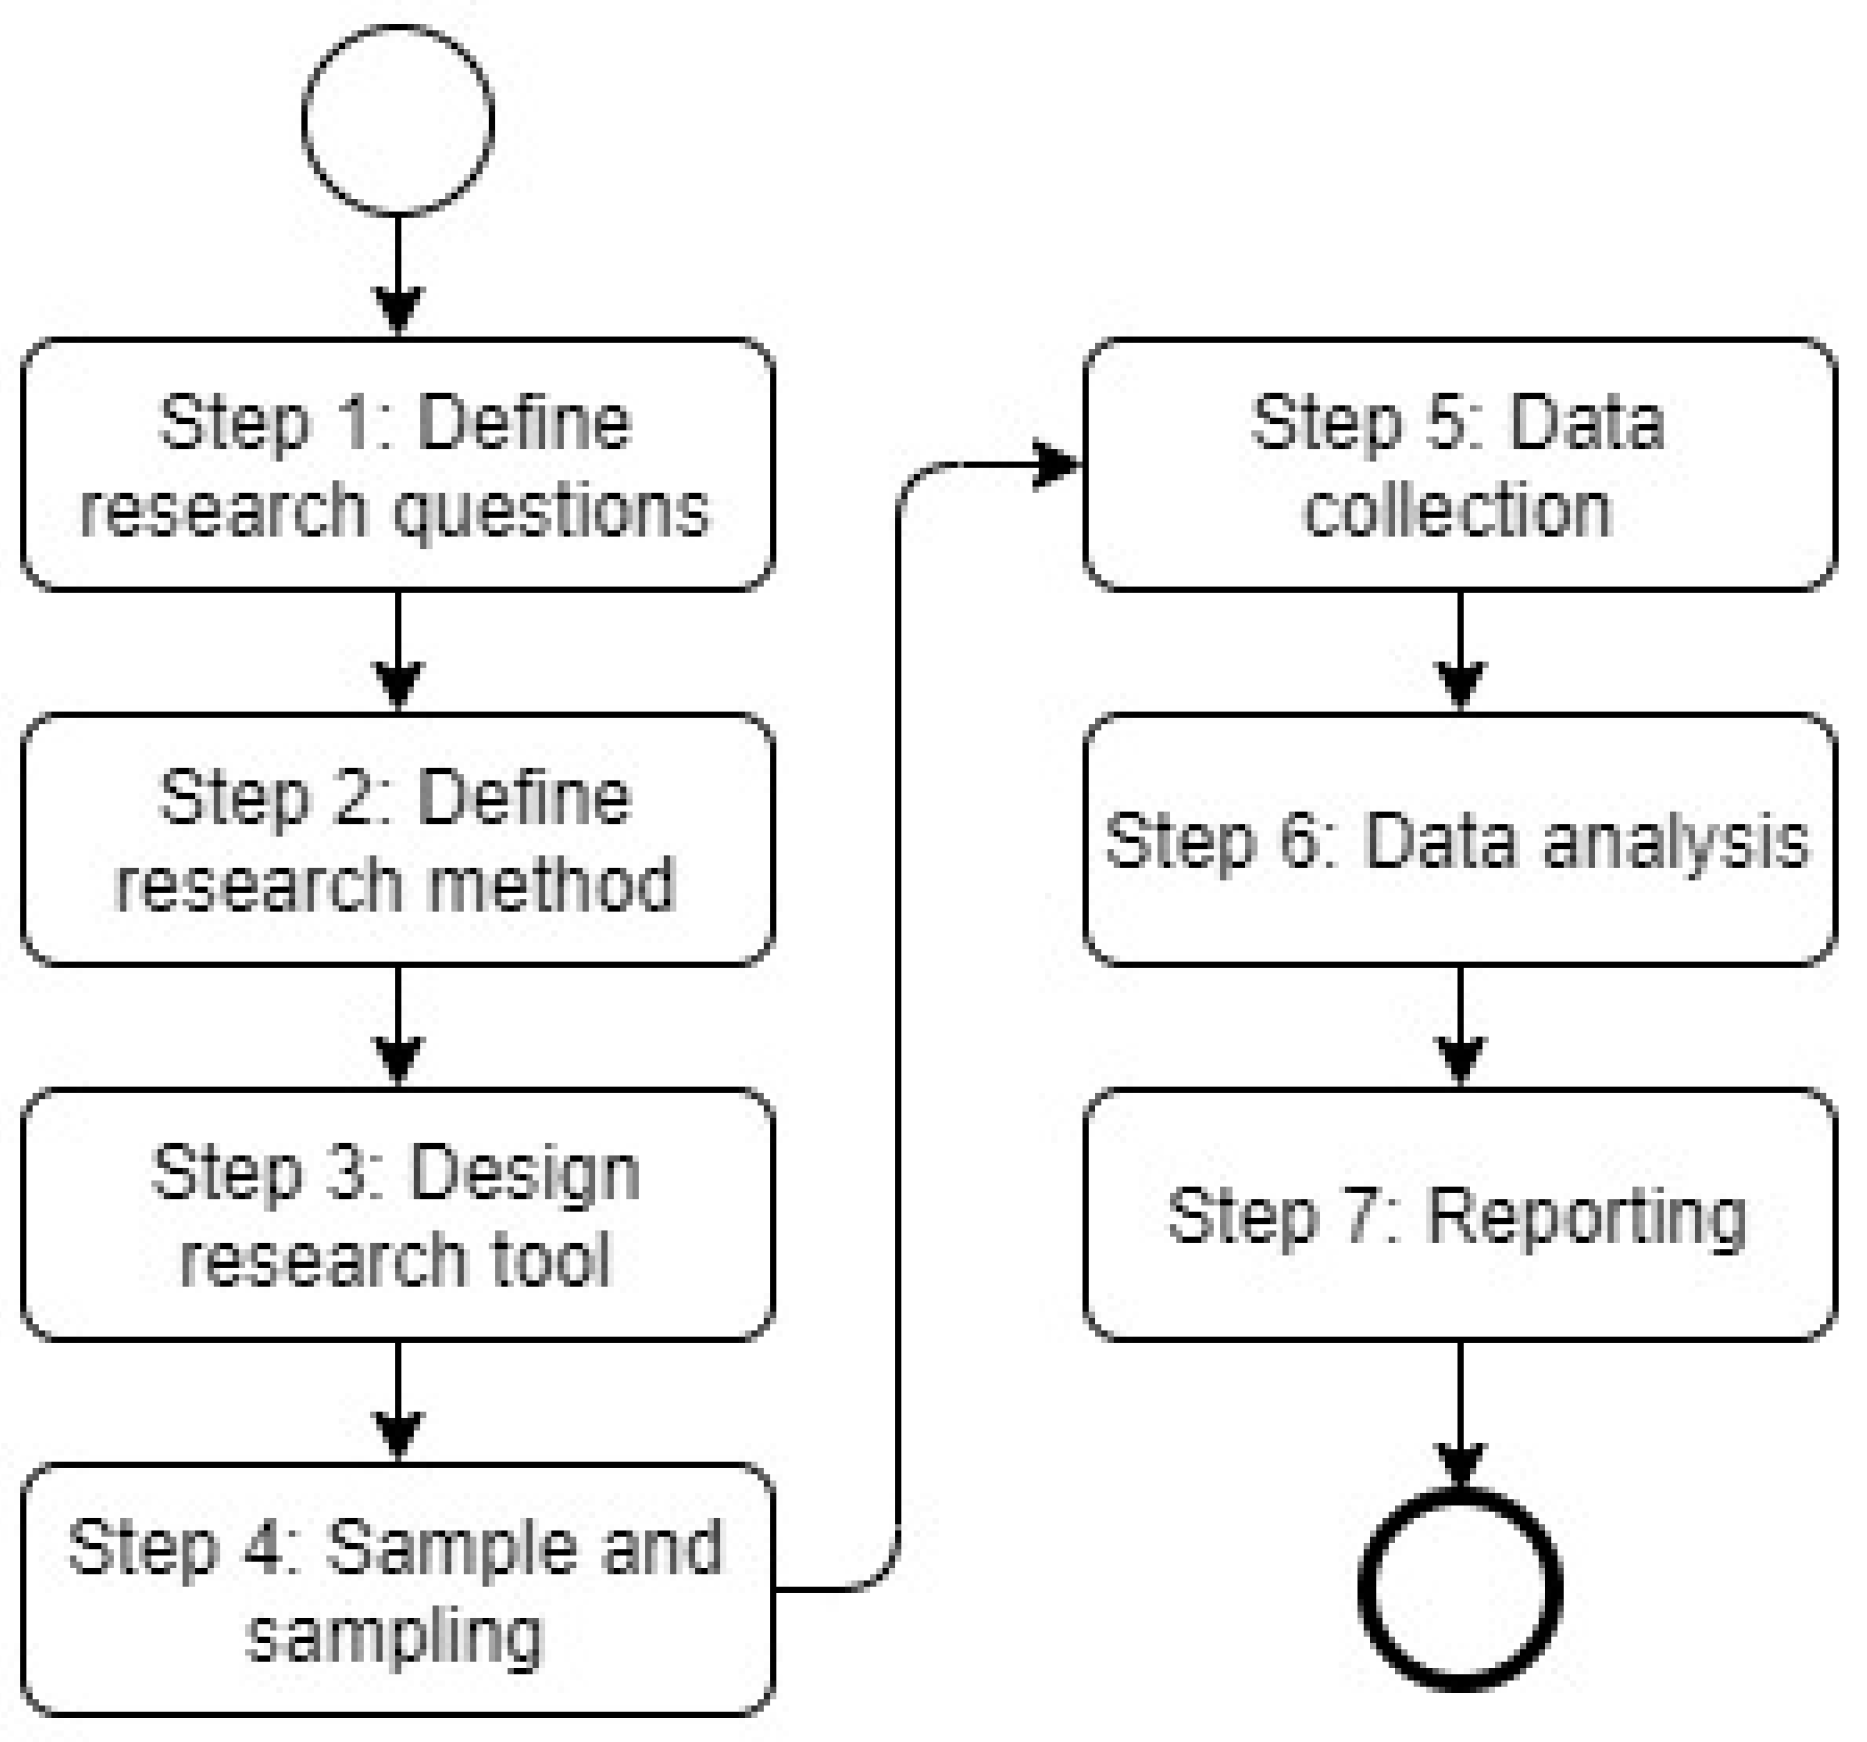
3. Methodology
3.1. Research Questions
- 1:
- Which business processes have been used in circular supply chains?
- 1.a:
- Which SCOR processes have been used?
- 1.b:
- Which non-SCOR processes have been used?
- 2:
- What are the relationships among the business processes?
3.2. Adopted Survey Method
3.3. Research Tool
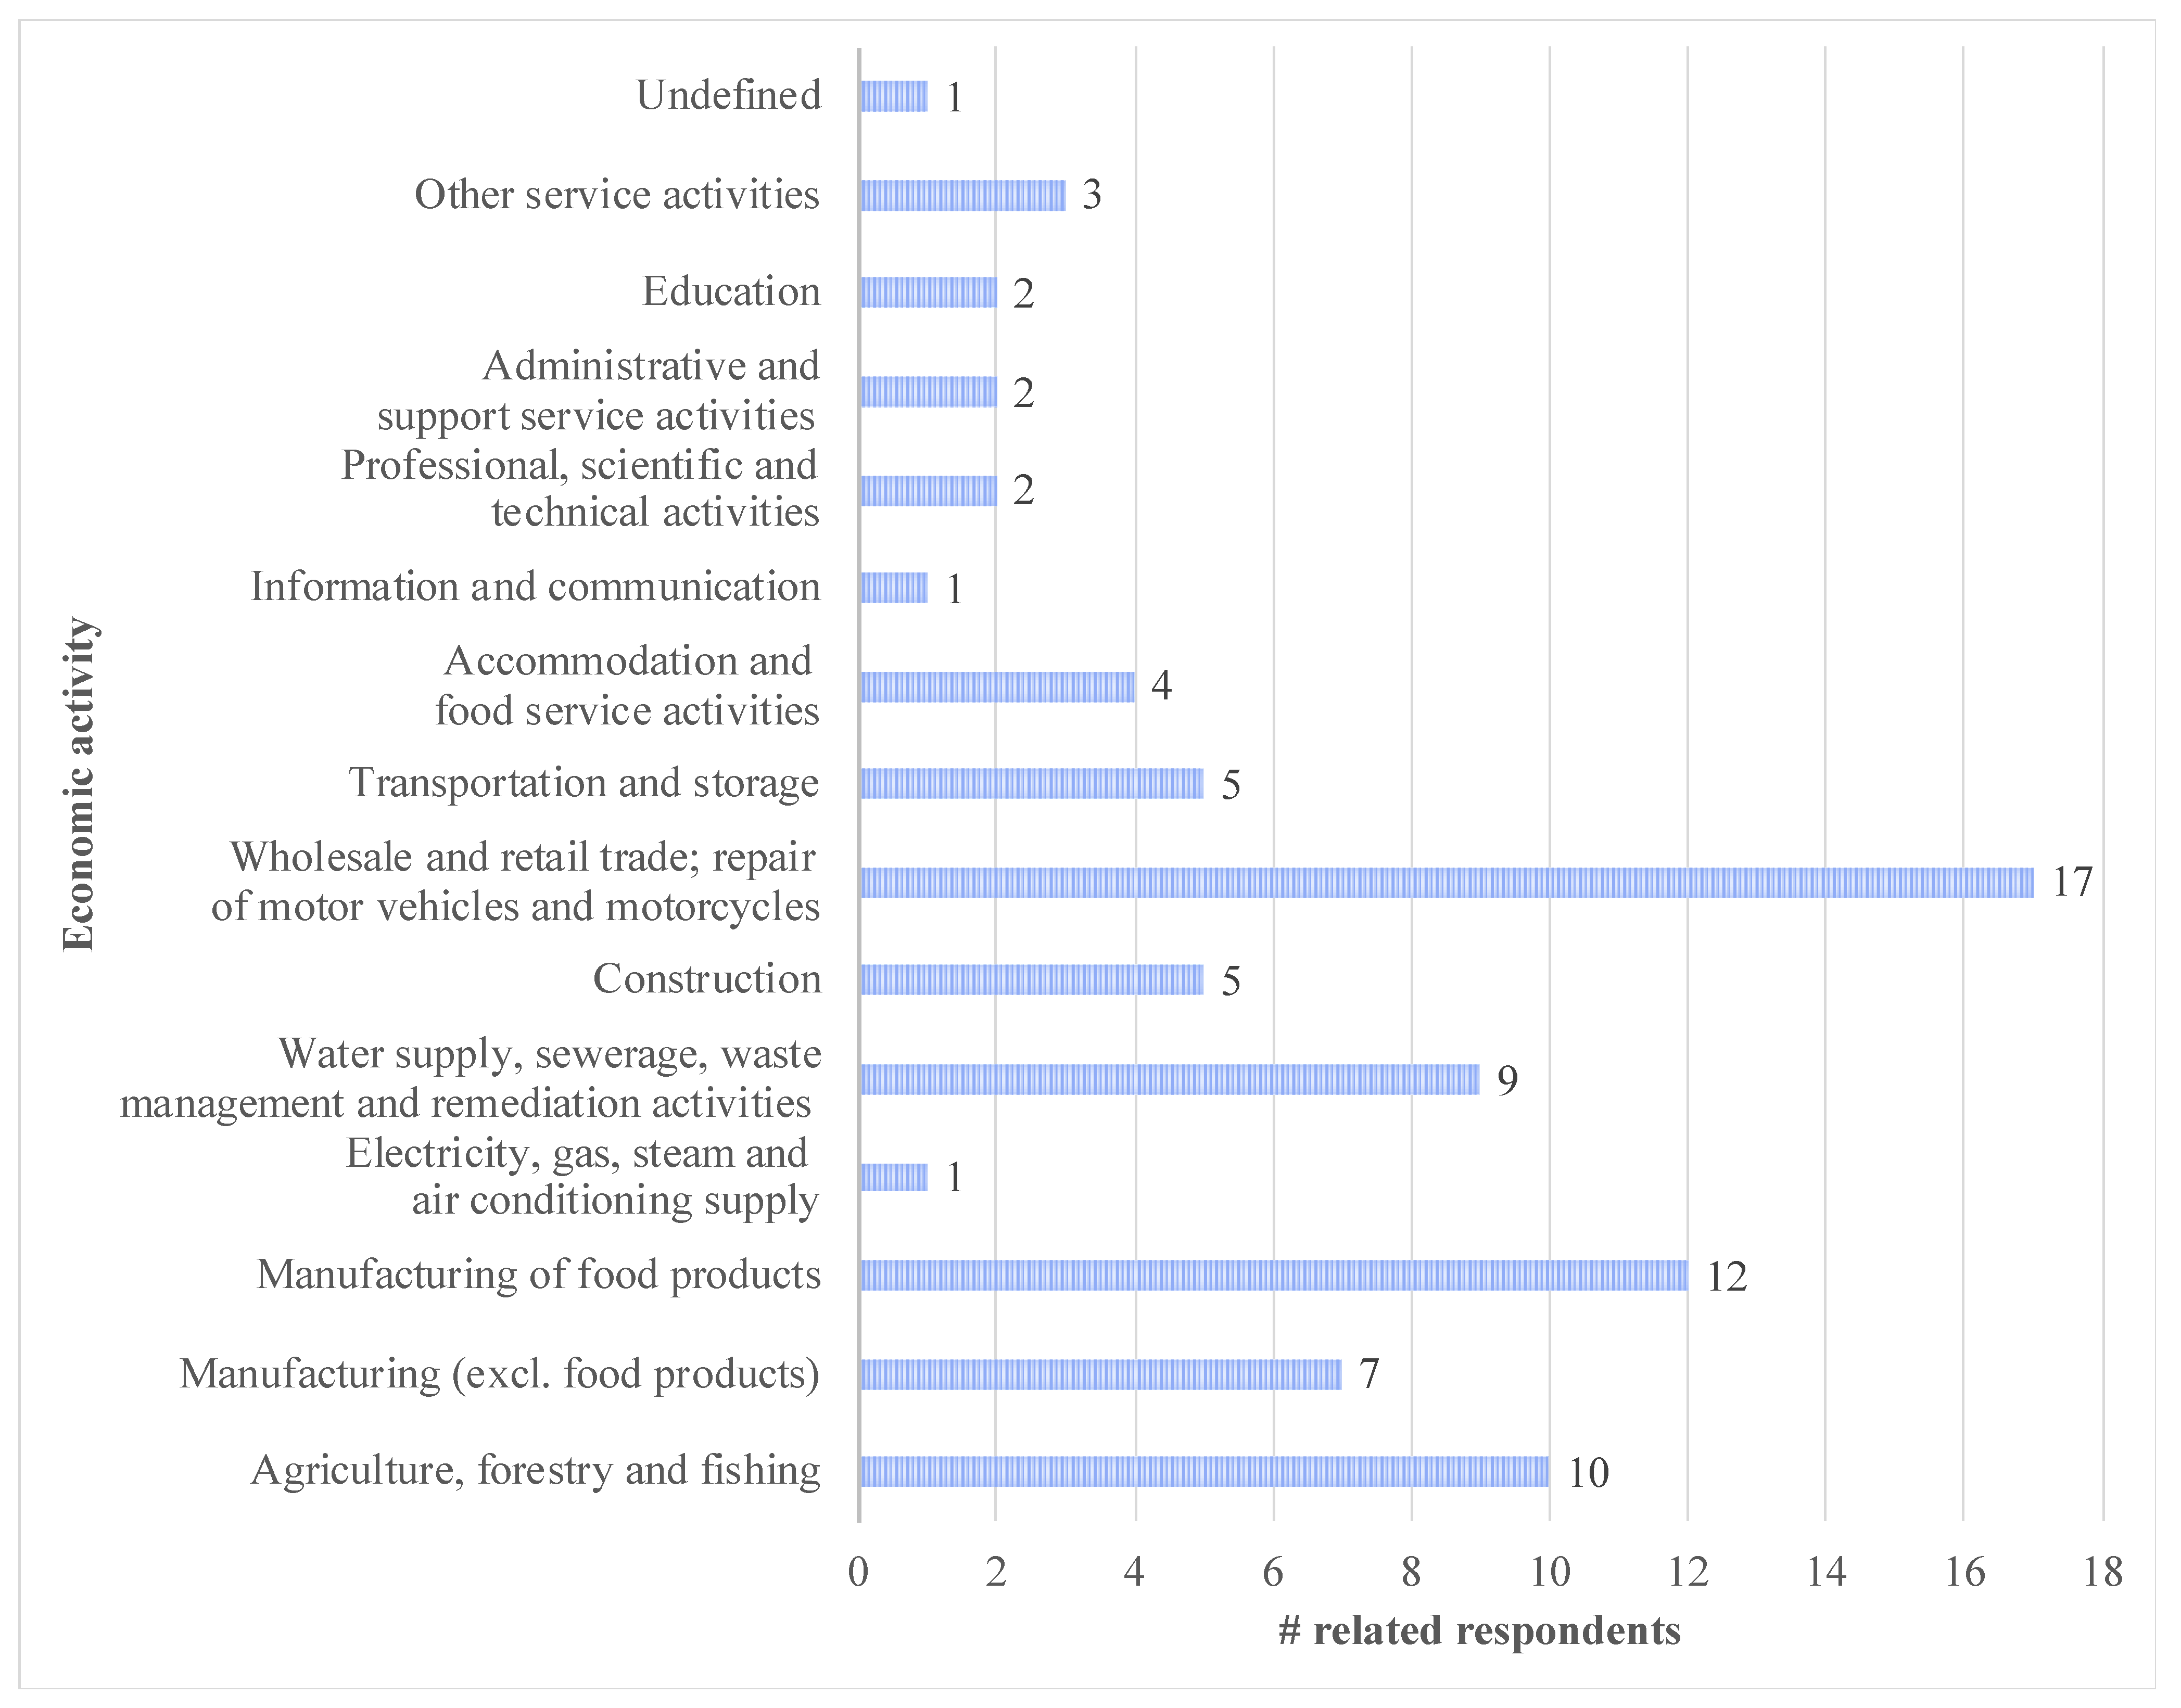
3.4. Sample and Sampling
3.5. Data Collection
3.6. Data Analysis
4. Results
4.1. Domain Scoping
4.2. Domain Modeling
4.3. Survey Results
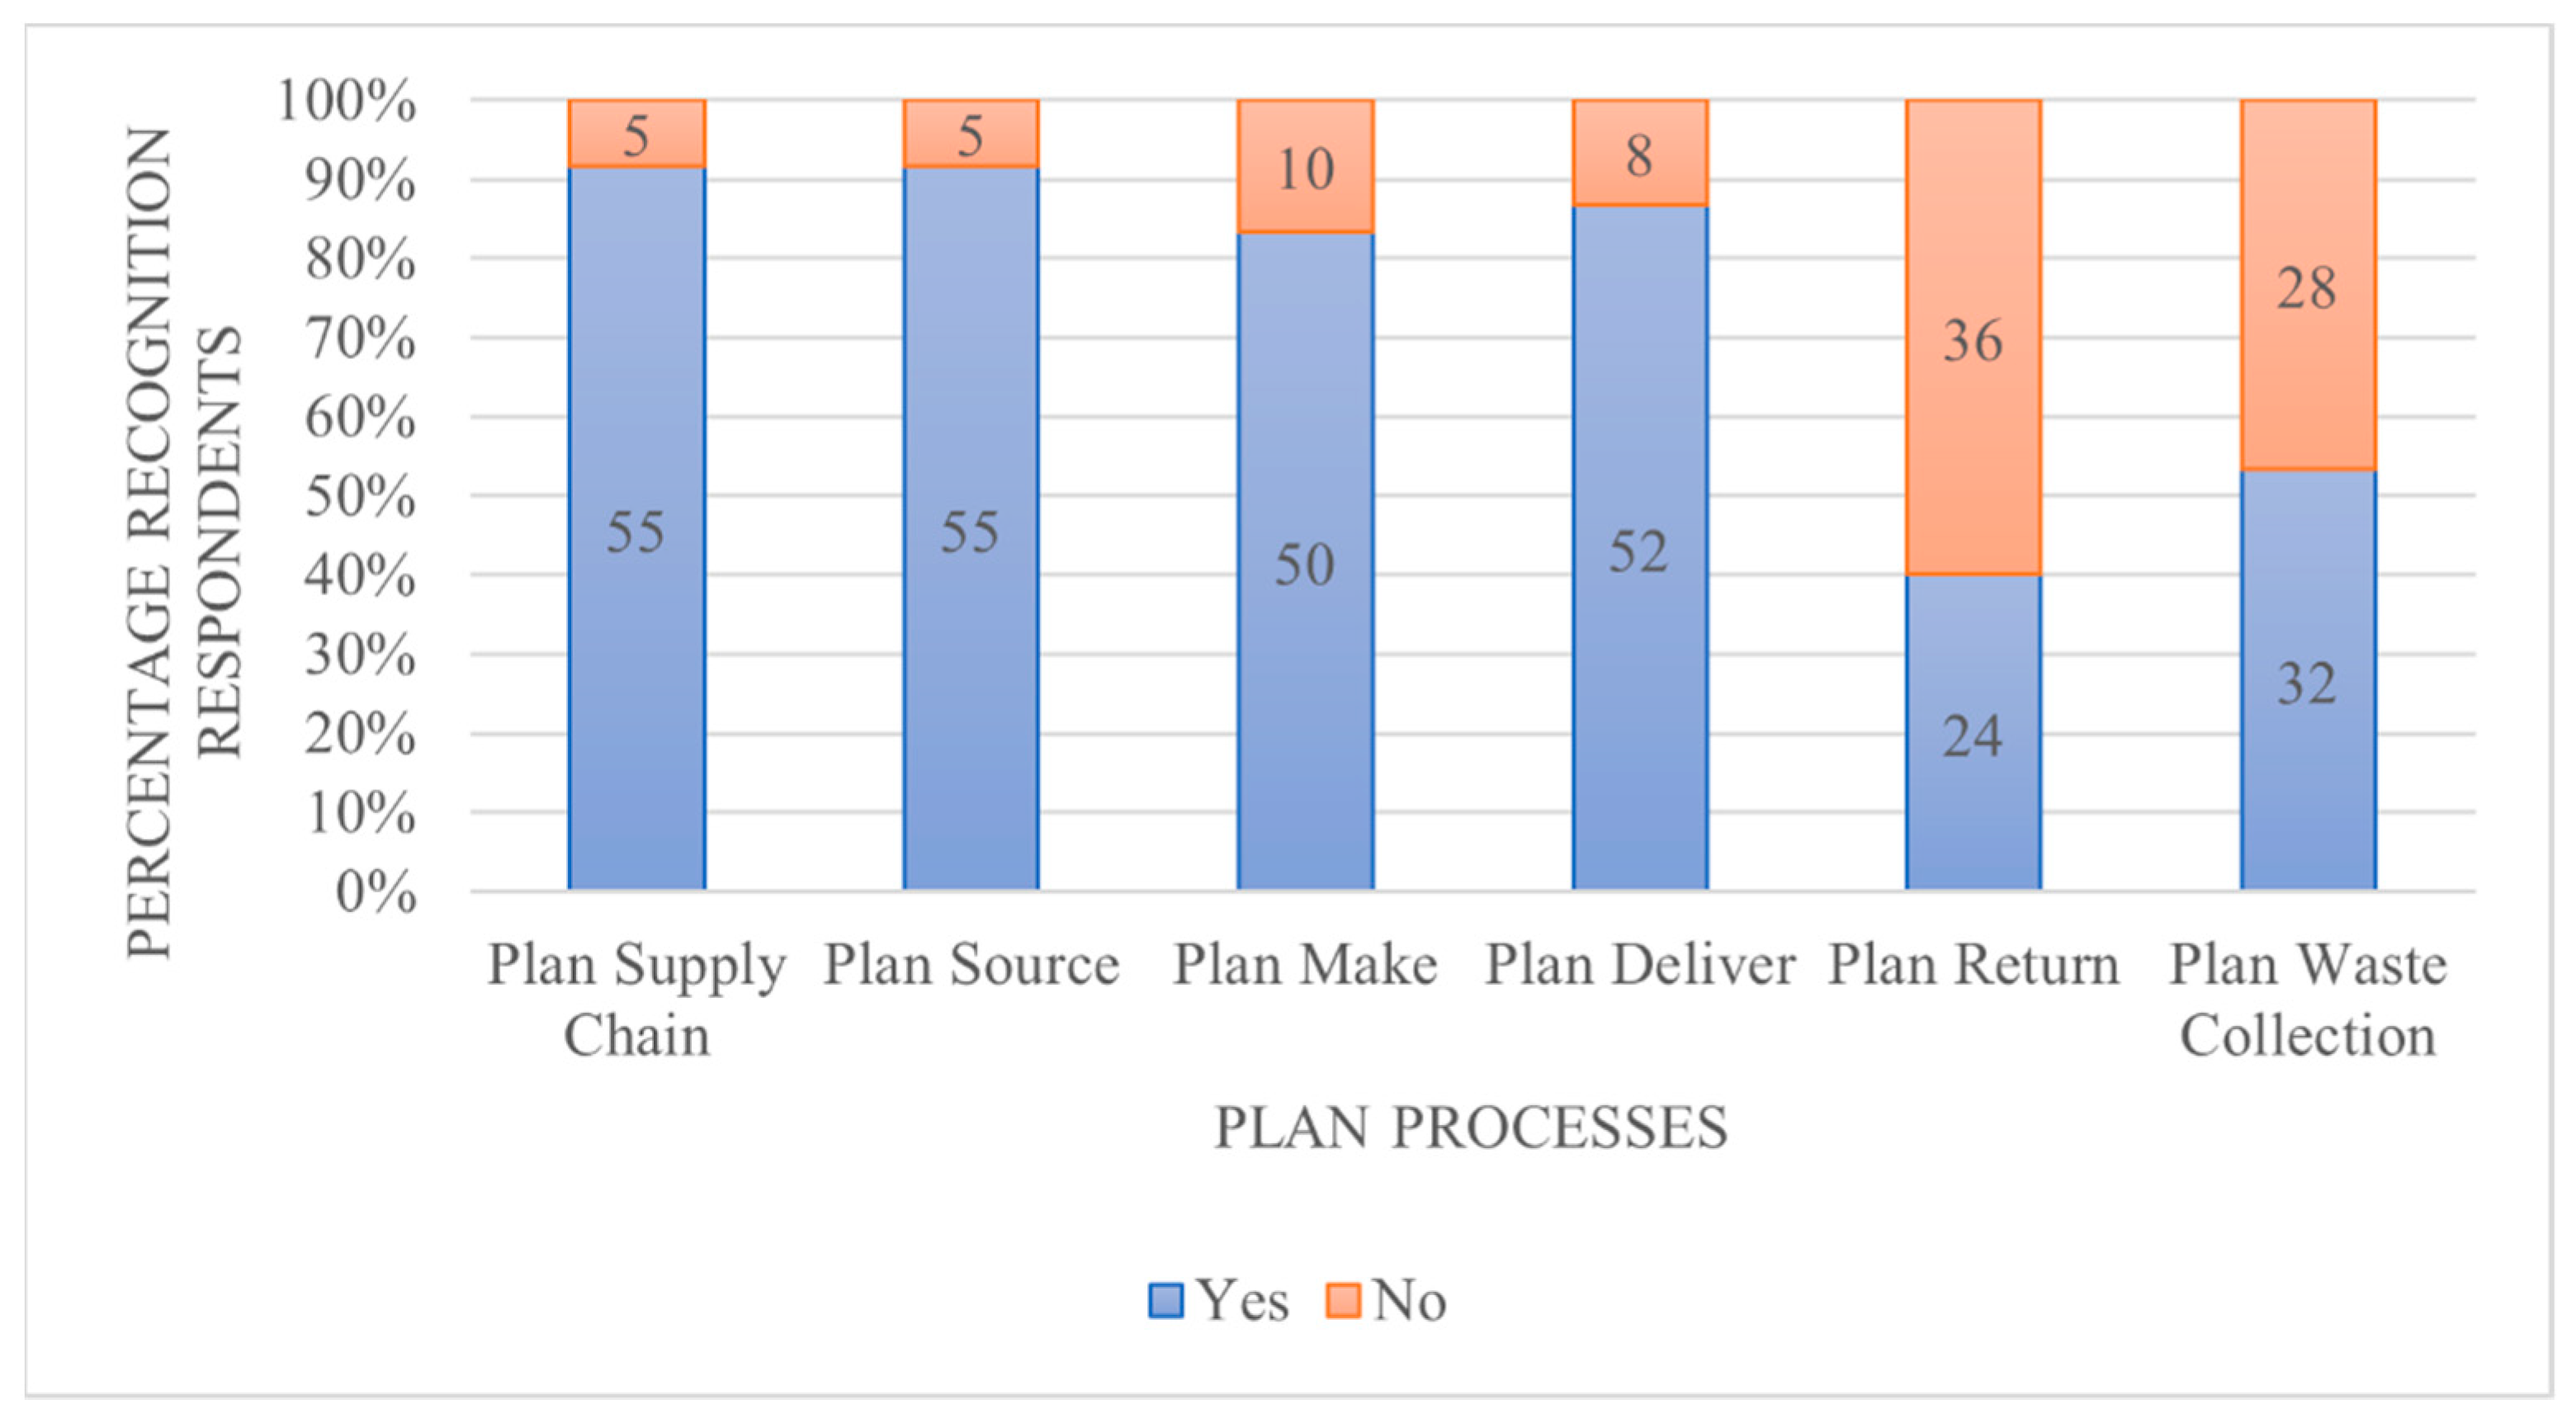
4.3.1. Domain Processes
4.3.2. Cross Relations among Processes
4.3.3. Process Relations
5. Discussion
5.1. Processes in the State-of-the-Practice
5.2. Process Relations
5.3. Limitations
6. Conclusions
Author Contributions
Funding
Institutional Review Board Statement
Informed Consent Statement
Data Availability Statement
Conflicts of Interest
Appendix A. Survey Questions
- All survey questions are displayed in italic
Appendix A.1. Is Your Company Circular?
Appendix A.2. General Question

| o | Agriculture; forestry and fishing | o | Financial and insurance activities |
| o | Mining and quarrying | o | Real estate activities |
| o | Manufacturing | o | Professional, scientific and technical activities |
| o | Manufacturing of food products | o | Administrative and support service activities |
| o | Electricity, gas, steam and air conditioning supply | o | Public administration and defence; compulsory social security |
| o | Water supply; sewerage, waste management and remediation activities | o | Education |
| o | Construction | o | Human health and social work activities |
| o | Wholesale and retail trade; repair of motor vehicles and motorcycles | o | Arts, entertainment and recreation |
| o | Transportation and storage | o | Other service activities |
| o | Accommodation and food service activities | o | Activities of households as employers; undifferentiated goods- and services- producing activities of households for own use |
| o | Information and communication | o | Activities of extraterritorial organizations and bodies |
| o | Other… |
- 1.
- Plan processes
- 1.1.
- Plan Supply Chain: A baker makes strategic plans for the company in general
- 1.2.
- Plan Source: A baker makes a planning for the sourcing (purchasing) of flour
- 1.3.
- Plan Make: A baker makes a planning for baking bread (e.g., a weekly baking plan)
- 1.4.
- Plan Deliver: A baker makes a planning for delivering bread to customers
- 1.5.
- Plan Return: Mediamarkt makes a planning for how to deal with the return of phones through forecast
- 1.6.
- Plan Waste Collection: A recycling company makes a planning for picking up waste through forecast.
| Yes | No | |
|---|---|---|
| 1.1 Plan Supply Chain | o | o |
| 1.2 Plan Source | o | o |
| 1.3 Plan Make | o | o |
| 1.4 Plan Deliver | o | o |
| 1.5 Plan Return | o | o |
| 1.6 Plan Waste Collection | o | o |
- 2.
- Source processes
- 2.1.
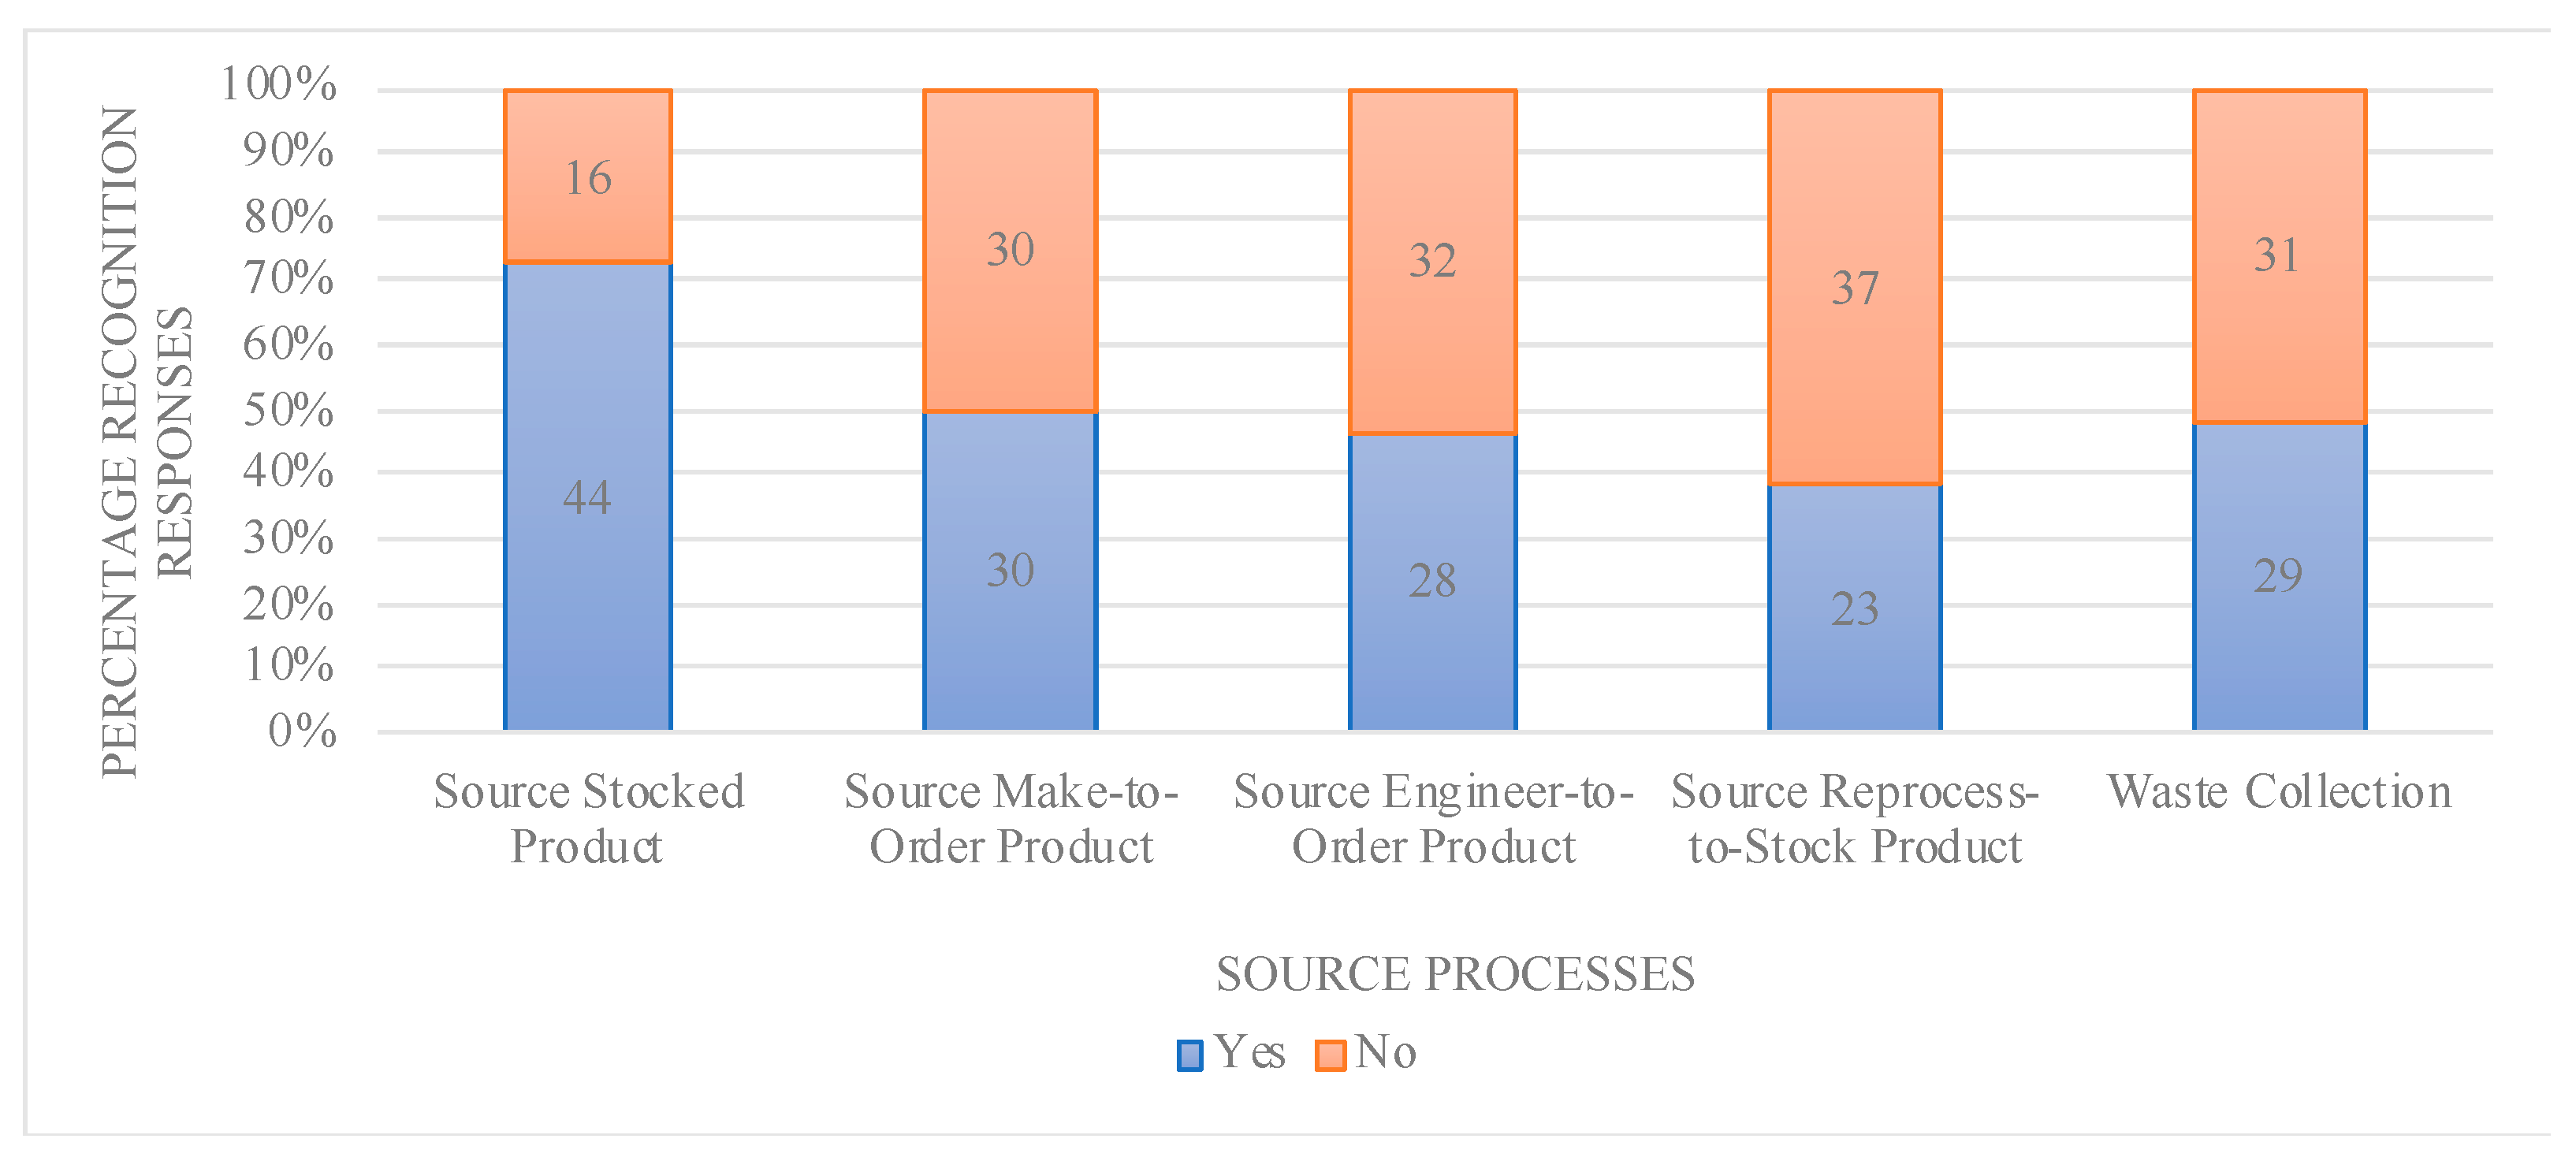
- Source Stocked Product: A restaurant in IKEA sources food before knowing what and how much customers will eat. Sourcing is based on sales forecast.
- 2.2.
- Source Make-to-Order Product: A restaurant where customers are required to make reservation, the sourcing of ingredients required for meals is based on the number of reservations and menus selected. Sourcing is based on customer order.
- 2.3.
- Source Engineer-to-Order Product: A restaurant sources ingredients required for the meals of a wedding based on specified preferences of the couple (not necessarily based on fixed menus). Sourcing is based on the unique preferences of a customer order.
- 2.4.
- Source Reprocess-to-Stock Product: A second-hand clothing sorting- and distribution center sources already used clothing depending on the amount available. Sourcing is based on the availability of materials.
- 2.5.
- Waste Collection: A company that recycles waste obtains orders from customers to collect waste and then picks it up. Sourcing is based on service contracts of waste disposing customers and availability of waste, yet independent of sales forecast. (Sourcing based on collecting household waste, collecting empty beer glasses, etc. fall in this category).
| Yes | No | |
|---|---|---|
| 2.1 Source Stocked Product | o | o |
| 2.2 Source Make-to-Order Product | o | o |
| 2.3 Source Engineer-to-Order Product | o | o |
| 2.4 Source Reprocess-to-Stock Product | o | o |
| 2.5 Waste Collection | o | o |
- ○
- Yes
- ○
- No
- ○
- Other …
- ○
- Yes
- ○
- No
- ○
- Other …
- 3.
- Make processes
- 3.1.
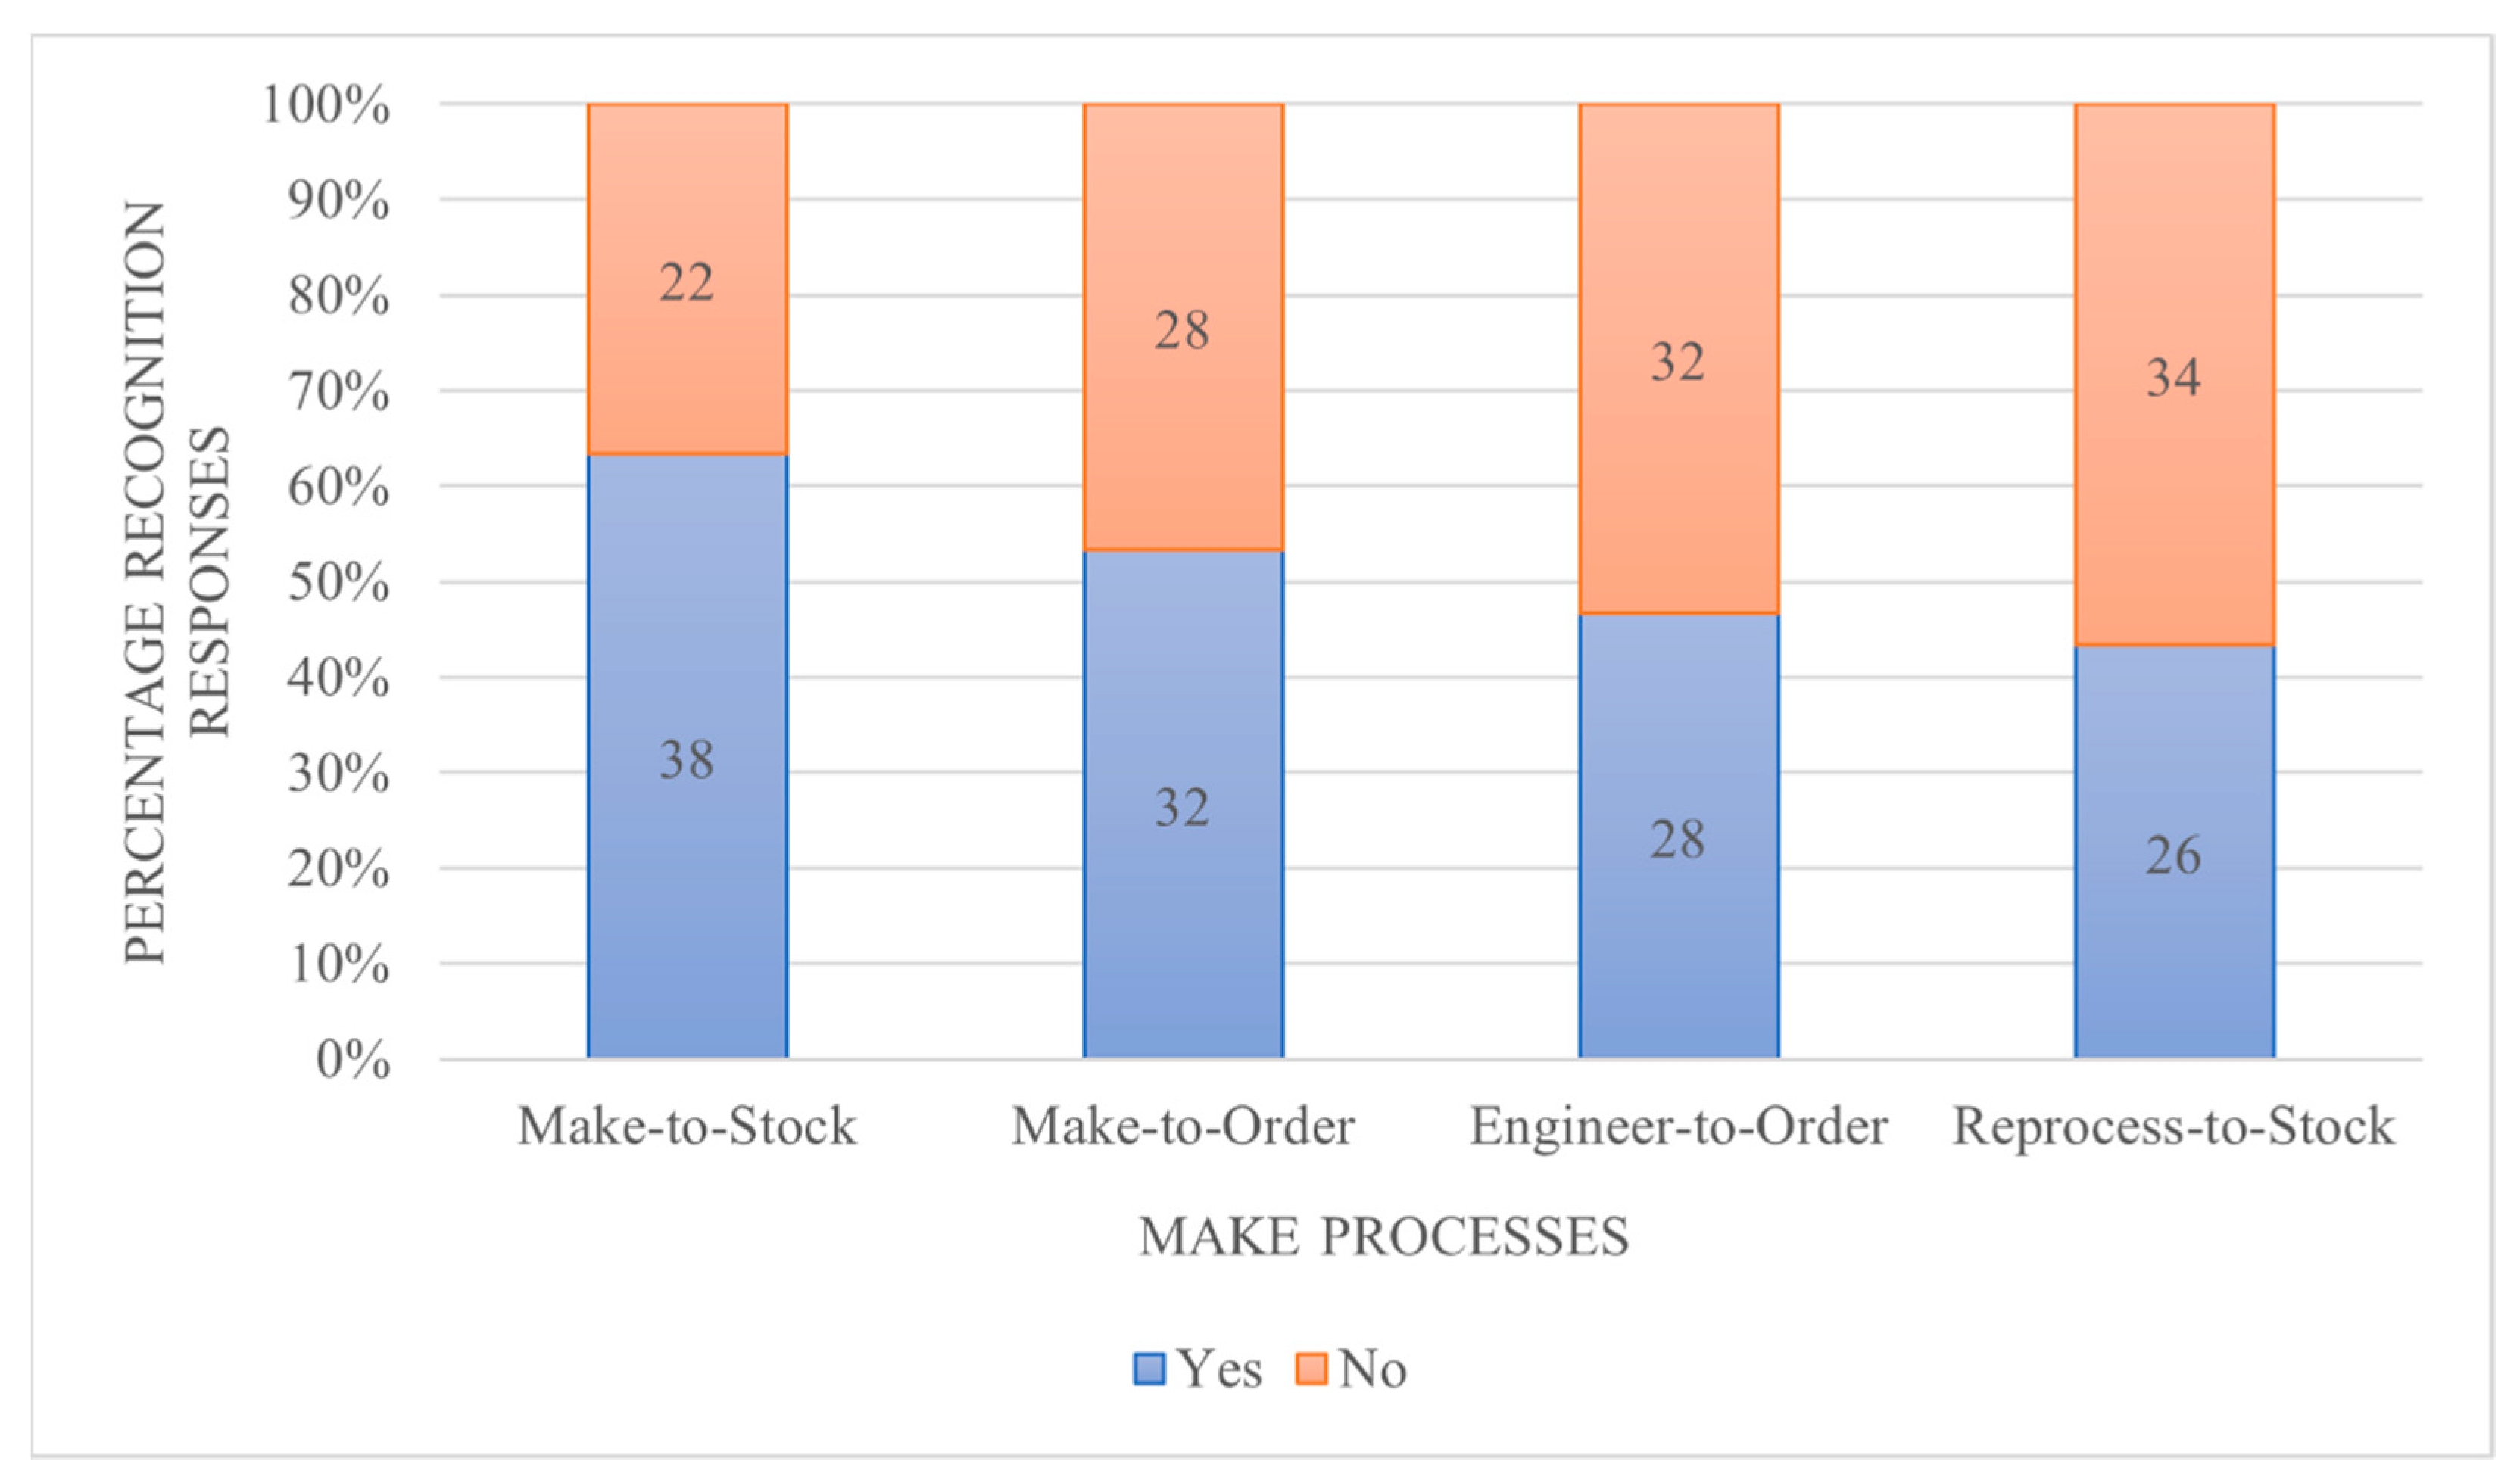
- Make-to-Stock: A restaurant in IKEA makes food ready for the customer to pick, before knowing what and how much customers will eat. Production is based on sales forecast with standard outputs.
- 3.2.
- Make-to-Order: A restaurant where customers are required to make reservation, makes ordered meals from already defined menus. Production or completion is based on customer order within standard outputs.
- 3.3.
- Engineer-to-Order: A restaurant makes food ready for a wedding, based on the specified preferences of the couple. Production is based on the unique preferences of a customer order and results in unique outputs.
- 3.4.
- Reprocess-to-Stock: A company that recycles waste (as its core or side business) recycles waste materials, depending on the amount and quality of waste that is collected. Production is based on the quality and/or quantity of incoming supplies and results in outputs of different quality and quantity.
| Yes | No | |
|---|---|---|
| 3.1 Make-to-Stock | o | o |
| 3.2 Make-to-Order | o | o |
| 3.3 Engineer-to-Order | o | o |
| 3.4 Reprocess-to-Stock | o | o |
- ○
- … Waste Collection (e.g., A Waste recycling company that recycles waste after collecting it)
- ○
- … Source Reprocess-to-Stock Product (e.g., A second-hand clothing sorting- and distribution center that sorts and makes used clothing ready for reuse, after sourcing the used clothes)
- ○
- Other …
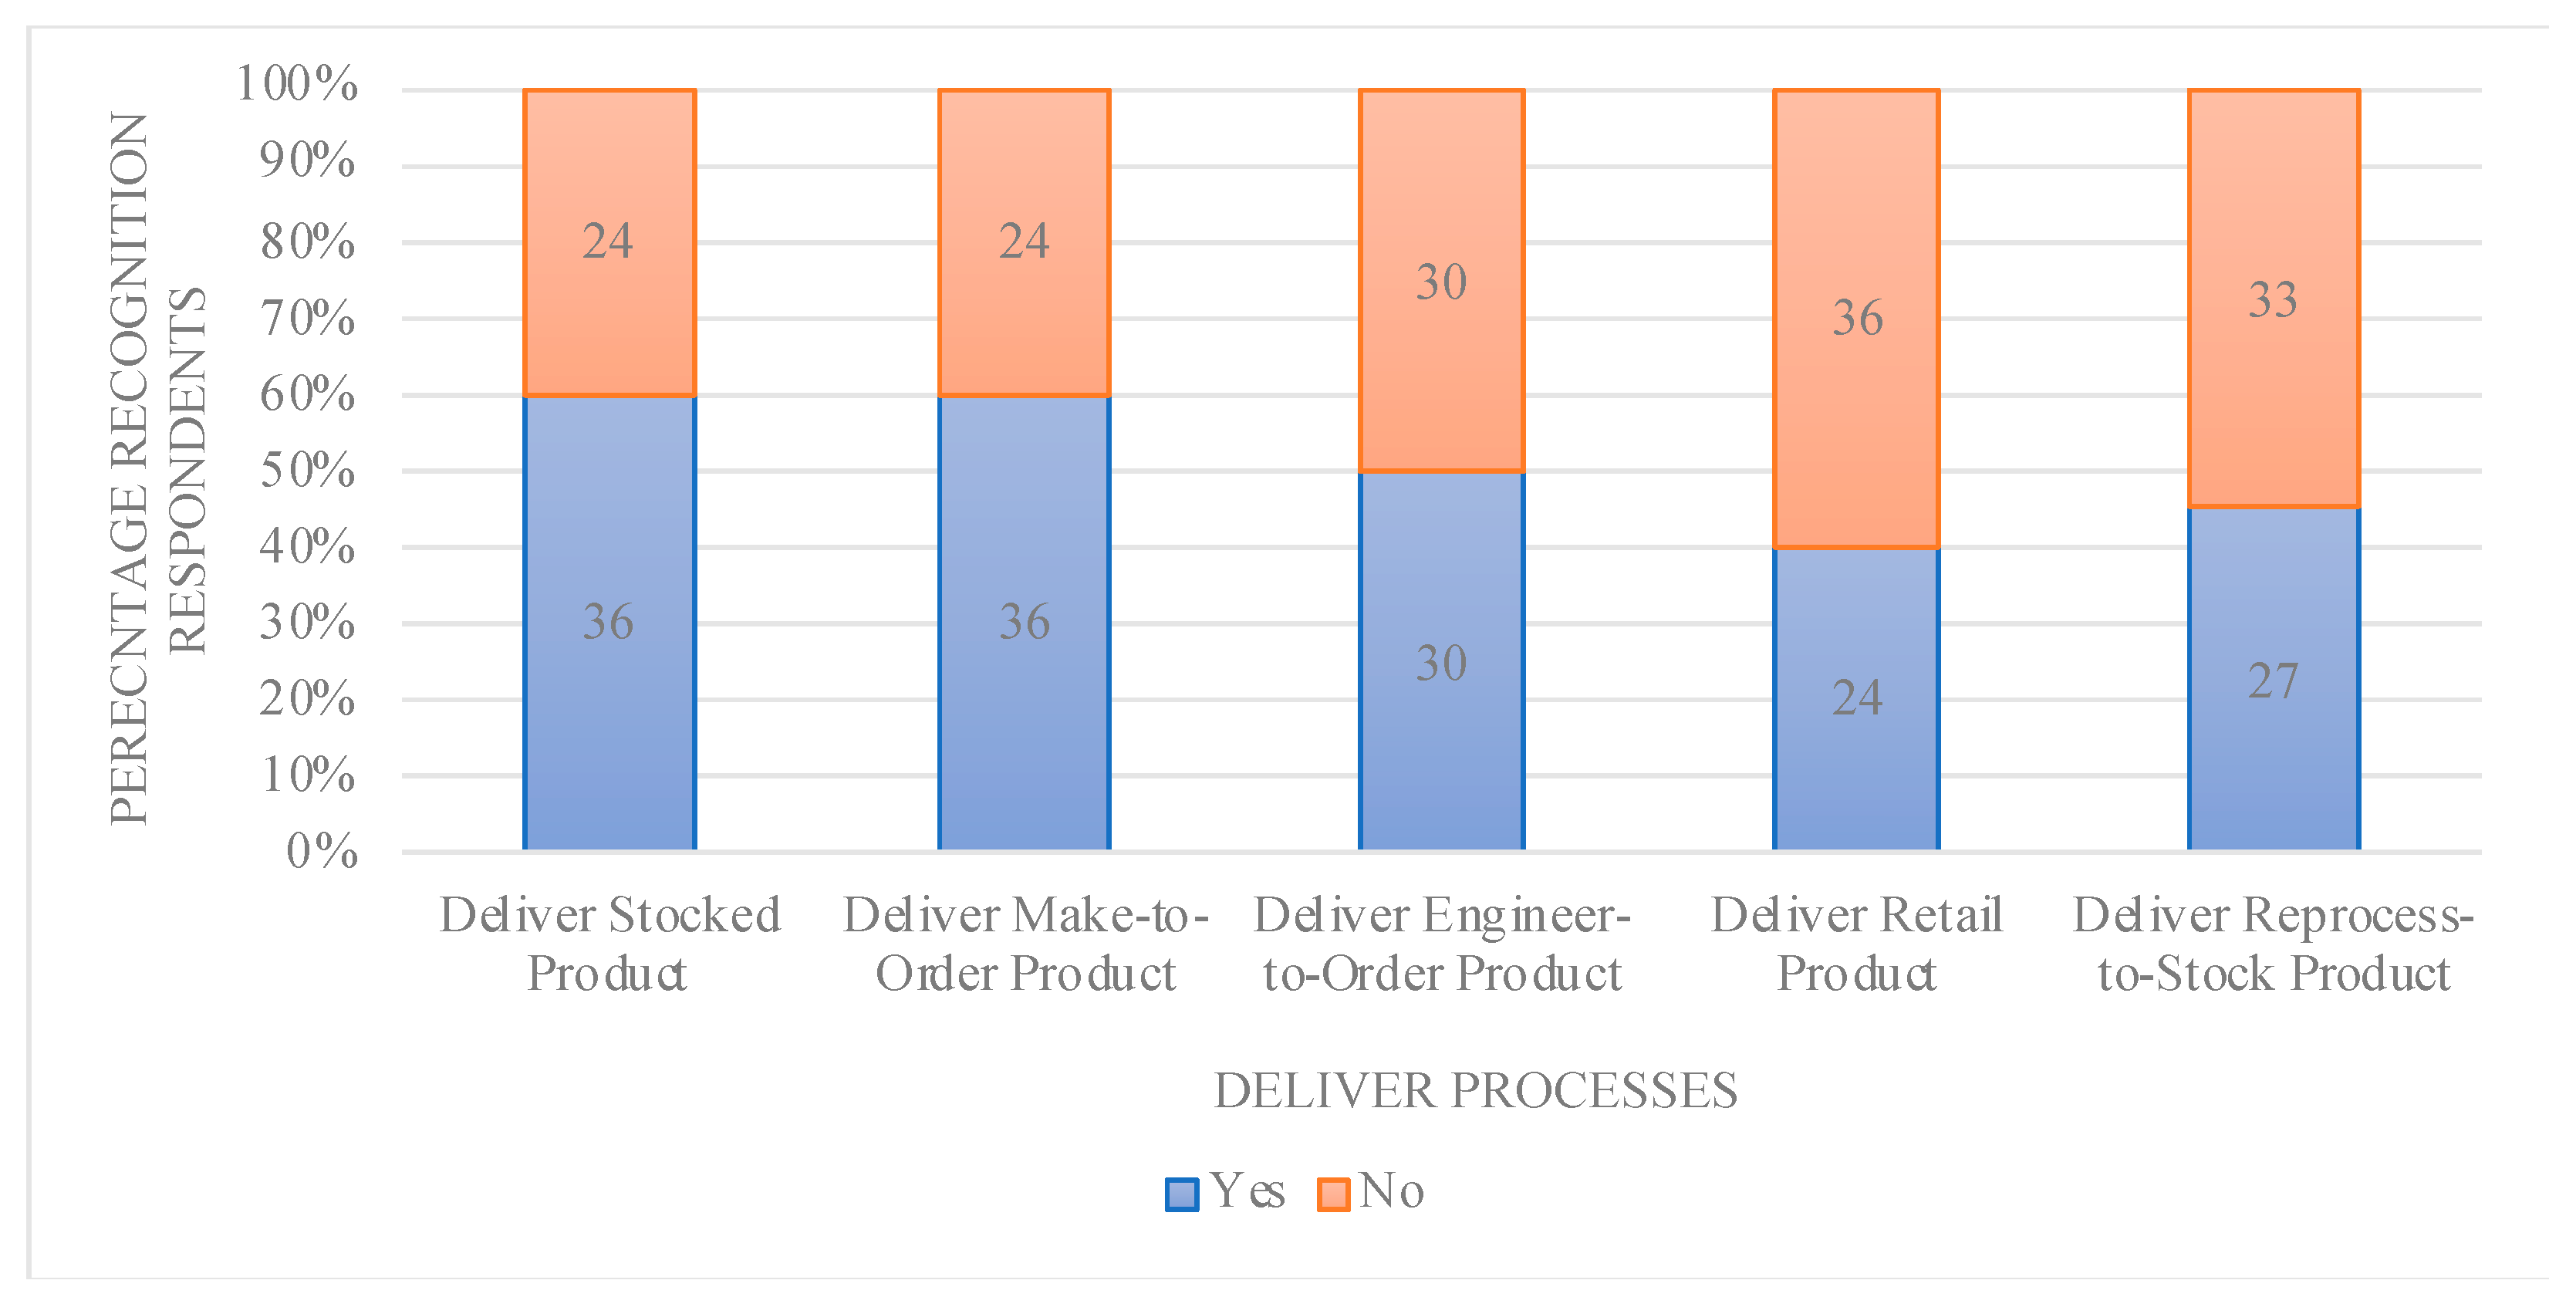
- 4.
- Deliver processes
- 4.1.
- Deliver Stocked Product: IKEA sells finished food at its restaurant that was made ready before knowing what and how much customers would eat. Delivery is based on sales forecast with standard outputs.
- 4.2.
- Deliver Make-to-Order Product: A restaurant delivers ordered meals from a menu to customers. Delivery is based on customer order with standard outputs.
- 4.3.
- Deliver Engineer-to-Order Product: A restaurant delivers food at a wedding according to the unique preferences of the couple. Delivery is based on the unique preferences of a customer with unique outputs.
- 4.4.
- Deliver Retail Product: A supermarket stocks its shelf with finished products and sells it to customers. Delivery is based on acquiring, merchandising and selling finished goods at a retail store.
- 4.5.
- Deliver Reprocess-to-Stock Product: A waste recycling company delivers recycled paper. Delivery is based on products that are sourced or made based on the quality and/or quantity of incoming supplies.
| Yes | No | |
|---|---|---|
| 4.1 Deliver Stocked Product | o | o |
| 4.2 Deliver Make-to-Order Product | o | o |
| 4.3 Deliver Engineer-to-Order Product | o | o |
| 4.4 Deliver Retail Product | o | o |
| 4.5 Deliver Reprocess-to-Stock Product | o | o |
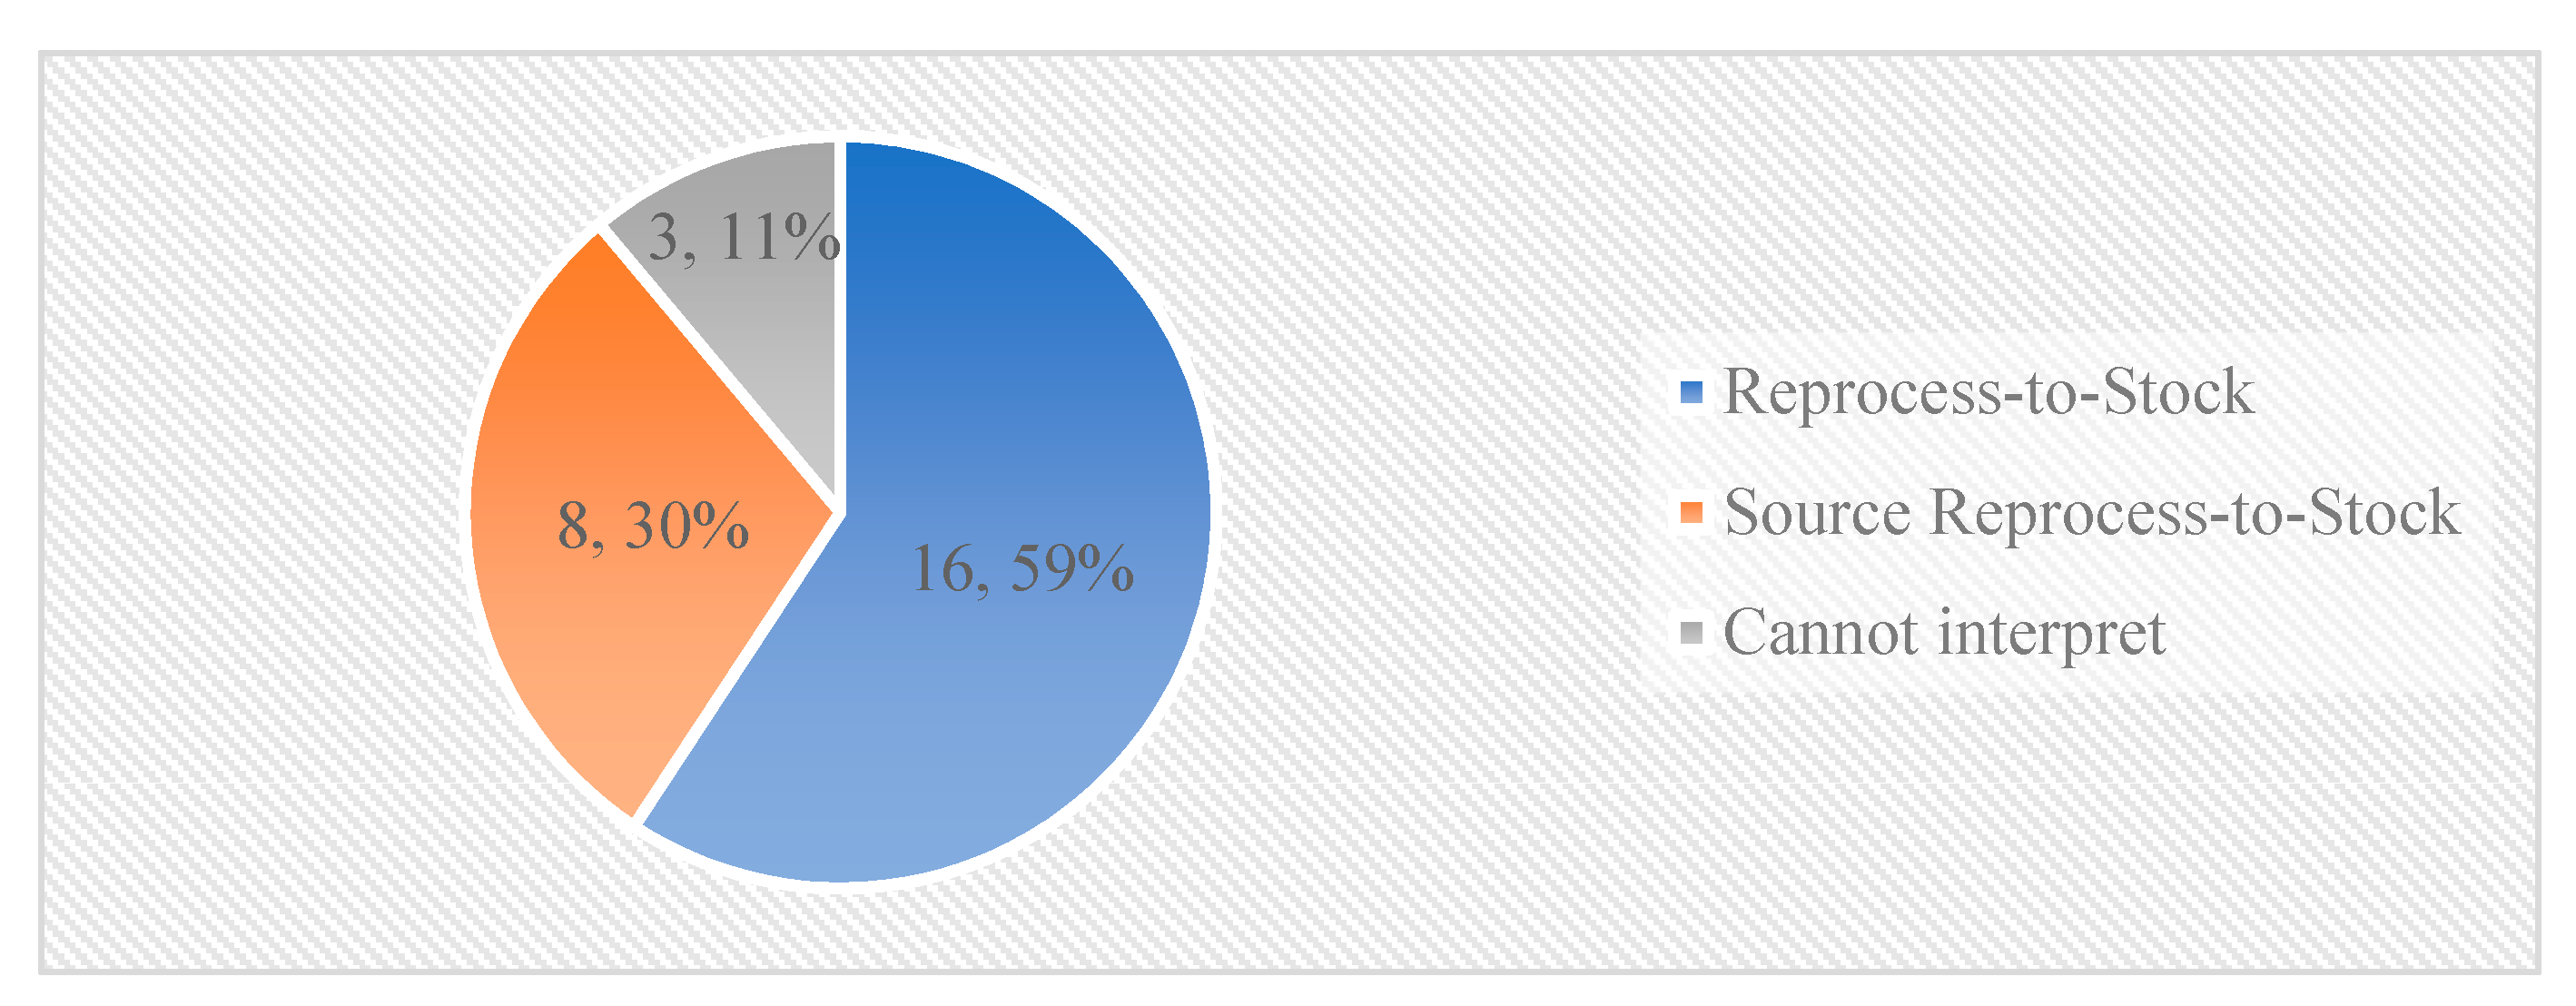
- ○
- …Reprocess-to-Stock (e.g., A waste recycling company delivering recycled paper, after recycling it at the company)
- ○
- …Source Reprocess-to-Stock Product (e.g., A second-hand company that delivers products right after sourcing it)
- ○
- Other…
- ○
- …Source Make-to-Stock Product (e.g., A supermarket that sources finished food products and sells them at the store)
- ○
- …Source Reprocess-to-Stock Product (e.g., A second-hand shop that sources/ receives used products and sells them at the store)
- ○
- Other…
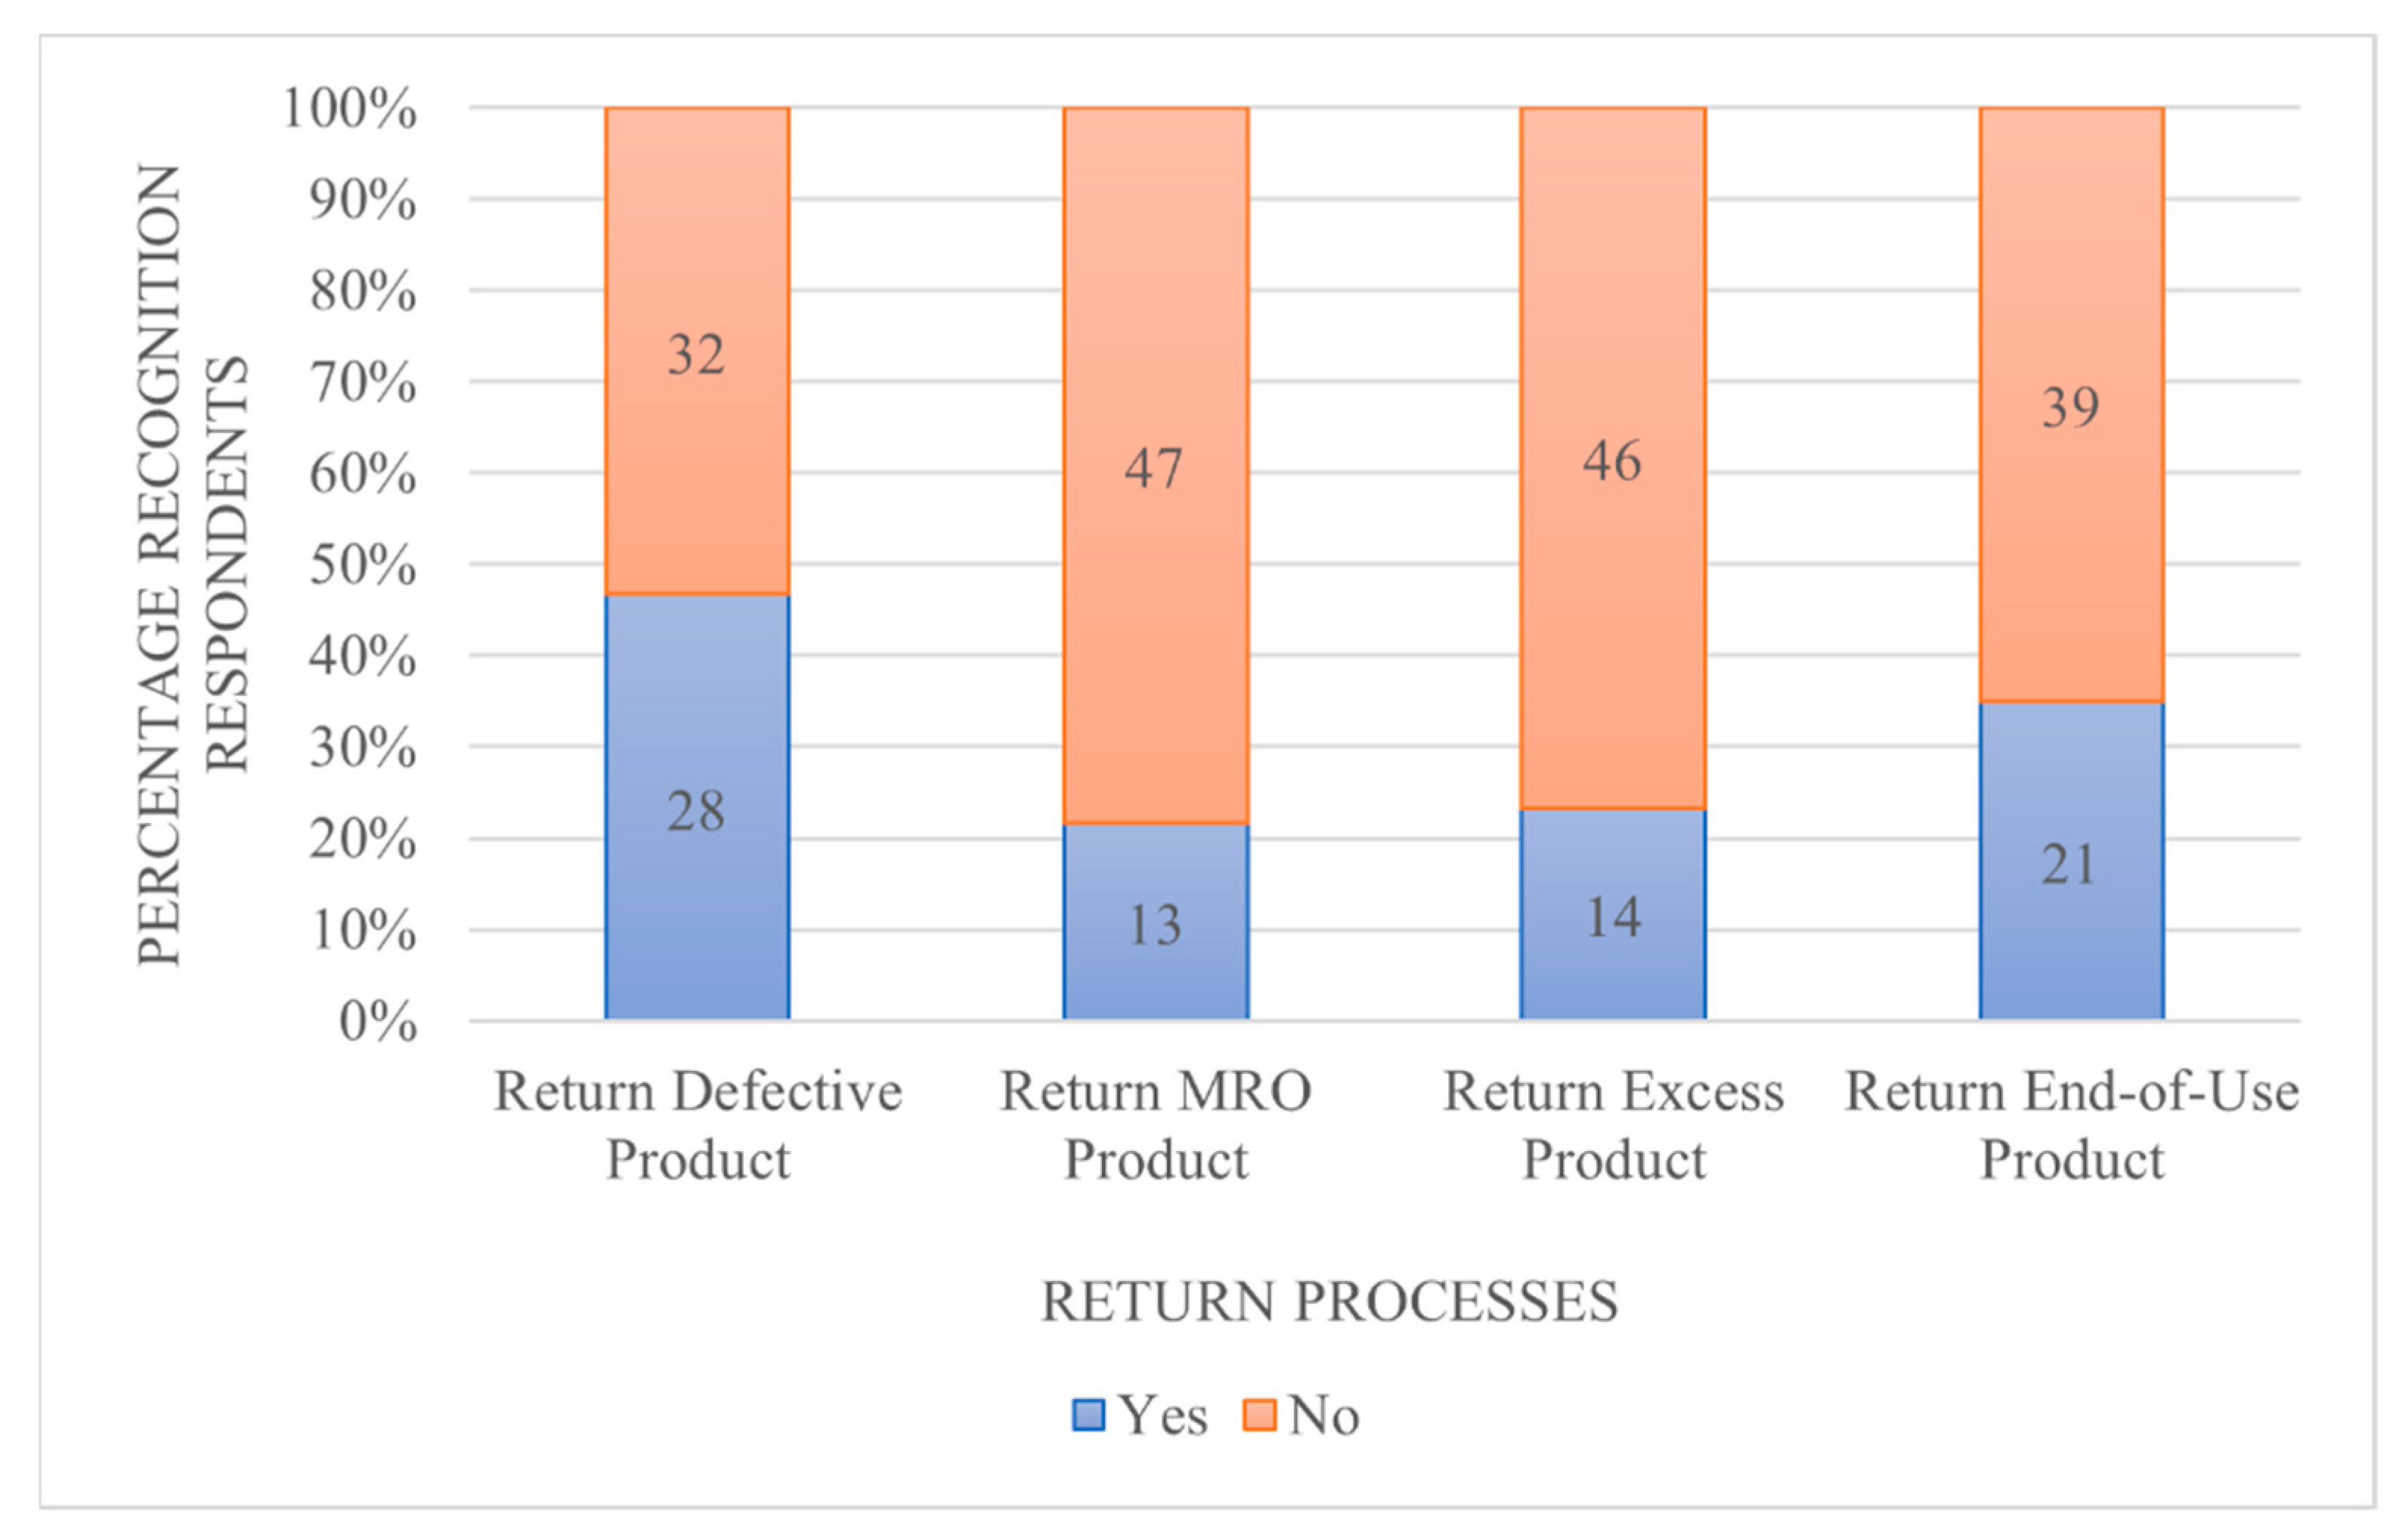
- 5.
- Return processes
- 5.1.
- Return Defective Product: Returning a defective product to the company and receiving the product at the company, as defined by company rules. (e.g., A toys manufacturer identifying and receiving a baby born, which was delivered defective as it could not make a sound).
- 5.2.
- Return MRO Product: Returning a Maintenance, Repair and Overhaul (MRO) product or company assets to the company and receiving it at the company. The purpose is to repair or upgrade it. (e.g., A computer company returning and receiving a computer from a customer for repair).
- 5.3.
- Return Excess Product: Returning excess or aging inventory to the company and receiving it at the company, according to certain terms, in order to reallocate it to a place that can sell the product (e.g., A distribution center that receives clothes from a clothing shop that could not sell anymore in its city, and sends it to be sold in another place).
- 5.4.
- Return End-of-Use Product: Returning a used product to the company and receiving it at the company, in order to reuse, refurbish or remanufacture it (e.g., When a customer returns its used clothes to H&M in order for H&M to deliver it to another organization who can sell it).
| Yes | No | |
|---|---|---|
| 5.1 Return Defective Product | o | o |
| 5.2 Return MRO Product | o | o |
| 5.3 Return Excess Product | o | o |
| 5.4 Return End-of-Use Product | o | o |
Appendix A.3. Other
- ○
- Via a post on LinkedIn
- ○
- Someone I know send it to me
- ○
- I was contacted via mail/message
- ○
- Other…
References
- UN. World Population Prospects: The 2017 Revision, Key Findings and Advance Tables; United Nations: New York, NY, USA, 2017. [Google Scholar]
- FAO. Global Food Losses and Food Waste—Extent, Causes and Prevention; FAO: Rome, Italy, 2011. [Google Scholar]
- OECD. Perspectives on Global Development 2012—Social Cohesion in a Shifting World; OECD Publishing: Paris, France, 2011. [Google Scholar]
- Ellen MacArthur Foundation. Towards the Circular Economy. Economic and Business Rationale for an Accelerated Transition; EMF: Cowes, UK, 2013; Volume 1. [Google Scholar]
- UN. Goal 12: Ensure Sustainable Consumption and Production Patterns. Available online: https://www.un.org/sustainabledevelopment/sustainable-consumption-production/ (accessed on 2 September 2020).
- Ellen MacArthur Foundation. Towards the Circular Economy. Opportunities for the Consumer Goods Sector; EMF: Cowes, UK, 2013; Volume 2. [Google Scholar]
- Ellen MacArthur Foundation. Towards the Circular Economy. Accelerating the Scale-up Across Global Supply Chains; EMF: Cowes, UK, 2014; Volume 3. [Google Scholar]
- Ellen MacArthur Foundation. Growth within: A Circular Economy Vision for a Competitive Europe; EMF: Cowes, UK, 2015. [Google Scholar]
- Jawahir, I.S.; Bradley, R. Technological Elements of Circular Economy and the Principles of 6R-Based Closed-Loop Material Flow in Sustainable Manufacturing. Procedia CIRP 2016, 40, 103–108. [Google Scholar] [CrossRef] [Green Version]
- McDowall, W.; Geng, Y.; Huang, B.; Barteková, E.; Bleischwitz, R.; Türkeli, S.; Kemp, R.; Doménech, T. Circular economy policies in China and Europe. J. Ind. Ecol. 2017, 21, 651–661. [Google Scholar] [CrossRef] [Green Version]
- Ghisellini, P.; Cialani, C.; Ulgiati, S. A review on circular economy: The expected transition to a balanced interplay of environmental and economic systems. J. Clean. Prod. 2016, 114, 11–32. [Google Scholar] [CrossRef]
- PACE. The Circularity GAP Report 2020; Ruparo: Amsterdam, The Netherlands, 2020. [Google Scholar]
- Huan, S.H.; Sheoran, S.K.; Wang, G. A review and analysis of supply chain operations reference (SCOR) model. Supply Chain Manag. Int. J. 2004, 9, 23–29. [Google Scholar] [CrossRef]
- Lambert, D.M.; García-Dastugue, S.J.; Croxton, K.L. An evaluation of process—Oriented supply chain management frameworks. J. Bus. Logist. 2005, 26, 25–51. [Google Scholar] [CrossRef]
- Ntabe, E.N.; LeBela, L.; Munsona, A.D.; Santa-Eulaliab, L.A. A systematic literature review of the supply chain operations reference (SCOR) model application with special attention to environmental issues. Int. J. Prod. Econ. 2015, 169, 310–332. [Google Scholar] [CrossRef]
- APICS. Supply Chain Operations Reference Model SCOR. Version 12.0; APICS: Chicago, IL, USA, 2017. [Google Scholar]
- APICS. Quick Reference Guide. SCOR Supply Chain Operations Reference Model. 2017. Available online: http://www.apics.org/docs/default-source/scor-p-toolkits/apics-scc-scor-quick-reference-guide.pdf. (accessed on 21 September 2020).
- Xiao, R.; Cai, Z.; Zhang, X. An optimization approach to cycle quality network chain based on improved SCOR model. Prog. Nat. Sci. 2009, 19, 881–890. [Google Scholar] [CrossRef]
- Xiao, R.; Cai, Z.; Zhang, X. An optimization approach to risk decision-making of closed-loop logistics based on SCOR model. Optimization 2012, 61, 1221–1251. [Google Scholar] [CrossRef]
- Tan, Y.; Cai, Z.Y.; Qi, H. A process-based performance analysis for closed-loop agriculture supply chain. In Proceedings of the 2010 International Conference on Intelligent System Design and Engineering Application (ISDEA 2010), Changsha, China, 13–14 October 2010. [Google Scholar]
- Bin, Y.; Zhengying, C. Managing cycle quality chain operation and optimizing cost. In Proceedings of the 2008 International Conference on Wireless Communications, Networking and Mobile Computing (WiCOM 2008), Dalian, China, 12–17 October 2008. [Google Scholar]
- Vegter, D.; van Hillegersberg, J.; Olthaar, M. Supply chains in circular business models: Processes and performance objectives. Resour. Conserv. Recycl. 2020, 162, 105046. [Google Scholar] [CrossRef]
- Kirchherr, J.; Reike, D.; Hekkert, M. Conceptualizing the circular economy: An analysis of 114 definitions. Resour. Conserv. Recycl. 2017, 127, 221–232. [Google Scholar] [CrossRef]
- Ellen MacArthur Foundation. Towards a Circular Economy: Business rationale for an Accelerated Transition; EMF: Cowes, UK, 2015. [Google Scholar]
- Bradley, R.; Jawahir, I.S.; Badurdeen, F.; Rouch, K. A total life cycle cost model (TLCCM) for the circular economy and its application to post-recovery resource allocation. Resour. Conserv. Recycl. 2018, 135, 141–149. [Google Scholar] [CrossRef]
- McDonough, W.; Braungart, M. Cradle to Cradle: Remaking the Way We Make Things; North Point Press: New York, NY, USA, 2002. [Google Scholar]
- Charter, M.; Tischner, U. (Eds.) Sustainable Solutions: Developing Products and Services for the Future; Routledge: New York, NY, USA, 2001. [Google Scholar]
- Ranta, V.; Aarikka-Stenroos, L.; Mäkinen, S.J. Creating value in the circular economy: A structured multiple-case analysis of business models. J. Clean. Prod. 2018, 201, 988–1000. [Google Scholar] [CrossRef]
- European Union. Directive 2008/98/EC of the European Parliament and of the Council of 19 November 2008 on waste and repealing certain Directives. Off. J. Eur. Union. L312/3. Available online: http://data.europa.eu/eli/dir/2008/98/oj (accessed on 25 November 2021).
- Prendeville, S.; Sherry, J. Circular Economy. Is It Enough? Technical Report; EcoDesign Centre: Wales, UK, 2014. [Google Scholar]
- Castellani, V.; Sala, S.; Mirabella, N. Beyond the throwaway society: A life cycle-based assessment of the environmental benefit of reuse. Integr. Environ. Assess. Manag. 2015, 11, 373–382. [Google Scholar] [CrossRef] [PubMed]
- Ghisellini, P.; Ulgiati, S. Circular economy transition in Italy. Achievements, perspectives and constraints. J. Clean. Prod. 2020, 243, 118360. [Google Scholar] [CrossRef]
- Reichel, A.; De Schoenmakere, M.; Gillabel, J. Circular Economy in Europe. Developing the Knowledge Base; European Environment Agency: Copenhagen, Danmark, 2016.
- Zhang, X.; Badurdeen, F.; Rouch, K.; Jawahir, I.S. On improving the product sustainability of metallic automotive components by using the total life-cycle approach and the 6R methodology. In Proceedings of the 11th Global Conference on Sustainable Manufacturing, Berlin, Germany, 23–25 September 2013; pp. 194–199. [Google Scholar]
- Steinhilper, R.; Weiland, F. Exploring New Horizons for Remanufacturing an Up-to-Date Overview of Industries, Products and Technologies. Procedia CIRP 2015, 29, 769–773. [Google Scholar] [CrossRef]
- Huang, S.H.; Sheoran, S.K.; Keskar, H. Computer-assisted supply chain configuration based on supply chain operations reference (SCOR) model. Comput. Ind. Eng. 2005, 48, 377–394. [Google Scholar] [CrossRef]
- Kelley, K.; Clark, B.; Brown, V.; Sitzia, J. Good practice in the conduct and reporting of survey research. Int. J. Qual. Health Care 2003, 15, 261–266. [Google Scholar] [CrossRef] [PubMed] [Green Version]
- De Leeuw, E.; Hox, J.; Dillman, D. International Handbook Of Survey Methodology (2008); Taylor & Francis: New York, NY, USA, 2008. [Google Scholar]
- Chopra, S.; Meindl, P. Supply Chain Management—Strategy, Planning, and Operation, 6th ed.; Pearson Education: New York, NY, USA, 2016. [Google Scholar]
- Sol, L. The SCOR model: A case for circular supply chain management. In Information Technology Group; Wageningen University: Wageningen, The Netherlands, 2018; p. 72. [Google Scholar]
- UN. International Standard Industrial Classification of All Economic Activities—Revision 4; United Nations: New York, NY, USA, 2008. [Google Scholar]
- Scheel, N.T. Drop Shipping as a Marketing Function: A Handbook of Methods and Policies; Quorum Books: Westport, CT, USA, 1990. [Google Scholar]
- Francia-Arias, G.; Marín-Vílchez, J.; Macassi-Jauregui, I.; Raymundo-Ibañez, C.; Dominguez, F. SCOR Model. for a Dual-Channel Supply Chain using Drop Shipping to Reduce Overstock in Small- and Medium-Sized Retail. Enterprises. IOP Conf. Ser. Mater. Sci. Eng. 2020, 796, 012010. [Google Scholar] [CrossRef]
- Ponto, J. Understanding and Evaluating Survey Research. J. Adv. Pract. Oncol. 2015, 6, 168–171. [Google Scholar] [PubMed]
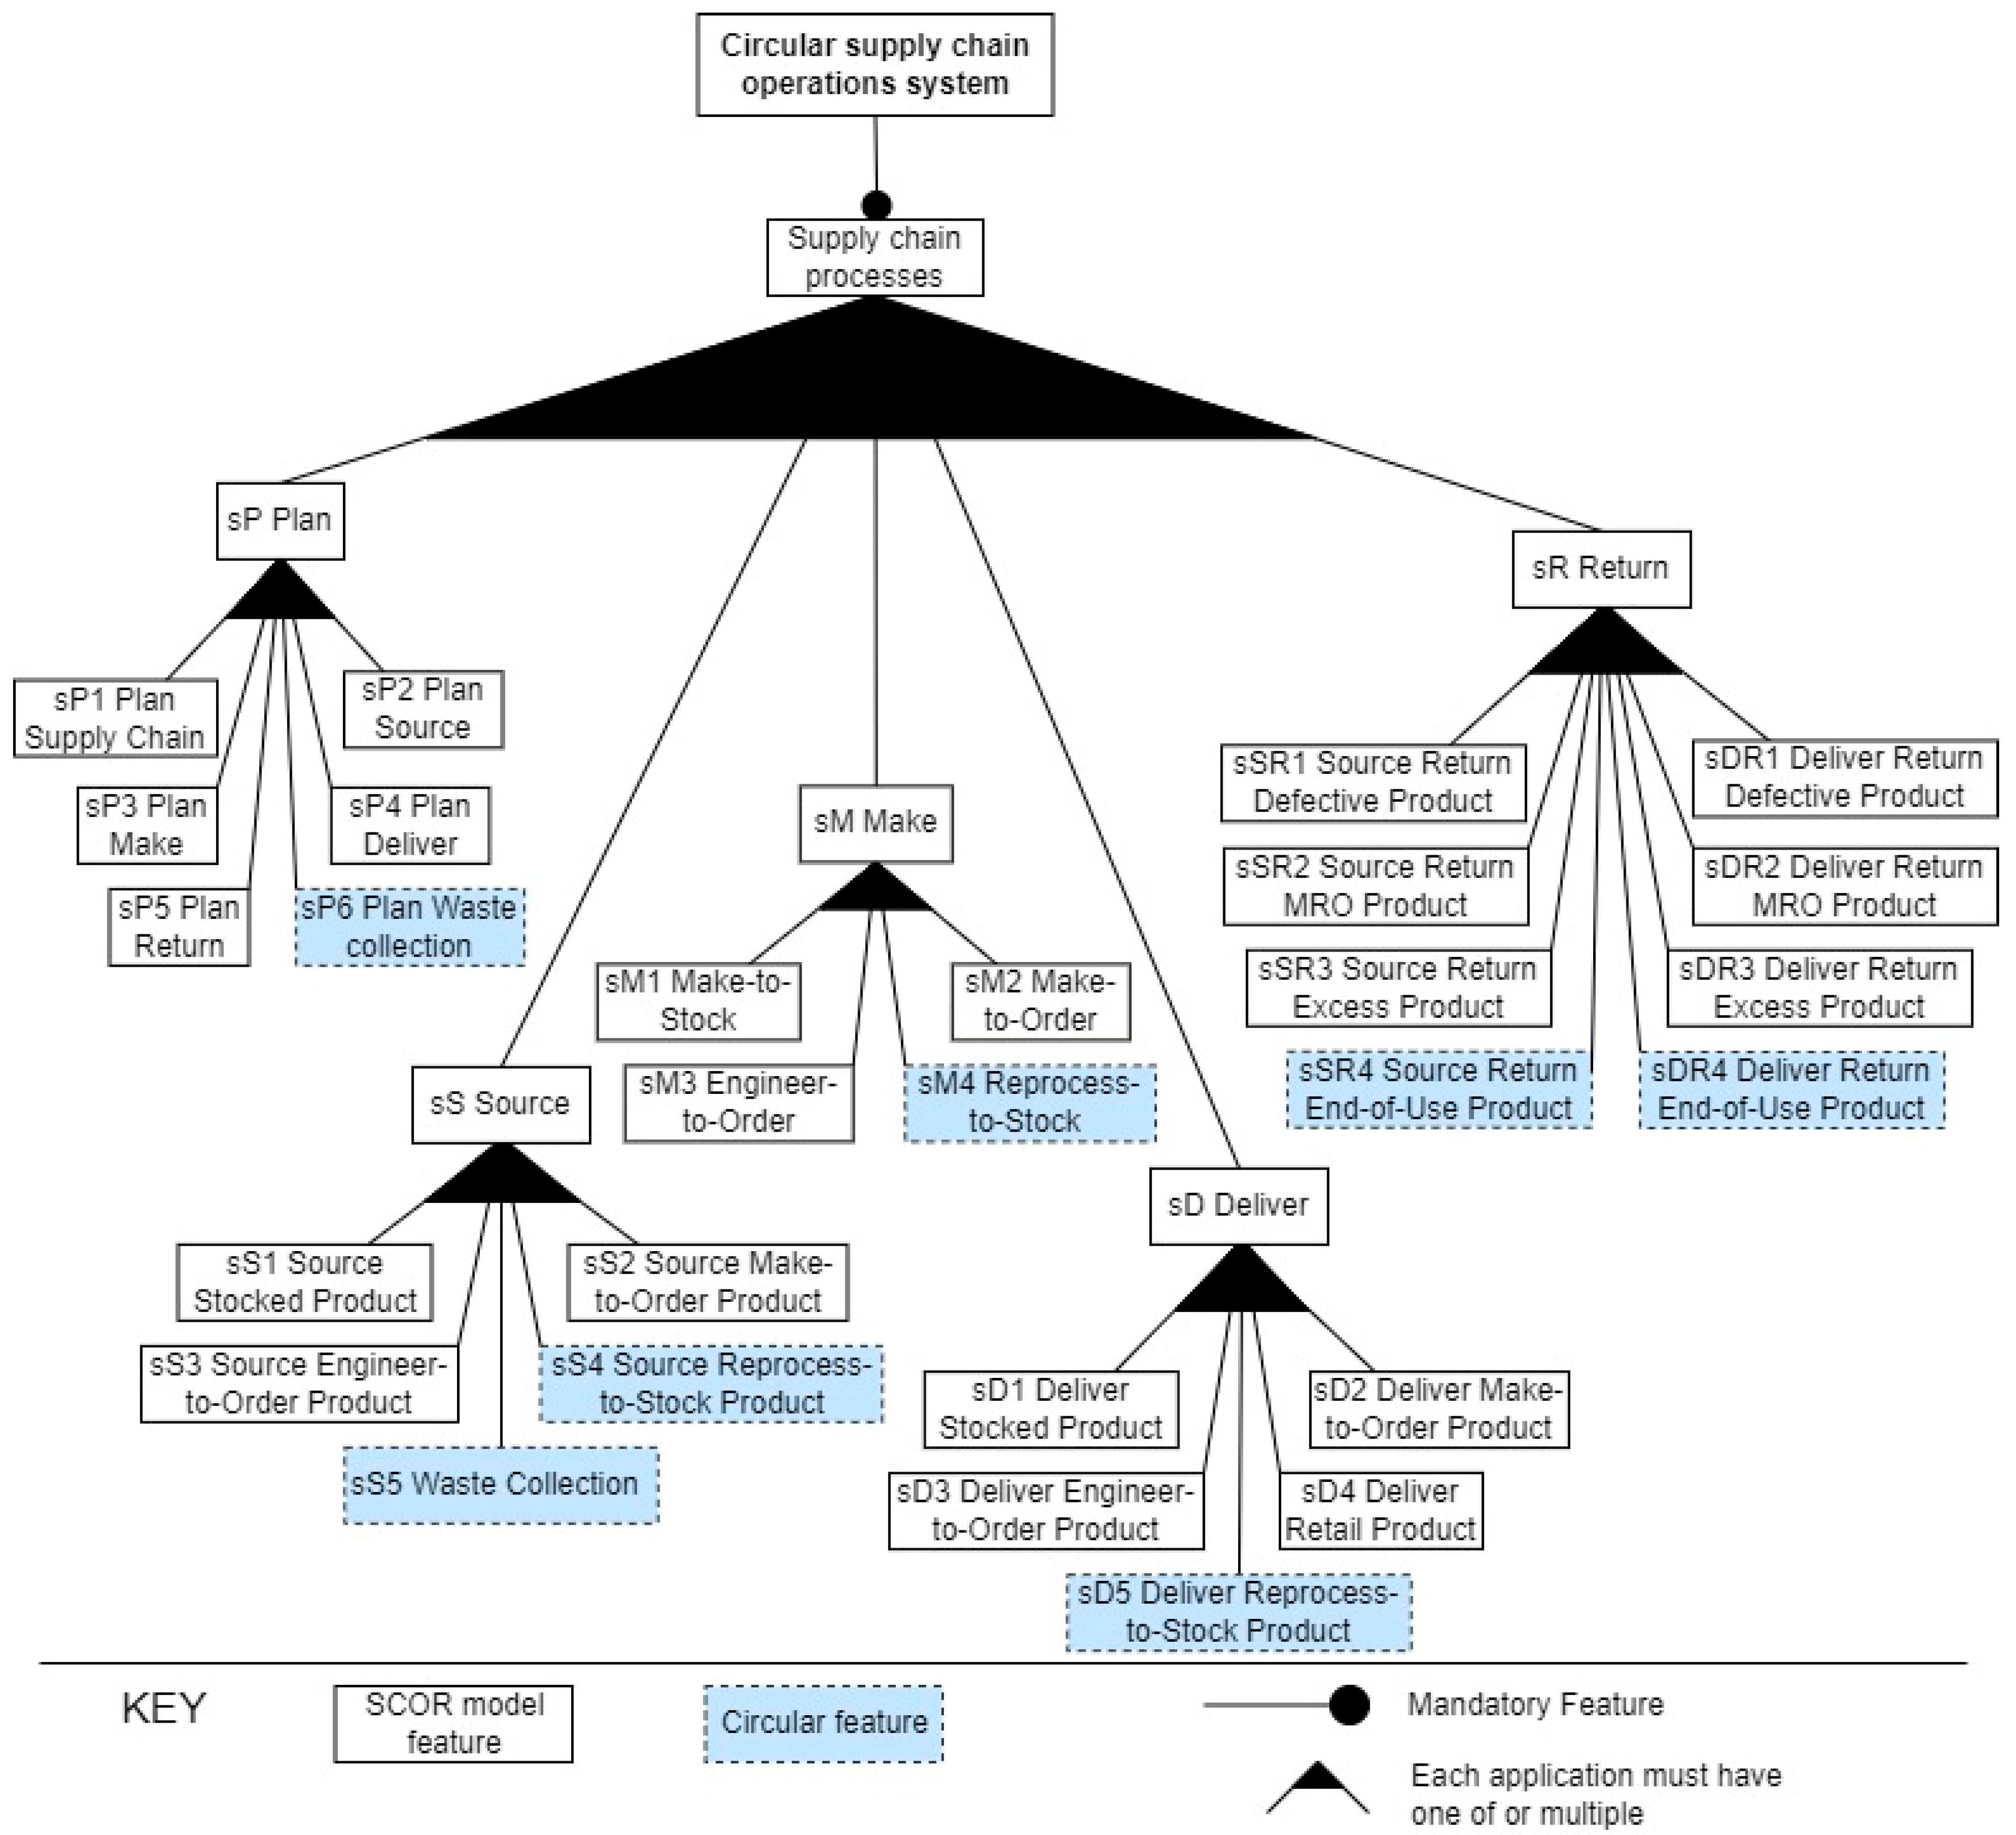


| sP Plan | sS Source | sM Make | sD Deliver | sR Return |
|---|---|---|---|---|
| sP1 Plan Supply Chain | sS1 Source Stocked Product | sM1 Make-to-Stock | sD1 Deliver Stocked Product | sSR1 Source Return Defective Product |
| sP2 Plan Source | sS2 Source Make-to-Order Product | sM2 Make-to-Order | sD2 Deliver Make-to-Order Product | sSR2 Source Return MRO Product |
| sP3 Plan Make | sS3 Source Engineer-to-Order Product | sM3 Engineer-to-Order | sD3 Deliver Engineer-to-Order Product | sSR3 Source Return Excess Product |
| sP4 Plan Deliver | sD4 Deliver Retail Product | sDR1 Deliver Return Defective Product | ||
| sP5 Plan Return | sDR2 Deliver Return MRO Product | |||
| sDR3 Deliver Return Excess Product |
| Concept | Description |
|---|---|
| Plan Waste Collection | A strategic or tactical process to establish and adjust courses of action over specified time periods to collect waste to meet anticipated and unanticipated collection requirements. The collection requirements are independent of downstream requirements [40]. |
| Waste collection | Collection of waste based on either predefined schedule or specific order from a waste disposing customer. Collection is dependent on the order or the service agreement made with the waste disposing customer [40]. The goal is to recycle as much as possible into useful products or materials to be sold. |
| Source Reprocess-to-Stock Product | Sourcing or receiving a product based on the availability, the quality and the quantity of incoming supplies and not based on sales forecast or customer order. |
| Reprocess-to-Stock | Adding value to a deliverable through manufacturing which is completed prior to customer orders and not based on sales forecast but on the availability, the quality and the quantity of incoming supplies. The goal is to make products that can be sold made from used products, materials, or waste. |
| Deliver Reprocess-to-Stock Product | Delivering a product that is sourced or made based on availability, the quality, and quantity of incoming supplies. |
| Source Return End-of-Use product | Return and disposition determination of products that are at the end of their use, in order to reuse them for the same purpose, or refurbish or remanufacture them for use for the same purpose. The return process does not represent the actual making process. |
| Deliver Return End-of-Use product | Return and receive products that are at the end of their use, in order to reuse them for the same purpose, or refurbish or remanufacture them for use for the same purpose. The return process does not represent the actual making process. |
| Economic Activity | ISIC Code |
|---|---|
| Agriculture, forestry, and fishing | A |
| Manufacturing (excl. food products) | B |
| Manufacturing of food products | C |
| Electricity, gas, steam and air conditioning supply | D |
| Water supply, sewerage, waste management and remediation activities | E |
| Construction | F |
| Wholesale and retail trade; repair of motor vehicles and motorcycles | H |
| Transportation and storage | I |
| Accommodation and food service activities | K |
| Information and communication | L |
| Professional, scientific and technical activities | M |
| Administrative and support service activities | O |
| Education | P |
| Other service activities | S |
| Undefined | T |
| Resp. | ISIC | sP1 | sP2 | sP3 | sP4 | sP5 | sP6 | sS1 | sS2 | sS3 | sS4 | sS5 | sM1 | sM2 | sM3 | sM4 | sD1 | sD2 | sD3 | sD4 | sD5 | sR1 | sR2 | sR3 | sR4 |
|---|---|---|---|---|---|---|---|---|---|---|---|---|---|---|---|---|---|---|---|---|---|---|---|---|---|
| 1 | A | ||||||||||||||||||||||||
| 2 | A | ||||||||||||||||||||||||
| 3 | A | ||||||||||||||||||||||||
| 4 | A | ||||||||||||||||||||||||
| 5 | AB | ||||||||||||||||||||||||
| 6 | AC | ||||||||||||||||||||||||
| 7 | AC | ||||||||||||||||||||||||
| 8 | A I | ||||||||||||||||||||||||
| 9 | A E F I | ||||||||||||||||||||||||
| 10 | A E I M | ||||||||||||||||||||||||
| 11 | B | ||||||||||||||||||||||||
| 12 | B | ||||||||||||||||||||||||
| 13 | B | ||||||||||||||||||||||||
| 14 | B E | ||||||||||||||||||||||||
| 15 | B F | ||||||||||||||||||||||||
| 16 | B I | ||||||||||||||||||||||||
| 17 | C | ||||||||||||||||||||||||
| 18 | C | ||||||||||||||||||||||||
| 19 | C | ||||||||||||||||||||||||
| 20 | C | ||||||||||||||||||||||||
| 21 | C | ||||||||||||||||||||||||
| 22 | C | ||||||||||||||||||||||||
| 23 | C | ||||||||||||||||||||||||
| 24 | C | ||||||||||||||||||||||||
| 25 | C | ||||||||||||||||||||||||
| 26 | C H | ||||||||||||||||||||||||
| 27 | D | ||||||||||||||||||||||||
| 28 | E | ||||||||||||||||||||||||
| 29 | E | ||||||||||||||||||||||||
| 30 | E | ||||||||||||||||||||||||
| 31 | E | ||||||||||||||||||||||||
| 32 | E P | ||||||||||||||||||||||||
| 33 | E I M | ||||||||||||||||||||||||
| 34 | F | ||||||||||||||||||||||||
| 35 | F O | ||||||||||||||||||||||||
| 36 | F O | ||||||||||||||||||||||||
| 37 | H | ||||||||||||||||||||||||
| 38 | H | ||||||||||||||||||||||||
| 39 | H | ||||||||||||||||||||||||
| 40 | H | ||||||||||||||||||||||||
| 41 | H | ||||||||||||||||||||||||
| 42 | H | ||||||||||||||||||||||||
| 43 | H | ||||||||||||||||||||||||
| 44 | H | ||||||||||||||||||||||||
| 45 | H | ||||||||||||||||||||||||
| 46 | H | ||||||||||||||||||||||||
| 47 | H | ||||||||||||||||||||||||
| 48 | H | ||||||||||||||||||||||||
| 49 | H | ||||||||||||||||||||||||
| 50 | H | ||||||||||||||||||||||||
| 51 | H | ||||||||||||||||||||||||
| 52 | H S | ||||||||||||||||||||||||
| 53 | K | ||||||||||||||||||||||||
| 54 | K | ||||||||||||||||||||||||
| 55 | K | ||||||||||||||||||||||||
| 56 | K L | ||||||||||||||||||||||||
| 57 | P | ||||||||||||||||||||||||
| 58 | S | ||||||||||||||||||||||||
| 59 | S | ||||||||||||||||||||||||
| 60 | T |
Publisher’s Note: MDPI stays neutral with regard to jurisdictional claims in published maps and institutional affiliations. |
© 2021 by the authors. Licensee MDPI, Basel, Switzerland. This article is an open access article distributed under the terms and conditions of the Creative Commons Attribution (CC BY) license (https://creativecommons.org/licenses/by/4.0/).
Share and Cite
van Engelenhoven, T.; Kassahun, A.; Tekinerdogan, B. Circular Business Processes in the State-of-the-Practice: A Survey Study. Sustainability 2021, 13, 13307. https://doi.org/10.3390/su132313307
van Engelenhoven T, Kassahun A, Tekinerdogan B. Circular Business Processes in the State-of-the-Practice: A Survey Study. Sustainability. 2021; 13(23):13307. https://doi.org/10.3390/su132313307
Chicago/Turabian Stylevan Engelenhoven, Tanja, Ayalew Kassahun, and Bedir Tekinerdogan. 2021. "Circular Business Processes in the State-of-the-Practice: A Survey Study" Sustainability 13, no. 23: 13307. https://doi.org/10.3390/su132313307
APA Stylevan Engelenhoven, T., Kassahun, A., & Tekinerdogan, B. (2021). Circular Business Processes in the State-of-the-Practice: A Survey Study. Sustainability, 13(23), 13307. https://doi.org/10.3390/su132313307