Article

Increased Carbon Dioxide by Occupants Promotes Growth of Leafy Vegetables Grown in Indoor Cultivation System

by
Kyungdeok Noh
1 and
Byoung Ryong Jeong
1,2,3,*
1
Department of Horticulture, Division of Applied Life Science (BK21 Four Program), Graduate School of Gyeongsang National University, Jinju 52828, Korea
2
Institute of Agriculture and Life Science, Gyeongsang National University, Jinju 52828, Korea
3
Research Institute of Life Science, Gyeongsang National University, Jinju 52828, Korea
*
Author to whom correspondence should be addressed.
Sustainability 2021, 13(23), 13288; https://doi.org/10.3390/su132313288
Submission received: 28 October 2021 / Revised: 26 November 2021 / Accepted: 27 November 2021 / Published: 30 November 2021

Abstract

:
The development of various types of plant factories is central to improving agriculture. In one form, it is expanding from the existing commercial plant factories to home cultivation systems or cultivators. The plant cultivation system grafted into the living space for people produces differences in the growth of the plant depending on the lifestyle (cooling and heating, residence time, number of residents, etc.) of the resident. In this study, identical home cultivation systems that automatically adjust environmental conditions (temperature, photoperiod, light, and nutrient solution supply) other than the carbon dioxide level were set in an office and warehouse. The study confirmed how plant growth can differ depending on the amount of carbon dioxide generated by humans occupying the space. In addition, it was confirmed whether the growth of plants can be further promoted depending on the external air exchange speed by a ventilation fan even if the indoor carbon dioxide concentration is the same. Due to the nature of the cultivation system that controls the temperature, the type and speed of the fan were set to minimize heat loss in the cultivator. The airspeed from ventilation fans attached to the indoor cultivation systems of an office and warehouse was adjusted to one of three levels (0.7, 1.0, or 1.3 m·s−1). In this study with two species, Ssamchoo and Romaine, it was confirmed that the office space was significantly advantageous for the growth of Ssamchoo, especially in terms of the fresh weight, root activity, and chlorophyll content. Romaine also had a significantly higher fresh weight when grown in the office. Shoot length, leaf length, and leaf width were longer, and there were more leaves. When comparing the relative yield based on an airspeed of 1.0 m·s−1, the yield increased up to 156.9% more in the office than in the warehouse. The fan airspeed had an important influence on Ssamchoo. The higher the fan airspeed, the greater the yield, root activity, and chlorophyll. However, fan airspeed had no consistent effect on the growth tendencies of Romaine. In conclusion, carbon dioxide produced by humans occupying the space is a significant source of carbon dioxide for plants grown in the home cultivation system, although both the speed of the ventilation fan that can promote growth without heat loss and delayed growth caused by the photorespiration in a carbon dioxide-limited situation require additional experiments.

1. Introduction

All trends on sustainability around the world are focused on climate change. Climate change has a direct impact on our lives and sustainability. The issue in agricultural production caused by the climate crisis also threatens the sustainability of the supply of agri-food from farms to homes and leads to food security concerns. People are becoming increasingly sensitive to environmental threats [1]. This is why there is an increasing demand for pollution-free land [2] and water [3], better air quality [4], and more stringent food safety [5]. Additionally, the health of modern people who stay indoors more than 80% a day is prone to the indoor environment. Substances that affect indoor air quality [6] include volatile organic compounds, air-borne microorganisms, nitrogen oxides, sulfur oxides, ozone, and fine dust, which can be toxic. Although carbon dioxide [7] is not acutely toxic, it is an important indicator of indoor air quality. At high concentrations, it causes attention deficit, fatigue, and drowsiness [8]. The indoor carbon dioxide levels may be adjusted with ventilation, but there may be situations where periodic ventilation is difficult for the residents, or the inflow of ambient pollutants [9] is more damaging than the reduction of carbon dioxide through ventilation. On the other hand, heat losses due to ventilation result in the use of considerable electrical energy, increasing atmospheric carbon [6,10].
Direct health threats caused by the climate crisis, including environmental pollution issues and instability in the food supply, act as anxiety factors that threaten people’s viability beyond sustainability. It is indoor cultivating systems that have emerged as the results of these complex problems, stimulating the foundation of the desire for survival.
These plant cultivators are in the form of small plant factories and include technologies such as temperature control, light supply, and the automation of irrigation and feeding of nutrient solutions. However, unlike plant factories used for commercial crop production, it is not easy to have an additional supply of carbon dioxide, which is an indoor air pollution factor, because the installation site is a human-residing space. When the concentration of carbon dioxide in the tissue culture vessels could not be increased, the growth of plantlets in the culture vessels could be promoted by raising the CO2 concentration of the culture room where the culture vessels were placed [11]. Fortunately, human respiration is a major source of carbon dioxide in the non-industrial indoor environment. Therefore, the activities of humans could be thought of as a supplemental source of carbon dioxide in spaces where the plant cultivation systems are placed. If plants in the cultivation system can absorb indoor pollutants, it is thought that indoor spaces will also lay the foundation for increased sustainability through carbon neutrality as organic ecosystems.
In this study, people were used as a source of carbon dioxide and the productivity of plants in an indoor cultivation system was compared. In addition, it was compared whether it is possible to promote plant growth by varying the speed of ventilation fans in this indoor cultivation system in the same space with the identical carbon dioxide concentration.

2. Materials and Methods

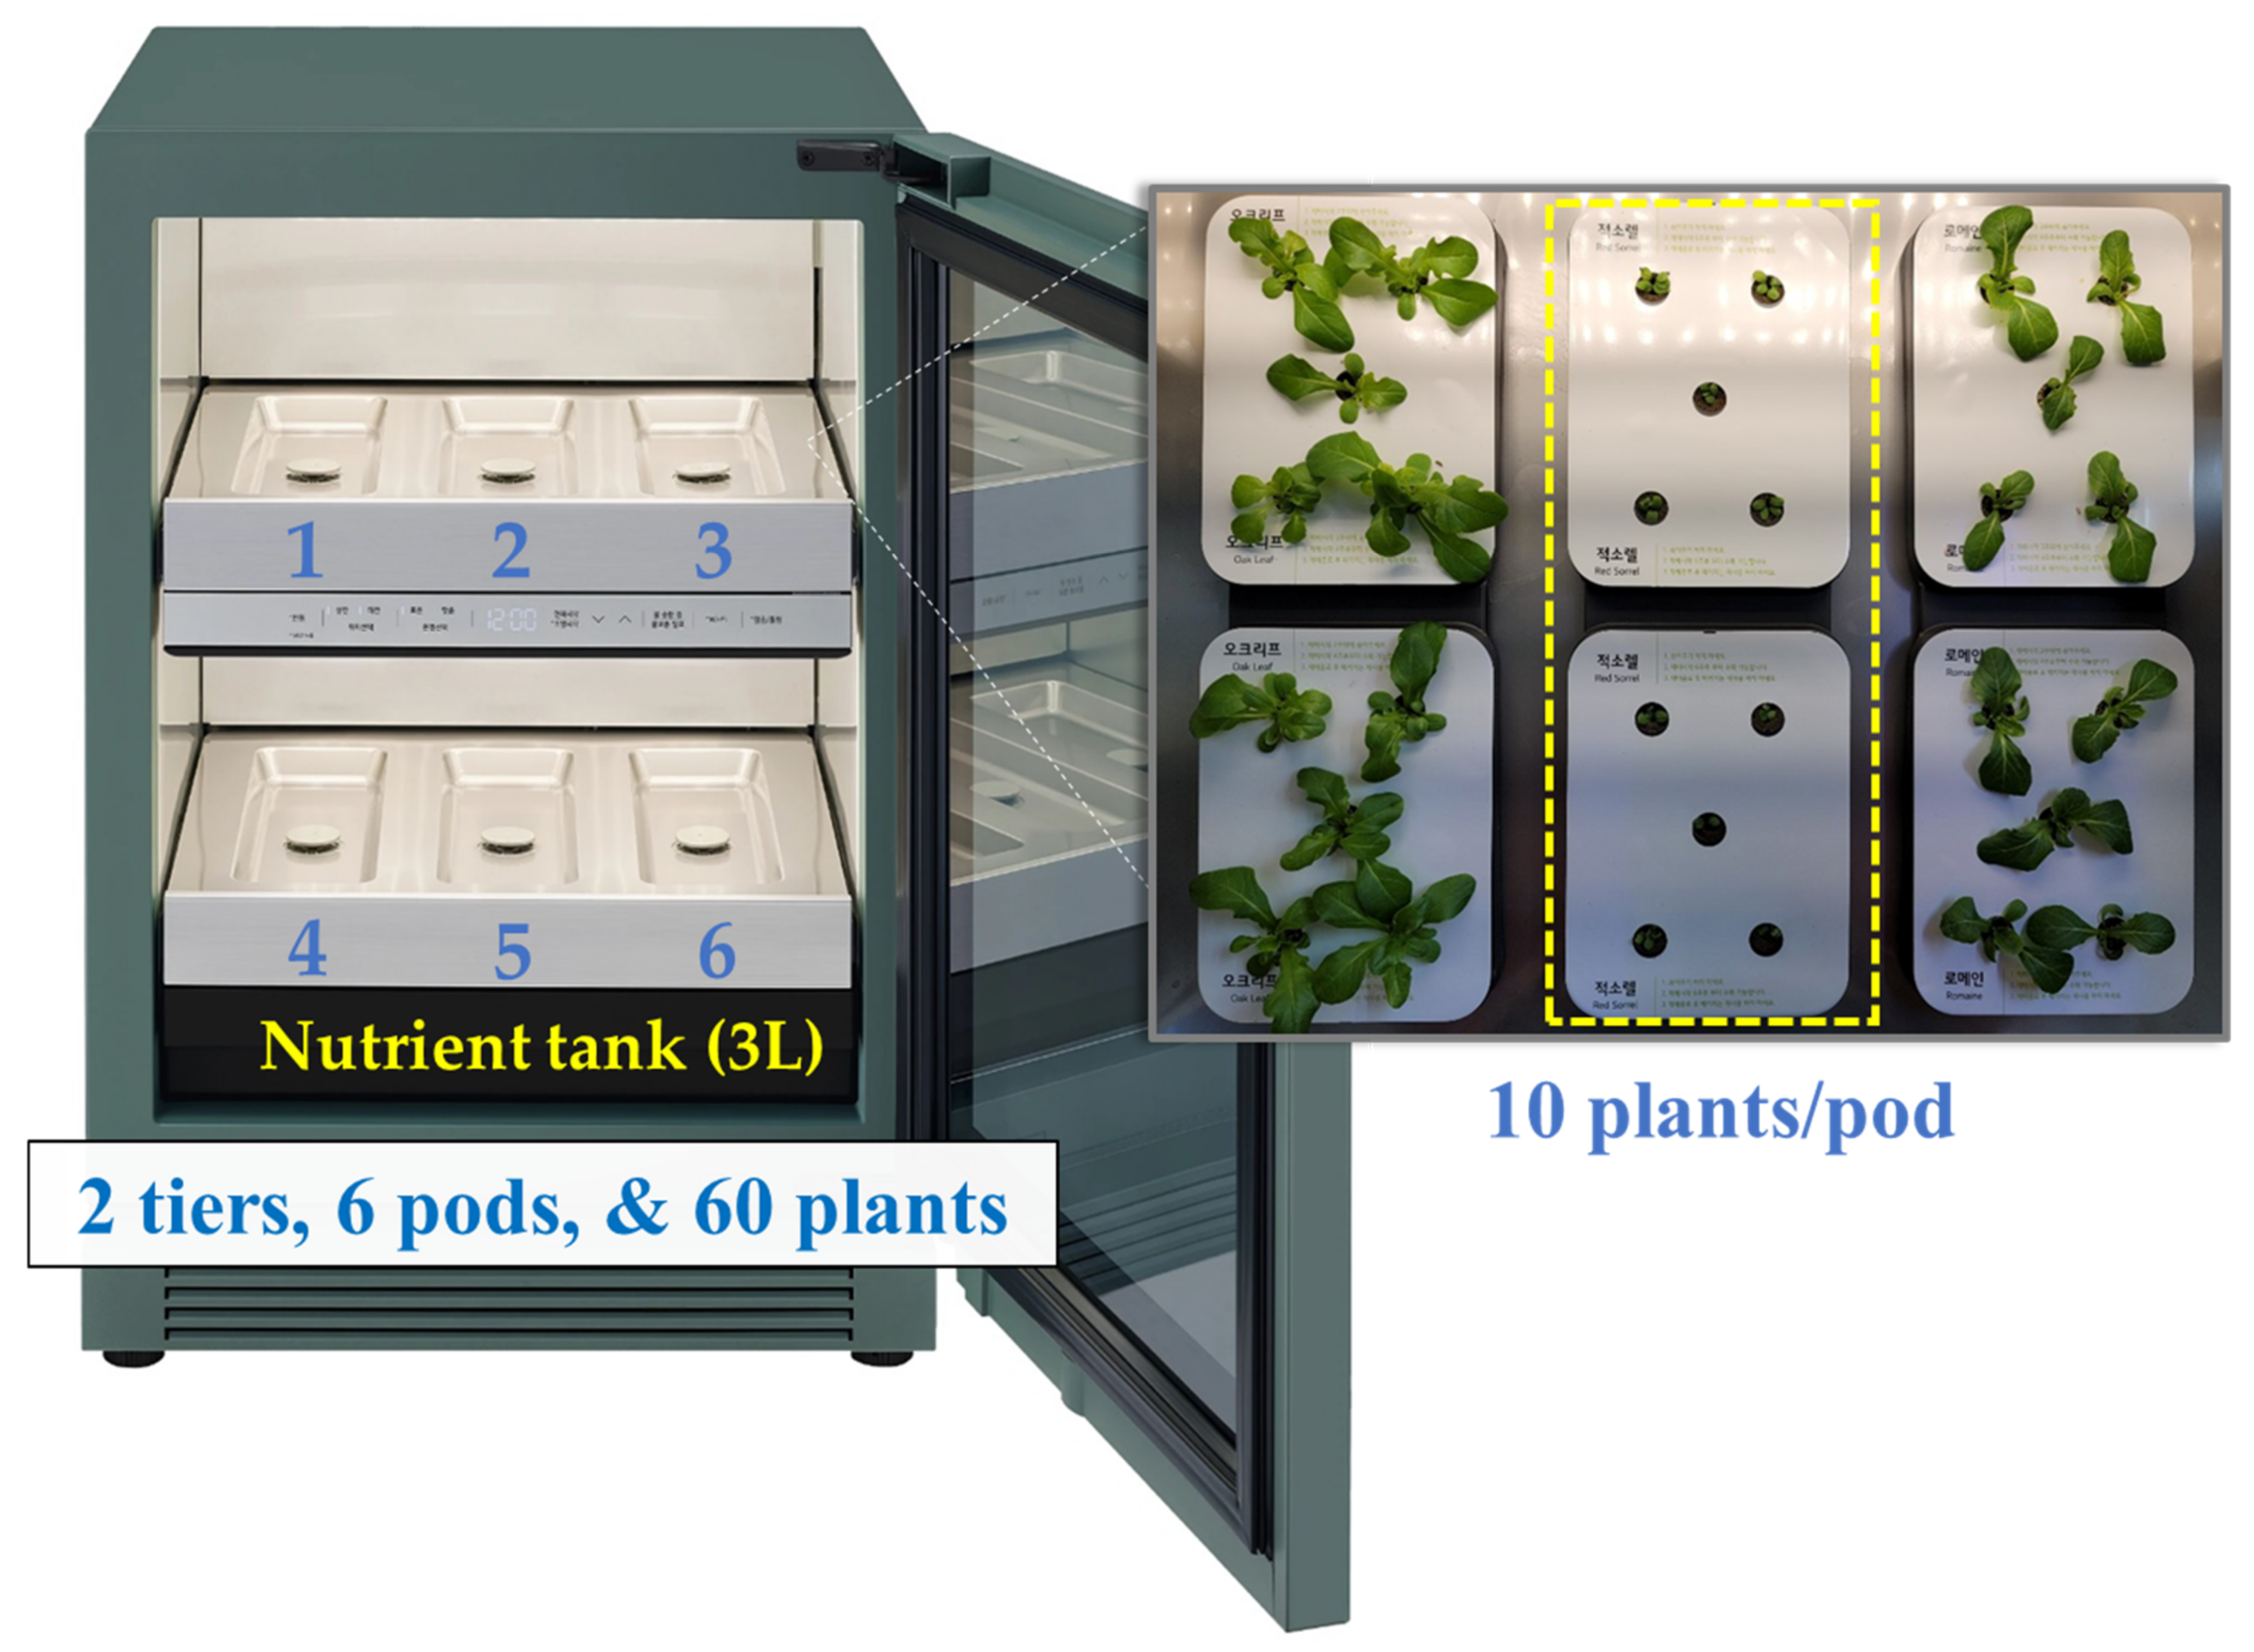
2.1. Cultivation System and Fan Airspeed

The cultivation system used in this study was an LG home cultivation system (tiiun L061G1, LG Electronics Inc., Seoul, Korea). The external size (W × H × D) is 595 mm × 815 mm × 590 mm, and the weight is 68 kg. The interior consists of two tiers. Each tier is again divided into three compartments (Figure 1). The nutrient solution is supplied by an ebb and flow-type system, and there is a 3 L water tank at the bottom of the machine. The temperature and photoperiod were set at 25 °C/18 °C, and 14/10 h day/night. Light was provided by white LEDs, with a total of 300 μmol·m−2·s−1 PPFD (photosynthetic photon flux density) supplied to both the upper and lower tiers.
The fan is located in the upper right corner of the device. A ventilation fan mounted on the device had three operating levels based on the maximum and minimum operating speed of the fan. The rotational speed of the fan was set with software. The fan airspeed was divided into three levels: 0.7 (low speed), 1.0 (medium speed), and 1.3 m·s−1 (high speed). The radius of the ventilation fan is 38 mm. The cross-sectional area of the tube through which air flows was 0.00453 m2. The total volumetric airflow rate was low speed, 11.41, medium speed, 16.31, and high speed, 21.20 m3·h−1.

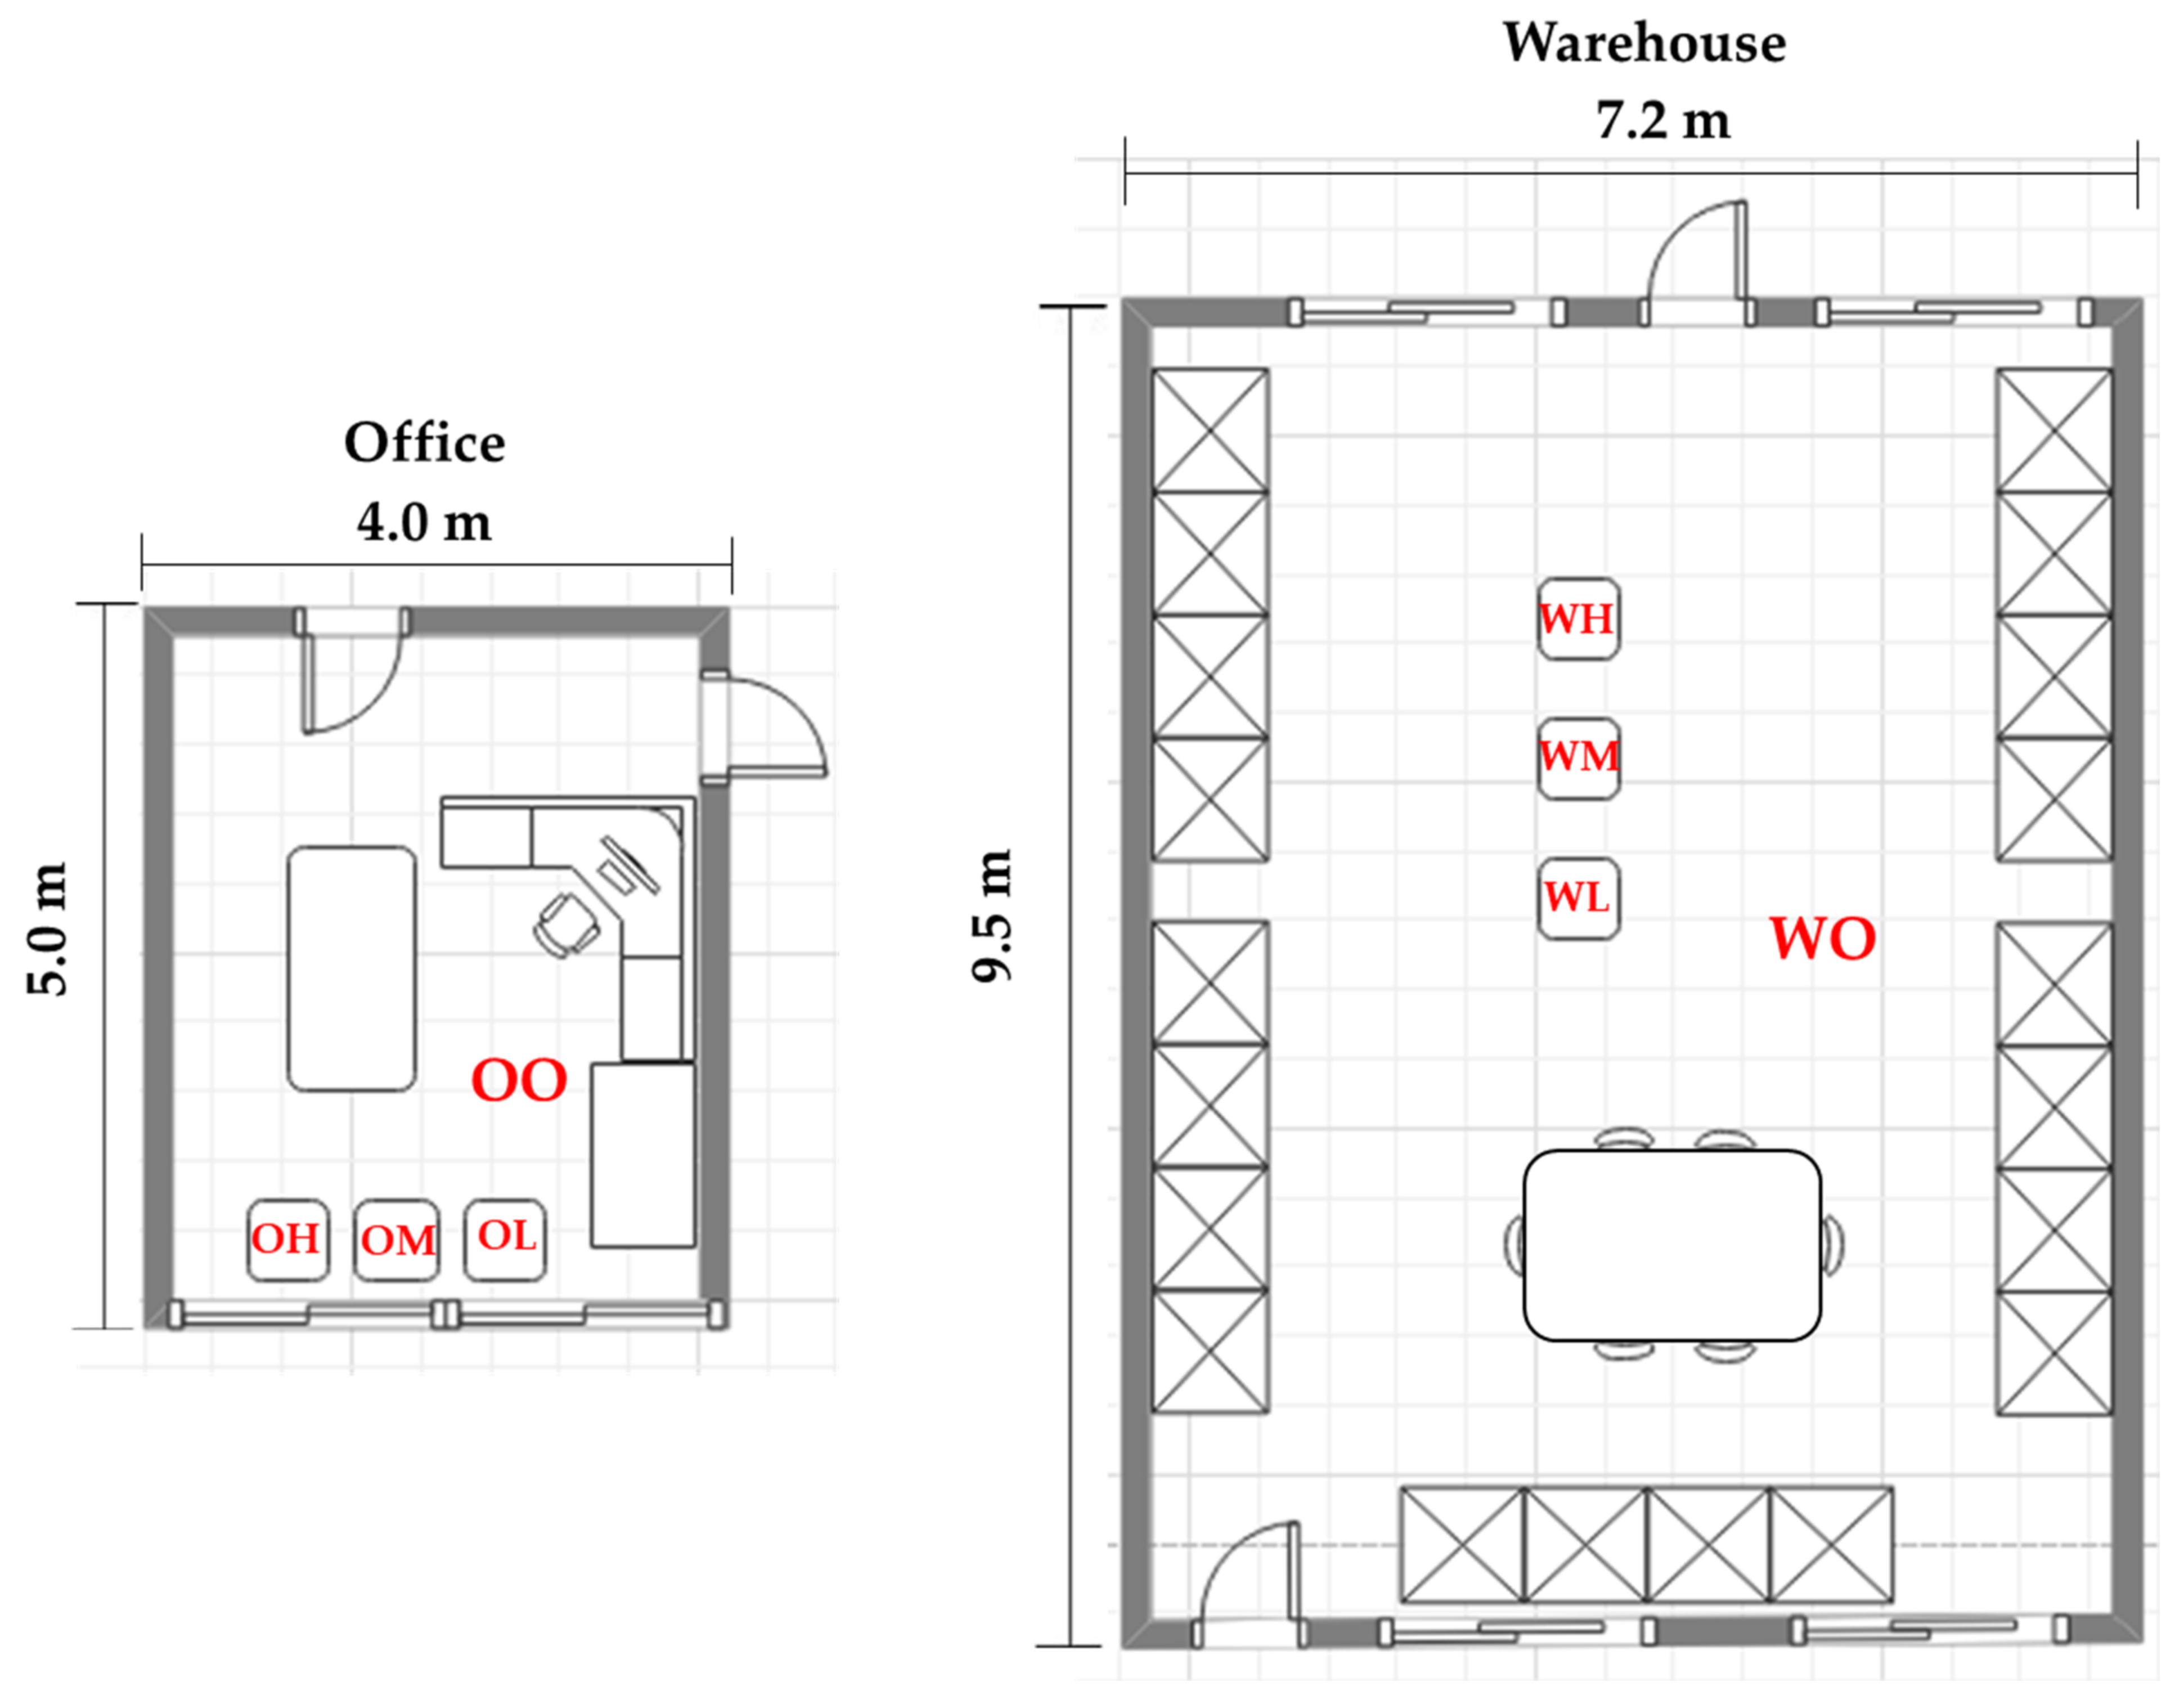
2.2. Cultivation Space

Due to the two different locations, the place of installation of the cultivation system was treated differently. An office was selected as a space with people, and a warehouse was selected as a space without people (Figure 2). Both places were located on a campus of the Gyeongsang National University.
The floor area of the office is 20 m2 and the air volume is 49 m3. During the experiment, an adult male aged 60 and weighing 63 kg used it as an office. He performed office work in a sitting position during business hours, except Sundays, usually from approximately 06:00 to approximately 4:00. Lunchtime was usually from 11:30 to 13:00. There was no additional ventilation of the room, such as opening the window. The experimental period was from July to August, and it was a midsummer period in Korea. From 06:00 to 20:00, an air conditioner without the ventilation function was operated.
The warehouse has a floor area of 68.4 m2 and an air volume of 164.2 m3. The warehouse was used to store materials for horticultural uses in the greenhouse. It was a space where no other experiments or any work were performed. Locks were installed in the warehouse which were seldomly opened to allow people in. During the experiment period, there was very limited access by people except for the researchers supplying nutritional solutions or checking the cultivation systems. There was no ventilation system or air conditioner running for this space.
The CO2 concentration, temperature, and relative humidity were measured at eight points, four in the office and four in the warehouse. These measurement points were designated as follows in the office space: office–outside, OO; office–low fan speed, OL; office–medium fan speed, OM; office–high fan speed, OH. For the warehouse: warehouse–outside, WO; warehouse–low fan speed, WL; warehouse–medium fan speed, WM; warehouse–high fan speed, WH (Figure 2). Measurements were recorded using a data logger (ALMEMO 2890, Ahlborn, Holzkirchen, Germany). The measurement period lasted 14 days, from August 5 to 19, and measurements were recorded at a 20-min interval for 24 h.

2.3. Nutrient Solutions and Medium

The nutrient solution used in this study is a multipurpose nutrient solution specially prepared for these cultivators. The pH of the nutrient solution was adjusted to 6.0 during preparation. At the start of the experiment, 3 L of the nutrient solution was supplied to the water tank at the bottom of the machine. After that, when the machine made the notification to replenish the water, approximately 2 L of the prepared nutrient solution was added.

2.4. Plant Materials

In this experiment, Ssamchoo (Brassica Lee ssp. namai) and Romaine (Lactuca sativa L. var. longiflora) were selected as the plant materials for study (Farm Hannong, Seoul, Korea). The seeds were sealed and delivered to a laboratory at Gyeongsang National University. The delivered seeds were stored in a refrigerator and sown on 28 July 2021. On 3 August, except for healthy sprouts, the rest were thinned out. After 10 August, changes in the leaf width, leaf length, and the number of leaves were measured as intermediate growth surveys, for a total of five times at 2-day intervals. On 19 August, all fully grown plants were harvested. The shoot length, number of leaves, leaf width, leaf length, fresh weight, and dry weight were measured from the harvested plants. In addition, the chlorophyll content, root activity, soluble protein, soluble sugar, starch, and antioxidant enzyme activities in plants were also measured.

2.5. Chlorophyll Content and Root Activity

To measure the chlorophyll content, 2 cm2 leaf discs were collected from the youngest mature leaf using a cork borer. Ethanol, acetone, and distilled water were mixed to make an extraction solution. The collected sample was added to this solution and the chlorophyll was extracted at 4 °C for 24 h. The extracted solution was measured at 645 and 663 nm using a spectrometer and then the chlorophyll content was calculated [12]. For root activity measurements, a 0.1 g sample near the root growth point was collected. A 1:1 mixed solution of 0.4% tetrazolium chloride and 0.2M HCl-tris was prepared. A root sample was placed in this solution and incubated for 16 h while the light was blocked. The colored root was then taken out and the solution was wiped. After 24 h of overnight immersion in 99% methanol, the wavelength was measured at 485 nm using a spectrometer [13].

2.6. Soluble Sugar and Starch Contents

The contents of starch and soluble sugars were determined by the Anthrone colorimetric method according to Vasseur and Ren et al. [14,15]. For the extract, 0.3 g of the frozen sample was pulverized, to which 10 mL of distilled water was added and incubated in water at 100 °C for 30 min, then 15 mL of distilled water was subsequently added to make the total solution volume 25 mL. This was then incubated in 100 °C water for 30 min. When the temperature dropped to room temperature, the extract was centrifuged at 6500 rpm for 10 min. Following this, 2.5 mL of the supernatant was separated and distilled water was added to make the total solution volume 10 mL. A 0.2 mL sample was taken from this solution, to which 1.8 mL of distilled water was added. A 0.5 mL of 98% Anthrone (C14H10O) and ethyl acetate (CH3COOC2H5) mixture and 5 mL of 98% sulfuric acid were added to the total solution, was shaken well, and again incubated at 100 °C for 10 min. After the reaction finished and the temperature dropped to room temperature, the absorbance was measured at 630 nm with a spectrometer. The starch content was determined using the solids remaining after preparing the extract for measuring the soluble sugar contents. The solids were collected, 20 mL of distilled water was added, and 2 mL of HClO4 was added to make a total solution of 22 mL. The total solution was incubated for 30 min in 100 °C water and filtered through a filter. A 0.5 mL sample was obtained from the extract and 1.5 mL of distilled water was added. After adding 1 mL of 98% Anthrone and ethyl acetate mixed solution, 5 mL of 98% sulfuric acid was added. After the reaction sufficiently occurred, the mixture was incubated for 30 min until the temperature dropped to room temperature. The OD at 485 nm was subsequently measured.

2.7. Soluble Proteins and Antioxidant Enzyme Activities

The total protein estimations were conducted using Bradford’s reagent [16,17]. The superoxide dismutase (SOD) activity was estimated by following the nitro blue tetrazolium (NBT) inhibition methods according to the protocol of Giannopolitis and Ries [18]. The activity of the catalase (CAT) enzyme was measured based on the method of Cakmak and Marschner [19]. The guaiacol peroxidase (GPX) activity was determined based on the amount of enzyme required for the formation of tetra guaiacol per minute, following the methods of Shah et al. [20]. The ascorbate peroxidase (APX) activity was assayed following the methods of Nakano and Asada [21].

2.8. Statistical Analysis

The SAS statistical software (Version 9.2, SAS Inst., Cary, NC, USA), was used for the statistical analysis of variance (ANOVA) and Duncan’s multiple range test at a significance level of p = 0.05. The F-test was also run based on the Fisher’s least significant difference test at a threshold of p = 0.05.

3. Results

3.1. Environmental Measurement

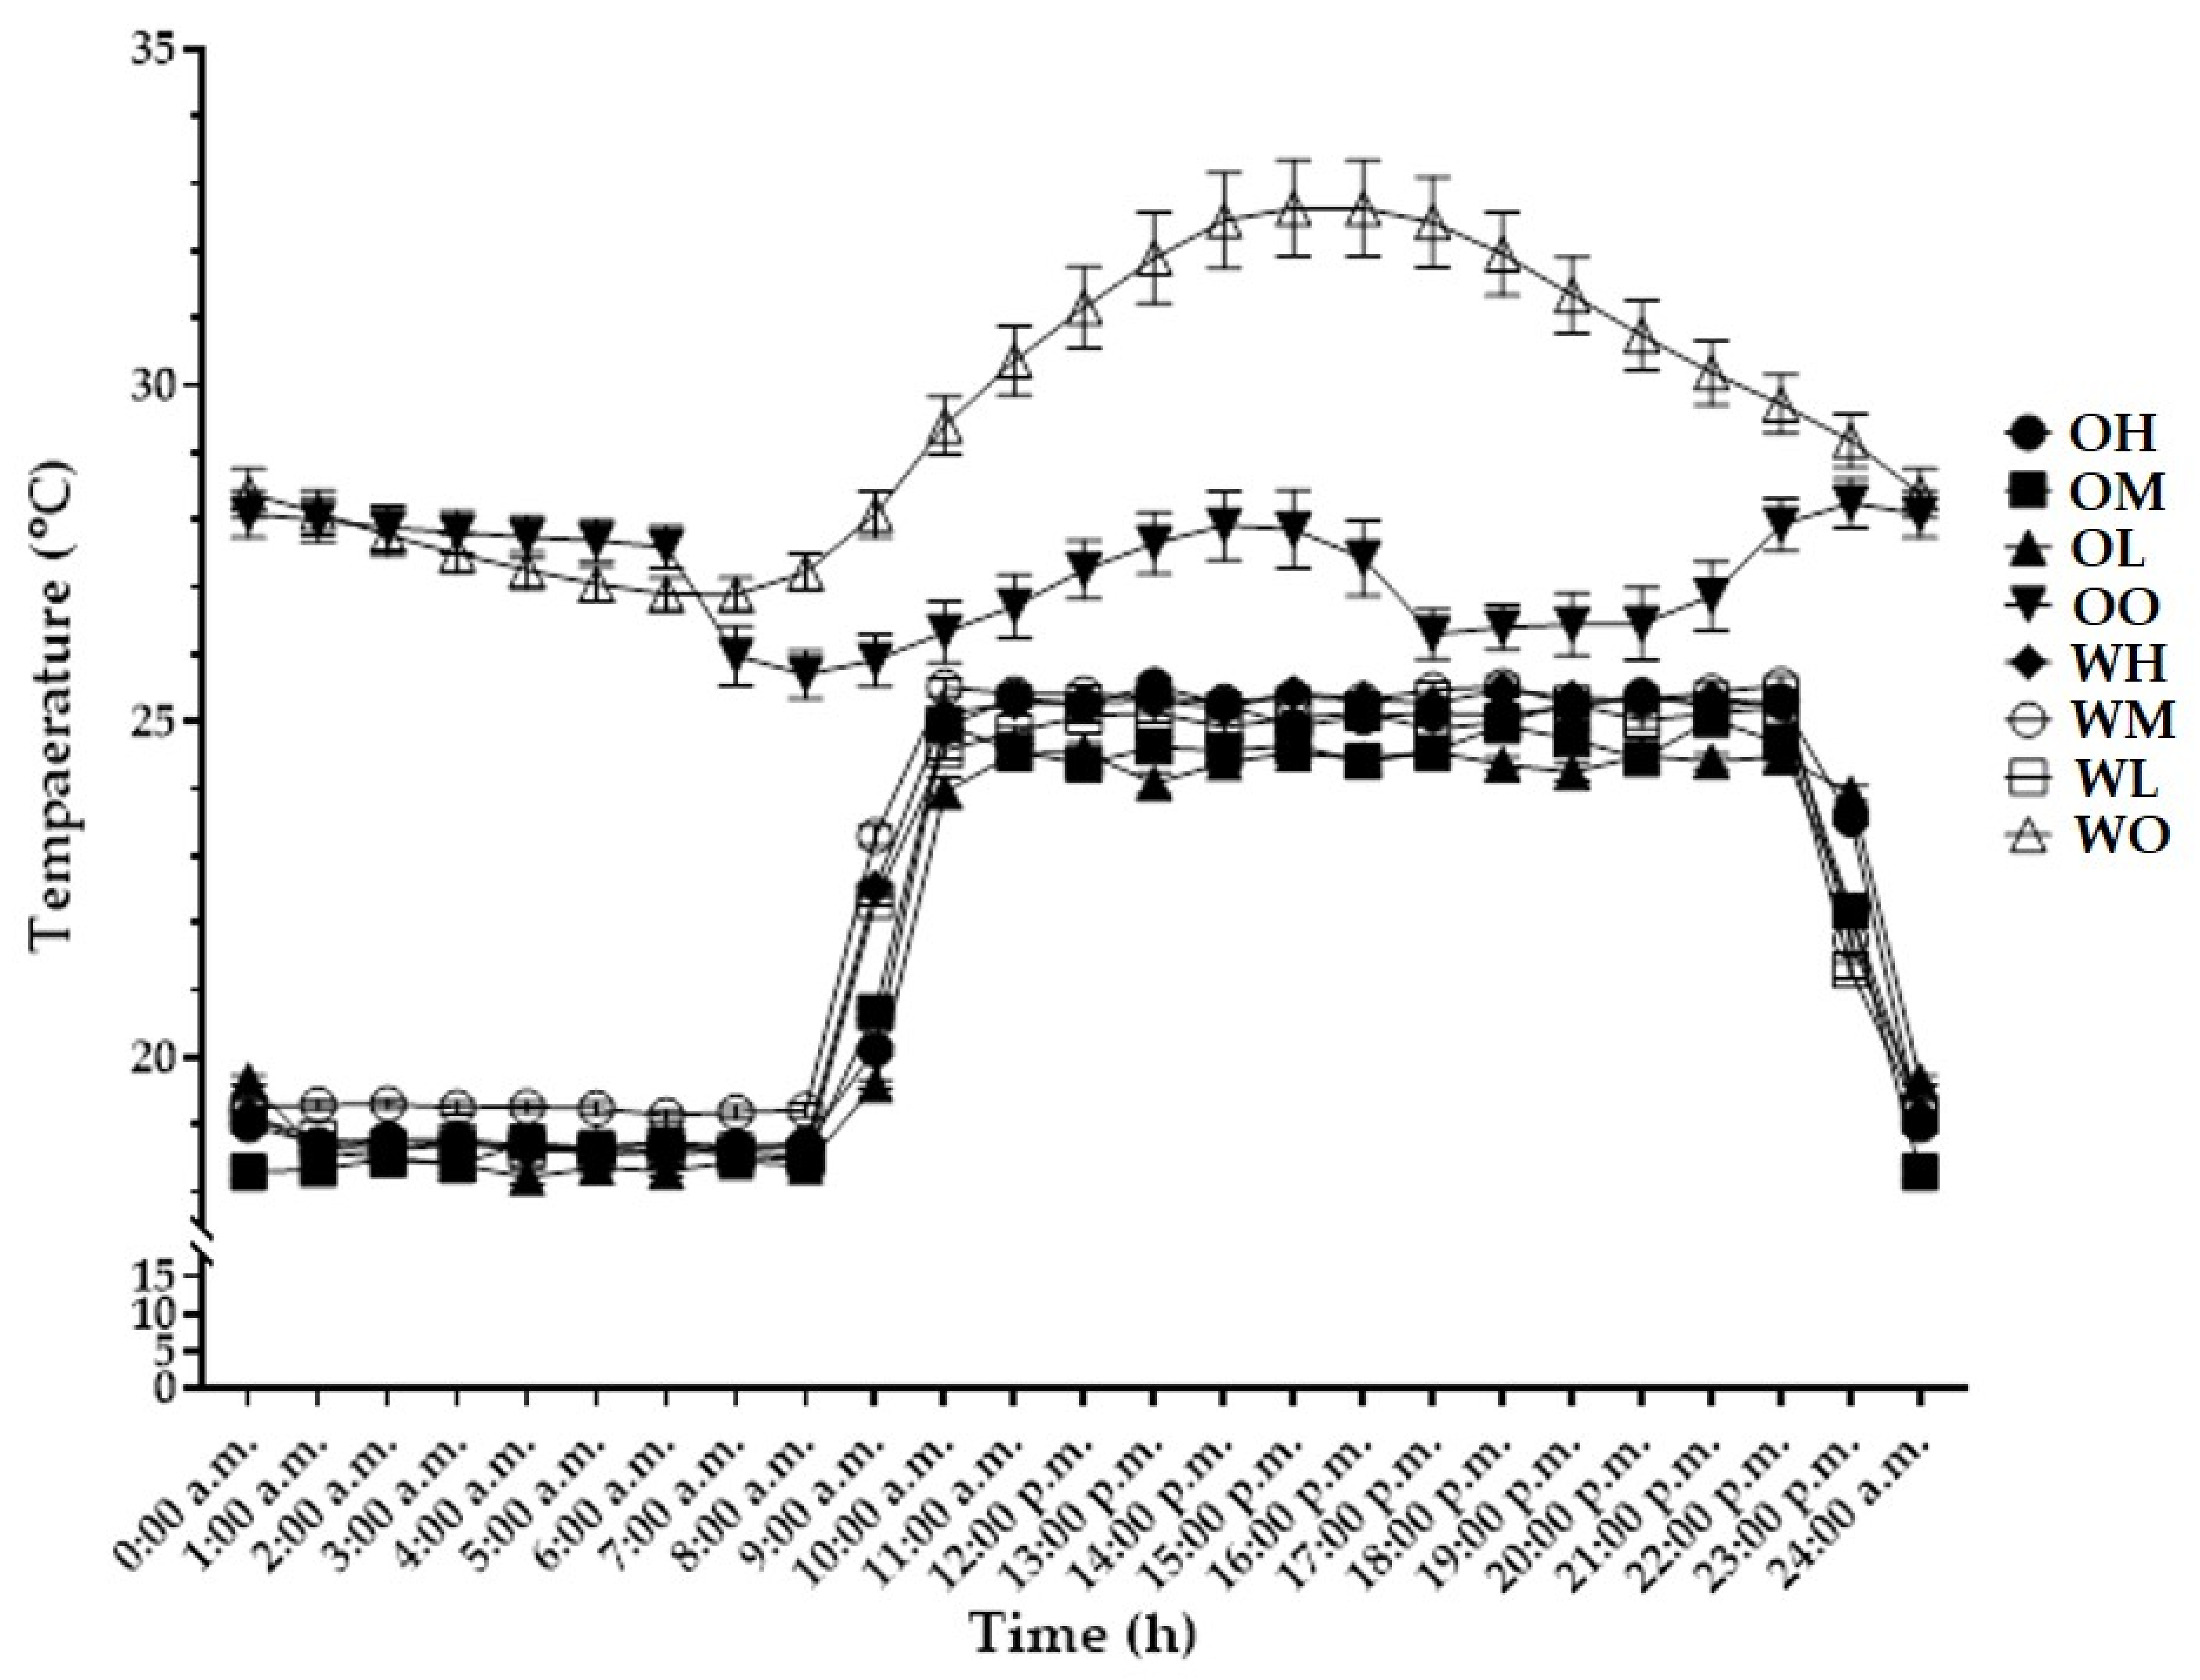
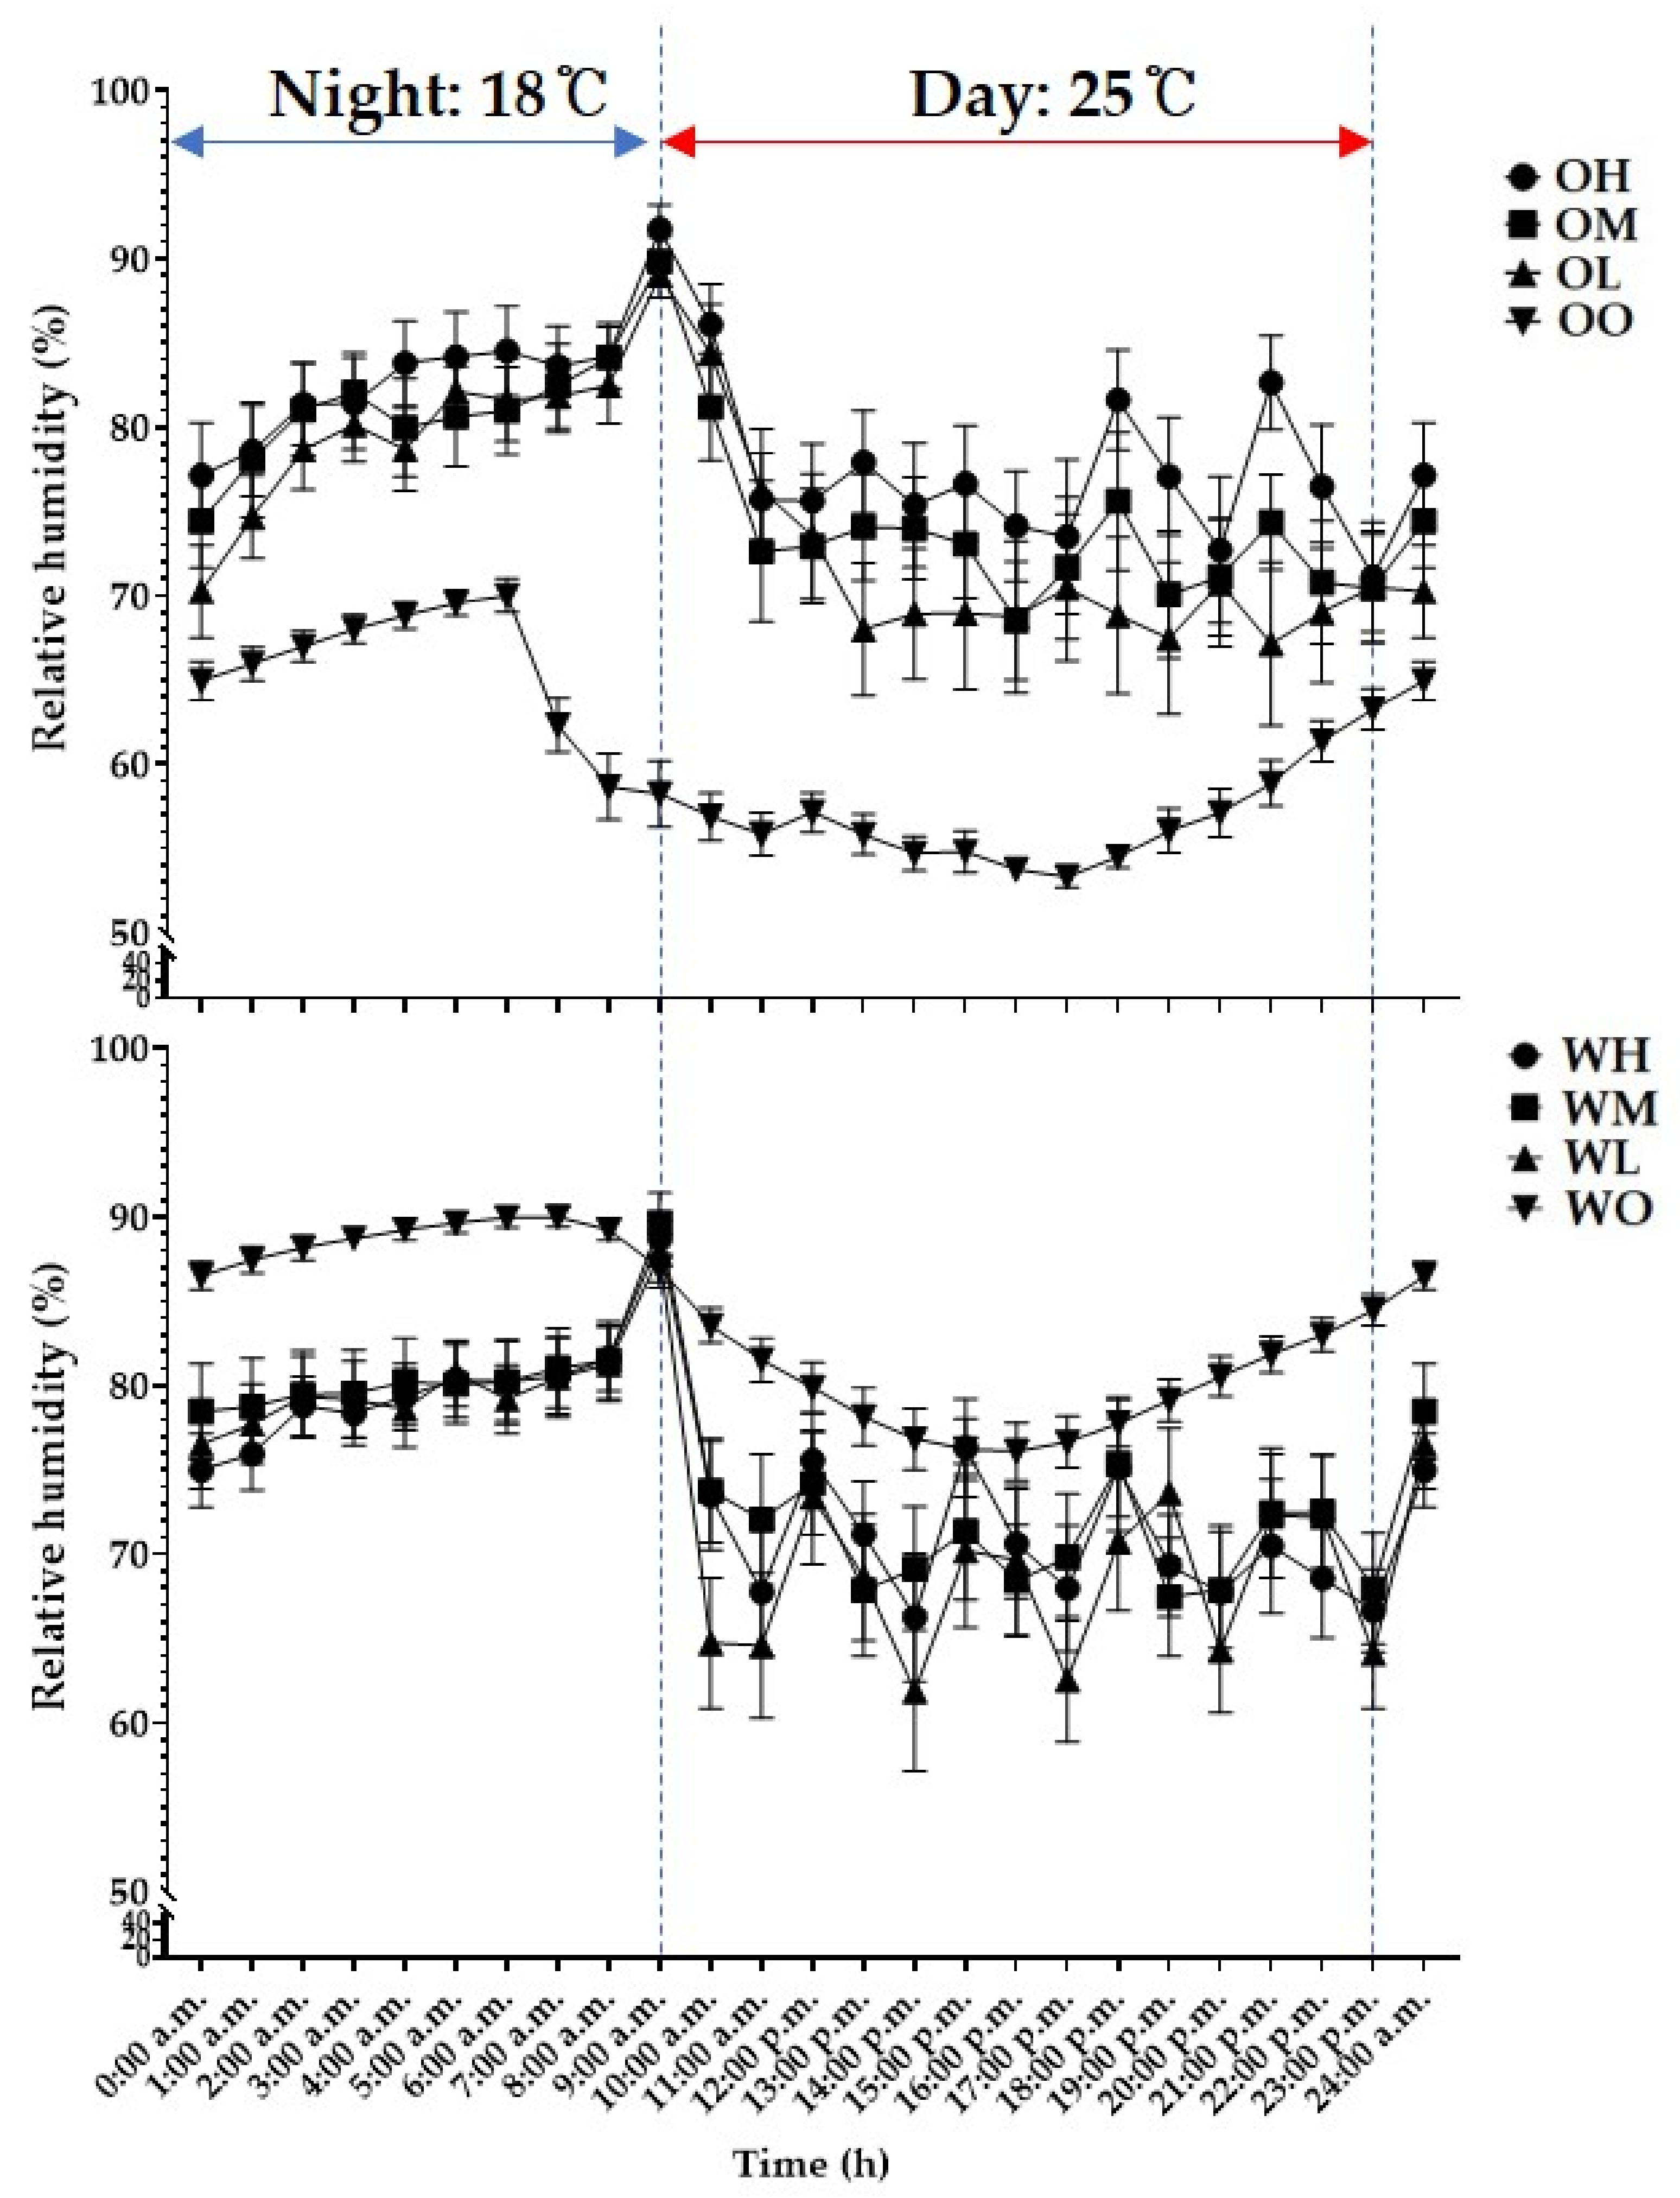
3.1.1. Temperature and Relative Humidity

The temperature and relative humidity inside each cultivation system were monitored 14 days before harvest (Figure 3). It was summer during the cultivation period, and the air conditioning system was operated in the office, but ventilation facilities were not. There was no air conditioner installed in the warehouse, so cooling or any type of environmental control was not performed. Regardless of the difference in external temperature, the temperature of the cultivation system was controlled according to the setting of the systems. The cultivation system was set to a daytime photoperiod from 09:00, and the LEDs were turned on and the temperature reached a daytime set point of 25 °C. At 23:00, the temperature dropped all at once and fell to a nighttime or dark period set point of 18 °C. At this time, all LEDs were turned off. There was no excessive heat loss in the cultivation system due to the ventilation fan. The temperature control error range of the cultivation system was 2 °C. Relative humidity was also measured during the same period (Figure 4). The office maintained lower external relative humidity levels than inside the cultivation systems. Conversely, the warehouse maintained higher levels of external relative humidity than the inside of the cultivation systems. At 09:00, the relative humidity inside the cultivation systems temporarily rose to nearly 90%. At this time, the light inside the cultivation systems was turned on momentarily, and the stomata were open, promoting transpiration. This temporary increase of relative humidity seems due to a lag period in increasing temperature in the cultivation systems from 18 degrees at night to 25 degrees during the day. Thereafter, the relative humidity rose and fell repeatedly according to the operation and rest time of the system for cooling. The office cultivation system showed relatively high levels of relative humidity in the OH. In all treatments, the relative humidity level was higher in the second half of the cultivation period. This seems to be due to the increased leaf area and growth rate.

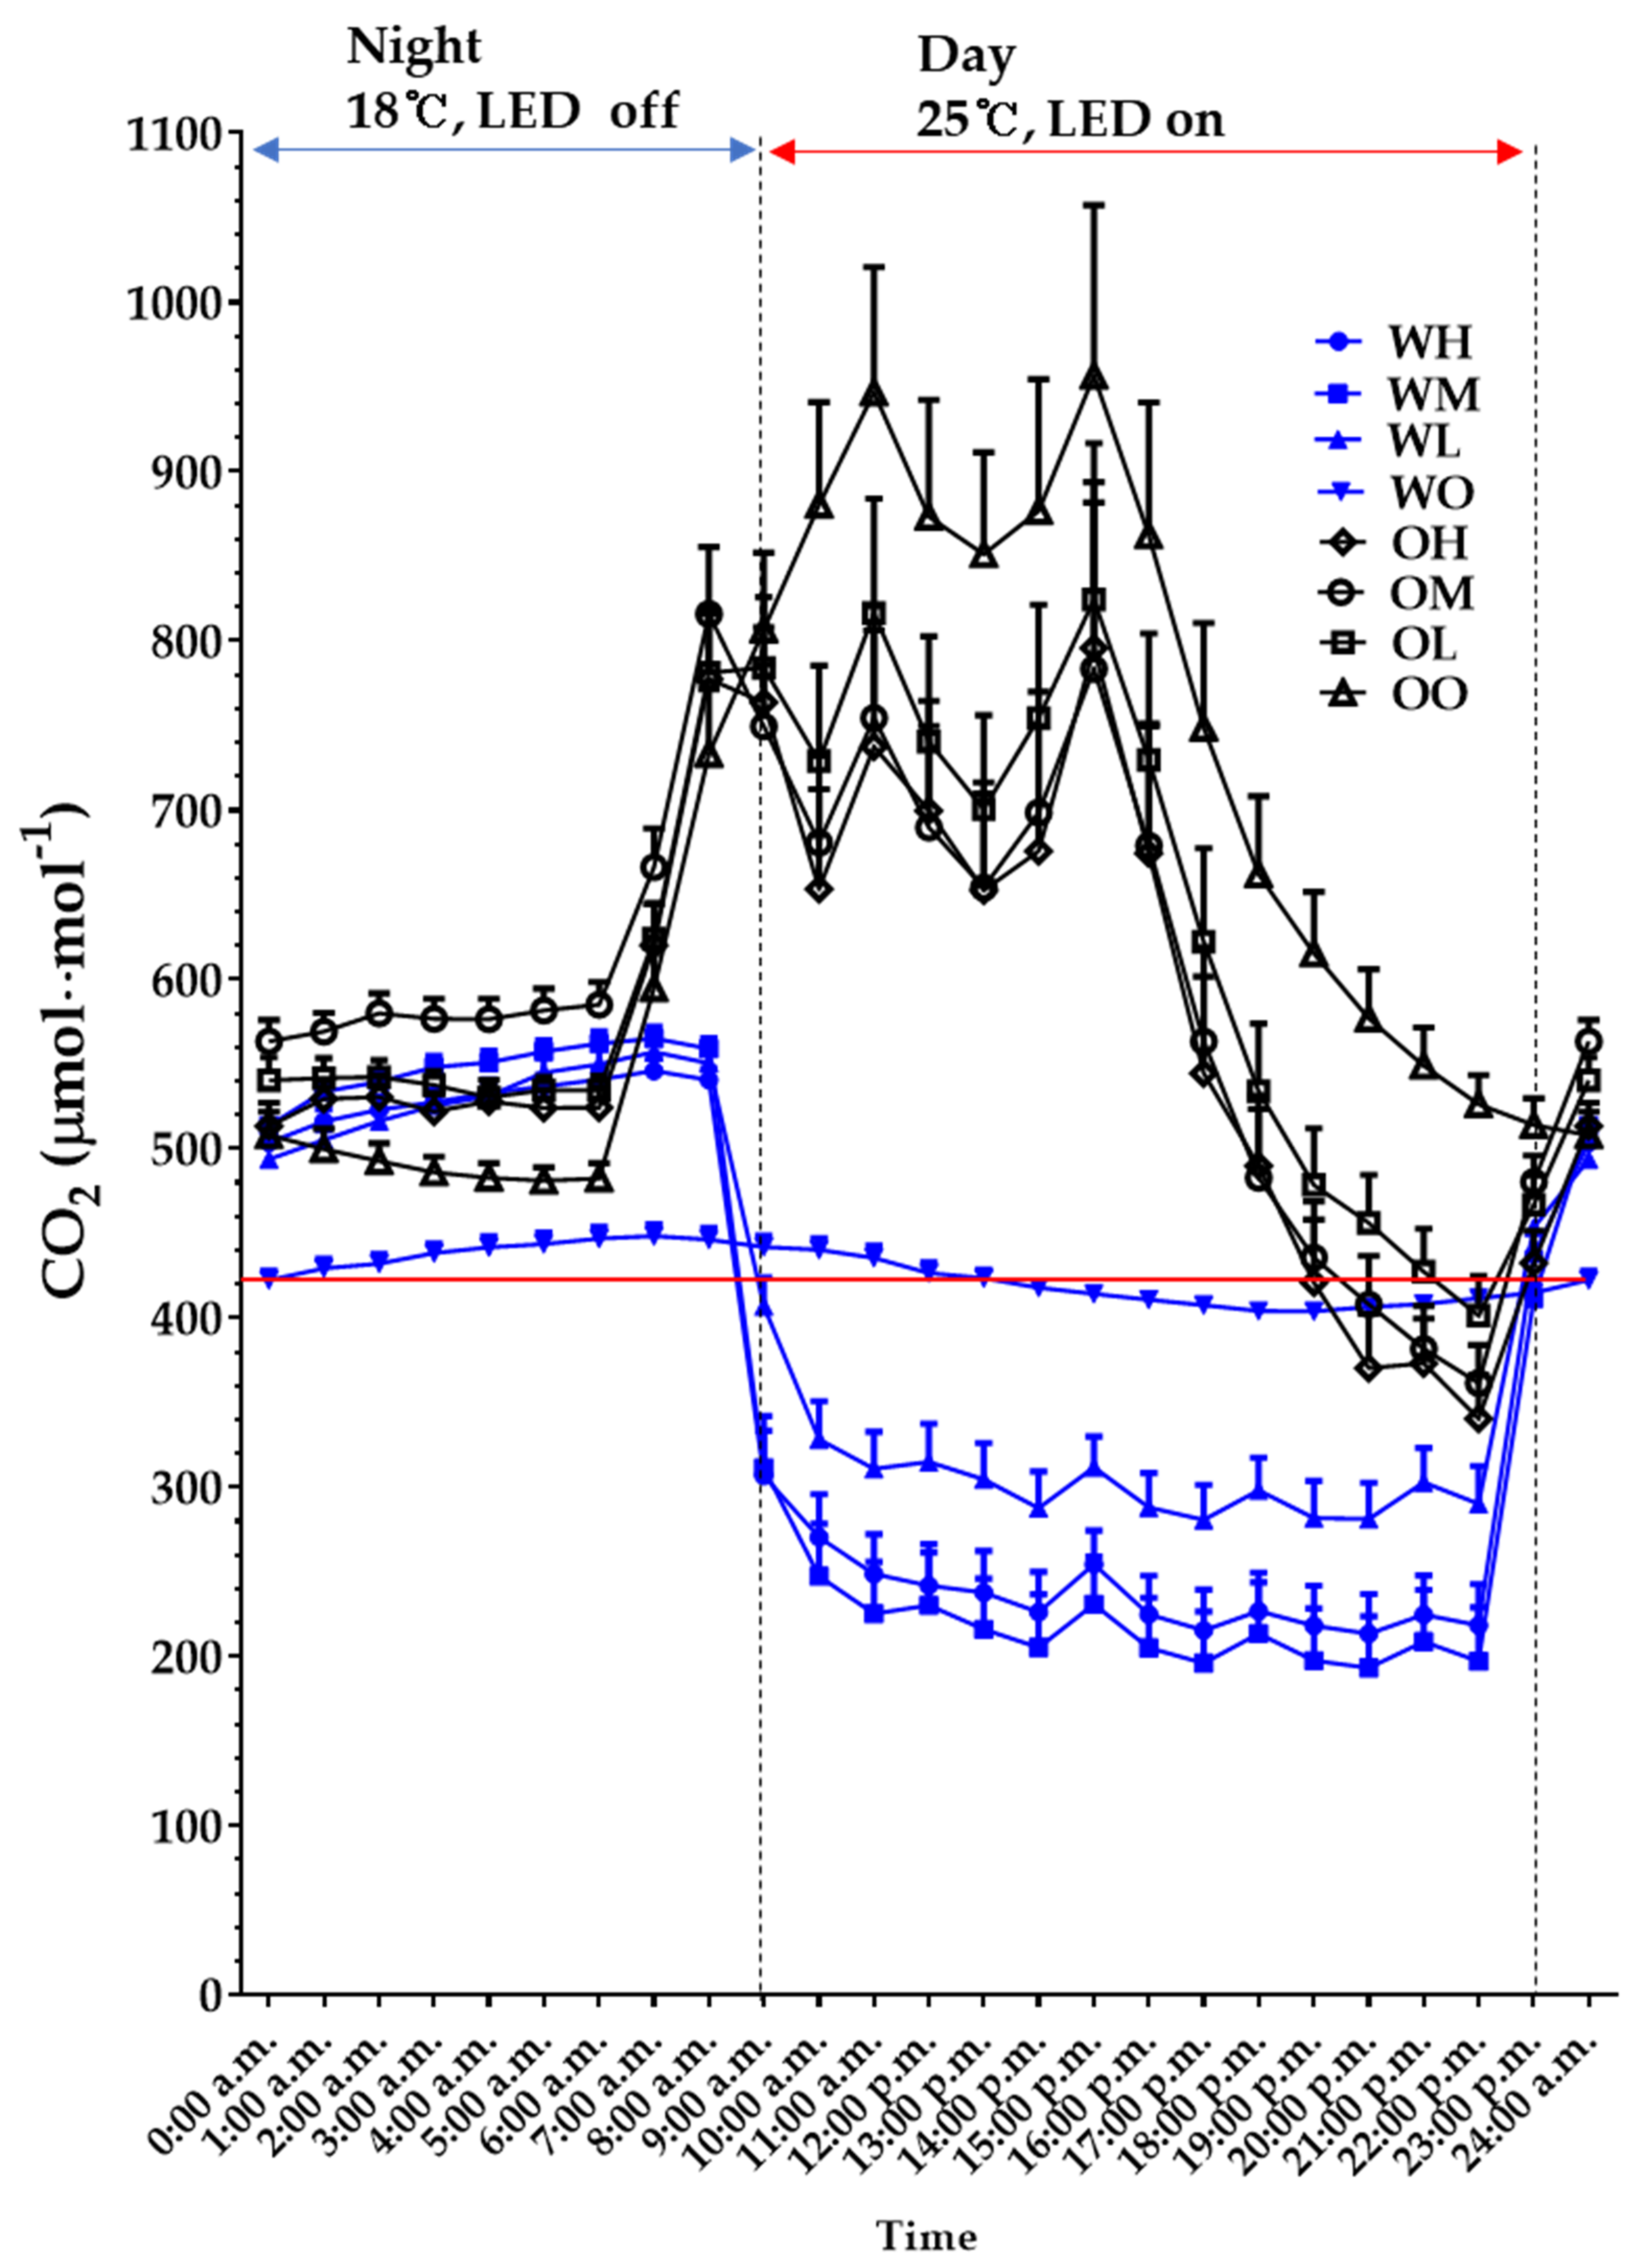
3.1.2. Carbon Dioxide Concentration

The average concentration of atmospheric carbon dioxide in Korea where the study was conducted was 420.4 μmol·mol−1 [22]. The carbon dioxide concentration recorded in the warehouse was generally lower than that in the office and remained stable (Figure 5). The concentration of carbon dioxide in the warehouse was similar to the average atmospheric concentration in Korea. The concentration of carbon dioxide in the cultivation systems in the warehouse during the cultivation period was maintained at a higher level than that in the atmosphere of the warehouse from 23:00 to 09:00, which was set as the nighttime. The concentration during the night was highest in the WM treatment, followed by the WH and WL. Lights were turned on at 09:00 and photosynthesis began. There was no significant change in the carbon dioxide concentration in the warehouse atmosphere. All three cultivation systems set in the warehouse had a rapidly decreasing carbon dioxide concentration, and within an hour after the lighting was turned on, the concentration dropped below the concentration outside in all treatments. After that, the concentration of carbon dioxide was maintained at levels lower than that of the outside until the light was turned off again. As a result, the CO2 concentration in the WL, the treatment with the lowest yield, was maintained relatively higher as compared to the other two treatments. The WM and WH showed lower carbon dioxide concentrations than the WL, but the two treatments were within the error range with no significant difference. As the light was turned off at 23:00, the concentration of carbon dioxide rose sharply in all treatments, suggesting that the consumption of carbon dioxide stopped, while the generation of carbon dioxide by respiration continued. Within an hour of turning off the light, all treatments had levels higher than that in the outside atmosphere. The level kept increasing over time and showed the highest point just before the light was turned on again.
In the office space, the external carbon dioxide concentration changed greatly depending on the presence of the occupant and activity (Figure 5). From 00:00 to 06:00, the CO2 concentration in the office (OO) was lower than that in the cultivation systems, and it showed a tendency to decrease with time. On the other hand, the CO2 concentration in the cultivation systems was higher than that of the OO. In particular, it was highest in the OH treatment, and lower concentrations were found in the OM and OL. The difference in concentration between the OM and OL treatments was within the error range, and there was no significant difference between them. There was usually only one occupant in the office (60 years old, male, 63 kg) who usually came in to work at 06:00. The carbon dioxide concentration of the OO rose sharply after 06:00 until 09:00. The concentration in the three cultivation systems also showed a sharp increase in the same way as the change in the OO. After that, the OO showed a steady increase until 11:30 when lunchtime started and showed a temporary decrease until 13:00 when lunchtime was over. The CO2 concentration rose again until 16:00 when the occupant left the office, and then it decreased until 06:00 the next morning.
The CO2 concentration in the cultivation systems showed three periods with descending concentration. In the first descending period, when the light was turned on at 09:00, the CO2 concentration dropped all at once due to instantaneous consumption because of the resumption of photosynthesis. The second and third descending periods seem to be due to the fact that there was no one in the office during the lunchtime, so the decreasing external CO2 concentration was reflected in the CO2 concentration inside the cultivation systems.
There were differences in the change of CO2 concentration in the warehouse and office. In the office, from 09:00 to 23:00, the CO2 concentrations outside and inside the cultivation systems show the same pattern. Except for 2 h before the dark period, the CO2 concentration outside is consistently higher than that inside the cultivation systems.
In the warehouse, the concentration in the cultivation systems during the day was consistently lower than that outside where the concentration was stable.
The point to note here is the concentration of carbon dioxide in the atmosphere of the experimental sites. Based on Korea’s average atmospheric CO2 concentration of 420.4 µmol·mol−1, the CO2 concentration in the office was maintained at levels higher than the average concentration in the atmosphere, except from 20:00 to 22:00. However, in the warehouse, it was consistently lower than the atmospheric average value from 09:00 to 10:00 when photosynthesis actively occurred.
The average values of external carbon dioxide concentration in the office and warehouse were 763.6 and 449.03 µmol·mol−1. The weight of carbon dioxide supplied to the cultivation systems per hour using the volume flow rate supplied to the cultivation systems differs by OH, 31.80; OM, 24.46; OL, 17.11; WH, 18.70; WM, 14.39; WL, 10.06 mg·h−1. The average amount of carbon dioxide used for photosynthesis was calculated by subtracting the remaining amount in the cultivation system from the amount supplied per hour and adding the amount generated by respiration. In the OH treatment with the highest yield, carbon dioxide consumption per hour was 29.60 mg·h−1. This was approximately three times that of 8.27 mg·h−1 in the WL treatment which has the lowest production.

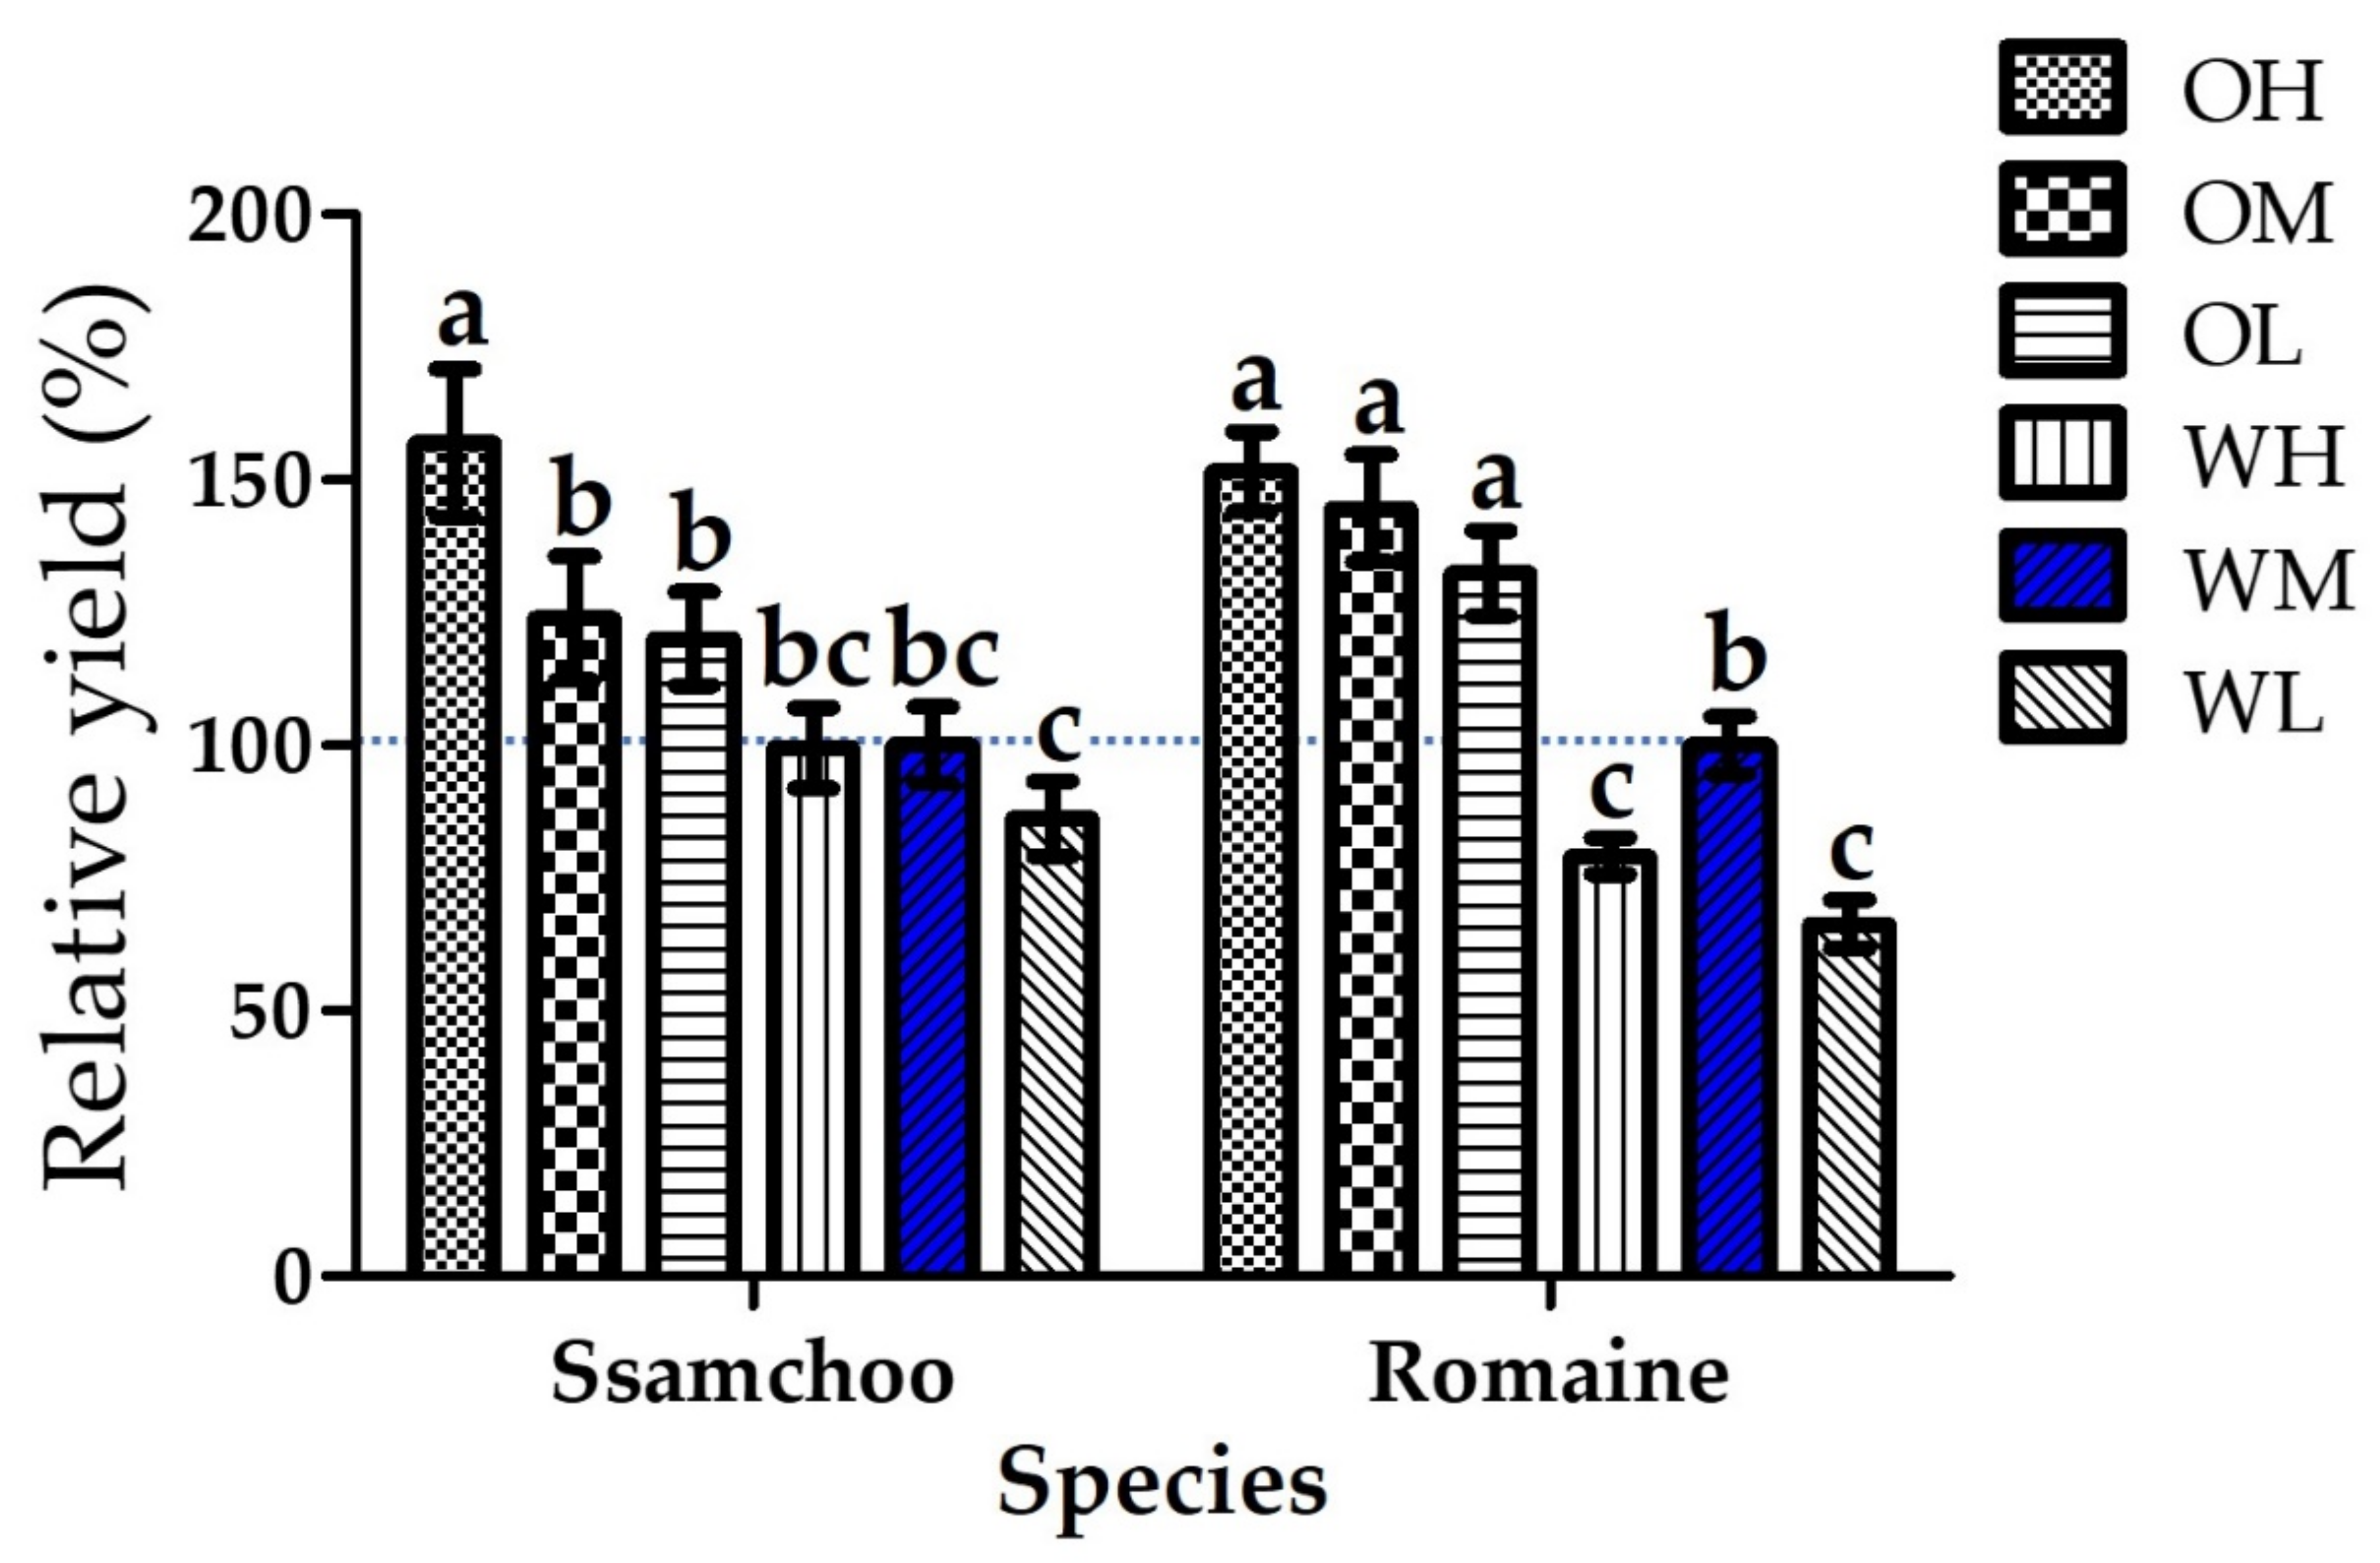
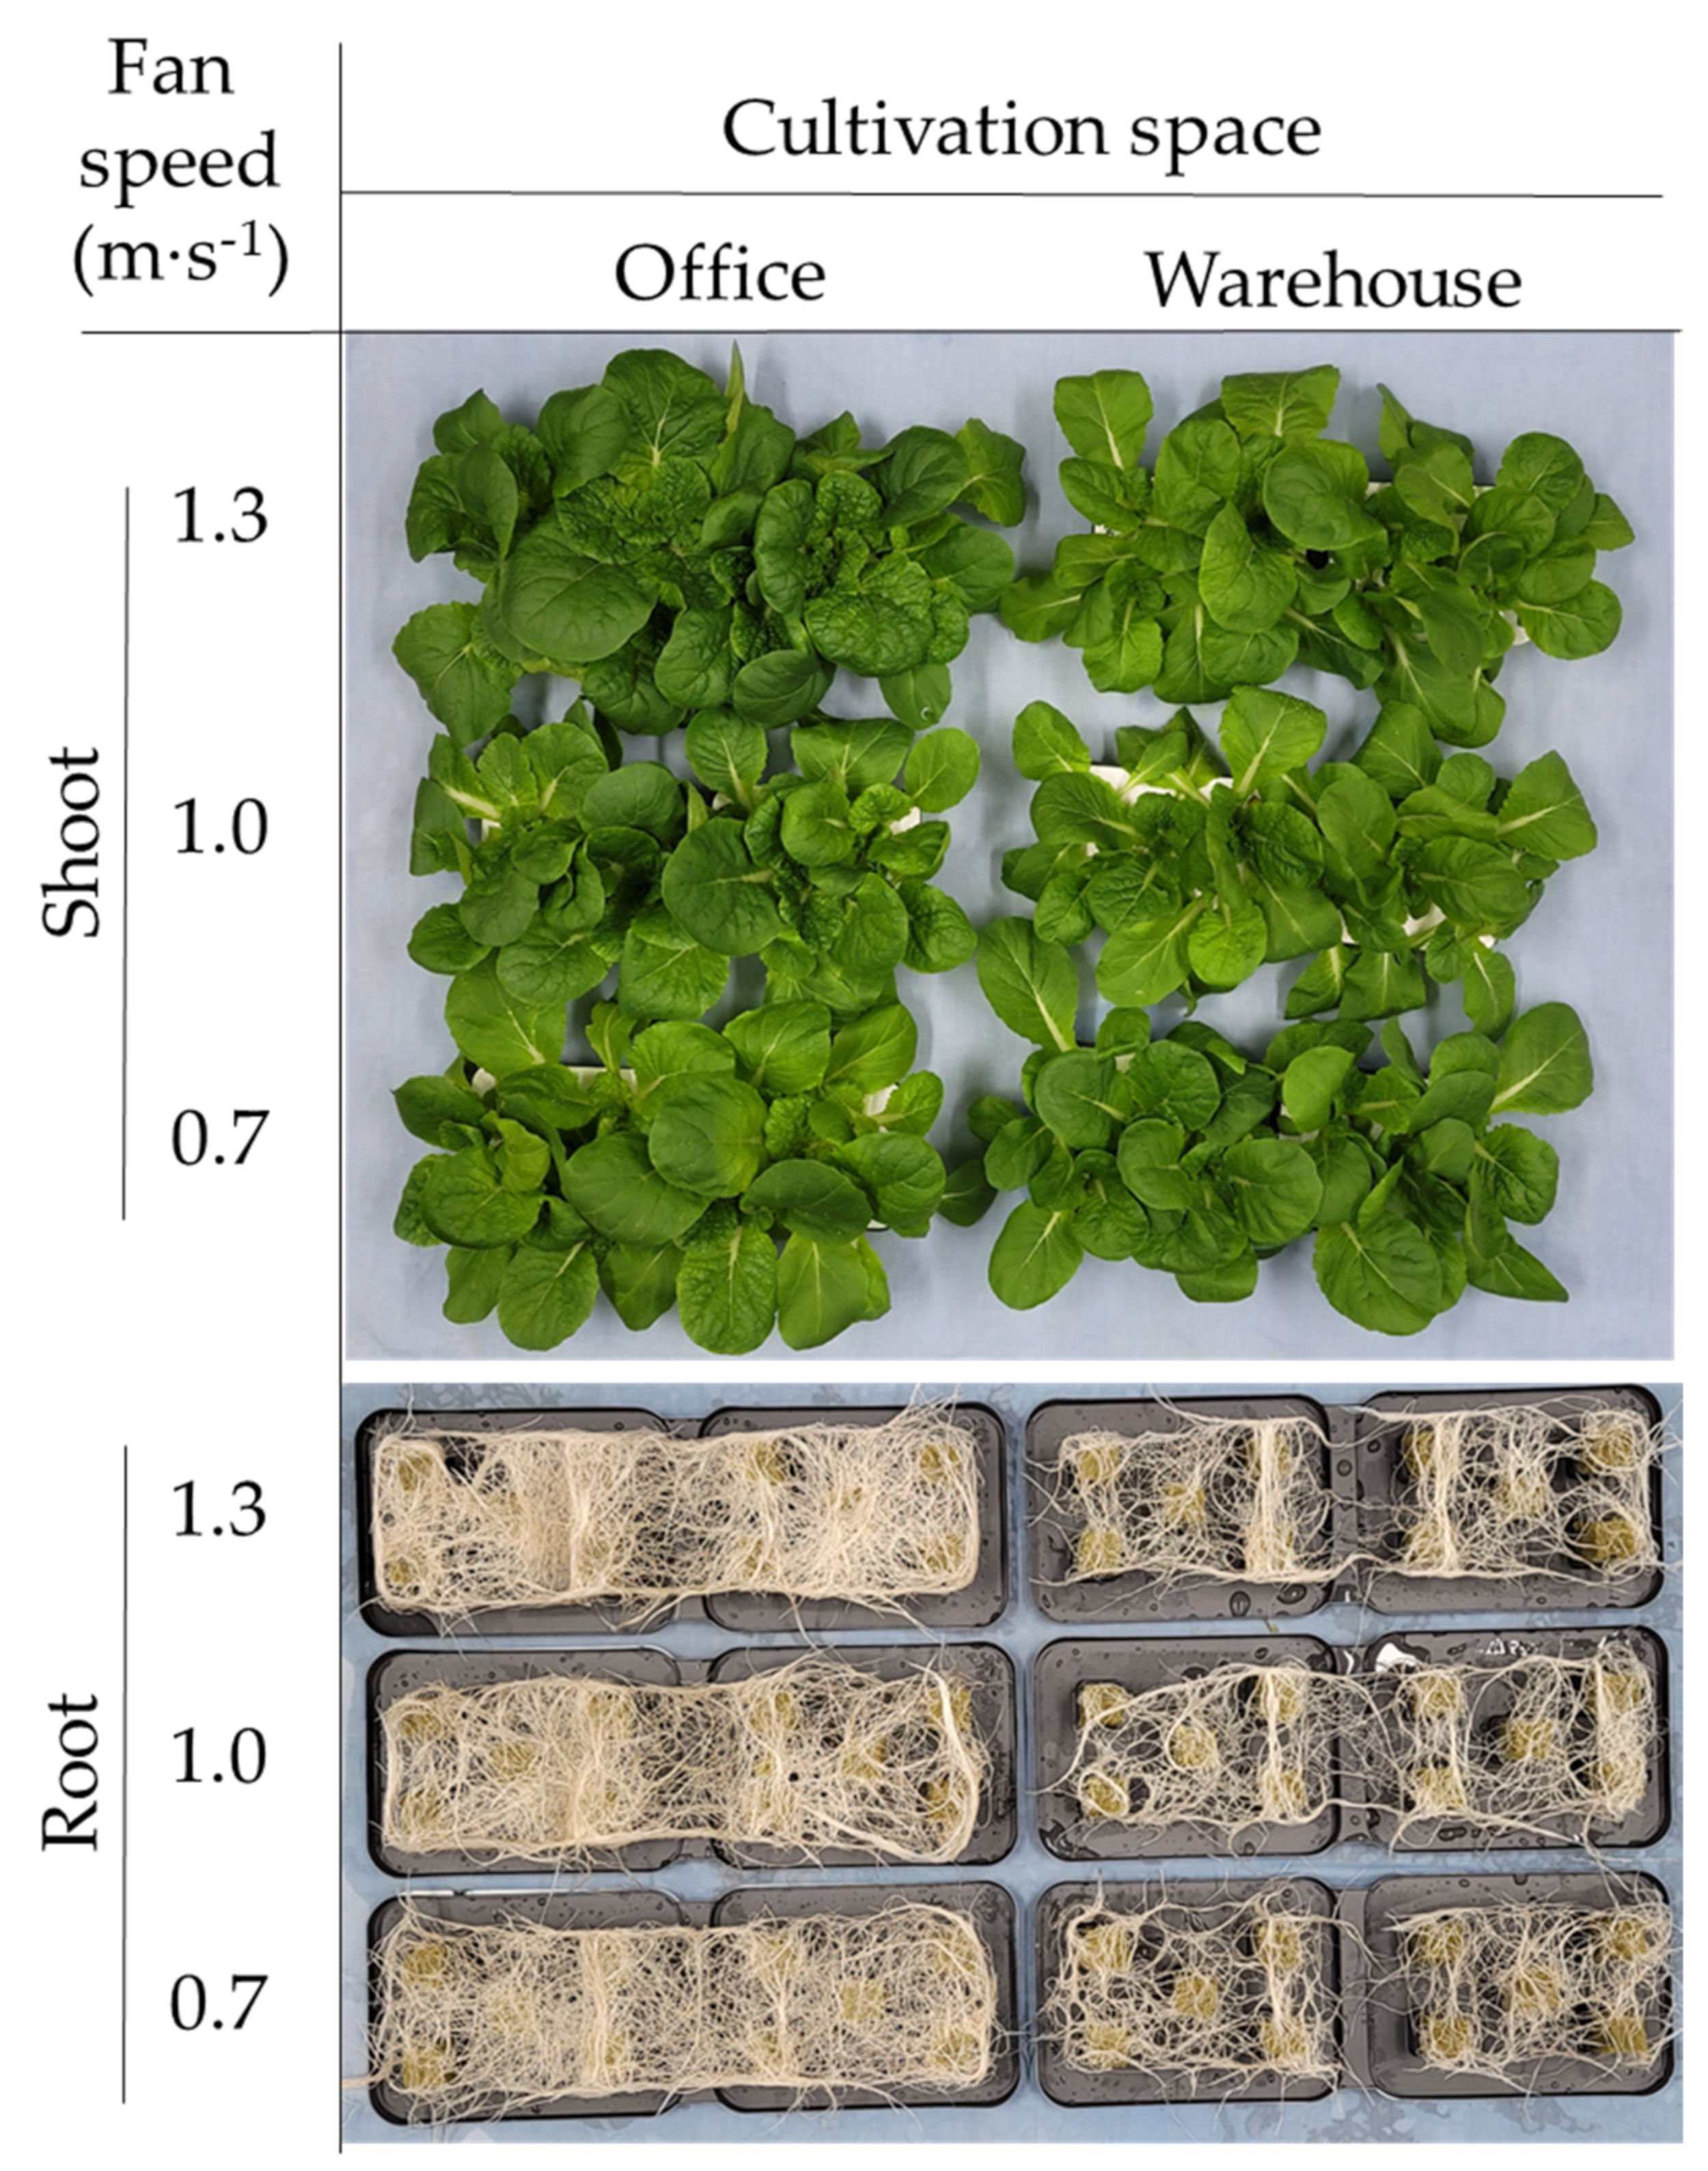
3.2. Plant Growth Parameters

The fresh weight was compared based on the cultivation system location and the fan airspeed for each species (Table 1). The fresh weight greatly differed depending on the species and the location of the cultivation system. The difference due to the fan airspeed was relatively small. The Ssamchoo in the office had the greatest fresh weight in the OH, and the difference between the fresh weight of lettuce grown in the OM and OL was insignificant. For Romaine, fresh weight was significantly the greatest in the OH, but it was not significantly different between the OM and OL. For Ssamchoo grown in the warehouse, the fan airspeed affected fresh weight, and the yield was significantly higher in the WH and WM than that in the WL. In the case of Romaine, the yield was the greatest in the WM, followed by the WH and WL.
Leaf development was better in the cultivation systems placed in the office for both species. The cultivation system location was observed to be the most important factor affecting the leaf length of both species. Romaine leaves were the longest in OH and Ssamchoo leaves were the longest in OL. On the other hand, in the warehouse, Romaine leaves were slightly longer in WM and Ssamchoo leaves in WH, compared to other treatments. In the case of leaf width, the difference was larger in Ssamchoo than in Romaine. Both Ssamchoo and Romaine leaves were the longest in OH. The longest plants were observed in the WH cultivator, out of all the warehouse measurement points. Leaf widths were generally greater in the office than in the warehouse, and the fan airspeed seemed to slightly affect the leaf length. Romaine had the greatest number of leaves in OL and OM, and Ssamchoo had the greatest number of leaves in OH. Although there was a difference depending on the species, it was observed for both Ssamchoo and Romaine that the location of the cultivation systems was highly significant, where the office provided a better growth environment than the warehouse did.
The standard fan airspeed setting in the used cultivation systems was 1.0 m·s−1. The carbon dioxide concentration varies greatly depending on the nature of the space or lifestyle. The relative yields of each species in this study were analyzed with the fresh weight of Ssamchoo and Romaine grown in the WM being considered as 100% (Figure 6). Yields were significantly higher in the office than in the warehouse. For Ssamchoo, the OH, OM, and OL yields were, respectively, 156.9, 123.9, and 120.1% relative to the WM Ssamchoo yield. In the warehouse, the WL Ssamchoo yield (86.2%) was lower than the WH (99.5%) and WM (100.0%) yields.
For Romaine, OH (151.6%), OM (144.6%), and OL (132.4%) yields were all significantly higher than those in the warehouse. Both the WH (79.1%) and WL (66.3%) yields were significantly lower than the WM (100.0%) yield.
This difference can also be seen in photos taken on the day of harvest (Figure 7). As can be seen, the Ssamchoo cultivated in the office grew better than the Ssamchoo cultivated in the warehouse (Figure 7). Also, the root development of plants grown in offices and warehouses was different. There was a difference in the amount and density of the roots, and the roots of the plants grown in the warehouse were slightly darker (Figure 7).
Romaine was better grown in the office than in the warehouse, too. Although the difference in the development of roots was less than that of Ssamchoo, the roots of Romaine grown in the office were denser than those grown in the warehouse (Figure 8).

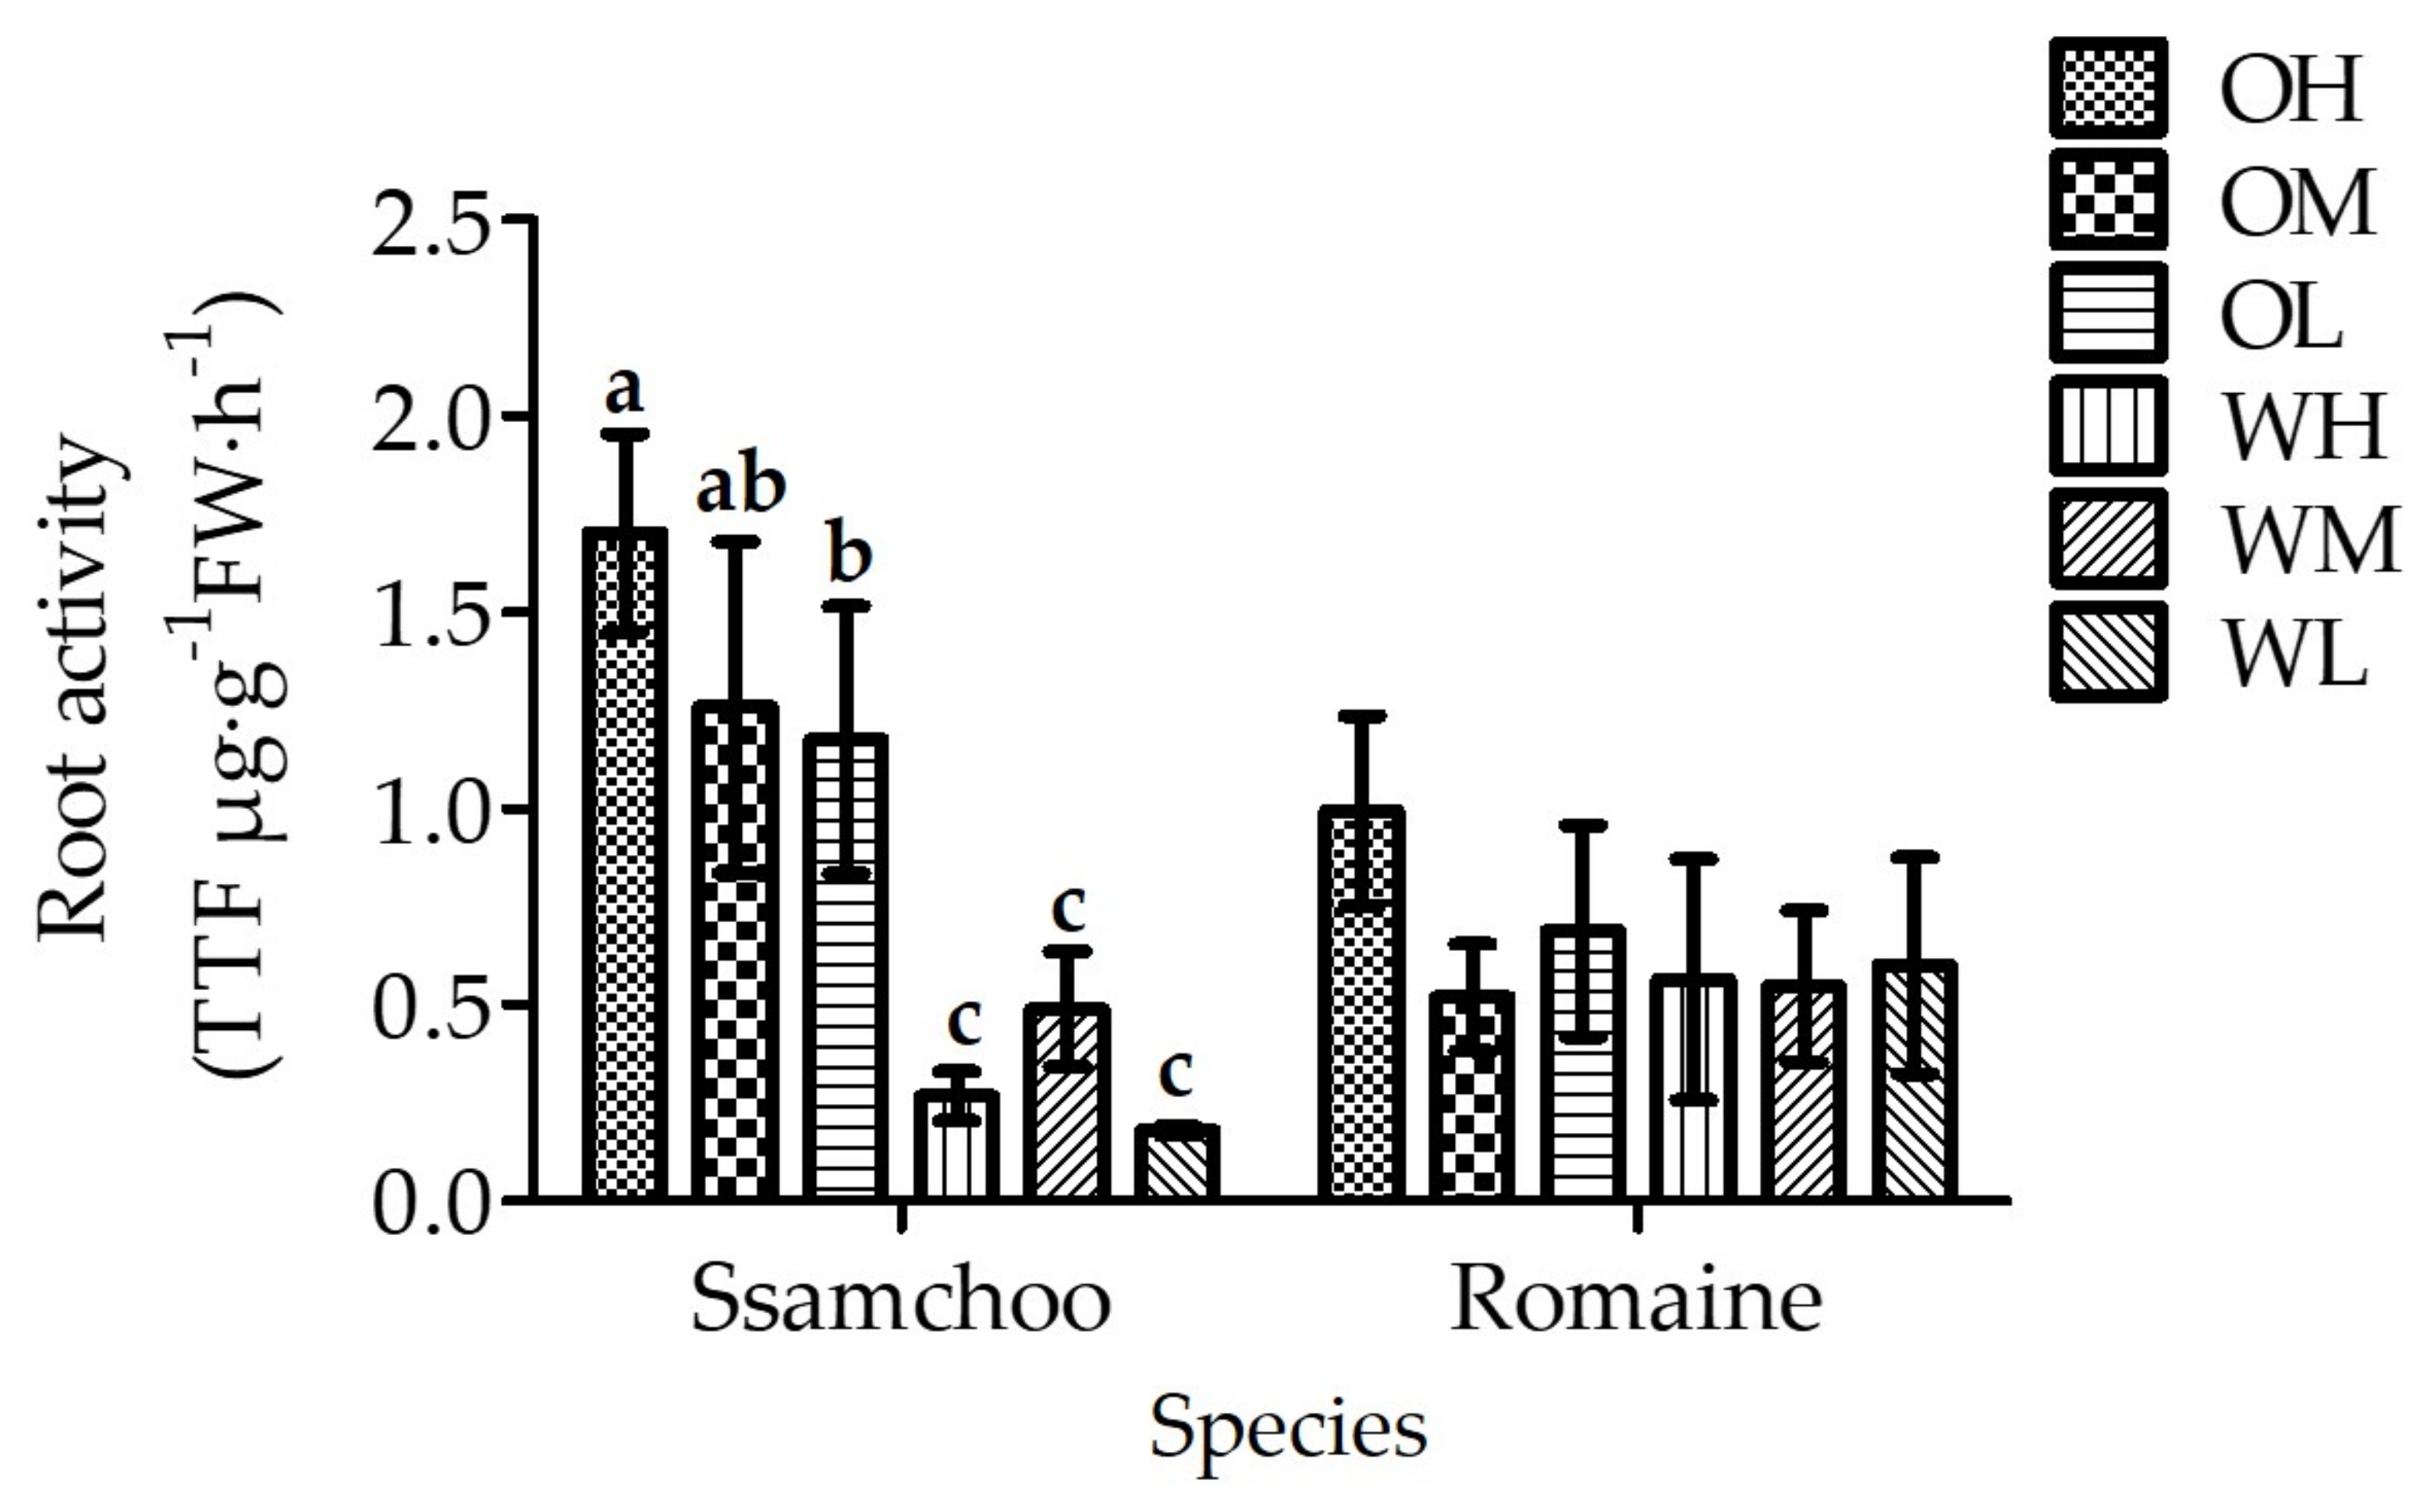
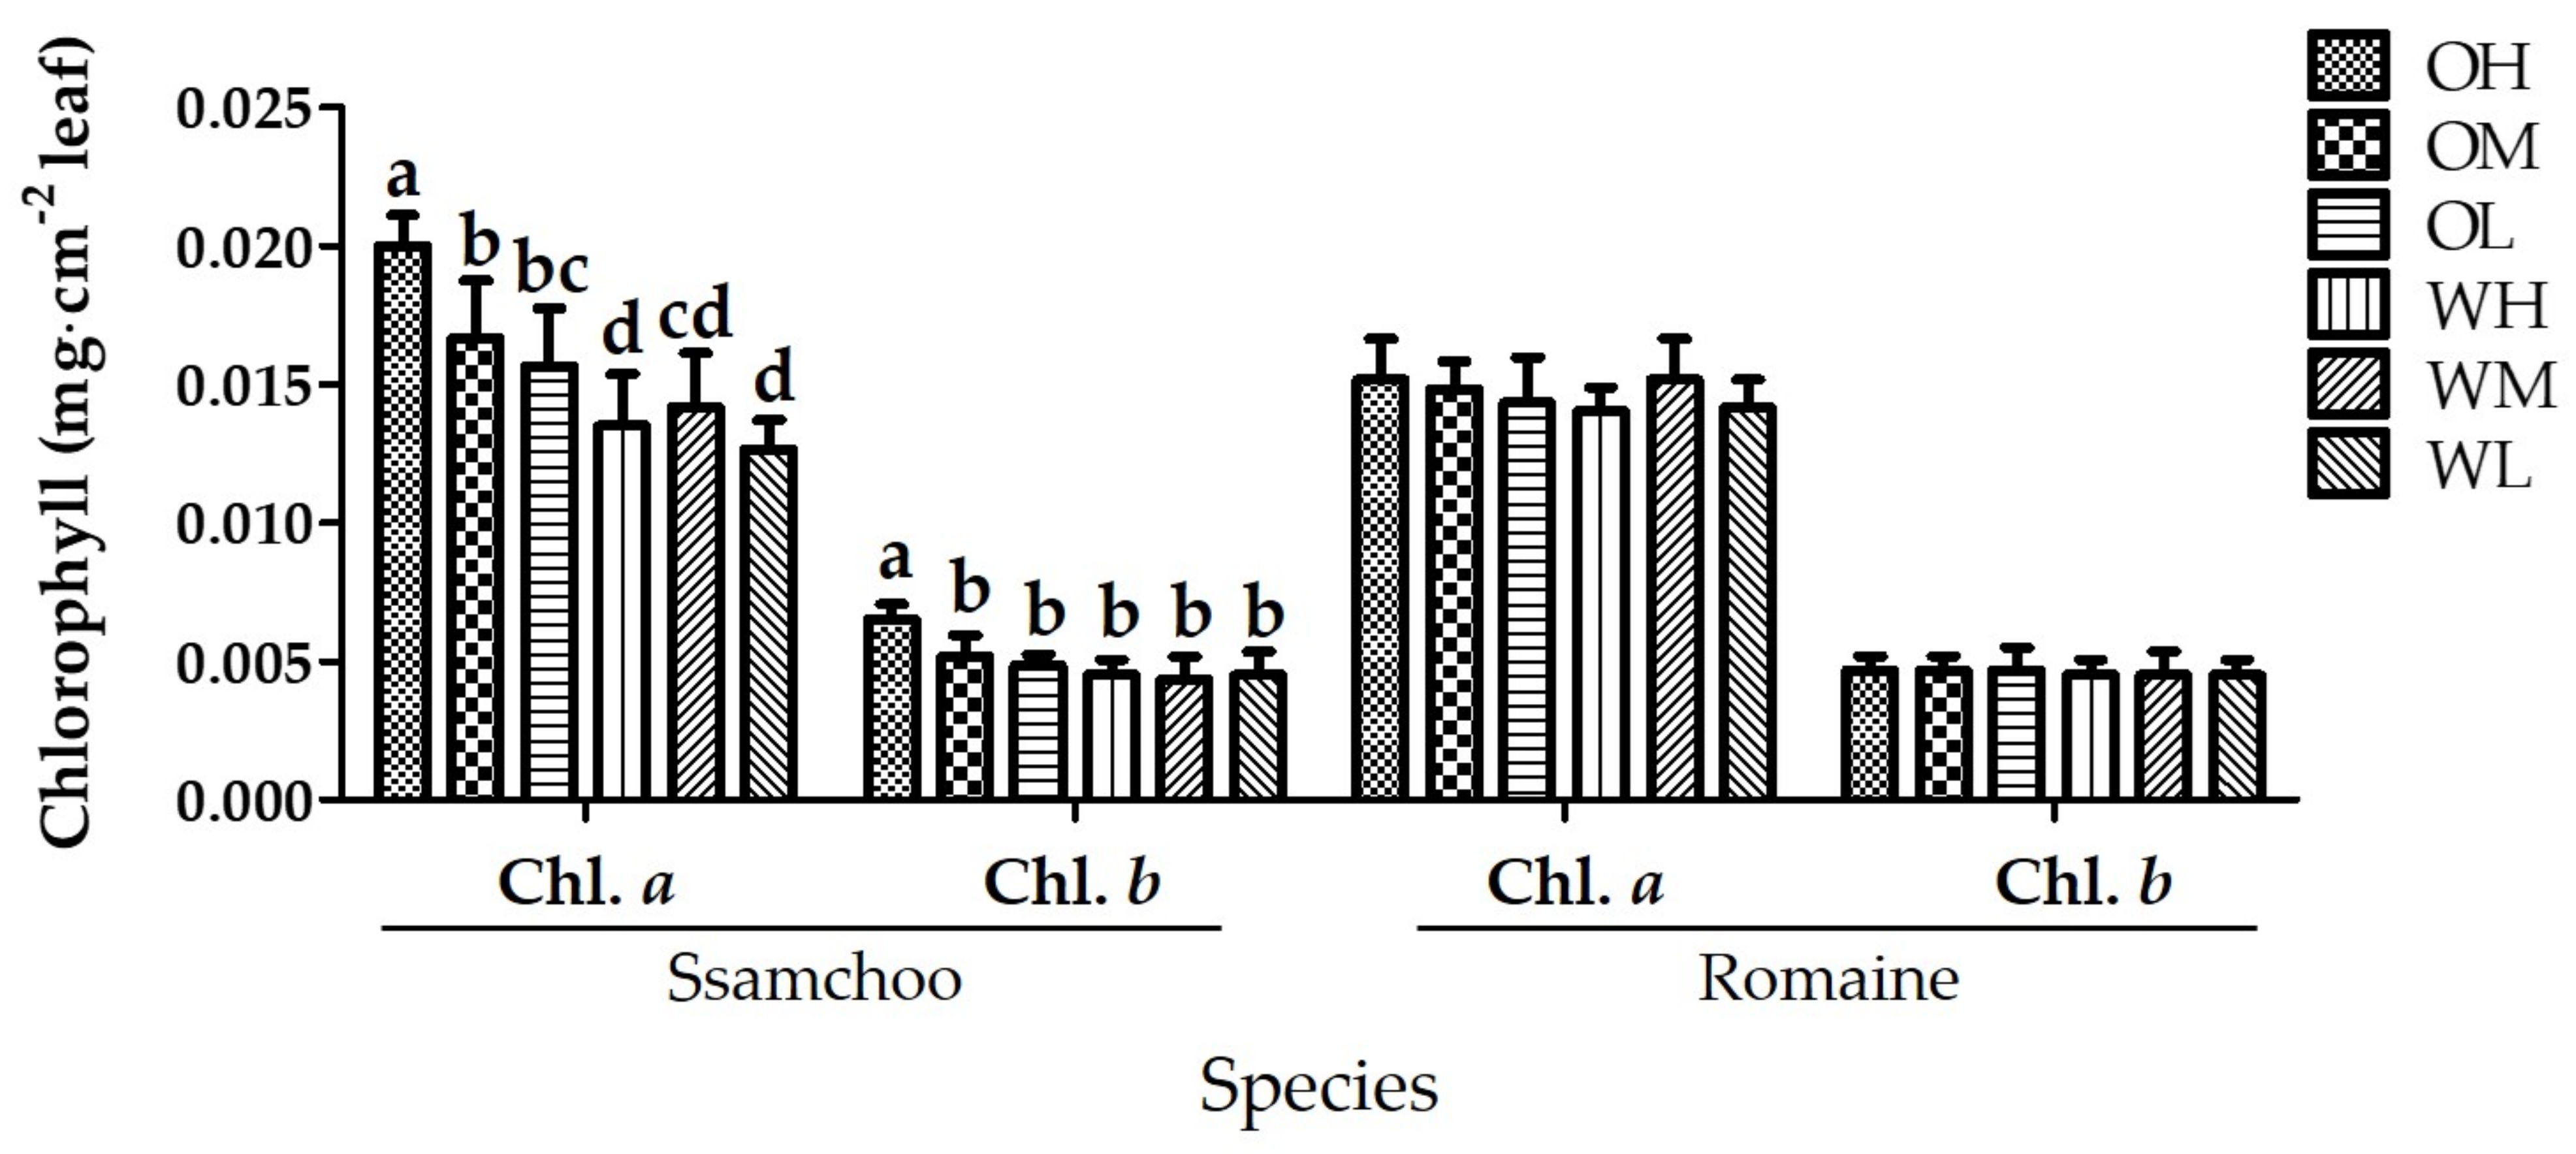
3.3. Chlorophyll Content and Root Activity

For Ssamchoo, the root activity was the highest in OH, followed in order by that in OM, and OL (Figure 9). Roots of all Ssamchoo grown in the warehouse were less active than those of Ssamchoo grown in the office, and there were no significant differences between the treatments. Romaine grown in OH displayed the greatest root activity, but there were no significant differences in the root activity of Romaine grown in different cultivation conditions.
When the chlorophyll content at the time of harvest was analyzed and compared, there was a significant difference in the case of Ssamchoo, but no differences in the case of Romaine (Figure 10). Ssamchoo had high chlorophyll a content in the order of OH, OM, and OL, and in the warehouse, the greatest chlorophyll a content was observed in WM. The chlorophyll b content was also the greatest in OH, but there were no significant differences in the other treatments. Although there were differences between species, it was found that the office more effectively increased the chlorophyll contents than the warehouse did.

3.4. Soluble Protein, Soluble Sugar, and Starch Contents, and Antioxidant Enzyme Activities

For both Ssamchoo and Romaine, the growth environment did not affect the soluble protein contents (Table 2). For Ssamchoo, the greatest soluble sugar content was observed in OH, followed in order by WM and WH. For Romaine, the soluble sugar content was the greatest in OL followed by WM. Although the differences between the species were large, there were no significant differences for both species according to the growth conditions.
There were no significant differences in the starch content between the two species (Table 2). On the other hand, the starch content significantly differed depending on the position of the cultivation system and the fan airspeed. For both Ssamchoo and Romaine, the greatest starch content was observed in WL. Ssamchoo and Romaine grown in the office showed less significant differences between the different cultivation conditions than they did in the warehouse. The proline content was not significantly different between the different cultivation conditions for Ssamchoo (Table 2). For Romaine, the fan airspeed slightly affected the proline content.
The activity of antioxidant enzymes differed greatly between species (Table 3). Furthermore, the fan airspeed affected the antioxidant enzyme activities more significantly than the location of the cultivation system did. For Ssamchoo, GPX was the most active with the low fan speed in both the office and warehouse. The GPX activity for Romaine was not significantly different among the different treatments. For both Romaine and Ssamchoo, the CAT activity was more greatly affected by the fan airspeed than by the cultivator location. High CAT activities were observed with the high fan airspeed in OH and WH. The SOD activity differed greatly between species and was also affected by the fan airspeed. For Ssamchoo, the greatest SOD activities were observed with medium fan speeds, at OM and WM. For Romaine, the fan airspeed affected the SOD activity, but no distinctive trends could be identified. APX tended to be more active in warehouses compared to offices for both species. Ssamchoo had the highest APX activity in WM, and Romaine had the highest APX activity in WH.

4. Discussion

Plant factories are central to the current agricultural transformation [23,24]. In accordance with the transition from field cultivation to hydroponics [25], environmental conditions that affect plant growth are artificially provided, and in particular, abiotic factors such as light [26,27], temperature [28], and carbon dioxide [29] are considered to be much more important than ever before [30,31].
As various studies on plant growth promotion have progressed, many attempts have been made to study the effects of atmospheric carbon dioxide concentration on plant growth [32]. Changes in the carbon dioxide concentration have a significant impact on the plant yield [33]. This can be explained in two ways: promoting photosynthesis and increasing water use efficiency. This is because separately supplying carbon dioxide in agricultural facilities or plant factories plays a significant role in increasing production [34].
In general, industrial developments range from small-scale to large-scale approaches. In the cultivation system industry, attempts are being made to develop a small-scale system in a situation where large-scale industrial production is becoming common [35]. Economically realizing a small-scale cultivation system is a difficult and considerable task. Small-scale cultivation systems target a variety of consumers, beyond the consumers of existing agricultural growers. In other words, the diversified consumer base expands and diversifies into hobbies, interior design, and learning, rather than increasing income with an increased production, which was the original purpose of plant cultivators. Therefore, it is highly likely that those who use a plant cultivation system have less understanding of plants and less interest in the cultivation process compared to professional users who have mainly used the existing large-scale cultivation systems. There will be more consumers who view plants as an industrial product with constant input and output, rather than as sensitive organisms in the environment. The cultivation process should be easy and simple from start to finish. It is necessary to implement the operation to be as easy as possible while minimizing the periodic input.
There were three reasons for avoiding a separate carbon dioxide input in this study. Firstly, carbon dioxide is one of the pollutants of indoor air quality. Secondly, the characteristics of the consumers, as mentioned above, needs to be considered, and thirdly, it aims to improve indoor air quality by using small-scale cultivation systems.
We were able to confirm several things through this study. Firstly, the concentration of carbon dioxide in human spaces was kept higher than the atmospheric concentration and was able to supply the amount of carbon dioxide needed for the growth of plants. Raising carbon dioxide from 400 to 1000 µmol·mol−1 in a plant factory or greenhouse increases production, so greenhouse growers and plant tissue culturists often supply additional carbon dioxide [36]. It has been shown that just one adult occupying an office space of 49 m3 for eight hours per day can supply carbon dioxide at a level of 1000 µmol·mol−1, which is similar to the concentration supplemented to greenhouses.
Secondly, when there is no photosynthesis, the fan speed of the cultivation systems can exchange the air inside sufficiently fast enough. The CO2 concentration inside the cultivation systems increased at the same time as the external concentration increased. There was no difference in the slope of the graph for each treatment in this rising stage. This can be understood as the effect of the CO2 concentration due to respiration during the night, not due to the fan speed treatment, in the increasing CO2 concentration. The first decline at 10:00 begins with the resumption of photosynthesis as the light was turned on at 9:00 and it seems that this process consumed as much carbon dioxide as plants in the cultivation system can use for the following hour. Then, until the light goes out at 23:00, carbon dioxide in the cultivation systems changed in the same manner, while maintaining certain gaps with the external concentration. This interval can be converted into the amount of carbon dioxide used for photosynthesis, excluding the amount of carbon dioxide generated by plants in the cultivation systems in respiration.
This shows that the amount of carbon dioxide used for photosynthesis varies depending on the location and the speed of the fan. The warehouse could have needed more carbon dioxide to support a similar level of plant growth as in the office since those plants did not grow as much due to lower levels of carbon dioxide in the warehouse [37].
Both Ssamchoo and Romaine had higher fresh weights in the office. Moreover, the shoot length, leaf length, and leaf width were long, and there were more leaves produced. In addition, as for the difference as influenced by the fan speed, in all treatments other than the WM, the faster the fan speed, the more the plant growth.
When relative yields were compared based on the WM, the office showed significantly higher yields in both Ssamchoo and Romaine. In the case of the fan speed, the OH and WM treatments were effective in both Ssamchoo and Romaine, but other than that, there was no consistent trend in yield as affected by the fan speed. Both Ssamchoo and Romaine grew better in the office than the warehouse, and the difference was more pronounced in the root in terms of the number and density of roots as well as length. The plants grown in the office possessed longer roots so the roots from the adjacent cells touched each other, whereas the plants grown in the warehouse had relatively shorter and non-twining roots [38].
Differences in the growth parameters, such as the root development, antioxidant enzyme activities, and chlorophyll content, were more pronounced in Ssamchoo. Romaine had no significant difference or tendency in root activity, chlorophyll content, and antioxidant activity. The concentration of carbon dioxide, which changed depending on the cultivation space or the speed of the fan, did not affect the protein content of Ssamchoo and Romaine [39]. The faster the speed of the fan, the greater the Ssamchoo yield as the yield was significantly greater in the OH than in OM or OL. In addition, the root activity and chlorophyll content were also greater in the OM than in other fan speed treatments. However, in the case of Romaine, there was no significant difference in yield, root activity, or chlorophyll content as affected by the speed of the fan. This means that the influence of CO2 concentration or the fan airspeed varies depending on the species.
In conclusion, additional research is needed on the speed of the ventilation fan that maximizes the growth in various plant varieties without heat loss in the cultivation system. When the amount of carbon dioxide supplied is limited, more light is a waste of energy that cannot increase plant growth, and at the same time causes growth retardation due to photorespiration [40]. Therefore, research is also necessary on the fan speed and light quantity suitable for changing factors such as the presence or absence of people or other CO2 generating activities such as cooking. Furthermore, research on whether indoor air pollutants, such as formaldehyde, volatile organic compounds, and fine dust, can also be removed by cultivating plants is worthy of investigation.

Author Contributions

Conceptualization, K.N. and B.R.J.; data curation, K.N.; formal analysis, K.N. and B.R.J.; funding acquisition, B.R.J.; investigation, K.N.; methodology, K.N.; project administration, B.R.J.; resources, B.R.J.; software, K.N.; supervision, B.R.J.; validation, B.R.J.; visualization, B.R.J.; writing—original draft, K.N.; writing—review and editing, B.R.J. All authors have read and agreed to the published version of the manuscript.

Funding

This research was funded by LG Electronics (Project No. C2020040728). Kyungdeok Noh was supported by a scholarship from the BK21 Four, Ministry of Education, Republic of Korea.

Institutional Review Board Statement

Not applicable.

Informed Consent Statement

Not applicable.

Conflicts of Interest

The authors declare no conflict of interest.

References

  1. Robelia, B.; Murphy, T. What do people know about key environmental issues? A review of environmental knowledge surveys. Environ. Educ. Res. 2012, 18, 299–321. [Google Scholar] [CrossRef]
  2. Grasmück, D.; Scholz, R.W. Risk perception of heavy metal soil contamination by high-exposed and low-exposed inhabitants: The role of knowledge and emotional concerns. Risk Anal. Int. J. 2005, 25, 611–622. [Google Scholar] [CrossRef]
  3. Brönmark, C.; Hansson, L.-A. Environmental issues in lakes and ponds: Current state and perspectives. Environ. Conserv. 2002, 29, 290–307. [Google Scholar] [CrossRef] [Green Version]
  4. Li, Y.; Henze, D.K.; Jack, D.; Kinney, P.L. The influence of air quality model resolution on health impact assessment for fine particulate matter and its components. Air Qual. Atmos. Health 2016, 9, 51–68. [Google Scholar] [CrossRef] [PubMed] [Green Version]
  5. Noh, K.; Jeong, B.R. Particulate matter in the cultivation area may contaminate leafy vegetables with heavy metals above safe levels in Korea. Environ. Sci. Pollut. Res. 2019, 26, 25762–25774. [Google Scholar] [CrossRef] [Green Version]
  6. Jones, A.P. Indoor air quality and health. Atmos. Environ. 1999, 33, 4535–4564. [Google Scholar] [CrossRef]
  7. Persily, A.K. Indoor carbon dioxide concentrations in ventilation and indoor air quality standards. In Proceedings of the 36th AIVC Conference Effective Ventilation in High Performance Buildings, Madrid, Spain, 23–24 September 2015; pp. 810–819. [Google Scholar]
  8. Wyon, D.P. The effects of indoor air quality on performance and productivity. Indoor Air 2004, 14, 92–101. [Google Scholar] [CrossRef]
  9. Weschler, C.J.; Shields, H.C. The influence of ventilation on reactions among indoor pollutants: Modeling and experimental observations. Indoor Air 2000, 10, 92–100. [Google Scholar] [CrossRef]
  10. Persily, A.K.; Emmerich, S.J. Indoor air quality in sustainable, energy efficient buildings. HvacR Res. 2012, 18, 4–20. [Google Scholar]
  11. Jeong, B.K.; Fujiwara, K.; Kozai, T. Carbon dioxide enrichment in autotrophic micropropagation: Methods and advantages. HortTechnology 1993, 3, 332–334. [Google Scholar] [CrossRef]
  12. Noh, K.; Jeong, B.R. Optimizing temperature and photoperiod in a home cultivation system to program normal, delayed, and hastened growth and development modes for leafy Oak-leaf and Romaine lettuces. Sustainability 2021, 13, 10879. [Google Scholar] [CrossRef]
  13. Onanuga, A.O.; Adl, S. Effect of phytohormones, phosphorus and potassium on cotton varieties (Gossypium hirsutum) root growth and root activity grown in hydroponic nutrient solution. J. Agric. Sci. 2012, 4, 93. [Google Scholar] [CrossRef]
  14. Vasseur, F.; Pantin, F.; Vile, D. Changes in light intensity reveal a major role for carbon balance in Arabidopsis responses to high temperature. Plant Cell Environ. 2011, 34, 1563–1576. [Google Scholar] [CrossRef]
  15. Ren, X.X.; Xue, J.Q.; Wang, S.L.; Xue, Y.Q.; Zhang, P.; Jiang, H.D.; Zhang, X.X. Proteomic analysis of tree peony (Paeonia ostii ‘Feng Dan’) seed germination affected by low temperature. J. Plant Physiol. 2018, 224, 56–67. [Google Scholar] [CrossRef] [PubMed]
  16. Song, J.; Li, Y.; Hu, J.; Lee, J.; Jeong, B.R. Pre-and/or postharvest silicon application prolongs the vase life and enhances the quality of cut peony (Paeonia lactiflora Pall.) Flowers. Plants 2021, 10, 1742. [Google Scholar] [CrossRef] [PubMed]
  17. Muneer, S.; Soundararajan, P.; Jeong, B.R. Proteomic and antioxidant analysis elucidates the underlying mechanism of tolerance to hyperhydricity stress in in vitro shoot cultures of Dianthus caryophyllus. J. Plant Growth Regul. 2016, 35, 667–679. [Google Scholar] [CrossRef]
  18. Ginnopolitis, C.; Rice, S. Superoxide dismutase purification and quantitative relationship with water soluble protein in seedling. Plant Physiol. 1977, 59, 315–318. [Google Scholar] [CrossRef] [Green Version]
  19. Cakmak, I.; Marschner, H. Magnesium deficiency and high light intensity enhance activities of superoxide dismutase, ascorbate peroxidase, and glutathione reductase in bean leaves. Plant Physiol. 1992, 98, 1222–1227. [Google Scholar] [CrossRef] [Green Version]
  20. Shah, K.; Kumar, R.G.; Verma, S.; Dubey, R. Effect of cadmium on lipid peroxidation, superoxide anion generation and activities of antioxidant enzymes in growing rice seedlings. Plant Sci. 2001, 161, 1135–1144. [Google Scholar] [CrossRef]
  21. Nakano, Y.; Asada, K. Hydrogen peroxide is scavenged by ascorbate-specific peroxidase in spinach chloroplasts. Plant Cell Physiol. 1981, 22, 867–880. [Google Scholar]
  22. Lee, H.; Oh, Y.; Kim, J.; Choi, T. Report of Global Atmosphere Watch 2020; National Institute of Meteorological Sciences: Seogwipo-si, Korea, 2021; pp. 67–112.
  23. Gilmour, D.N.; Bazzani, C.; Nayga Jr, R.M.; Snell, H.A. Do consumers value hydroponics? Implications for organic certification. Agric. Econ. 2019, 50, 707–721. [Google Scholar] [CrossRef]
  24. Manos, D.P.; Xydis, G. Hydroponics: Are we moving towards that direction only because of the environment? A discussion on forecasting and a systems review. Environ. Sci. Pollut. Res. 2019, 26, 12662–12672. [Google Scholar] [CrossRef] [PubMed]
  25. Agarwal, A.; Prakash, O.; Sahay, D.; Kumar, P.; Bala, M. Hydroponics (soil-less cultivation): A space effective and water efficient technology for sustainable agriculture. Int. J. Agric. Environ. Sustain. 2019, 1, 4–9. [Google Scholar]
  26. Mitchell, C.A.; Sheibani, F. LED advancements for plant-factory artificial lighting. In Plant Factory; Elsevier: Amsterdam, The Netherlands, 2020; pp. 167–184. [Google Scholar]
  27. Shimizu, H.; Saito, Y.; Nakashima, H.; Miyasaka, J.; Ohdoi, K. Light environment optimization for lettuce growth in plant factory. IFAC Proc. Vol. 2011, 44, 605–609. [Google Scholar] [CrossRef] [Green Version]
  28. Lee, R.J.; Bhandari, S.R.; Lee, G.; Lee, J.G. Optimization of temperature and light, and cultivar selection for the production of high-quality head lettuce in a closed-type plant factory. Hortic. Environ. Biotechnol. 2019, 60.2, 207–216. [Google Scholar] [CrossRef]
  29. Jung, D.H.; Kim, D.; Yoon, H.I.; Moon, T.W.; Park, K.S.; Son, J.E. Modeling the canopy photosynthetic rate of romaine lettuce (Lactuca sativa L.) grown in a plant factory at varying CO2 concentrations and growth stages. Hortic. Environ. Biotechnol. 2016, 57, 487–492. [Google Scholar] [CrossRef]
  30. Kozai, T. Resource use efficiency of closed plant production system with artificial light: Concept, estimation and application to plant factory. Proc. Jpn. Acad. Ser. B 2013, 89, 447–461. [Google Scholar] [CrossRef] [Green Version]
  31. Nakayama, S. Plant factory and its prospects. IFAC Proc. Vol. 1991, 24, 85–92. [Google Scholar] [CrossRef]
  32. Dong, J.; Gruda, N.; Lam, S.K.; Li, X.; Duan, Z. Effects of elevated CO2 on nutritional quality of vegetables: A review. Front. Plant Sci. 2018, 9, 924. [Google Scholar] [CrossRef]
  33. Lemon, E.R. CO2 and Plants: The Response of Plants to Rising Levels of Atmospheric Carbon Dioxide; CRC Press: Boca Raton, FL, USA, 2019; pp. 21–61. [Google Scholar]
  34. Singh, H.; Poudel, M.R.; Dunn, B.L.; Fontanier, C.; Kakani, G. Effect of greenhouse CO2 supplementation on yield and mineral element concentrations of leafy greens grown using nutrient film technique. Agronomy 2020, 10, 323. [Google Scholar] [CrossRef] [Green Version]
  35. Tian, Y. Study and design of the control system for household plant factory. In Advances in Computer Science Research, Proceedings of the 2018 3rd International Workshop on Materials Engineering and Computer Sciences (IWMECS 2018), Jinan, China, 27–28 January 2018; Atlantis Press: Amsterdam, The Netherlands, 2018; Volume 78, pp. 397–400. [Google Scholar]
  36. Chalabi, Z.; Biro, A.; Bailey, B.; Aikman, D.; Cockshull, K. SE—Structures and environment: Optimal control strategies for carbon dioxide enrichment in greenhouse tomato crops—part 1: Using pure carbon dioxide. Biosyst. Eng. 2002, 81, 421–431. [Google Scholar] [CrossRef]
  37. Makino, A.; Mae, T. Photosynthesis and plant growth at elevated levels of CO2. Plant Cell Physiol. 1999, 40, 999–1006. [Google Scholar] [CrossRef]
  38. Madhu, M.; Hatfield, J. Dynamics of plant root growth under increased atmospheric carbon dioxide. Agron. J. 2013, 105, 657–669. [Google Scholar] [CrossRef] [Green Version]
  39. Vasconez, P.A.V.; Vasconez, M.A.V.; Cardenas, C.; Nyheim, Ø.S.; Eraso, H.R. Can higher CO2 concentrations affect yield and quality parameters in lettuce and sugar beet crops? Rev. Verde Agroecol. Desenvolv. Sustentável 2021, 16, 27–32. [Google Scholar] [CrossRef]
  40. Kapalo, P.; Domniţa, F.; Bacoţiu, C.; Spodyniuk, N. The impact of carbon dioxide concentration on the human health-case study. J. Appl. Eng. Sci. 2018, 8, 61–66. [Google Scholar] [CrossRef] [Green Version]
Figure 1. Appearance of the indoor cultivation system (tiiun L061G1, LG Electronics Inc., Seoul, Korea) used in the study. The interior consists of two tiers, each with three compartments. Each compartment combines one pod (seed kit), and one pod has 10 plants.
Sustainability 13 13288 g001
Figure 2. The locations of the cultivation systems used for the study. An office at Gyeongsang National University was selected as the space with people. The warehouse space was selected as a space without people. Three cultivation systems were placed in each space. The abbreviation for each unit was expressed in red letters representing the following: office space (OO, outside of cultivation systems in the office; OL, OM, and OH, cultivation system with a low (0.7 m·s−1), medium (1.0 m·s−1), and high (1.3 m·s−1) fan speed, respectively; WO, outside of cultivation systems in the warehouse; WL, WM, and WH, cultivation system with a low (0.7 m·s−1), medium (1.0 m·s−1), and high (1.3 m·s−1) fan speed, respectively.
Sustainability 13 13288 g002
Figure 3. Temperatures inside cultivation systems, office, and warehouse. It was a summer period during the cultivation and an air conditioner without ventilation was operated from 06:00 to 20:00 in the office. The warehouse did not have any air conditioner operating. All cultivation systems were set to run from 9:00 to 11:00 as the photoperiod and from 11:00 to 09:00 as the dark period. The temperature set point was 25 °C during the photoperiod and 18 °C during the dark period both with an error range of ±2 °C. The codes represent the abbreviation of each treatment as described in Figure 2. The vertical bars represent SEs of fourteen-day replicates (n = 14).
Sustainability 13 13288 g003
Figure 4. Relative humidity in the cultivation systems, office, and warehouse. In the office, the air conditioner was operated from 06:00 to 20:00. The set temperatures of the cultivation systems were 25 °C during the daytime from 09:00 to 23:00 when the light was turned on, and 18 °C during the nighttime when the light was turned off. In order to control the temperature, the cooling system was turned on and off, showing some of the relative humidity rising and falling accordingly. The codes represent the abbreviations of treatments as described in Figure 2. The vertical bars represent SEs of 14-day replicates (n = 14).
Sustainability 13 13288 g004
Figure 5. Changes in the 14-day average concentration of carbon dioxide for each treatment in the office (O) and warehouse (W) over 24 h. The concentrations in the office are shown in black and those in the warehouse are shown in blue. The average atmospheric CO2 concentration in Korea is indicated by a red auxiliary line. The codes represent the abbreviations of each treatment as described in Figure 2. The vertical bars represent SEs of 14-day replicates (n = 14).
Sustainability 13 13288 g005
Figure 6. Relative yield (%) for each condition when converted based on the WM yield. The vertical bars represent SEs of thirty biological replicates (n = 30). Significant differences among treatments are indicated by lower case letters at p ≤ 0.05 according to Duncan’s multiple range test.
Sustainability 13 13288 g006
Figure 7. Growth of Ssamchoo compared characterized by the cultivation condition. Ssamchoo presented on the left were grown in the office, and those presented on the right were grown in the warehouse. The fan airspeed decreases in order from top to bottom. The photo below compares the development of roots immediately after harvest. Likewise, the fan airspeed increases in order from top to bottom.
Sustainability 13 13288 g007
Figure 8. Growth of Romaine characterized by the cultivation condition. Romaine presented on the left were grown in the office, and those presented on the right were grown in the warehouse. The fan airspeed decreases in order from top to bottom. The photo below compares the development of roots immediately after harvest. Likewise, the fan airspeed increases in order from top to bottom.
Sustainability 13 13288 g008
Figure 9. Root activity of Ssamchoo and Romaine. The codes represent the abbreviation of each treatment as described in Figure 2. The vertical bars represent SEs of three biological replicates (n = 3). Significant differences among treatments are indicated by lowercase letters at p ≤ 0.05 according to Duncan’s multiple range test.
Sustainability 13 13288 g009
Figure 10. Contents of chlorophyll a and b in Ssamchoo and Romaine. The codes represent the abbreviation of each treatment as described in Figure 2. The vertical bars represent SEs of six biological replicates (n = 6). Significant differences among treatments are indicated by lowercase letters at p ≤ 0.05 according to Duncan’s multiple range test.
Sustainability 13 13288 g010
Table 1. Comparison of the fresh weight, shoot length, leaf length, leaf width, and number of leaves as affected by species, cultivation space, and fan speed.
Species
(A)
Cultivation Space
(B)
Fan Airspeed
(m·s−1)
(C)
Fresh Weight
(g)
Shoot Length
(cm)
Leaf
Length
(cm)
Width (cm)Number
SsamchooOffice1.316.0 a y14.3 abcd13.9 abcd8.5 a8.1 bc
1.012.6 b14.7 ab14.4 abc7.9 ab7.3 de
0.712.2 bc15.1 a14.7 a7.9 ab7.1 ef
Warehouse1.310.2 bcd14.2 abcd13.8 abcd7.7 b6.6 ef
1.010.2 bcd13.7 cde13.4 cde7.4 bc6.9 ef
0.78.8 de13.9 bcde13.5 bcd7.2 bc6.5 f
RomaineOffice1.311.6 bc14.9 a14.6 a6.8 cd8.3 abc
1.011.0 bcd14.7 abc14.3 abc6.1 e8.9 a
0.710.1 bcd14.8 ab14.5 ab6.4 de8.9 a
Warehouse1.36.0 fg12.9 e12.5 e5.9 e8.1 bc
1.07.6 ef13.5 de13.1 de5.9 e8.6 ab
0.75.1 g11.6 f11.2 f5.1 f7.8 cd
z F-testA***********
B***************
C*NSNS*NS
A × BNS****NSNS
A × CNS**NS*
B × C***NSNS
A × B × CNSNSNSNS*
z NS, *, **, and ***, represent no significant or significant difference at p = 0.05, 0.01, or 0.001, respectively. y Mean (n = 30) values separated within columns followed by different letters are significantly different according to Duncan’s multiple range test at p ≤ 0.05.
Table 2. Contents of soluble protein, soluble sugar, starch, and proline as affected by the species, cultivation space, and fan airspeed.
Species
(A)
Cultivation Space
(B)
Fan Speed
(m·s−1)
(C)
Content (mg·g−1 FW)
Soluble ProteinSoluble SugarStarchProline
SsamchooOffice1.334.12.8 a y1.5 b0.17 c
1.032.71.9 de1.2 ef0.11 c
0.733.72.3 bcd1.4 bc0.20 c
Warehouse1.336.22.4 abc1.2 def0.20 c
1.034.72.7 ab1.5 b0.15 c
0.737.22.0 cde2.1 a0.20 c
RomaineOffice1.332.51.8 ef1.2 cdef0.49 b
1.037.31.6 ef1.0 f0.83 a
0.735.02.6 ab1.3 bcde0.20 c
Warehouse1.337.61.3 f1.4 bcd0.88 a
1.034.12.0 cde1.5 b0.20 c
0.735.21.6 ef2.1 a0.51 b
z F-testANS***NS***
BNSNS***NS
CNSNS****
A × BNS**NS
A × CNS*NS*
B × CNS********
A × B × CNSNSNS***
z NS, *, **, and ***, represent no significant or significant difference at p = 0.05, 0.01, or 0.001, respectively. y Mean (n = 3) values separated within columns followed by different letters are significantly different according to Duncan’s multiple range test at p ≤ 0.05.
Table 3. Comparison of the antioxidant enzyme activities as affected by the species, cultivation space, and fan airspeed.
Species
(A)
Cultivation Space
(B)
Fan Speed
(m·s−1)
(C)
Activity (U·mg−1 Protein)
GPXCATSODAPX
SsamchooOffice1.317.7 b y44.2 a0.665 abc23.7 c
1.09.2 d18.4 de0.801 a25.9 c
0.725.2 a26.8 b0.727 ab26.7 c
Warehouse1.312.4 c41.5 a0.541 bc33.2 b
1.08.7 d26.0 b0.819 a40.6 a
0.724.3 a16.2 de0.644 abc22.8 cd
RomaineOffice1.39.4 d23.4 bc0.462 c18.8 de
1.08.1 d12.1 f0.504 bc24.2 c
0.78.6 d15.7 e0.510 bc17.2 e
Warehouse1.38.0 d19.9 cd0.693 abc31.9 b
1.08.9 d17.9 de0.615 abc8.9 f
0.78.6 d8.6 f0.200 d17.2 e
z F-testA************
B*NSNS**
C**********
A × B*NSNS**
A × C**********
B × C********
A × B × CNSNSNS***
z NS, *, **, and ***, represent no significant or significant difference at p = 0.05, 0.01, or 0.001, respectively. y Mean (n = 3) values separated within columns followed by different letters are significantly different according to the Duncan’s multiple range test at p ≤ 0.05.
Publisher’s Note: MDPI stays neutral with regard to jurisdictional claims in published maps and institutional affiliations.

