Abstract
Among the existing Cultural Heritage settings, Underground Built Heritage (UBH) represents a peculiar case. The scarce or lack of knowledge and documentation of these spaces frequently limits their proper management, exploitation, and valorization. When mapping these environments for documentation purposes, the primary need is to achieve a complete, reliable, and adequate representation of the built spaces and their geometry. Terrestrial laser scanners were widely employed for this task, although the procedure is generally time-consuming and often lacks color information. Mobile Mapping Systems (MMSs) are nowadays fascinating and promising technologies for mapping underground structures, speeding up acquisition times. In this paper, mapping experiences (with two commercial tools and an in-house prototype) in UBH settings are presented, testing the different handheld mobile solutions to guarantee an accurate and reliable 3D digitization. Tests were performed in the selected case study of Camerano Caves (Italy), characterized by volumetric complexity, poor lighting conditions, and difficult accessibility. The aim of this research activity is not only to show the differences in the technological instruments used for 3D surveying, but rather to argue over the pros and cons of the systems, providing the community with best practices and rules for 3D data collection with handheld mobile systems. The experiments deliver promising results when compared with TLS data.
1. Introduction
For almost two decades, reality-based 3D digitization and modelling have been applied in many fields, from industries to entertainment and medicine. The 3D digitization of Cultural Heritage (CH) is also considered a common practice for documentation, conservation, preservation, valorization, and visualization purposes [1,2,3]. Moreover, 3D data are an efficient medium for tourist attractions [4,5], for digital archiving and dissemination of artefacts and monuments to future generations [6,7,8], or for allowing VR/AR (Virtual Reality/Augmented Reality) access with mobile devices [9,10,11,12,13,14].
Currently, there is a significant variety of 3D acquisition methodologies, but various 3D digitization activities are being performed with results inferior to those initially expected, or often without a clear quality check. This is because no 3D data collection technique can be correctly used without understanding its accuracy potential, limitations, and behavior under certain conditions. A correct approach to decide which technique is better suited for a particular situation should be followed, whereas a correct methodology to predict and compute the quality of the final 3D results must also be applied.
Built and natural Cultural Heritage is commonly digitized using image-based and range-based techniques, where they are often integrated in order to exploit the intrinsic advantages of each one and overcome possible problems [15,16,17,18]. If image and range data are employed for the 3D digitization of heritage sites or objects, the term reality-based 3D surveying and modelling is used to distinguish from computer graphics approaches where field measurements are typically not performed [19].
Among the existing CH settings, the Underground Built Heritage (UBH) represents a peculiar case. The scarce or lack of knowledge and documentation of these spaces frequently limits their full exploitation and valorization. The complete mapping of this hidden heritage is the first step for bridging these knowledge gaps, providing the decision-makers with a reliable “picture” of the underground settings. Along with the geological investigations, the clear and complete representation of these spaces is crucial for investing in their conservation or planning a new urban function able to meet the space demand of the modern cities [20,21,22].
Nevertheless, mapping the UBH is frequently an arduous task, conditioned by complex environmental and constructive factors which typify these scenarios, like poor illumination, narrow passages, and articulated paths. Moreover, the recurring relevant dimensions of these underground structures entail acquiring a considerable amount of 3D information that is difficult to manage and share among the experts involved in the decision-making process [23].
When mapping these environments for documentation purposes, the primary need is to achieve a complete, correct, and adequate representation of the built spaces and their geometry. For a long time, terrestrial laser scanners (TLS) have been widely employed for this task (Section 2.1), although the procedure is generally time-consuming. In this case, the registration of multiple scans requires numerous stations, even only to avoid partially occluded areas, thus producing a huge amount of unmanageable data.
Besides, further colorimetric information is often required for more in-depth analyses of the masonries and the more faithful restitution of the structures. Image-based techniques can support this task, although they would demand a notable effort in large and poorly illuminated environments.
When selecting the suitable technology for UBH documentation projects, additional needs have to be considered. Firstly, in large and complex underground contexts, the chosen solution should speed up the acquisition phase and assure the rapid mapping of the environments. Moreover, the selected technology should result as:
- agile: cumbersome instruments should be avoided in underground contexts with frequent setbacks and scarce accessibility;
- cost-effective: the best results should be achieved with reasonable costs;
- easy to use: these technologies are also often managed by non-expert staff;
- affordable: CH generally suffers a generalized lack of resources hence, low-cost solutions are preferable.
For these reasons, handheld Mobile Mapping Systems (MMSs) are nowadays fascinating and promising technologies for mapping underground structures, speeding up the acquisition times and returning colorimetric information in many cases.
The particular configuration of these extended underground caves, characterized by poor and variable illumination, scarce accessibility, and the complex succession of corridors, narrow passages, and wider rooms makes this site particularly suitable for testing their performance in such challenging scenarios. All the considered systems are based on Simultaneous Localization and Mapping (SLAM) technologies (Section 2.2), adopting different strategies (LiDAR and Visual) for tracking the device and mapping the scene.
The data collected were compared with a reference survey performed with Terrestrial Laser Scanner (TLS), used as the ground truth in the proposed evaluations. The possibility to compare different “state of the art” portable mobile mapping systems sheds light on the opportunity offered by fast mapping systems, and opens the debate over new ways to simplify the UBH documentation and conservation process.
In this paper, we present three mapping experiences in UBH settings (the Camerano Caves, Italy—Section 3.1), testing three different handheld mobile solutions (Section 3.2) in order to guarantee an accurate and detailed 3D documentation of the UBH site. The innovative aspects presented in the article include:
- experiments performed in a real large scenario using a specific experimental protocol, considering both commercial off-the-shelf and prototype solutions as well as visual and LiDAR methods;
- an accuracy evaluation performed with the aid of reference ground truth data (based on TLS acquisitions), which allowed discussion of the costs/benefits to be argued in a more reliable way, besides providing quantitative results;
- results suitable for defining best practices for exploiting mobile systems in UBH settings, defined considering the different factors making such scenarios challenging.
This paper stems from the activities of the Underground4Value (U4V) COST Action (CA18110) [24], which aims at providing adequate cultural, scientific, and technical knowledge of the Underground Built Heritage (UBH) concerning different aspects (i.e., archaeology, geotechnics, history, urban planning, architecture, cultural anthropology, economics, tourism, sustainable development), in a multi-disciplinary context.
With respect to the special issue in the Sustainability journal “Going Underground. Making Heritage Sustainable”, the article addresses the accurate 3D documentation of a protected underground heritage site, presenting innovative handheld mobile mapping tools, lessons learned, and research directions for the preservation and valorization of UBH.
2. Related Works
2.1. 3D Digitization of Underground Built Heritage
Underground environments are primarily the result of natural processes and/or human actions. Over time, these structures have been often exploited with several functions [25,26,27]. Among the built and natural cavities, some are considered and recognized as cultural heritage to preserve and valorize, for their particular historical value or the structure architectural quality. The documentation of these environments is not a recent activity, although traditional procedures and instruments are nowadays overcome. The more efficient reality-based 3D surveying technologies have replaced the old clinometers and compasses used for distance and angular measurements, as well as more recent tacheometric methods [28].
Among these 3D mapping instruments, the use of terrestrial laser scanners (TLS) has been broadly explored, especially for the high geometric resolution also achievable in underground environments [29,30,31,32].
Photogrammetric approaches are also presented in the literature, although their use is often limited compared to TLS data [33,34]. Further works have shown the potential of photogrammetry to document and deeply inspect cavities [35], but the applications are often focused on small underground areas. Despite both technique capability to achieve highly detailed 3D reconstructions, they require considerable effort when the mapping interests extended subterranean surfaces. In these cases, a relevant number of scan stations or images are needed for preventing occlusions and missing 3D data. This can also easily result in a vast and unmanageable quantity of information to be processed. Moreover, image-based techniques are frequently penalized by poor or nonuniform lighting conditions, whereas TLS is scarcely usable in narrow spaces or areas with limited accessibility.
For these reasons, the research community has recently focused on testing more agile and faster solutions for accurately and entirely documenting these structures with less effort [36]. In the last years, some portable Mobile Mapping Systems (MMS) [35] have been tested in underground environments [2,37,38,39,40,41,42], with promising results in speeding up documentation in these particular contexts.
2.2. SLAM and Mobile Technologies
In its most generic definition, a Mobile Mapping System (MMS) is a mobile survey platform used to acquire data, optionally geo-referenced, for 3D reconstruction purposes. The development of these systems began in the late 1980s and, although the first examples were mainly vehicle-mounted [43], many human-carriable devices have been proposed so far [35]. Compared to static/tripod-mounted survey methods, MSSs can drastically reduce the working times generally reaching, when used within the supported range and operational speeds [44], a complete object coverage with an accuracy of a few centimeters. The classical equipment of a MMS consists of three main hardware components: mapping sensors, navigation/positioning sensors, and a time-referencing unit [45]. Mapping sensors collect environmental information, typically in the form of LiDAR point clouds and/or RGB/-D images. Navigation/positioning sensors provide positional information of the device exploiting the Global Navigation Satellite System (GNSS) receivers and/or Inertial Measurements Unit (IMU) sensors. The time-referencing unit synchronizes the data coming from all the sensors and eventually performs onboard computations and/or optimizations.
In GNSS-denied environments, like underground, satellite positioning is not available, and the tracking of the platform trajectory is often performed with Simultaneous Localization and Mapping (SLAM) algorithms [46,47,48]. The goal of these algorithms is to estimate, solely from onboard sensor data and in real-time, a map of the surrounding environment, while, at the same time, locating the mobile platform within it. Depending on the available sensors, SLAM algorithms commonly work on laser scanners (LiDAR SLAM, e.g., [49]) and/or RGB/-D (Visual SLAM, e.g., [50,51]) images, also taking advance of IMU measurements when available. Conceptually, a SLAM algorithm can be decomposed into a frontend and a backend [48]. The former abstracts sensor data into models that are used to (i) perform short- and long-term (loop closures) data association between consecutive sensor measurements, and (ii) provide an approximate guess of the device and landmark positions. The latter tries to reduce the accumulated errors of the frontend via least-square optimizations on the trajectory graph. The performance of SLAM algorithms is strongly linked to the scene (presence of texture and light for Visual SLAM and stable and distinctive geometric features for LiDAR SLAM) and the followed trajectory (distance to the object, type of movements, moving speed).
3. Materials and Methods
3.1. Case Study
One of the living-labs stemmed from the activities of the U4V COST Action is in central Italy, where there are many other hypogea with different functions: water reservoir, military-strategic, food storage, cultural or religious function, and mines or quarries. Among them, the city of Camerano (Marche region, Italy) represents a local heritage and a landmark for its network of connected built underground spaces.
The complex environment of the Camerano Caves is a set of halls and tunnels located below the city center and extends for a total length of 3 km (Figure 1, Figure 2). This “underground city” has a totally anthropogenic origin, extending under almost all the historical buildings of the city centre. The full extension of the hypogeum is still a subject of interest and research today [52,53,54]: there are also other tunnels and caves far from the main body with similar characteristics. The first reliable records date back to 1327. It seems that their origins are even related to the pre-historical era, but the presence of new decorative patterns suggests that caves and tunnels were used since the XIX century by gentry families for reunions and rituals. In 1944, the hypogeum was used as a shelter from bombardments of World War II by about 2000 people [55,56]. The local community’s self-initiative and the determination and far-sightedness of the local authority allowed to differentiate the local tourism offer, leading to success in terms of tourism attractiveness, with more than 25,000 visitors per year.
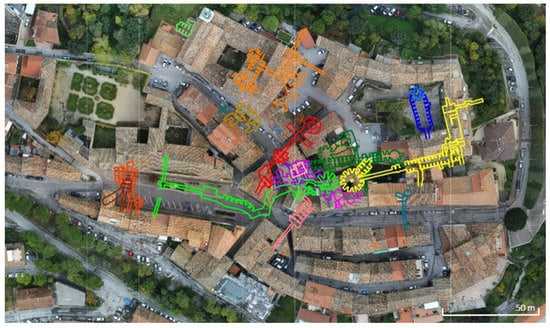
Figure 1.
Overview of the city center of Camerano (Italy) with overlaid the map of the underground caves (ca 3 km long).

Figure 2.
Vertical section of the city center of Camerano (Italy) with the underground caves.
Based on physical and structural aspects of this underground environment, which are important to highlight for the survey, the floor plan is labyrinthine, and the spaces are distributed on different levels in depth. Over time, most of the various underground spaces have been joined together, creating connecting corridors and staircases that define a continuous path. The rooms also vary in size and volume, with an alternation of rectilinear and non-rectilinear passages of varying widths, sometimes with niches opening at the sides, and leading into larger polygonal or circular spaces. The variability of these spaces can also be seen in the underground pedestrian route, which presents numerous changes of direction. The intrados of these underground rooms also vary, such as barrel-vaulted passageways and niches and domed halls. The interior surfaces of these caves are made of friable material, such as sandstone, so they are rough and not smooth. The underground complex of the caves is artificially illuminated by small lamps installed along the footpath. The light intensity is subdued, thus presenting some shadowy spaces.
3.2. Tested Mobile Mapping Systems
In 2019, at the request of the municipality of Camerano, a survey of the caves was carried out with the Terrestrial Laser Scanner (TLS) Z + F Imager 5010 for restoration purposes and monitoring of some phenomena of damage and degradation. The survey consisted of 317 scans co-registered using markers of known coordinates in a local geodetic network. The number of points composing the whole dataset is almost 11 mln. An optimized 3D mesh model at 2 cm spatial resolution was exploited as ground truth to validate the quality of the point clouds generated by the tested MMSs, described in the following:
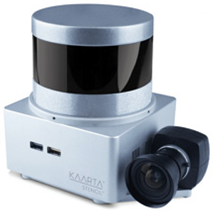
- KAARTA Stencil 2–16 [57] is a commercial mobile scanner. It mounts a LiDAR (Velodyne VLP-16), a low-resolution color camera, a low-cost MEMS (Micro Electro Mechanical Systems) IMU, and a computer for real-time processing. VLP-16 has a 360° field of view with a 30° azimuthal opening with a band of 16 scan lines. The data acquisition is based on setting the configuration parameters that vary for the type of environment detected, mainly between outdoor and indoor. These parameters include the voxelSize, namely the resolution of the point cloud in the map file, cornerVoxelSize, surfVoxelSize, sorroundVoxelSize, which indicate the resolution of the point cloud for scan matching and display, and blindRadius, that is the minimum distance of the points to be used for the mapping. This laser device is versatile and can be mounted on any mobile platform. For underground environments, it can be supported by a hand-held pole. The progress of the scanning can be monitored in real-time via an external monitor attached with a USB cable.
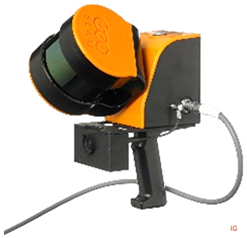
- GeoSLAM Zeb Horizon [58] is a commercial and hand-held mobile scanner, mounting the same LiDAR and IMU systems of KAARTA Stencil 2–16. As an accessory, the ZEB Cam is a color camera for GeoSLAM’s ZEB Horizon, embedding a Hawkeye Firefly 8SE action video camera. The image data collected by the camera can be viewed alongside the 3D point cloud created by the ZEB Horizon and used to extract contextual information. The process of collecting data using the Zeb Horizon scanning system is highly automated. The raw laser data is co-registered into a consistent 3D point cloud by the internal SLAM algorithm, assuming a collaborative scene with distinctive geometric features. While KAARTA Stencil 2–16 is able to process data in real-time, the data acquired by GeoSLAM Zeb Horizon are processed using the GeoSLAM Hub processing software. Therefore, an additional accessory of GeoSLAM devices in a data logger to save the acquired data.
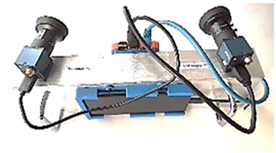
- GuPho [59] is a research prototype developed by the 3DOM unit of FBK. Unlike the other two portable MMSs, GuPho is a pure vision device. The 3D reconstruction is therefore obtained from the acquired images with photogrammetry and dense image matching. The system is composed of two synchronized stereo cameras, an embedded pc (Raspberry Pi 4), a smartphone, a battery pack and an illuminator. GuPho integrates a custom Visual SLAM algorithm based on OPEN-V-SLAM [60] to keep track of the acquisition trajectory, filter out redundant images, display the sparse 3D reconstruction of the area in real-time, and provide real-time feedback and warnings on the image acquisition, such as motion-blur and achieved Ground Sample Distance (GSD). The final dense 3D reconstruction is obtained after the survey, in post-processing, leveraging the image orientations estimated in real-time by the Visual SLAM algorithm to speed up the process. Given the narrow and complex structure of the Camerano caves, the system was configured with fisheye lenses (focal length of 1.85 mm and field of view of almost 180°) to maximize the view coverage of the images.
3.3. Data Acquisition and Processing
The considered test area of the caves is shown in Figure 3. It is composed of several rooms characterized by different geometries, shapes, and illumination, and connected by both long “tunnel-like” sections and narrow passages. The whole area was acquired within a single SLAM session, except for GuPho where the “Camerone” part (yellow trajectory in Figure 3c) was surveyed, due to a temporary access interdiction, with an additional session. The acquisition trajectories of the three systems are shown in Figure 3, while high-level metrics of the acquisition are collected in Table 1. The MMSs were configured with the default parameters (only the KAARTA Stencil foresees the indoor preset).
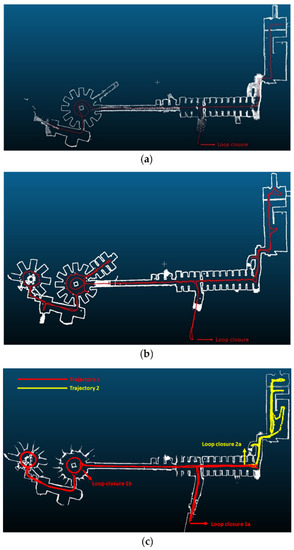
Figure 3.
The acquisition trajectories of the three MMSs tested in the Camerano caves: (a) KAARTA Stencil 2–16; (b) GeoSLAM Zeb Horizon; (c) GuPho.

Table 1.
Acquisition parameters and specifications of the used MMSs with the relative processing time and hardware.
At the end of the acquisition, the estimated trajectories and point clouds were optimized offline with the software provided by the vendors of the MMSs. For the post-processing and registration of point clouds obtained by KAARTA, already processed in real-time during the acquisition phase, the software Cloud Compare was used. The output files downloaded from the GeoSLAM data logger were processed using the GeoSLAM Hub software. For GuPho, the acquired images and their corresponding 6DOF orientation were optimized in Agisoft Metashape before performing dense image-matching with the same software. The total amount of processing time required for each device is shown in Table 1.
4. Results
The results of the mapping activity in the Camerano caves are hereafter presented. The dense point clouds obtained with the three mobile systems (Section 3.2) were used for evaluating their mapping capability in different underground spaces, using the TLS data (point cloud and generated mesh) as ground truth. As presented in Section 4.1, a different acquisition protocol was followed during the surveying campaign, according to the characteristics of each technology and the area to map. Acquired datasets were primarily co-registered with the ground-truth TLS point cloud, using the Iterative Closest Point (ICP) algorithm for finding the transformation between the reference and source point clouds. Therefore, for each of the sub-blocks, the Cloud-to-Cloud (C2C) and the Cloud-to-Mesh (C2M) distances were computed to evaluate each solution’s behaviour in different underground environments. For the evaluation, some metrics and/or visual analyses are proposed, considering sub-blocks with similar environmental features of the “Corraducci” cave (Figure 4), and in particular:
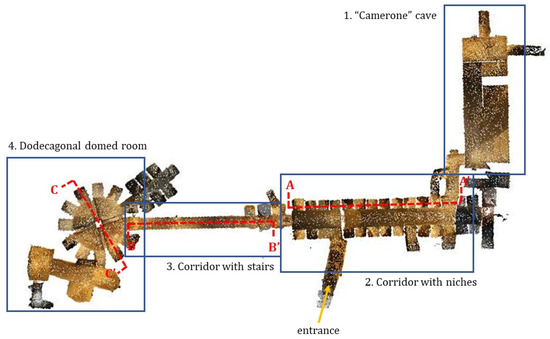
Figure 4.
Selected sub-blocks used for C2C comparison between the point clouds obtained from different SLAM technologies and TLS survey.
1. The “Camerone” cave: one quite large and some smaller rooms connected through narrow passages (Figure 5, Table 2);

Figure 5.
Sub-block 1: the “Camerone” cave (a). An exploded view of the dense point cloud obtained, in this case, with the GuPho device (b).

Table 2.
Cloud-to-Cloud (C2C) and Cloud-to-Mesh (C2M) [m] results for the sub-block 1.
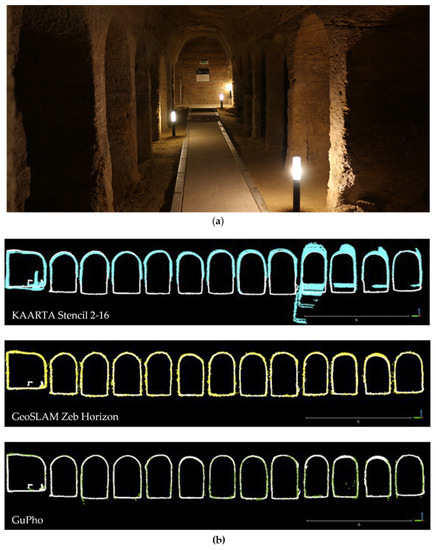
Figure 6.
Sub-block 2, the corridor with niches of the “Corraducci” cave (a): a visual comparison along section A-A’ of the dense point clouds obtained with the MMSs and the reference TLS point cloud (b).

Table 3.
Cloud-to-Cloud (C2C) and Cloud-to-Mesh (C2M) [m] results for the sub-block 2.
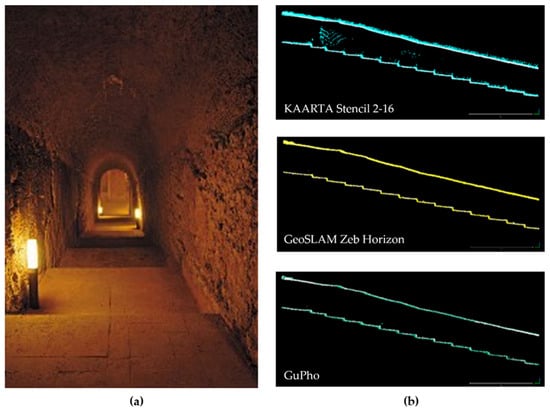
Figure 7.
Sub-block 3, straight corridor with stairs of the “Corraducci” cave (a): visual comparison along section B-B’ of the dense point clouds obtained with the MMSs and the reference TLS point cloud (b).

Table 4.
Cloud-to-Cloud (C2C) and Cloud-to-Mesh (C2M) [m] results for the sub-block 3.
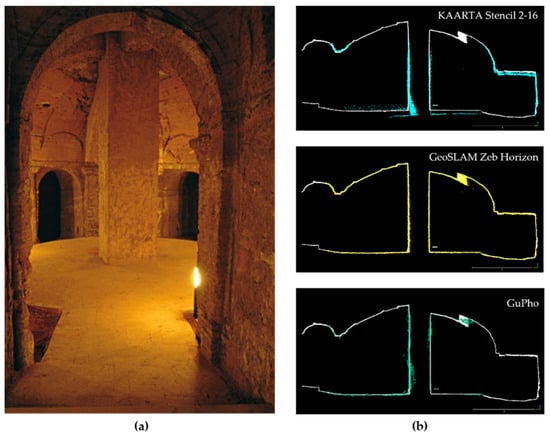
Figure 8.
Sub-block 4, the dodecagonal domed room with niches (a): visual comparison along section C-C’ of the dense point clouds obtained with the MMSs and the reference TLS point cloud (b).
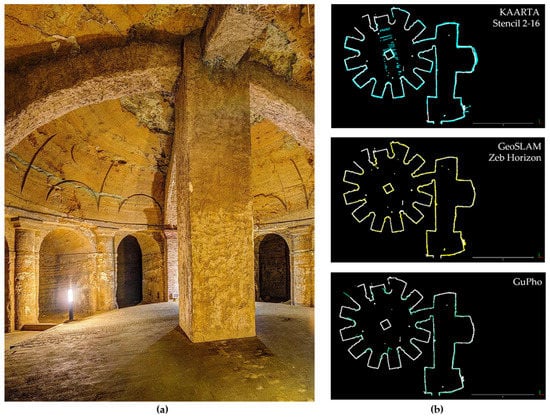
Figure 9.
Sub-block 4, the dodecagonal domed room with niches (a): visual comparison of a plan section of the dense point clouds obtained with the MMSs and the reference TLS point cloud (b).
The comparison of sub-block 4 is done with visual analyses, because of the variable completeness of the acquired data due to the chosen acquisition protocol focused on containing the mapping time, rather than completely surveying this articulated area.
Metrics and visual analyses show that all the MMSs were able to rapidly acquire the main geometry of the caves with errors ranging between 1 and 3 cm, although some technologies proved to be more effective and less sensitive to the peculiar environmental characteristic of this scenario. More specifically, the dark and uneven environmental illumination did not allow the photogrammetric GuPho system to match the acquisition speed of the other two systems (Table 1), or to reconstruct all the niches more completely. This is more evident in the large dodecagonal room where, despite having followed similar trajectories of the other two MMSs (Figure 8 and Figure 9), the illuminator was not strong enough to adequately light the niches. Nevertheless, the integrated motion-blur control and automatic image selection worked properly and the 3D results obtained with GuPho are in line with the other two commercial systems.
5. Discussion
Quantitative and qualitative comparative analyses were performed unveiling new arguments of discussion for UBH surveying strategies that are worth highlighting. The experiments, in fact, provide a great number of suggestions for users interested in undertaking strategies for the management and conservation of these fascinating settings. Indeed, considering 3D survey as the starting point for each intervention and/or decision-making process, the comparative study here presented paves the way for defining best practices in future acquisition campaigns. To do so, the comparison performed is multifaceted, as it considers off-the-shelf systems vs. a research prototype, range-based vs. image-based systems, and mobile vs. static systems.
The first point of discussion is about the acquisition and processing time. For all three MMSs, it can be stated that the acquisition time was strongly reduced when compared with that of TLS. The difference moves from some days to a few minutes of walking. The range-based systems (namely, KAARTA Stencil 2–16 and GeoSLAM Zeb Horizon) outperformed the image-based, which requires the user to move slowly to achieve a complete mapping. This is due to the illumination conditions and the complexity of the environments, which hamper the user to speed up the walking phase (in total, the acquisition time is four times higher with visual SLAM, see Table 1). Even the post-processing phase is faster for the commercial solutions: ad hoc software allows to get in output a ready-to-use product, while the Visual SLAM requires a photogrammetric suite to achieve the final dense cloud (Table 1). Conversely, the color information is completely missing for the Stencil 2, while it is possible to achieve a colored point cloud with the Zeb Horizon (by exploiting the video stream), and, obviously, with the photogrammetric GuPho system. It must be said that the achieved acquisition time obtained with the KAARTA and GeoSLAM Zeb Horizon devices were the result of an acquisition strategy that relies upon the LiDAR data and was therefore not optimized for the image acquisition. Therefore, the gap between the time required for the acquisition using LiDAR and visual-based SLAM technology would reduce significantly in the case where a properly coloured point cloud would be necessary. In such a case, the problems faced by GuPho would be common to all the devices used (for example, with respect to image blur or unevenly lit surfaces). This first analysis is in line with the literature [41]. Many papers state that MMSs are suitable for their efficiency in indoor spaces and articulated architectural, landscape, and archaeological settings where GNSS positioning is not available. Besides, with respect to the TLS compartment, both range- and image-based solutions are more rapid in both acquisition and processing (this consideration is mainly addressed to the automatic pre-process of clouds, as seen when the marked time trajectory must be carefully manually controlled). Broadly speaking, UBH are considered “unfriendly environments” for surveyors hence, handheld portable MMSs are recommended due to their compactness and handiness.
This first recommendation, however, has to be evaluated depending on the output product needed for representing the scene. If the committed by-product is a 2D representation, considering the comparisons in sub-blocks 1–2-3 (Figure 4), the Stencil provides a standard deviation suitable for a 1:200 representation, while the Zeb Horizon and GuPho allow to increase the scale up to 1:100. The more the trajectory increases in length, the less the architectural details can be validated. For the full availability and handling of architectural details, a scale of 1:50 or above is required, and more accurate clouds derived from the TLS technique continue to be needed [38]. Conversely, if the results are conceived for an overall 3D representation of the scene, the geometric information derived with a TLS acquisition might be redundant. For both (H)BIM and virtual representations, the accuracy of the MMSs is compliant with the final purpose, as confirmed in the literature [61]. Of course, this aspect is normally case-specific, and there is not a generalizable approach for the different existing UBH [20].
This latter comment, open to the great issue related to the inner factors of an UBH: they can be natural or built, leading to several variables that are here discussed. The models obtained with image-based MMSs have a higher resolution and point density than those acquired with GeoSLAM [62]. However, this statement can be partially contested if one considers the illumination. As shown in the comparison made for the sub-block 4 (Figure 8 and Figure 9), niches with very low artificial illumination show missing data that have instead been collected by the range-based solution. However, the performances of the latter (and specifically for the Stencil) were badly affected by the scarce illumination, in terms of trajectory. As depicted in Figure 3, the Stencil loses the orientation, and the sole LiDAR sensor is not sufficient to maintain the path for long walks. For this reason, it would be meaningless to perform the comparison for the whole point clouds, and the dataset was split into key representative areas [63].
A few last comments are deserved for the data quality (considering both spatial and radiometric resolutions). The LiDAR devices deliver noisier data, however, the noise observed in measurements performed with the Zeb Horizon is lower than the noise observed in the Stencil cloud. This aspect is known and confirmed in similar papers (where generally more than 90% of the deviations between the clouds are less than 5 cm) [64]. In the case of Camerano settings, our findings demonstrate that image-based solution delivers a dataset with less noise, comparable with the TLS [65]. The lack of high-quality radiometric data is still an unsolved issue for LiDAR-based solutions. Indeed, images can be projected on the surface points in post-processing and this can facilitate the point matching for scan registration, segmentation and other analyses of the clouds. The GuPho prototype delivers a superior quality of radiometric information. LiDAR MMSs require a post-processing phase for colouring the cloud, but still with scarce results [66,67].
6. Conclusions
In this paper, a comparative study between commercial handheld mobile off-the-shelf and in-house solutions was performed. The objective was to provide the research community with updated information about the possibility offered by new 3D mobile technologies, instruments, and algorithms for the realization of 3D surveys. The chosen environment was the UBH of Camerano (Italy) within the framework of the U4V COST action. Our experiments were not devoted to finding the winning solution, but rather to define best practices for different users, interested in undertaking 3D documentation, conservation and valorization strategies for underground settings. Besides the documentation and digitization purposes, especially for the preservation of the UBH, the 3D mapping was used to test and validate some well-known and promising technologies in such particular scenarios.
The experimental protocol was set considering a TLS survey as the ground truth, and peculiar areas of the whole caves have been analyzed in detail. Results have shown shelf that LiDAR-based solutions are most suitable for non-expert users, as they provide reliable, fast, and ready-to-use data, which require little expertise in data processing. Image-based solutions, instead, return very detailed and complete reconstructions, at the expense of slower and more complex acquisition and processing tasks. The commercial solutions, of course, are more expensive, and this could result in a bottleneck for the Cultural Heritage, which notoriously suffers from a lack of investments. The GuPho prototype here presented, given the low cost of its hardware, is a straightforward solution, despite the fact that the owners of these environments should rely on some training of its staff for a full exploitation of the tool.
More in general, the 3D mapping of Cultural Heritage is essential for undertaking decisions for the management of UBH. A clear analysis of the needs should be done a priori, in order to decide the best surveying approach on the basis of the results shown.
The presented activities allowed, in fact, to highlight limitations and open research issues in the 3D digitization of UBH: image-based approaches suffer from illumination conditions and lack of texture, suggesting more robust key-point detectors and descriptors; trajectory drifting could be reduced using more powerful and reliable SLAM methods that fuse other sensor information, such as from inertial and magnetic sensors; and automated methods are needed to transform the collected 3D point-clouds in more usable 3D information models.
Another important aspect not directly related to Geomatic is the existing knowledge gaps that communities should acquire, by gaining specific competencies and skills that are, nowadays, externalized. Local communities too often lack scientific and technical knowledge, technological capabilities, and financial resources for the satisfactory conservation and re-use of UBH sites. In particular, they demand for surveys to understand complex damage and decay mechanisms, long-term environmental processes, and medium- to short-term natural, human, and ecological risks. Without surveys and monitoring tools that are missing or considered too costly, many underground sites that once lost their original function frequently remain as hidden and forgotten landscapes, lying abandoned and in a bad state of conservation. Therefore, filling knowledge gaps and building capacity at a local level represents a major challenge for UBH, and the work here proposed raises new points for discussion that need to be considered by the administrations.
Data collected in this case study will be shared within the project dissemination plan to promote the Camerano caves’ knowledge and fruition. This will be done with an ad hoc platform where, besides visualizing the obtained point clouds in 3D, the user will compare by himself the results of the presented comparison. Future efforts will be put into the exploitation of information modeling of the acquired data. The digital reality-based 3D model can be converted into a crucial reference frame for the understanding, monitoring, and management of documentation, thus creating a data source (graphics and semantics) that is suitable for assisting in conservation, preservation, and restoration projects, implementing Historic Building Information Modeling (HBIM) products. Even today, in the practice of the restoration and preservation of Built Cultural Heritage (BCH), the (H)BIM tool is still not widespread and often used as advanced CAD, neglecting its essence: information and its sharing. Finally, additional spherical photos acquired along the underground path will integrate the remote visit to these structures, allowing the user to experience a virtual tour in the hidden Camerano treasure.
Author Contributions
Conceptualization, F.D.S. and R.P.; Data curation, F.D.S., E.M.F., F.M. and F.R.; Formal analysis, R.P. and F.R.; Methodology, F.D.S., A.T., E.M.F., R.P. and F.M.; Supervision, F.R.; Validation, A.T., E.M.F., F.M. and F.R.; Writing–original draft, F.D.S., A.T., E.M.F., R.P., F.M. and F.R. All authors have read and agreed to the published version of the manuscript.
Funding
This research received no external funding.
Institutional Review Board Statement
Not applicable.
Informed Consent Statement
Not applicable.
Data Availability Statement
No online data available.
Acknowledgments
The activities described in this paper have been carried out under the framework of Underground4Value (U4V) COST Action (CA18110). The authors would like to express their gratitude to the administration of Camerano (in the figure of Ilaria Fioretti) for providing the dataset, curated by Studio Associato PROECO, and to OPERA Società Cooperativa Sociale (in the figure of Luca Luzi) for allowing the surveying activities.
Conflicts of Interest
The authors declare no conflict of interest.
References
- Beraldin, J.A.; Picard, M.; Bandiera, A.; Valzano, V.; Negro, F. Best practices for the 3D documentation of the Grotta dei Cervi of Porto Badisco, Italy. Proc. SPIE 2011, 7864, 78640J. [Google Scholar] [CrossRef]
- Farella, E.; Menna, F.; Nocerino, E.; Morabito, D.; Remondino, F.; Campi, M. Knowledge and Valorization of Historical Sites through 3D Documentation and Modeling. ISPRS Int. Arch. Photogramm. Remote Sens. Spat. Inf. Sci. 2016, XLI-B5, 255–262. [Google Scholar] [CrossRef]
- Xiao, W.; Mills, J.; Guidi, G.; Rodríguez-Gonzálvez, P.; Gonizzi Barsanti, S.; González-Aguilera, D. Geoinformatics for the conservation and promotion of cultural heritage in support of the UN Sustainable Development Goals. ISPRS J. Photogramm. Remote Sens. 2018, 142, 389–406. [Google Scholar] [CrossRef]
- Caciora, T.; Herman, G.V.; Ilieș, A.; Baias, Ș.; Ilieș, D.C.; Josan, I.; Hodor, N. The Use of Virtual Reality to Promote Sustainable Tourism: A Case Study of Wooden Churches Historical Monuments from Romania. Remote Sens. 2021, 13, 1758. [Google Scholar] [CrossRef]
- Cai, Z.; Fang, C.; Zhang, Q.; Chen, F. Joint development of cultural heritage protection and tourism: The case of Mount Lushan cultural landscape heritage site. Herit. Sci. 2021, 9, 86. [Google Scholar] [CrossRef]
- Nocerino, E.; Menna, F.; Toschi, I.; Morabito, D.; Remondino, F.; Rodríguez-Gonzálvez, P. Valorisation of history and landscape for promoting the memory of WWI. J. Cult. Herit. 2018, 29, 113–122. [Google Scholar] [CrossRef]
- Holtorf, C. Conservation and Heritage As Creative Processes of Future-Making. Int. J. Cult. Prop. 2020, 27, 277–290. [Google Scholar] [CrossRef]
- Labadi, S.; Giliberto, F.; Rosetti, I.; Shetabi, L.; Yildirim, E. Heritage and the Sustainable Development Goals: Policy Guidance for Heritage and Development Actors; ICOMOS Publication: Charenton-le-Pont, France, 2021. [Google Scholar]
- Boboc, R.G.; Duguleană, M.; Voinea, G.-D.; Postelnicu, C.-C.; Popovici, D.-M.; Carrozzino, M. Mobile Augmented Reality for Cultural Heritage: Following the Footsteps of Ovid among Different Locations in Europe. Sustainability 2019, 11, 1167. [Google Scholar] [CrossRef]
- Voinea, G.D.; Girbacia, F.; Postelnicu, C.C.; Marto, A. Exploring Cultural Heritage Using Augmented Reality Through Google’s Project Tango and ARCore. In VR Technologies in Cultural Heritage. VRTCH 2018. Communications in Computer and Information Science; Duguleană, M., Carrozzino, M., Gams, M., Tanea, I., Eds.; Springer: Cham, Switzerland, 2018; Volume 904. [Google Scholar] [CrossRef]
- Torresani, A.; Rigon, S.; Farella, E.M.; Menna, F.; Remondino, F. Unveiling large-scale historical contents with V-SLAM and markerless mobile AR solutions. Int. Arch. Photogramm. Remote Sens. Spatial Inf. Sci. 2021, XLVI-M-1-2021, 761–768. [Google Scholar] [CrossRef]
- Clini, P.; Nespeca, R.; Angeloni, R.; Mammoli, R. The integrated survey of narrow spaces and underground architecture: The case study of Campana caves bas-reliefs. ISPRS Int. Arch. Photogramm. Remote Sens. Spat. Inf. Sci. 2019, XLII-2/W9, 277–282. [Google Scholar] [CrossRef]
- Teruggi, S.; Grilli, E.; Fassi, F.; Remondino, F. 3D surveying, semantic enrichment and virtual access of large cultural heritage. ISPRS Ann. Photogramm. Remote Sens. Spatial Inf. Sci. 2021, VIII-M-1-2021, 155–162. [Google Scholar] [CrossRef]
- Jung, K.; Nguyen, V.T.; Piscarac, D.; Yoo, S.-C. Meet the virtual Jeju Dol Harubang—The mixed VR/AR application for cultural immersion in Korea’s main heritage. ISPRS Int. J. Geo Inf. 2020, 9, 367. [Google Scholar] [CrossRef]
- Nex, F.C.; Rinaudo, F. LiDAR or photogrammetry? Integration is the answer. Eur. J. Remote Sens. 2011, 43, 107–121. [Google Scholar] [CrossRef]
- Remondino, F.; Menna, F.; Koutsoudis, A.; Chamzas, C.; El-Hakim, S. 2013: Design and implement a reality-based 3D zdigitization and modelling project. In 2013 Digital Heritage International Congress (DigitalHeritage); IEEE: Piscataway, NJ, USA, 2013; Volume 1, pp. 137–144. Available online: https://ieeexplore.ieee.org/document/6743723 (accessed on 30 September 2021).
- Ramos, M.; Remondino, F. Data fusion in Cultural Heritage—A Review. ISPRS Arch. Photogramm. Remote Sens. Spat. Inf. Sci. 2015, XL-5/W7, 359–363. [Google Scholar] [CrossRef]
- Pavlidis, G. Applying Innovative Technologies in Heritage Science; IGI Global: Hershey, PA, USA, 2020. [Google Scholar] [CrossRef]
- Vanegas, C.; Aliaga, D.; Benes, B. 2010: Building reconstruction using Manhattan-World grammars. In 2010 IEEE Computer Society Conference on Computer Vision and Pattern Recognition; IEEE: Piscataway, NJ, USA, 2010; pp. 358–365. Available online: https://ieeexplore.ieee.org/document/5540190 (accessed on 15 October 2021).
- Varriale, R. Underground Built Heritage: A Theoretical Approach for the Definition of an International Class. Heritage 2021, 4, 1092–1118. [Google Scholar] [CrossRef]
- Lo Presti, O.; Carli, M.R. Italian Catacombs and Their Digital Presence for Underground Heritage Sustainability. Sustainability 2021, 13, 12010. [Google Scholar] [CrossRef]
- Pace, G.; Salvarani, R. (Eds.) Underground Built Heritage Valorisation. A Handbook; CNR: Rome, Italy, 2021. [Google Scholar] [CrossRef]
- Ebolese, D.; Lo Brutto, M.; Dardanelli, G. The integrated 3D survey for underground archaeological environment. Int. Arch. Photogramm. Remote Sens. Spatial Inf. Sci. 2019, XLII-2/W9, 311–317. [Google Scholar] [CrossRef]
- Underground4Value. CA18110 Underground Built Heritage as Catalyser for Community Valorisation. Available online: https://underground4value.eu/ (accessed on 15 October 2021).
- Dewez TJ, B.; Yart, S.; Thuon, Y.; Pannet, P.; Plat, E. Towards cavity-collapse hazard maps with Zeb-Revo handheld laser scanner point clouds. Photogramm. Rec. 2017, 32, 354–376. [Google Scholar] [CrossRef]
- Zlot, R.; Bosse, M. Three-dimensional mobile mapping of caves. J. Cave Karst Stud. 2014, 76, 191–206. [Google Scholar] [CrossRef]
- Eyre, M.; Wetherelt, A.; Coggan, J. Evaluation of automated underground mapping solutions for mining and civil engineering applications. J. Appl. Remote Sens. 2016, 10, 046011. [Google Scholar] [CrossRef]
- Mattes, J. Underground fieldwork—A cultural and social history of cave cartography and surveying instruments in the 19th and at the beginning of the 20th century. Int. J. Speleol. 2015, 44, 251–266. [Google Scholar] [CrossRef][Green Version]
- Wang, W.; Zhao, W.; Huang, L.; Vimarlund, V.; Wang, Z. Applications of terrestrial laser scanning for tunnels: A review. J. Traffic Transp. Eng. 2014, 1, 325–337. [Google Scholar] [CrossRef]
- Nocerino, E.; Fiorillo, F.; Minto, S.; Menna, F.; Remondino, F. A non-conventional procedure for the 3D modeling of WWI forts. Int. Arch. Photogramm. Remote Sens. Spatial Inf. Sci. 2014, XL-5, 457–464. [Google Scholar] [CrossRef]
- Szwarkowski, D.; Moskal, M. Assessment of deformations in mining areas using the Riegl VZ-400 terrestrial laser scanner. In E3S Web of Conferences; EDP Sciences: Les Ulis, France, 2018; Volume 36, p. 02009. [Google Scholar] [CrossRef]
- Fabbri, S.; Sauro, F.; Santagata, T.; Rossi, G.; De Waele, J. High-resolution 3-D mapping using terrestrial laser scanning as a tool for geomorphological and speleogenetical studies in caves: An example from the Lessini mountains (North Italy). Geomorphology 2017, 280, 16–29. [Google Scholar] [CrossRef]
- Rodríguez-Gonzálvez, P.; Nocerino, E.; Menna, F.; Minto, S.; Remondino, F. 3D surveying & modeling of underground passages in WWI fortifications. Int. Arch. Photogramm. Remote Sens. Spat. Inf. Sci. 2015, 40, 17–24. [Google Scholar] [CrossRef]
- Pukanská, K.; Bartoš, K.; Bella, P.; Sabová, J. Comparison of non-contact surveying technologies for modelling underground morphological structures. Acta Montan. Slovaca 2017, 22, 246–256. [Google Scholar]
- Nocerino, E.; Rodríguez-Gonzálvez, P.; Menna, F. Introduction to mobile mapping with portable systems. In Laser Scanning; CRC Press: Boca Raton, FL, USA, 2019; pp. 37–52. [Google Scholar]
- Di Stefano, F.; Chiappini, S.; Gorreja, A.; Balestra, M.; Pierdicca, R. Mobile 3D scan LiDAR: A literature review. Geomat. Nat. Hazards Risk 2021, 12, 2387–2429. [Google Scholar] [CrossRef]
- Farella, E.M. 3D Mapping of Underground Environments with a Hand-Held Laser Scanner. In Proceedings of the SIFET Annual Conference, Lecce, Italy, 8–10 June 2016. [Google Scholar]
- Sammartano, G.; Spanò, A. Point clouds by SLAM-based mobile mapping systems: Accuracy and geometric content validation in multisensor survey and stand-alone acquisition. Appl. Geomat. 2018, 10, 317–339. [Google Scholar] [CrossRef]
- Raval, S.S.; Banerjee, B.P.; Kumar Singh, S.; Canbulat, I. A Preliminary Investigation of Mobile Mapping Technology for Underground Mining. In IGARSS 2019—2019 IEEE International Geoscience and Remote Sensing Symposium; IEEE: Piscataway, NJ, USA, 2019; pp. 6071–6074. [Google Scholar] [CrossRef]
- Blaser, S.; Nebiker, S.; Wisler, D. Portable image-based high performance mobile mapping system in underground environments—system configuration and performance evaluation. ISPRS Ann. Photogramm. Remote Sens. Spatial Inf. Sci. 2019, IV-2/W5, 255–262. [Google Scholar] [CrossRef]
- Giordan, D.; Godone, D.; Baldo, M.; Piras, M.; Grasso, N.; Zerbetto, R. Survey Solutions for 3D Acquisition and Representation of Artificial and Natural Caves. Appl. Sci. 2021, 11, 6482. [Google Scholar] [CrossRef]
- Ellmann, A.; Kütimets, K.; Varbla, S.; Väli, E.; Kanter, S. Advancements in underground mine surveys by using SLAM-enabled handheld laser scanners. Surv. Rev. 2021, 1–12. [Google Scholar] [CrossRef]
- Goad, C.C. The Ohio State University Highway Mapping Project: The Positioning Component. In Proceedings of the 47th Annual Meeting of The Institute of Navigation (1991), Williamsburg, VA, USA, 10–12 June 1991; pp. 117–120. [Google Scholar]
- Gollob, C.; Ritter, T.; Nothdurft, A. Forest Inventory with Long Range and High-Speed Personal Laser Scanning (PLS) and Simultaneous Localization and Mapping (SLAM) Technology. Remote Sens. 2020, 12, 1509. [Google Scholar] [CrossRef]
- Puente, I.; Arias, P. Review of mobile mapping and surveying technologies. Measurement 2013, 46, 2127–2145. [Google Scholar] [CrossRef]
- Durrant-Whyte, H.; Bailey, T. Simultaneous localization and mapping: Part I. IEEE Robot. Autom. Mag. 2006, 13, 99–110. [Google Scholar] [CrossRef]
- Bailey, T.; Durrant-Whyte, H. Simultaneous localization and mapping (SLAM): Part II. IEEE Robot. Autom. Mag. 2006, 13, 108–117. [Google Scholar] [CrossRef]
- Cadena, C.; Carlone, L.; Carrillo, H.; Latif, Y.; Scaramuzza, D.; Neira, J.; Reid, I.; Leonard, J.J. Past, present, and future of simultaneous localization and mapping: Toward the robust-perception age. IEEE Trans. Robot. 2016, 32, 1309–1332. [Google Scholar] [CrossRef]
- Hess, W.; Kohler, D.; Rapp, H.; Andor, D. Real-Time Loop Closure in 2D LIDAR SLAM. In Proceedings of the 2016 IEEE International Conference on Robotics and Automation (ICRA), Stockholm, Sweden, 16–20 May 2016; pp. 1271–1278. [Google Scholar] [CrossRef]
- Mur-Artal, R.; Montiel, J.M.M.; Tardos, J.D. ORB-SLAM: A Versatile and Accurate Monocular SLAM System. In Proceedings of the IEEE transactions on robotics, Stockholm, Sweden, 16–21 May 2015; Volume 31, pp. 1147–1163. [Google Scholar] [CrossRef]
- Newcombe, R.A.; Izadi, S.; Hilliges, O.; Molyneaux, D.; Kim, D.; Davison, A.J.; Kohi, P.; Shotton, J.; Hodges, S.; Fitzgibbon, A. Kinectfusion: Real-Time Dense Surface Mapping and Tracking. In Proceedings of the 2011 10th IEEE International Symposium On Mixed And Augmented Reality, Basel, Switzerland, 26–29 October 2011; pp. 127–136. [Google Scholar] [CrossRef]
- Bizzarri, R.; Baldanza, A.; Luccioni, I.; Recanatini, A. The geology of the Camerano area through the reconstruction of sedimentary sequences of the urban caves. Geol. Croat. 2013, 66, 205–218. [Google Scholar] [CrossRef]
- Soriano, F. Le Antiche Fonti dei Corpi Arenacei Plio-Pleistocenici Dell’anconetano: Valenza di un Tempo e Stato Attuale. Geol. Dell’Ambiente n. 3/2017 2017, 133–142. [Google Scholar]
- Recanatini, A.; Campagnoli, M. La Memoria del Sottosuolo: Cavità Artificiali e Sistemi Ipogei Sotto i Centri Storici Alle Falde del Conero Ed in Area Mesoadriatica; Atti del Convegno di studi: Camerano, Italy, 1999; Volume 14, di Quaderni di storia cameranese. [Google Scholar]
- Recanatini, A. La Città Segreta, Correlazioni tra Sviluppo Urbano di Superficie e Rete Ipogea Nei Centri Storici Alle Falde del Conero. Il Caso di Camerano e Osimo; Atti del Convegno di studi: Camerano, Italy, 1999; Volume 17, p. 18. [Google Scholar]
- Grotte di Camerano. Available online: http://www.grottedicamerano.it/en/home.html (accessed on 30 September 2021).
- Stencil 2-16—KAARTA. Available online: https://www.kaarta.com/products/stencil-2-for-rapid-long-range-mobile-mapping/ (accessed on 31 May 2021).
- ZEB Horizon—GeoSLAM. Available online: https://geoslam.com/solutions/zeb-horizon/ (accessed on 31 May 2021).
- Torresani, A.; Menna, F.; Battisti, R.; Remondino, F. A V-SLAM Guided and Portable System for Photogrammetric Applications. Remote Sens. 2021, 13, 2351. [Google Scholar] [CrossRef]
- Sumikura, S.; Shibuya, M.; Sakurada, K. OpenVSLAM: A versatile Visual SLAM framework. In Proceedings of the 27th ACM International Conference on Multimedia, Nice, France, 21–25 October 2019; pp. 2292–2295. [Google Scholar] [CrossRef]
- Previtali, M.; Banfi, F.; Brumana, R. Handheld 3D Mobile Scanner (SLAM): Data Simulation and Acquisition for BIM Modelling. In International Workshop on R3 in Geomatics: Research, Results and Review; Springer: Cham, Switzerland, 2019; pp. 256–266. [Google Scholar] [CrossRef]
- Fei, L.; Jaboyedoff, M.; Pullarello, J.; Derron, M.H.; Guerin, A.; Noël, F. Qualitative comparison of point clouds acquired by LiDAR, SfM, GeoSLAM and Sense 3D for the erosion quantification of a rock wall. In Geophysical Research Abstracts; 2019; p. 21. [Google Scholar]
- Lehtola, V.V.; Kaartinen, H.; Nüchter, A.; Kaijaluoto, R.; Kukko, A.; Litkey, P.; Honkavaara, E.; Rosnell, T.; Vaaja, M.T.; Virtanen, J.-P.; et al. Comparison of the Selected State-Of-The-Art 3D Indoor Scanning and Point Cloud Generation Methods. Remote Sens. 2017, 9, 796. [Google Scholar] [CrossRef]
- Salgues, H.; Macher, H.; Landes, T. Evaluation of Mobile Mapping Systems for Indoor Surveys. Int. Arch. Photogramm. Remote Sens. Spatial Inf. Sci. 2020, XLIV-4/W1-2020, 119–125. [Google Scholar] [CrossRef]
- Trzeciak, M.; Brilakis, I. Comparison of Accuracy and Density Of Static And Mobile Laser Scanners. In Proceedings of the 2021 European Conference on Computing in Construction, Rhodes, Greece, 19–18 July 2021. [Google Scholar] [CrossRef]
- Bronzino GP, C.; Grasso, N.; Matrone, F.; Osello, A.; Piras, M. Laser-Visual-Inertial Odometry Based Solution For 3d Heritage Modeling: The Sanctuary Of The Blessed Virgin Of Trompone. Int. Arch. Photogramm. Remote Sens. Spatial Inf. Sci. 2019, XLII-2/W15, 215–222. [Google Scholar] [CrossRef]
- Di Stefano, F.; Cabrelles, M.; García-Asenjo, L.; Lerma, J.L.; Malinverni, E.S.; Baselga, S.; Garrigues, P.; Pierdicca, R. Evaluation of Long-Range Mobile Mapping System (MMS) and Close-Range Photogrammetry for Deformation Monitoring. A Case Study of Cortes de Pallás in Valencia (Spain). Appl. Sci. 2020, 10, 6831. [Google Scholar] [CrossRef]
Publisher’s Note: MDPI stays neutral with regard to jurisdictional claims in published maps and institutional affiliations. |
© 2021 by the authors. Licensee MDPI, Basel, Switzerland. This article is an open access article distributed under the terms and conditions of the Creative Commons Attribution (CC BY) license (https://creativecommons.org/licenses/by/4.0/).
