
Sustainable Finance and COVID-19: The Reaction of ESG Funds to the 2020 Crisis

Abstract
:1. Introduction
2. Related Literature
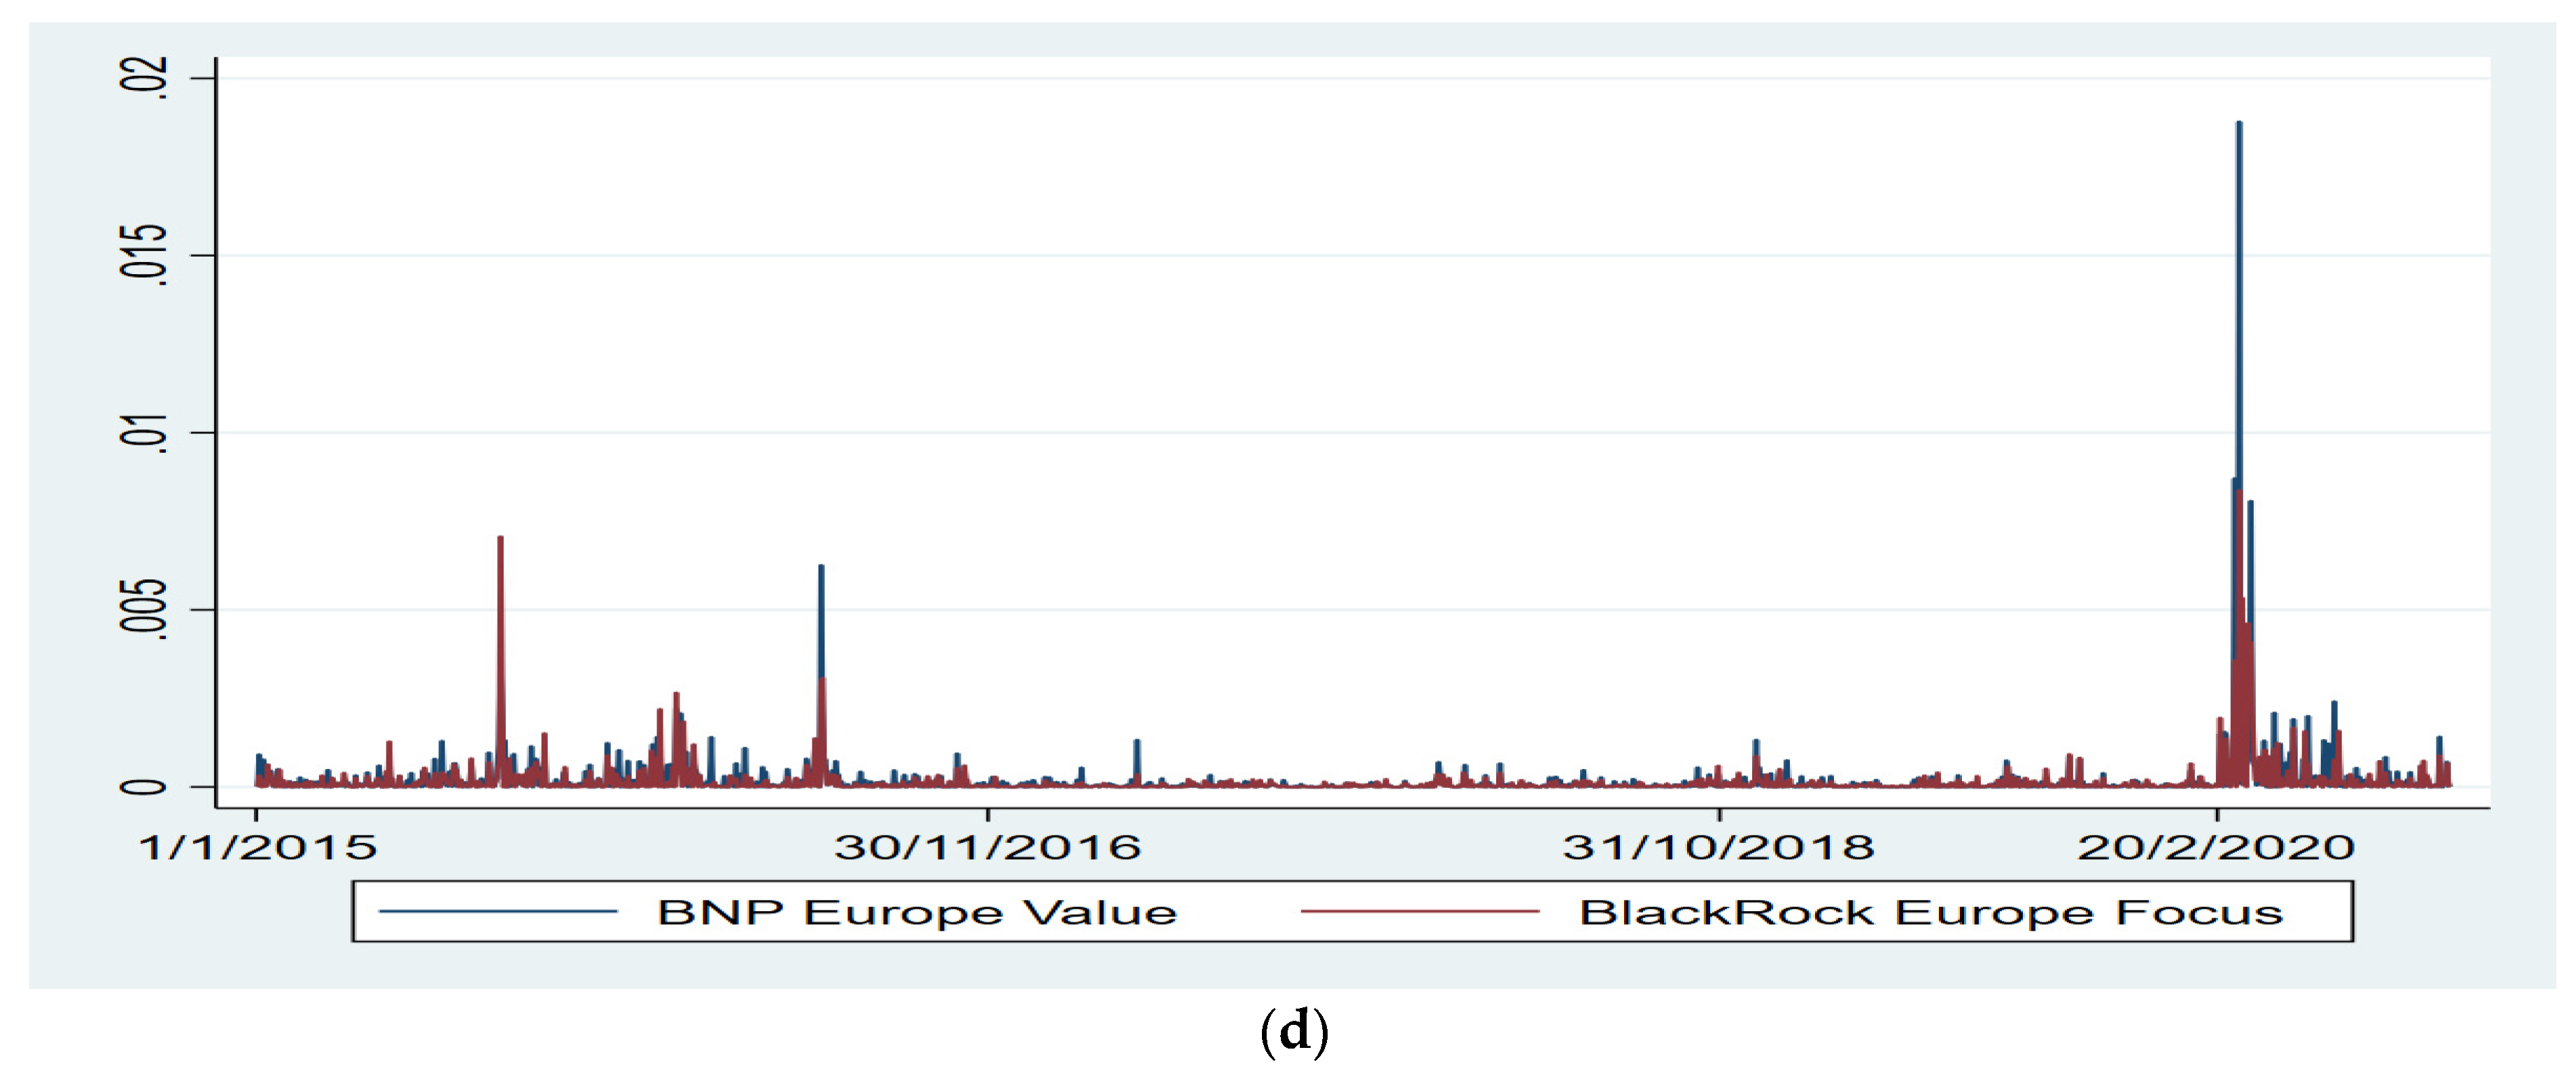
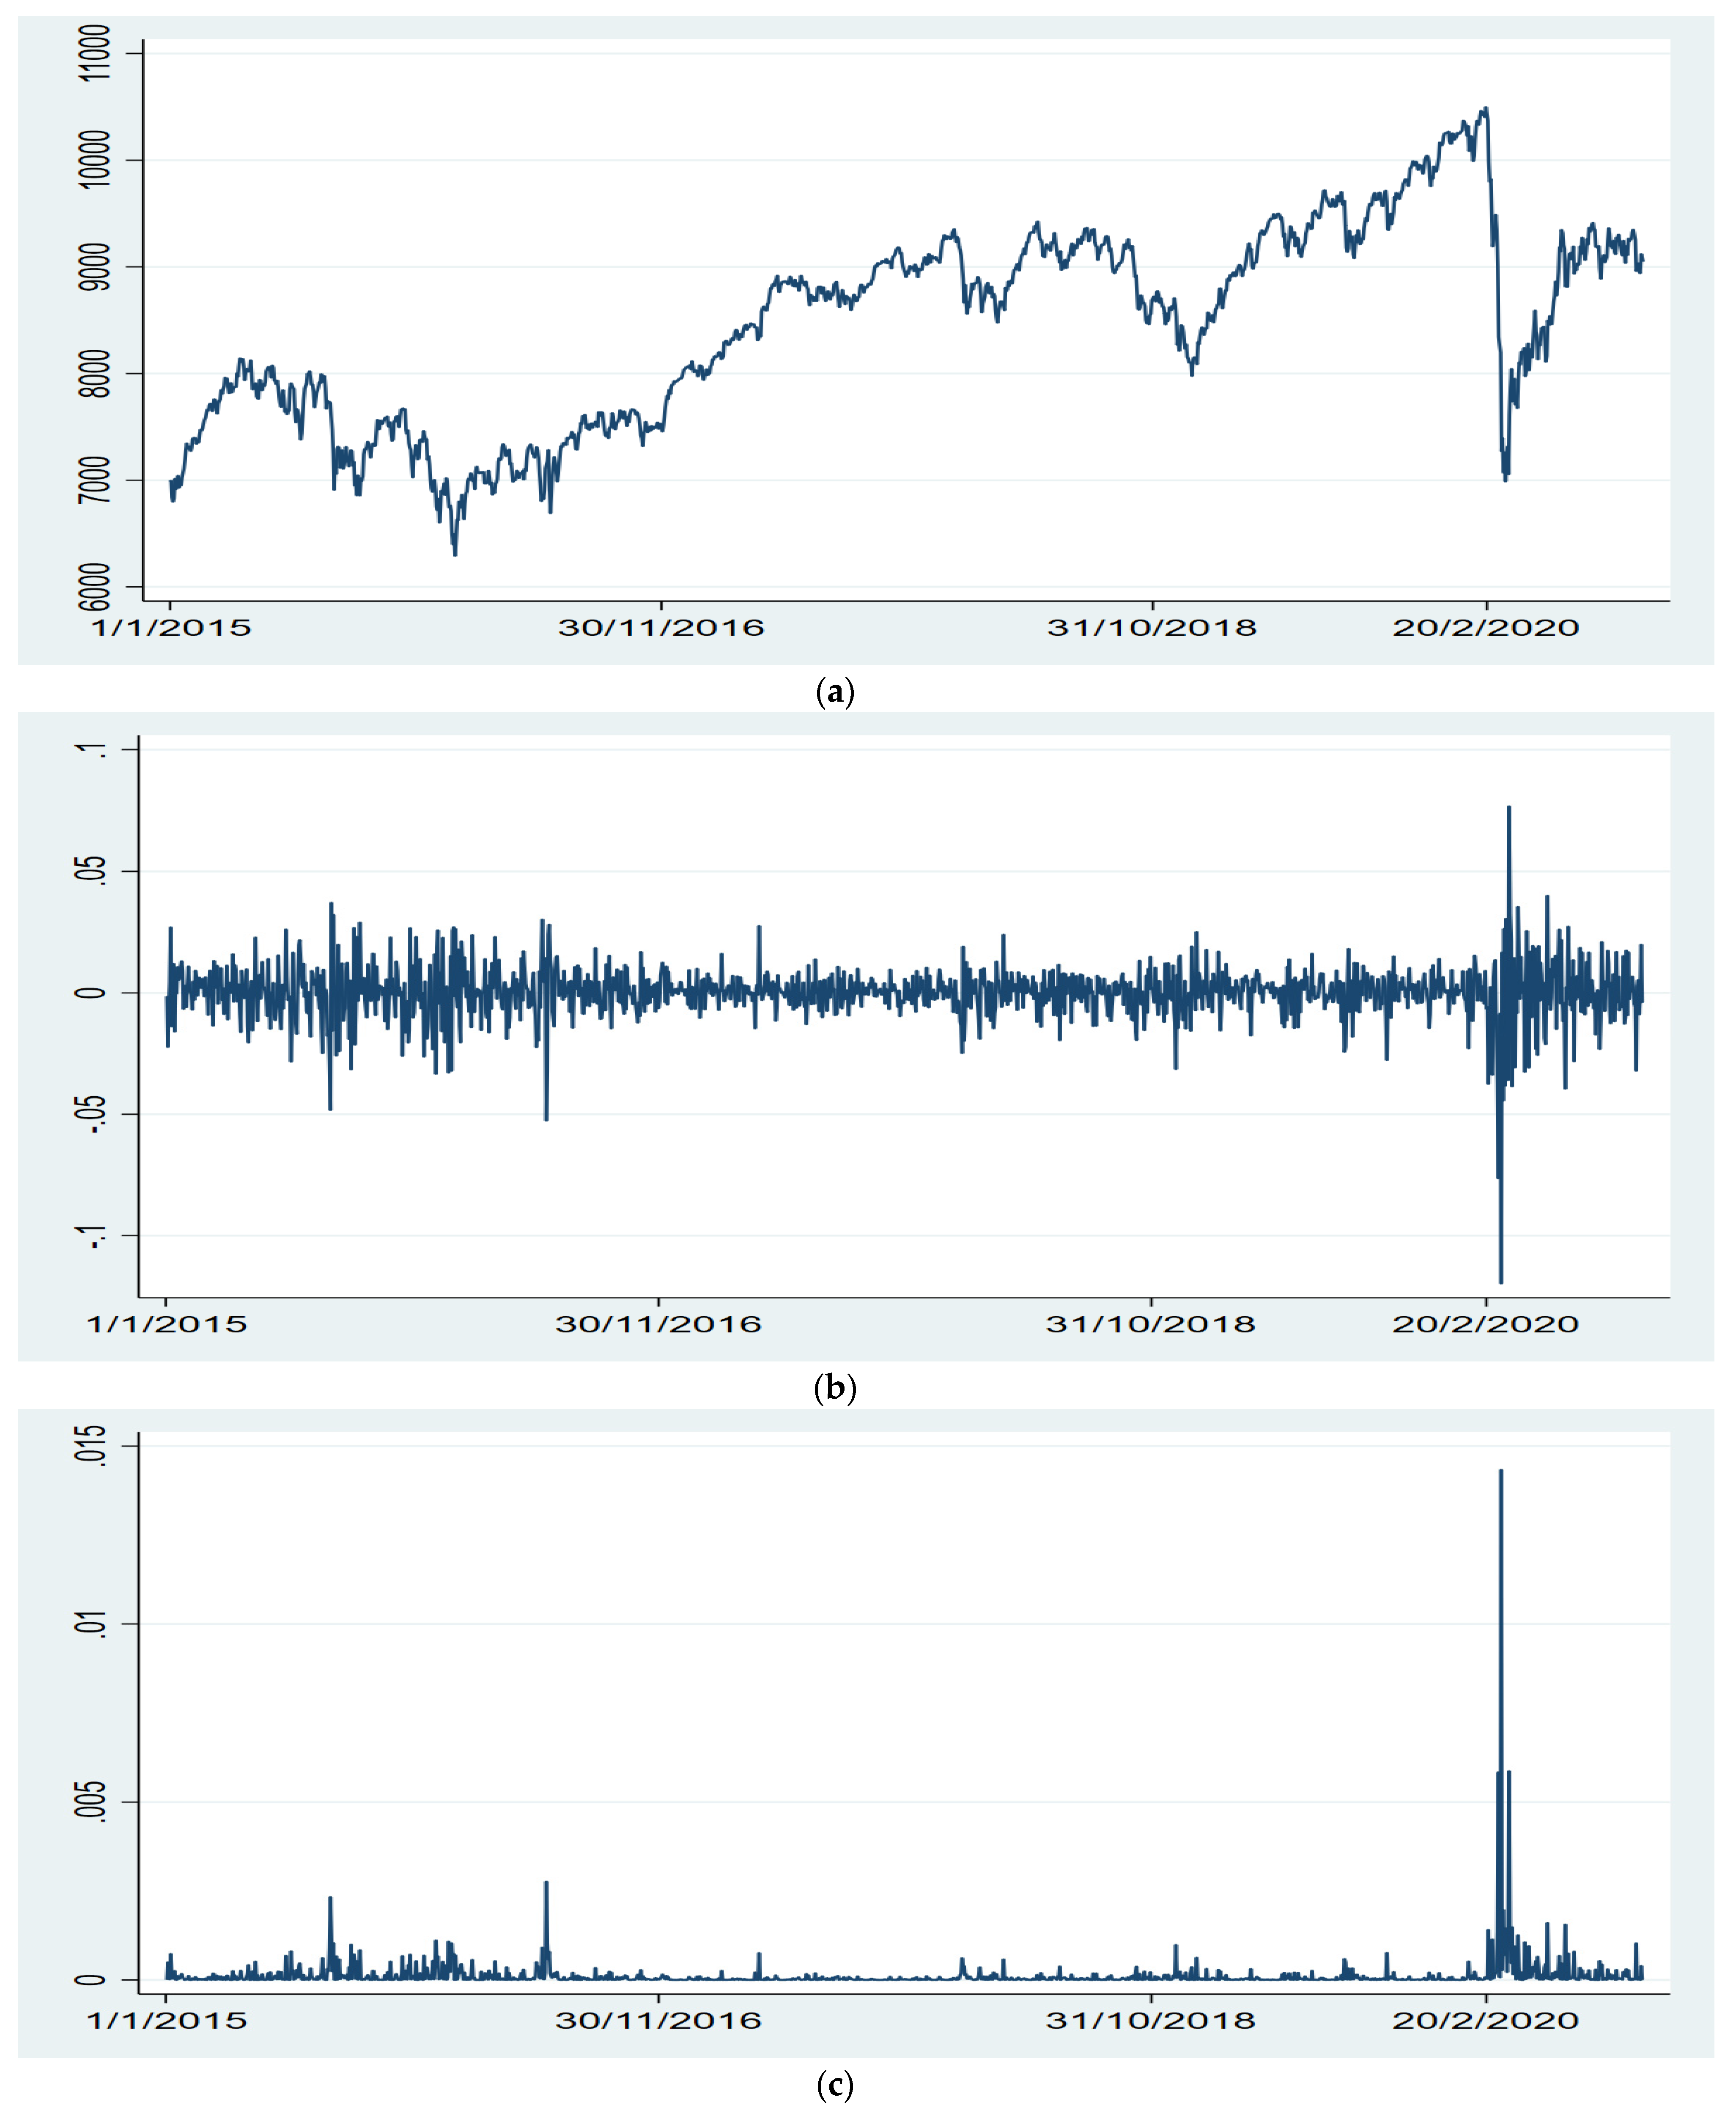
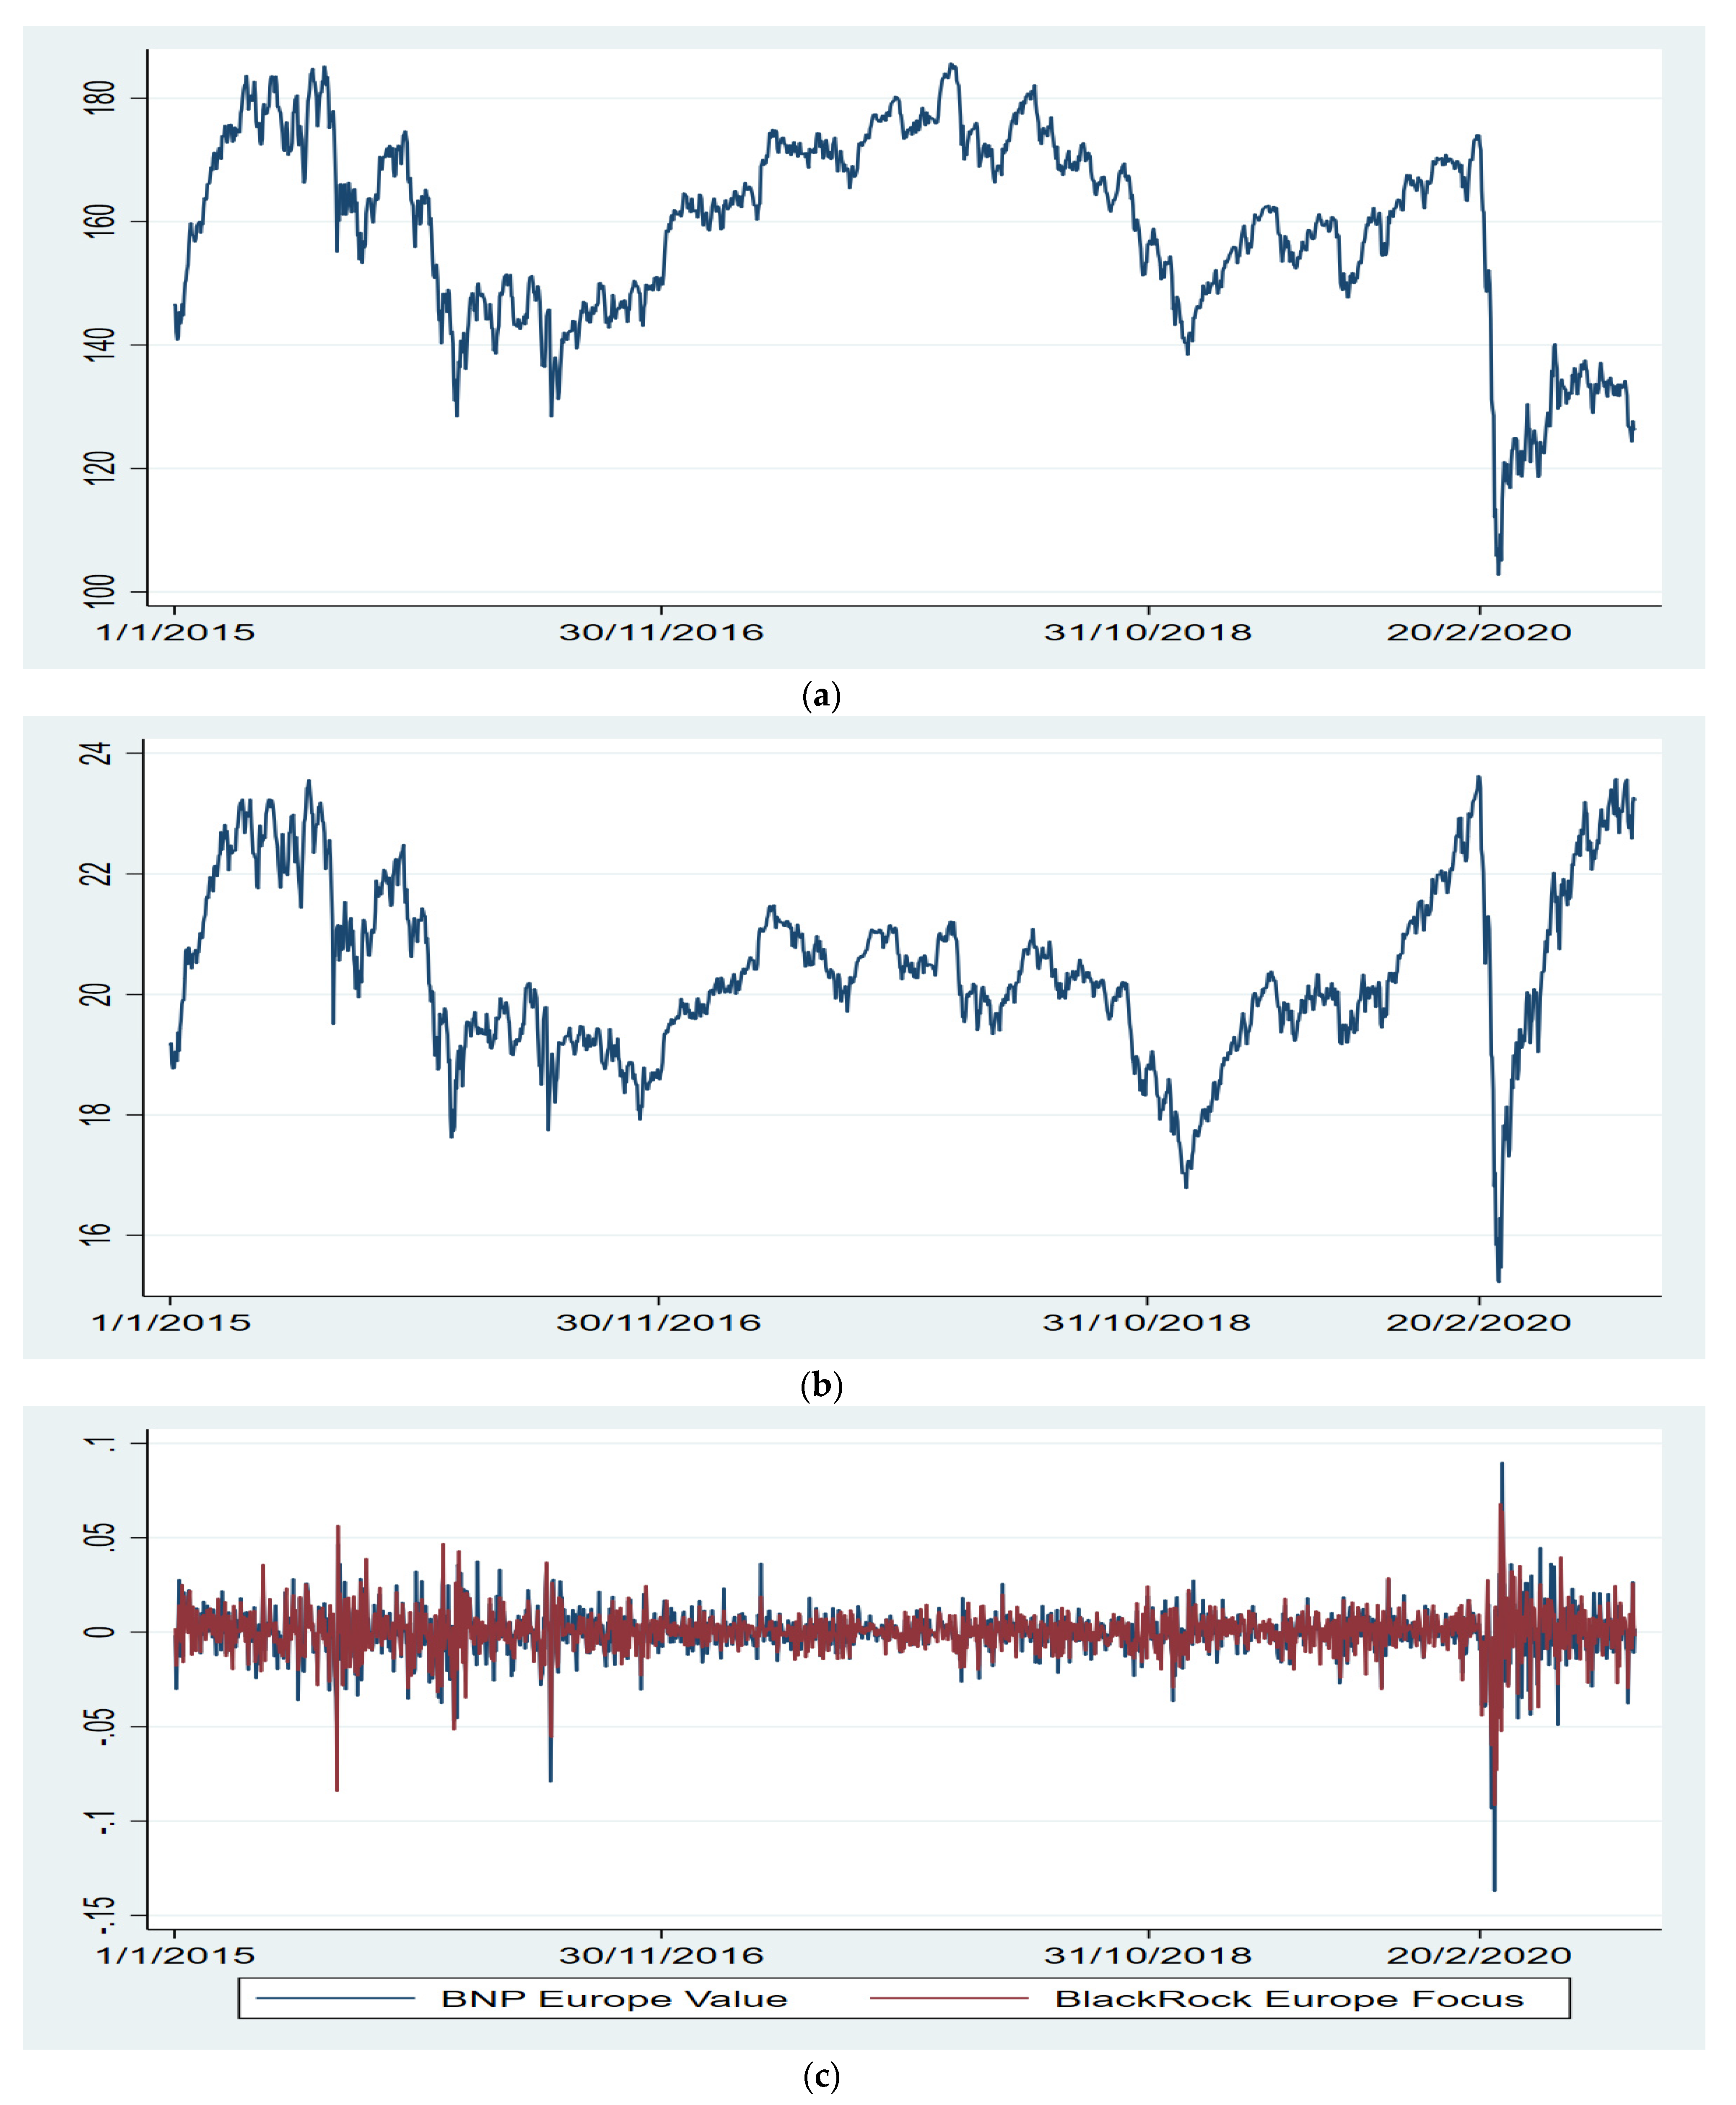
3. Data Description
4. Empirical Strategy
4.1. GARCH
4.2. Multivariate GARCH
4.3. Event Study
5. Conclusions
Supplementary Materials
Author Contributions
Funding
Institutional Review Board Statement
Informed Consent Statement
Data Availability Statement
Conflicts of Interest
References
- Contini, D.; Costabile, F. Does Air pollution Influence COVID-19 Outbreak? Atmosphere 2020, 11, 377. [Google Scholar] [CrossRef] [Green Version]
- Setti, L.; Passarini, F.; De Gennaro, G.; Di Giulio, A.; Palmisani, J.; Buono, P.; Fornari, G.; Perrone, M.G.; Piazzalunga, A.; Barbieri, P.; et al. Evaluation of the Potential Relationship Between Particulate Matter (PM) Pollution and COVID-19 Infection Spread in Italy. BMJ 2020, 10. [Google Scholar] [CrossRef]
- Conticini, E.; Frediani, B.; Caro, D. Can atmospheric pollution be considered a co-factor in extremely high level of SARS-CoV-2 lethality in Northern Italy? Environ. Pollut. 2020, 261, 114465. [Google Scholar] [CrossRef] [PubMed]
- ECB. Economic Bulletin; European Central Bank: Frankfurt, Germany, 2020. [Google Scholar]
- Coibion, O.; Gorodnichenko, Y.; Weber, M. The Cost of the COVID-19 Crisis: Lockdowns, Macroeconomic Expectations, and Consumer Spending; NBER Work. Pap. No. w27141; National Bureau of Economic Research: Cambridge, MA, USA, 2020. [Google Scholar] [CrossRef]
- IMF. World Economic Outlook Update: A Crisis Like No Other, an Uncertain Recovery; The International Monetary Fund: Washington, DC, USA, 2020. [Google Scholar]
- Guerrieri, V.; Guido, L.; Straub, L.; Werning, I. Macroeconomic Implications of COVID-19: Can Negative Supply Shocks Cause Demand Shortages? NBER Work. Pap. No. w26918; National Bureau of Economic Research: Cambridge, MA, USA, 2020; pp. 1–36. [Google Scholar] [CrossRef]
- Bonaccorsi, G.; Pierri, F.; Cinelli, M.; Porcelli, F.; Galeazzi, A.; Flori, A.; Schmidth, A.L.; Valensise, C.M.; Scala, A.; Quattrociocchi, W.; et al. Economic and Social Consequences of Human Mobility Restrictions Under COVID-19. Proc. Natl. Acad. Sci. USA 2020, 117, 15530–15535. [Google Scholar] [CrossRef]
- Liu, H.; Manzoor, A.; Manzoon, Z.; Wang, C.; Zhang, L. The COVID-19 outbreak and affected countries stock markets response. Int. J. Environ. Res. Public Health 2020, 17, 2800. [Google Scholar] [CrossRef] [Green Version]
- Meher, B.K.; Hawaldar, I.T.; Mohapatra, L.; Spulbar, C.; Birau, R. The effects of ESG scores on investment returns and stock volatility. Int. J. Energy Econ. Policy 2020, 10, 4. [Google Scholar] [CrossRef]
- McWilliams, A.; Siegel, D. Corporate social responsibility: A theory of the firm perspective. Acad. Manag. Rev. 2001, 26, 117–127. [Google Scholar] [CrossRef]
- Nofsinger, J.; Varma, A. Socially responsible funds and market crises. J. Bank. Financ. 2014, 48, 180–193. [Google Scholar] [CrossRef]
- Lins, K.V.; Servaes, H.; Tamayo, A. Social capital, trust, and firm performance: The value of corporate social responsibility during the financial crisis. J. Financ. 2017, 72, 4. [Google Scholar] [CrossRef] [Green Version]
- Broadstock, D.C.; Chan, K.; Cheng, L.; Wang, X. The role of ESG performance during times of financial crisis: Evidence from COVID-19 in China. Financ. Res. Lett. 2021, 38, 101716. [Google Scholar] [CrossRef] [PubMed]
- Engelhardt, N.; Ekkenga, J.; Posch, P. ESG Ratings and Stock Performance during the COVID-19 Crisis. Sustainability 2021, 13, 7133. [Google Scholar] [CrossRef]
- Leite, P.; Cortez, M.C. Performance of European socially responsible funds during market crises: Evidence from France. Int. Rev. Financ. Anal. 2015, 40, 132–141. [Google Scholar] [CrossRef]
- Matallín-Sáez, J.C.; Soler-Domínguez, A.; de Mingo-López, D.V.; Tortosa-Ausina, E. Does socially responsible mutual fund performance vary over the business cycle? New insights on the effect of idiosyncratic SR features. Bus. Ethics 2019, 28, 71–98. [Google Scholar] [CrossRef] [Green Version]
- Folger-Laronde, Z.; Pashang, A.; Feor, L.; ElAlfy, A. ESG Ratings and Financial Performance of Exchange-Traded Funds During the COVID-19 pandemic. J. Sustain. Financ. Invest. 2020, 1–7. [Google Scholar] [CrossRef]
- Demers, E.; Hendrikse, J.; Joos, P.; Lev, B. ESG did not immunize stocks during the COVID-19 crisis, but investments in intangible assets did. J. Bus. Finance Account. 2021, 48, 3–4. [Google Scholar] [CrossRef]
- Chiappini, H.; Vento, G.; De Palma, L. The Impact of COVID-19 Lockdowns on Sustainable Indexes. Sustainability 2021, 13, 1846. [Google Scholar] [CrossRef]
- Revelli, C.; Viviani, J.L. Financial performance of socially responsible investing (SRI): What have we learned? A meta-analysis. Bus. Ethics Eur. Rev. 2015, 24, 158–185. [Google Scholar] [CrossRef]
- Hartzmark, S.M.; Sussman, A.B. Do Investors Value Sustainability? A Natural Experiment Examining Ranking and Fund Flows. J. Financ. 2019, 74, 6. [Google Scholar] [CrossRef]
- Becchetti, L.; Ciciretti, R.; Dalò, A.; Herzel, S. Socially responsible and conventional investment funds: Performance comparison and the global financial crisis. Appl. Econ. 2015, 47, 2541–2562. [Google Scholar] [CrossRef]
- Gangi, F.; Trotta, C. The ethical finance as a response to the financial crises: An empirical survey of European SRFs performance. J. Manag. Gov. 2015, 19, 371–394. [Google Scholar] [CrossRef]
- Yingxu, Y. The impact of ESG performance during times of crisis. Perspectives 2020, 53. Available online: http://unipub.lib.uni-corvinus.hu/6734/1/Green_Financial_Perspectives.pdf#page=55 (accessed on 22 November 2021).
- Albuquerque, R.; Koskinen, Y.; Yang, S.; Zhang, C. Resiliency of Environmental and Social Stocks: An Analysis of the Exogenous COVID-19 Market Crash. Rev. Corp. Financ. Stud. 2020, 9, 593–621. [Google Scholar] [CrossRef]
- Xiong, J.X. The Impact of ESG Risk on Stocks. J. Impact ESG Investig. 2021, 2, 7–18. [Google Scholar] [CrossRef]
- Rubbaniy, G.; Khalid, A.A.; Ali, S.; Naveed, M. Are ESG Stocks Safe-Haven during COVID-19? SSRN Pap.; 2021; pp. 1–24. Available online: https://papers.ssrn.com/sol3/papers.cfm?abstract_id=3779430 (accessed on 22 November 2021).
- Mirza, N.; Naqvi, B.; Rahat, B.; Rizvi, S.K.A. Price reaction, volatility timing and funds’ performance during Covid-19. Financ. Res. Lett. 2020, 36, 101657. [Google Scholar] [CrossRef] [PubMed]
- Ferriani, F.; Natoli, F. ESG risks in times of Covid-19. Appl. Econ. Lett. 2020, 28, 1537–1541. [Google Scholar] [CrossRef]
- Nakai, M.; Yamaguchi, K.; Takeuchi, K. Can SRI Better Resist Global Financial Crisis? Evidence from Japan. Int. Rev. Financ. Anal. 2016, 48, 12–20. [Google Scholar] [CrossRef] [Green Version]
- Biasin, M.; Cerqueti, R.; Giacomini, E.; Marinelli, N.; Quaranta, A.G.; Riccetti, L. Macro Asset Allocation with Social Impact Investments. Sustainability 2019, 11, 3140. [Google Scholar] [CrossRef] [Green Version]
- Abate, G.; Basile, I.; Ferrari, P. The level of sustainability and mutual fund performance in Europe: An empirical analysis using ESG ratings. Corp. Soc. Responsib. Environ. Manag. 2021, 28, 5. [Google Scholar] [CrossRef]
- Das, N.; Chatterje, S.; Ruf, B.; Sunder, A. Fund Characteristics and Performances of Socially Responsible Mutual Funds: Do ESG Ratings Play a Role? J. Account. Financ. 2018, 18, 7. [Google Scholar]
- Ouchen, A. Is the ESG portfolio less turbulent than a market benchmark portfolio? Risk Manag. 2021, 1–33. [Google Scholar] [CrossRef]
- Becchetti, L.; Ciciretti, R. Corporate Social Responsibility and Stock Market Performance. CEIS Res. Pap. 2009, 19, 1283–1293. [Google Scholar] [CrossRef]
- Sabbaghi, O. The behavior of green exchange-traded funds. Manag. Financ. 2011, 37, 5. [Google Scholar] [CrossRef]
- Caporale, G.M.; Cipollini, A.; Spagnolo, N. Testing for contagion: A conditional correlation analysis. J. Empir. Financ. 2005, 12, 476–489. [Google Scholar] [CrossRef]
- Salvador, L.; De Paula Franca, I. Correlation of financial markets in times of crisis. Stat. Mech. Its Appl. 2011, 391, 187–208. [Google Scholar]
- Morales, L.; Andreosso-O’Callaghan, B. The Global Financial Crisis: World Market or Regional Contagion Effects? Int. Rev. Econ. Financ. 2014, 29, 108–131. [Google Scholar] [CrossRef] [Green Version]
- Roy, R.P.; Roy, S.S. Financial Contagion and Volatility Spillover: An Exploration into Indian Commodity Derivative Market. Econ. Model. 2017, 67, 368–380. [Google Scholar] [CrossRef]
- Cerqueti, R.; Ciciretti, R.; Dalò, A.; Nicolosi, M. ESG Investing: A Chance to Reduce Systematic Risk. J. Financ. Stab. 2021, 54, 100887. [Google Scholar] [CrossRef]
- Engle, R.F. Autoregressive Conditional Heteroschedasticity with estimates of the variance of UK inflation. Econometrica 1982, 50, 987–1007. [Google Scholar] [CrossRef]
- Hoti, S.; McAleer, M.; Pauwels, L. Measuring risk in environmental finance. J. Econ. Surv. 2007, 21, 970–998. [Google Scholar] [CrossRef]
- Rehan, M.; Alvi, J.; Karaca, S. Short Term Stress of COVID-19 on World Major Stock Indices; SSRN Pap.; 2020; pp. 1–34. Available online: https://papers.ssrn.com/sol3/papers.cfm?abstract_id=287751 (accessed on 22 November 2021).
- Bollerslev, T. Generalized autoregressive conditional heteroskedasticity. J. Econom. 1986, 31, 307–327. [Google Scholar] [CrossRef] [Green Version]
- Nelson, D.B. Conditional Heteroskedasticity in Asset Returns: A New Approach. Econometrica 1991, 59, 347–370. [Google Scholar] [CrossRef]
- Glosten, L.R.; Jagannathan, R.; Runkle, D.E. On the relation between the expected value and the volatility of the nominal excess return on stocks. J. Financ. 1993, 48, 1779–1801. [Google Scholar] [CrossRef]
- Zakoian, J. Threshold heteroskedastic models. J. Econ. Dyn. Contro 1994, 18, 931–955. [Google Scholar] [CrossRef]
- Forbes, K.J.; Rigobon, R. No contagion, only interdependence: Measuring stock market co-movement. J. Financ. 2002, 57, 2223–2261. [Google Scholar] [CrossRef]
- Engle, R.F.; Sheppard, K. Theoretical and Empirical Properties of Dynamic Conditional Correlation Multivariate GARCH; NBER Work. Pap.; 2001; p. 8554. Available online: https://papers.ssrn.com/sol3/papers.cfm?abstract_id=3663900 (accessed on 22 November 2021).
- Engle, R.F. Dynamic Conditional Correlation: A Simple Class of Multivariate Generalized Autoregressive Conditional Heteroskedasticity Models. J. Bus. Econ. Stat. 2002, 20, 339–350. [Google Scholar] [CrossRef]
- Bollerslev, T. Modelling the Coherence in Short-Run Nominal Exchange Rates: A Multivariate Generalized ARCH Model. Rev. Econ. Stat. 1990, 72, 498–505. [Google Scholar] [CrossRef]
- Zhang, D.; Hu, M.; Ji, Q. Financial markets under the global pandemic of COVID-19. Financ. Res. Lett. 2020, 36, 101528. [Google Scholar] [CrossRef]
- Bash, A. International Evidence of COVID-19 and Stock Market Returns: An Event Study Analysis. Int. J. Econ. Financ. Issues 2020, 10, 34–38. [Google Scholar] [CrossRef]
- AlAli, M.S. The Effect of WHO COVID-19 Announcement on Asian Stock Markets Returns: An Event Study Analysis. J. Econ. Bus. 2020, 3, 3. [Google Scholar] [CrossRef]
- Chen, M.H.; Jang, S.S.; Kim, W.G. The impact of the SARS outbreak on Taiwanese hotel stock performance: An event-study approach. Int. J. Hosp. Manag. 2007, 26, 200–212. [Google Scholar] [CrossRef] [PubMed]
- Ichev, R.; Marinč, M. Stock prices and geographic proximity of information: Evidence from the Ebola outbreak. Int. Rev. Financ. Anal. 2018, 56, 153–166. [Google Scholar] [CrossRef]
- Brown, S.J.; Warner, J.B. Using daily stock returns: The case of event studies. J. Financ. Econ. 1985, 14, 3–31. [Google Scholar] [CrossRef]


| Funds | ESG Rating 1 | Obs. | Mean | SD | Min. | Max. | Skewness | Kurtosis | p-Value 2 | JB 3 Test | ADF 4 | Durbin Test 5 |
|---|---|---|---|---|---|---|---|---|---|---|---|---|
| BNP Europe Value | 1 | 1499 | −0.0001 | 0.013 | −0.13 | 0.089 | −1.32 | 17.66 | 0.000 | 1.4 × 10⁴ | −37.568 *** | 0.26 *** |
| Odey Pan EUR | 1 | 1499 | −0.0002 | 0.009 | −0.075 | 0.053 | −1.11 | 13.04 | 0.000 | 6608 | −35.05 *** | 0.001 *** |
| Capital Group | 2 | 1499 | 0.00008 | 0.011 | −0.119 | 0.08 | −1.54 | 20.86 | 0.000 | 2.1 × 10⁴ | −38.408 *** | 0.786 *** |
| Candriam Equities | 2 | 1499 | 0.00005 | 0.012 | −0.138 | 0.087 | −1.435 | 21.828 | 0.000 | 2.3 × 10⁴ | −38.27 *** | 0.684 *** |
| Anima | 2 | 1499 | 0.00008 | 0.011 | −0.113 | 0.028 | −1.216 | 15.96 | 0.000 | 1.1 × 10⁴ | −38.119 *** | 0.573 *** |
| Amundi Index MSCI EUR | 2 | 1499 | 0.0001 | 0.011 | −0.125 | 0.082 | −1.28 | 18.29 | 0.000 | 1.5 × 10⁴ | −38.536 *** | 0.887 *** |
| Amundi Funds Top EUR | 2 | 1499 | 0.00006 | 0.012 | −0.126 | 0.081 | −1.28 | 17.699 | 0.000 | 1.4 × 10⁴ | −37.63 *** | 0.289 *** |
| Allianz | 2 | 1499 | 0.0001 | 0.011 | −0.103 | 0.067 | −1.33 | 16.4 | 0.000 | 1.2 × 10⁴ | −38.463 *** | 0.829 *** |
| Amundi AZ | 2 | 1499 | 0.00004 | 0.012 | −0.129 | 0.075 | −1.53 | 19.36 | 0.000 | 1.7 × 10⁴ | −38.74 *** | 0.958 *** |
| Amundi SF | 2 | 1499 | 0.0001 | 0.012 | −0.127 | 0.075 | −1.46 | 18.51 | 0.000 | 1.6 × 10⁴ | −37.948 *** | 0.460 *** |
| BNP Europe Equity | 3 | 1499 | 0.0001 | 0.011 | −0.117 | 0.068 | −0.117 | 0.029 | 0.000 | 8757 | −38.988 *** | 0.756 *** |
| GAM Star | 3 | 1499 | 0.0002 | 0.011 | −0.107 | 0.083 | −0.9511 | 14.062 | 0.000 | 7870 | −38.047 *** | 0.524 *** |
| Candriam L. C | 3 | 1499 | 0.0004 | 0.010 | −0.096 | 0.055 | −0.8235 | 10.605 | 0.000 | 3782 | −39.19 *** | 0.608 *** |
| Candriam L. N | 3 | 1499 | 0.0004 | 0.010 | −0.097 | 0.055 | −0.8252 | 10.62 | 0.000 | 3799 | −39.185 *** | 0.618 *** |
| CPR Silver age | 3 | 1298 | 0.00003 | 0.010 | −0.115 | 0.071 | −1.55 | 20.68 | 0.000 | 1.7 × 10⁴ | −35.214 *** | 0.435 *** |
| Azimut | 3 | 1499 | −0.0001 | 0.011 | −0.138 | 0.085 | −1.696 | 24.28 | 0.000 | 2.9 × 10⁴ | −39.528 *** | 0.402 *** |
| DPAM | 3 | 1499 | 0.0003 | 0.011 | −0.114 | 0.075 | −1.068 | 15.151 | 0.000 | 9506 | −38.634 *** | 0.964 *** |
| BNP Action Croissance | 4 | 1499 | 0.0003 | 0.01 | −0.087 | 0.066 | −1.176 | 14.109 | 0.000 | 8054 | −39.407 *** | 0.468 *** |
| Candriam optimum | 4 | 1499 | 0.0003 | 0.01 | −0.114 | 0.065 | −1.426 | 20.819 | 0.000 | 2 × 10⁴ | −39.349 *** | 0.509 *** |
| BL Equities | 4 | 1499 | 0.0003 | 0.01 | −0.088 | 0.059 | −0.788 | 10.182 | 0.000 | 3377 | −39.311 *** | 0.533 *** |
| BMO | 4 | 1499 | 0.0001 | 0.011 | −0.104 | 0.059 | −1.134 | 12.603 | 0.000 | 6081 | −38.054 *** | 0.528 *** |
| Janus | 4 | 1094 | 0.0002 | 0.012 | −0.126 | 0.083 | −2.335 | 34.553 | 0.000 | 4.6 × 10⁴ | −40.023 *** | 0.002 *** |
| New Capital | 4 | 795 | 0.0001 | 0.010 | −0.109 | 0.065 | −1.865 | 23.748 | 0.000 | 1.5 × 10⁴ | −28.253 *** | 0.911 *** |
| GAM Equity | 4 | 1499 | 0.0002 | 0.011 | −0.108 | 0.085 | −1.065 | 14.794 | 0.000 | 8970 | −38.194 *** | 0.625 *** |
| Comgest Growth | 5 | 1499 | 0.0003 | 0.01 | −0.085 | 0.065 | −0.685 | 10.257 | 0.000 | 3407 | −37.62 *** | 0.284 *** |
| Echiquier Major | 5 | 1499 | 0.0003 | 0.010 | −0.106 | 0.079 | −1.01 | 14.617 | 0.000 | 8684 | −30.079 *** | 0.689 *** |
| Fidelity Active Strategy | 5 | 1499 | 0.0003 | 0.011 | −0.09 | 0.067 | −0.828 | 10.975 | 0.000 | 4144 | −38.511 *** | 0.863 *** |
| Sailern Int. Eur | 5 | 1499 | 0.0003 | 0.009 | −0.072 | 0.063 | −0.546 | 9.055 | 0.000 | 2365 | −38.361 *** | 0.75 *** |
| Black Rock Eur focus | 5 | 1499 | 0.0001 | 0.011 | −0.091 | 0.067 | −0.855 | 12.715 | 0.000 | 6078 | −39.009 *** | 0.741 *** |
| Pictec | 5 | 1499 | 0.0002 | 0.01 | −0.094 | 0.049 | −1.153 | 13.599 | 0.000 | 7349 | −38.19 *** | 0.622 *** |
| MSCI Europe | 1499 | 0.0002 | 0.011 | −0.119 | 0.077 | −1.34 | 18.92 | 0.000 | 1.6 × 10⁴ | −38.8 *** | 0.912 *** |
| Funds | Obs. | ESG Rating | Mean | SD | Min. | Max. | Skewness | Kurtosis | |||||||
|---|---|---|---|---|---|---|---|---|---|---|---|---|---|---|---|
| Before | Post | Before | Post | Before | Post | Before | Post | Before | Post | Before | Post | Before | Post | ||
| BNP Europe Value | 1340 | 159 | 1 | 0.0001 | −0.002 | 0.011 | 0.024 | −0.079 | −0.137 | 0.047 | 0.09 | −0.552 | −1.305 | 7.72 | 10.6 |
| Odey Pan EUR | 1340 | 159 | 1 | 0.0000 | −0.001 | 0.008 | 0.011 | −0.051 | −0.076 | 0.038 | 0.053 | −0.424 | −1.187 | 6.684 | 8.055 |
| Capital Group | 1340 | 159 | 2 | 0.0003 | −0.001 | 0.009 | 0.021 | −0.078 | −0.12 | 0.048 | 0.081 | −0.799 | −1.29 | 11.202 | 10.31 |
| Candriam Equities | 1340 | 159 | 2 | 0.0002 | −0.001 | 0.009 | 0.024 | −0.057 | −0.138 | 0.039 | 0.087 | −0.287 | −1.39 | 6.837 | 11.06 |
| Anima | 1340 | 159 | 2 | 0.0002 | −0.0008 | 0.009 | 0.019 | −0.076 | −0.113 | 0.043 | 0.072 | −0.59 | −1.43 | 8.28 | 11.66 |
| Amundi Index MSCI EUR | 1340 | 159 | 2 | 0.0003 | −0.001 | 0.009 | 0.022 | −0.056 | −0.125 | 0.041 | 0.082 | −0.433 | −1.308 | 6.849 | 10.63 |
| Amundi Funds Top EUR | 1340 | 159 | 2 | 0.0002 | −0.001 | 0.009 | 0.022 | −0.061 | −0.126 | 0.043 | 0.081 | −0.442 | −1.328 | 6.703 | 10.47 |
| Allianz | 1340 | 159 | 2 | 0.0003 | −0.0011 | 0.009 | 0.021 | −0.057 | −0.103 | 0.044 | 0.067 | −0.633 | −1.213 | 7.686 | 8.882 |
| Amundi AZ | 1340 | 159 | 2 | 0.0002 | −0.0012 | 0.009 | 0.022 | −0.081 | −0.129 | 0.039 | 0.076 | −0.706 | −1.444 | 9.09 | 10.57 |
| Amundi SF | 1340 | 159 | 2 | 0.0002 | −0.0012 | 0.009 | 0.022 | −0.064 | −0.127 | 0.041 | 0.075 | −0.54 | −1.45 | 7.102 | 10.52 |
| BNP Europe Equity | 1340 | 159 | 3 | 0.0002 | −0.0005 | 0.009 | 0.021 | −0.055 | −0.117 | 0.039 | 0.068 | −0.347 | −1.42 | 5.924 | 9.804 |
| GAM Star | 1340 | 159 | 3 | 0.0003 | −0.0002 | 0.009 | 0.02 | −0.075 | −0.107 | 0.038 | 0.083 | −0.665 | −0.91 | 7.644 | 9.746 |
| Candriam L. C | 1340 | 159 | 3 | 0.0004 | 0.0004 | 0.009 | 0.017 | −0.046 | −0.097 | 0.043 | 0.055 | −0.261 | −1.377 | 5.565 | 9.49 |
| Candriam L. N | 1340 | 159 | 3 | 0.0004 | 0.0003 | 0.009 | 0.017 | −0.046 | −0.097 | 0.043 | 0.055 | −0.261 | −1.37 | 5.566 | 9.49 |
| CPR Silver age | 1139 | 159 | 3 | 0.0002 | −0.001 | 0.008 | 0.019 | −0.052 | −0.115 | 0.032 | 0.071 | −0.55 | −1.495 | 6.75 | 11.8 |
| Azimut | 1340 | 159 | 3 | 0.0002 | −0.0013 | 0.009 | 0.023 | −0.078 | −0.138 | 0.035 | 0.085 | −0.733 | −1.477 | 9.469 | 12.11 |
| DPAM | 1340 | 159 | 3 | 0.0004 | −0.0002 | 0.009 | 0.019 | −0.062 | −0.115 | 0.043 | 0.075 | −0.455 | −1.24 | 6.684 | 10.48 |
| BNP Action Croissance | 1340 | 159 | 4 | 0.0004 | −0.0003 | 0.009 | 0.017 | −0.087 | −0.078 | 0.049 | 0.066 | −1.21 | −0.77 | 14.455 | 7.145 |
| Candriam optimum | 1340 | 159 | 4 | 0.0003 | −0.0004 | 0.008 | 0.018 | −0.047 | −0.114 | 0.038 | 0.065 | −0.281 | −1.816 | 7.067 | 13.96 |
| BL Equities | 1340 | 159 | 4 | 0.0003 | −0.0002 | 0.008 | 0.016 | −0.045 | −0.088 | 0.039 | 0.059 | −0.335 | −1.125 | 5.27 | 8.87 |
| BMO | 1340 | 159 | 4 | 0.0002 | −0.0004 | 0.009 | 0.018 | −0.06 | −0.104 | 0.040 | 0.058 | −0.617 | −1.355 | 7.077 | 9.52 |
| Janus | 935 | 159 | 4 | 0.0004 | −0.001 | 0.007 | 0.026 | −0.041 | −0.126 | 0.030 | 0.083 | −0.59 | −1.362 | 5.333 | 10.13 |
| New Capital | 636 | 159 | 4 | 0.0003 | −0.0007 | 0.006 | 0.019 | −0.03 | −0.109 | 0.024 | 0.065 | −0.418 | −1.37 | 5.157 | 10.34 |
| GAM Equity | 1340 | 159 | 4 | 0.0003 | −0.0002 | 0.009 | 0.02 | −0.086 | −0.108 | 0.042 | 0.085 | −0.818 | −0.942 | 9.59 | 9.29 |
| Comgest Growth | 1340 | 159 | 5 | 0.0004 | −0.0004 | 0.008 | 0.016 | −0.043 | −0.085 | 0.036 | 0.065 | −0.345 | −0.831 | 5.258 | 8.42 |
| Echiquier Major | 1340 | 159 | 5 | 0.0004 | −0.0004 | 0.009 | 0.019 | −0.047 | −0.106 | 0.033 | 0.078 | −0.493 | −1.033 | 5.742 | 9.64 |
| Fidelity Active Strategy | 1340 | 159 | 5 | 0.0004 | −0.0004 | 0.009 | 0.018 | −0.079 | −0.09 | 0.034 | 0.067 | −0.64 | −0.724 | 8.58 | 6.718 |
| Sailern Int. Eur | 1340 | 159 | 5 | 0.0004 | −0.0001 | 0.008 | 0.015 | −0.048 | −0.072 | 0.038 | 0.063 | −0.332 | −0.714 | 6.27 | 7.63 |
| Black Rock Eur focus | 1340 | 159 | 5 | 0.0002 | −0.0001 | 0.009 | 0.021 | −0.084 | −0.091 | 0.056 | 0.068 | −0.629 | −0.763 | 10.742 | 6.51 |
| Pictec | 1340 | 159 | 5 | 0.0003 | −0.0009 | 0.008 | 0.018 | −0.062 | −0.094 | 0.036 | 0.05 | −0.52 | −1.19 | 7.99 | 7.945 |
| MSCI Europe | 1340 | 159 | 0.0003 | −0.0009 | 0.009 | 0.021 | −0.053 | −0.119 | 0.037 | 0.077 | −0.42 | −1.35 | 6.407 | 10.74 | |
| Funds | ESG Rating | All Sample | Before COVID-19 | Post COVID-19 | |||
|---|---|---|---|---|---|---|---|
| BNP Europe Value | 1 | 0.158 *** | 0.884 *** | 0.165 *** | 0.874 *** | 0.072 | 0.931 *** |
| Odey Pan EUR | 1 | 0.161 *** | 0.875 *** | 0.175 *** | 0.859 *** | 0.068 * | 0.932 *** |
| Capital Group | 2 | 0.237 *** | 0.828 *** | 0.25 *** | 0.808 *** | 0.129 | 0.885 *** |
| Candriam Equities | 2 | 0.174 *** | 0.879 *** | 0.192 *** | 0.863 *** | 0.067 | 0.93 *** |
| Anima | 2 | 0.2 *** | 0.849 *** | 0.223 *** | 0.825 *** | 0.089 | 0.892 *** |
| Amundi Index MSCI EUR | 2 | 0.205 *** | 0.852 *** | 0.227 *** | 0.828 *** | 0.09 | 0.912 *** |
| Amundi Funds Top EUR | 2 | 0.192 *** | 0.857 *** | 0.208 *** | 0.833 *** | 0.1 | 0.904 *** |
| Allianz | 2 | 0.141 *** | 0.886 *** | 0.119 *** | 0.903 *** | 0.182 * | 0.815 *** |
| Amundi AZ | 2 | 0.223 *** | 0.844 *** | 0.252 *** | 0.816 *** | 0.083 | 0.915 *** |
| Amundi SF | 2 | 0.215 *** | 0.853 *** | 0.238 *** | 0.831 *** | 0.088 | 0.912 *** |
| BNP Europe Equity | 3 | 0.236 *** | 0.822 *** | 0.259 *** | 0.791 *** | 0.128 | 0.879 ** |
| GAM Star | 3 | 0.182 *** | 0.865 *** | 0.203 *** | 0.844 *** | 0.108 | 0.885 *** |
| Candriam L. C | 3 | 0.178 *** | 0.876 *** | 0.184 *** | 0.871 *** | 0.123 | 0.877 *** |
| Candriam L. N | 3 | 0.178 *** | 0.876 *** | 0.185 *** | 0.871 *** | 0.123 | 0.877 *** |
| CPR Silver Age | 3 | 0.207 *** | 0.835 *** | 0.246 *** | 0.779 *** | 0.094 | 0.904 *** |
| Azimut | 3 | 0.229 *** | 0.839 *** | 0.254 *** | 0.814 *** | 0.091 | 0.907 *** |
| DPAM | 3 | 0.209 *** | 0.849 *** | 0.248 *** | 0.816 *** | 0.093 | 0.909 *** |
| BNP Action Croissance | 4 | 0.118 *** | 0.882 *** | 0.898 *** | 0.884 *** | 0.177 | 0.861 *** |
| Candriam optimum | 4 | 0.187 *** | 0.871 *** | 0.186 *** | 0.872 *** | 0.106 | 0.89 *** |
| BL Equities | 4 | 0.18 *** | 0.873 *** | 0.186 *** | 0.865 *** | 0.129 | 0.874 *** |
| BMO | 4 | 0.198 *** | 0.848 *** | 0.221 *** | 0.817 *** | 0.114 | 0.888 *** |
| Janus | 4 | 0.182 *** | 0.852 *** | 0.153 *** | 0.845 *** | 0.222 * | 0.827 *** |
| New Capital | 4 | 0.268 *** | 0.783 *** | 0.292 *** | 0.678 *** | 0.146 | 0.862 *** |
| GAM Equity | 4 | 0.193 *** | 0.856 *** | 0.209 *** | 0.838 *** | 0.131 | 0.866 *** |
| Comgest Growth | 5 | 0.157 *** | 0.886 *** | 0.152 *** | 0.889 *** | 0.139 | 0.867 *** |
| Echiquier Major | 5 | 0.225 *** | 0.839 *** | 0.242 *** | 0.819 *** | 0.149 | 0.871 *** |
| Fidelity Active Strategy | 5 | 0.218 *** | 0.848 *** | 0.24 *** | 0.818 *** | 0.125 | 0.892 *** |
| Sailern International Eur | 5 | 0.139 *** | 0.891 *** | 0.134 *** | 0.892 *** | 0.119 | 0.88 *** |
| Black Rock Eur focus | 5 | 0.229 *** | 0.825 *** | 0.251 *** | 0.796 *** | 0.167 * | 0.856 *** |
| Pictec | 5 | 0.187 *** | 0.86 *** | 0.203 *** | 0.842 *** | 0.128 * | 0.878 *** |
| MSCI Europe | 0.245 *** | 0.826 *** | 0.284 *** | 0.789 *** | 0.99 | 0.918 *** | |
| Fuds | ESG Rating | All Sample | Post 20 February 2020 | ||||
|---|---|---|---|---|---|---|---|
| BNP Europe Value | 1 | 0.229 *** | 0.903 *** | −0.228 *** | −0.401 *** | 0.044 | −0.092 * |
| Odey Pan EUR | 1 | 0.167 *** | 0.908 *** | −0.108 *** | −0.080 | 0.099 | 0.442 * |
| Capital Group | 2 | 0.255 *** | 0.882 *** | −0.238 *** | −0.511 *** | 0.395 *** | −0.233 *** |
| Candriam Equities | 2 | 0.219 *** | 0.906 *** | −0.203 *** | −0.525 *** | −0.065 | 0.015 |
| Anima | 2 | 0.247 *** | 0.888 *** | −0.235 *** | −0.322 *** | 0.369 * | 0.432 ** |
| Amundi Index MSCI Eur | 2 | 0.24 *** | 0.897 *** | −0.236 *** | −0.431 *** | 0.045 | −0.080 |
| Amundi Funds Top Eur | 2 | 0.238 *** | 0.894 *** | −0.234 *** | −0.424 *** | 0.038 | −0.095 * |
| Allianz | 2 | 0.189 *** | 0.920 *** | −0.201 *** | |||
| Amundi AZ | 2 | 0.251 *** | 0.889 *** | −0.237 *** | −0.334 *** | 0.253 | −0.431 ** |
| Amundi SF | 2 | 0.24 *** | 0.897 *** | −0.225 *** | −0.433 *** | −0.029 | −0.118 ** |
| BNP Europe Equity | 3 | 0.268 *** | 0.872 *** | −0.264 *** | −0.466 *** | −0.020 | −0.148 *** |
| GAM Star | 3 | −0.223 *** | 0.891 *** | −0.196 *** | −0.504 *** | 0.182 | 0.042 |
| Candriam L. C | 3 | 0.219 *** | 0.895 *** | −0.202 *** | −0.520 *** | 0.260 *** | −0.328 *** |
| Candriam L. N | 3 | 0.22 *** | 0.895 *** | −0.212 *** | −0.520 *** | 0.232 *** | −0.329 *** |
| CPR Silver Age | 3 | 0.259 *** | 0.880 *** | −0.283 *** | −0.407 *** | 0.128 | −0.073 |
| Azimut | 3 | 0.245 *** | 0.902 *** | −0.248 *** | −0.429 *** | 0.005 | −0.074 |
| DPAM | 3 | 0.244 *** | 0.897 *** | −0.249 *** | −0.630 *** | 0.030 | 0.023 |
| BNP Action Croissance | 4 | 0.207 *** | 0.903 *** | −0.232 *** | 0.226 | −0.330 * | −0.553 *** |
| Candriam optimum | 4 | 0.239 *** | 0.892 *** | −0.211 *** | −0.603 *** | 0.334 *** | −0.299 *** |
| BL Equities | 4 | 0.220 *** | 0.894 *** | −0.214 *** | 0.102 | −0.150 | −0.538 *** |
| BMO | 4 | 0.233 *** | 0.891 *** | −0.228 *** | 0.471 *** | 0.114 | −0.196 *** |
| Janus | 4 | 0.208 *** | 0.897 *** | −0.188 *** | 0.218 *** | 0.459 *** | −0.805 *** |
| New Capital | 4 | 0.29 *** | 0.851 *** | −0.238 *** | |||
| GAM Equity | 4 | 0.235 *** | 0.884 *** | −0.202 *** | |||
| Comgest Growth | 5 | 0.211 *** | 0.896 *** | −0.189 *** | −0.679 *** | 0.002 | 0.157 *** |
| Echiquier Major | 5 | 0.252 *** | 0.877 *** | −0.237 *** | 0.258 | 0.036 | −0.639 *** |
| Fidelity Active Strategy | 5 | 0.259 *** | 0.871 *** | −0.224 *** | −0.741 *** | 0.418 *** | −0.231 *** |
| Sailern International Eur | 5 | 0.204 *** | 0.896 *** | −0.186 *** | −0.351 *** | −0.119 | −0.229 * |
| Black Rock Eur focus | 5 | 0.251 *** | 0.878 *** | −0.224 *** | |||
| Pictec | 5 | 0.222 *** | 0.9 *** | −0.216 *** | |||
| MSCI Europe | 0.265 *** | 0.898 *** | −0.293 *** | −0.444 *** | −0.034 | −0.102 * | |
| Funds | ESG Rating | Before | Post COVID-19 | |||||
|---|---|---|---|---|---|---|---|---|
| Dynamic Conditional Correlational | Dynamic Conditional Correlational | Constant Conditional Correlation | ||||||
| BNP Europe Value | 1 | 0.918 *** | 0.050 *** | 0.937 *** | 0.956 *** | |||
| Odey Pan EUR | 1 | 0.628 *** | 0.047 *** | 0.941 *** | 0.786 *** | 0.210 | 0.035 | 0.758 *** |
| Capital Group | 2 | 0.902 *** | 0.044 *** | 0.948 *** | 0.967 *** | |||
| Candriam Equities | 2 | 0.934 *** | 0.070 *** | 0.901 *** | 0.964 *** | 0.151 *** | 0.798 *** | 0.962 *** |
| Anima | 2 | 0.956 *** | 0.117 *** | 0.806 *** | 0.977 *** | 0.266 *** | 0.009 | 0.976 *** |
| Amundi Index MSCI Eur | 2 | 0.971 *** | 0.151 *** | 0.745 *** | 0.989 *** | 0.404 *** | 0.393 ** | 0.986 *** |
| Amundi Funds Top Eur | 2 | 0.945 *** | 0.050 *** | 0.926 *** | 0.977 *** | |||
| Allianz | 2 | 0.555 *** | 0.041 *** | 0.858 *** | 0.593 *** | |||
| Amundi AZ | 2 | 0.959 *** | 0.097 *** | 0.841 *** | 0.986 *** | 0.113 | 0.067 | 0.985 *** |
| Amundi SF | 2 | 0.957 *** | 0.088 *** | 0.851 *** | 0.984 *** | 0.131 | 0.371 | 0.984 *** |
| BNP Europe Equity | 3 | 0.863 *** | 0.111 *** | 0.819 *** | 0.943 *** | 0.261 | 0.591 * | 0.946 *** |
| GAM Star | 3 | 0.923 *** | 0.083 *** | 0.840 *** | 0.953 *** | 0.083 | 0.761 *** | 0.949 *** |
| Candriam L. C | 3 | 0.886 *** | 0.063 *** | 0.935 *** | 0.917 *** | 0.159 | 0.481* | 0.912 *** |
| Candriam L. N | 3 | 0.885 *** | 0.053 *** | 0.927 *** | 0.918 *** | 0.160 | 0.480 * | 0.922 *** |
| CPR Silver Age | 3 | 0.896 *** | 0.063 *** | 0.878 *** | 0.958 *** | |||
| Azimut | 3 | 0.964 *** | 0.113 *** | 0.818 *** | 0.987 *** | |||
| DPAM | 3 | 0.948 *** | 0.092 *** | 0.873 *** | 0.963 *** | |||
| BNP Action Croissance | 4 | 0.748 *** | 0.078 *** | 0.789 *** | 0.888 *** | 0.244 * | 0.157 | 0.877 *** |
| Candriam optimum | 4 | 0.866 *** | 0.062 *** | 0.922 *** | 0.952 *** | |||
| BL Equities | 4 | 0.884 *** | 0.067 *** | 0.914 *** | 0.911 *** | 0.085 ** | 0.890 *** | 0.922 *** |
| BMO | 4 | 0.925 *** | 0.0419 *** | 0.941 *** | 0.937 *** | 0.043 | 0.899 *** | 0.949 *** |
| Janus | 4 | 0.858 *** | 0.092 * | 0.073 | 0.844 *** | |||
| New Capital | 4 | 0.899 *** | 0.284 *** | 0.057 | 0.960 *** | 0.183 ** | 0.425 * | 0.955 *** |
| GAM Equity | 4 | 0.919 *** | 0.085 ** | 0.786 *** | 0.934 *** | 0.126 | 0.082 | 0.934 *** |
| Comgest Growth | 5 | 0.851 *** | 0.082 *** | 0.876 *** | 0.916 *** | 0.248 ** | 0.024 | 0.915 *** |
| Echiquier Major | 5 | 0.883 *** | 0.052 *** | 0.931 *** | 0.935 *** | 0.045 | 0.895 *** | 0.945 *** |
| Fidelity Active Strategy | 5 | 0.892 *** | 0.054 *** | 0.931 *** | 0.927 *** | |||
| Sailern International Eur | 5 | 0.828 *** | 0.051 *** | 0.929 *** | 0.866 *** | |||
| Black Rock Eur focus | 5 | 0.793 *** | 0.039 | 0.862 *** | 0.788 *** | |||
| Pictec | 5 | 0.483 | 0.041 *** | 0.958 *** | 0.816 *** | 0.021 | 0.435 | 0.816 *** |
| Funds | ESG Rating | CAAR [−3, 3] | CAAR [−5, 5] |
|---|---|---|---|
| BNP Europe Value | 1 | −6.91% ** | −10.99% *** |
| Odey Pan EUR | 1 | −2.93% | −3.74% |
| Capital Group | 2 | −6.58% *** | −10.23% *** |
| Candriam Equities | 2 | −5.88% ** | −10.11% *** |
| Anima | 2 | −6.33% ** | −10.56% *** |
| Amundi Index MSCI EUR | 2 | −6.61% *** | −10.62% *** |
| Amundi Funds Top EUR | 2 | −6.19% ** | −10.65% *** |
| Allianz | 2 | −5.27% ** | −7.93% *** |
| Amundi AZ | 2 | −6.45% ** | −10.84% *** |
| Amundi SF | 2 | −6.65% *** | −11.09% *** |
| BNP Europe Equity | 3 | −5.41% ** | −9.00% *** |
| GAM Star | 3 | −6.67% *** | −10.47% *** |
| Candriam L. C | 3 | −4.29% * | −8.44% *** |
| Candriam L. N | 3 | −4.29% * | −8.45% *** |
| CPR Silver Age | 3 | −5.38% ** | −9.53% *** |
| Azimut | 3 | −6.41% *** | −9.93% *** |
| DPAM | 3 | −4.50% * | −8.52% *** |
| BNP Action Croissance | 4 | −3.98% * | −7.71% ** |
| Candriam optimum | 4 | −3.62% * | −7.07% *** |
| BL Equities | 4 | −5.27% ** | −8.59% *** |
| BMO | 4 | −5.41% ** | −8.99% *** |
| Janus | 4 | −7.30% *** | −11.32% *** |
| New Capital | 4 | −5.53% *** | −9.01% *** |
| GAM Equity | 4 | −5.88% ** | −10.29% *** |
| Comgest Growth | 5 | −5.96% *** | −9.01% *** |
| Echiquier Major | 5 | −4.96% ** | −8.43% *** |
| Fidelity Active Strategy | 5 | −4.15% * | −7.07% ** |
| Sailern International Eur | 5 | −5.24% ** | −8.03% *** |
| Black Rock Eur focus | 5 | −4.50% * | −8.84% *** |
| Pictec | 5 | −4.08% * | −8.48% *** |
Publisher’s Note: MDPI stays neutral with regard to jurisdictional claims in published maps and institutional affiliations. |
© 2021 by the authors. Licensee MDPI, Basel, Switzerland. This article is an open access article distributed under the terms and conditions of the Creative Commons Attribution (CC BY) license (https://creativecommons.org/licenses/by/4.0/).
Share and Cite
Pisani, F.; Russo, G. Sustainable Finance and COVID-19: The Reaction of ESG Funds to the 2020 Crisis. Sustainability 2021, 13, 13253. https://doi.org/10.3390/su132313253
Pisani F, Russo G. Sustainable Finance and COVID-19: The Reaction of ESG Funds to the 2020 Crisis. Sustainability. 2021; 13(23):13253. https://doi.org/10.3390/su132313253
Chicago/Turabian StylePisani, Fabio, and Giorgia Russo. 2021. "Sustainable Finance and COVID-19: The Reaction of ESG Funds to the 2020 Crisis" Sustainability 13, no. 23: 13253. https://doi.org/10.3390/su132313253
APA StylePisani, F., & Russo, G. (2021). Sustainable Finance and COVID-19: The Reaction of ESG Funds to the 2020 Crisis. Sustainability, 13(23), 13253. https://doi.org/10.3390/su132313253