1. Introduction
Lead (Pb) is a highly toxic, bioaccumulative substance that can cause adverse effects in humans. Although ideally zero, the permissible blood serum Pb level for a child is 5
g dL
−1 [
1] and values higher than this have been associated with hearing loss, lowered intelligence, aggression, and violent behaviour [
2], while acute exposure can result in organ failure and death. Although Pb products like leaded paint and petrol have largely been phased out in most of the world [
3], contamination still arises from industries such as mining and battery processing plants. In South Africa human exposure is often associated with informal industries like illegal gold mining, battery salvaging, and the use of Pb sinkers for subsistence fishing [
4].
Because Pb tends to accumulate in living organisms, organisations such as the United States Environmental Protection Agency (EPA) suggest that the permissible Pb in industrial effluent should be zero [
5]. Pb water treatment usually falls into one of the following categories: adsorption, electrodialysis, precipitation, membrane filtration, evaporation, and ion exchange [
6]. Industrial water treatment commonly utilises carbonate or hydroxide treatment because the Pb can be recovered through filtration, but this method is expensive and requires long retention times [
7]. More recently new techniques have been developed whereby remediation is carried out via biologically active compounds.
The main forms of bioremediation are biosorption, bioaccumulation, and phytoremediation [
8]. Bioremediation is often less expensive, less water-intensive, and there is less sludge runoff [
9]. In addition to this, bioremediation can be applied to small scale remediation efforts with low startup costs [
10]. Examples of bioremediation for Pb treatment can be found in plants, such as
Tinospora cordifolia with Pb adsorption of up to 63.77 mg g
−1 in an hour [
10]; or moss, like
Stereophyllum radiculosum with with Pb adsorption of up to 12.5 mg g
−1 in 50 min [
11]; and even fungi.
Mycoremediation is the term given for bioremediation which utilises fungi. Fungi produce a myriad of metabolites, which, along with their ease of propagation, make for good remediators. Mycoremediation can take place through a variety of mechanisms including physical absorption due to the filamentous nature of mycelium. However studies exploring heavy metal remediation have identified adsorption, a hyphae surface phenomenon involving ion-exchange, as the primary remediation mechanism for fungi, and specifically for the
Aspergillus genus [
12,
13,
14,
15,
16]. Factors affecting fungal adsorption are pH, metal-ion to biomass ratio, cell-wall fraction, presence of ligands, and temperature to a lesser extent [
17,
18]. Fungi also perform well when compared to commercial heavy metal treatment like ion-exchange resins, activated carbon, and metal oxides, and the biomass can often be recovered after desorption [
19,
20]. Mycoremediation for Pb can come in the form of mushrooms, such as
Lepiota hystrix demonstrated Pb adsorption of up to 8.90 mg g
−1 in 40 min [
21], and molds [
22].
The prolific mold genus,
Aspergillus, is well-studied and widely used in industries such as citric acid production [
12]. Recently this genus has proved capable of Pb remediation experimentally [
13]:
A. Fumigatus demonstrated Pb adsorption capacity of up to 43.7 mg Pb(II) per g
−1 while
A. versicolour adsorbed to 45.0 mg g
−1 in three hours [
14], and
A. parasiticus adsorbed 83.3 mg g
−1 in 70 min [
15], to name but a few.
To add to the corpus of Pb remediating
Aspergillus species, this study considers a relatively understudied fungus,
Aspergillus piperis. This fungus, from the
Aspergillus nigri clade of mold, was isolated in a laboratory at the University of Pretoria and has shown high heavy metal tolerances and potential for Pb mycoremediation applications [
23]. As remediation efforts move towards more environmentally friendly and sustainable practices, it is important to consider every potential biological candidate for such industrial applications. At the time of this publication, the authors are not aware of any studies that have assessed the Pb(II) remediation properties of this fungus. To fill this gap in knowledge, the mycoremediation potential of
A. piperis is studied and optimised by testing propagation and remediation capacity properties. These results are then compared to those of other species of the
Aspergillus genus.
2. Materials and Methods
2.1. Chemicals and Solution Preparation
All chemicals are manufactured by Sigma Aldrich unless otherwise stated. Potato dextrose agar (PDA) was prepared per manufacturer instructions while a tryptic soy broth (TSB) was made using 10 g L−1 vegetable peptone, 10 g L−1 D(-)-glucose, 2.5 g L−1 NaCl, and 1.25 g L−1 K2HPO4, autoclaved and allowed to cool.
Pb(II) stock solution was prepared by dissolving 799.2 mg Pb(NO3)2 in half a litre of distilled water to create 1000 mg L−1 stock solution. The stock solution Pb(II) ion concentration was confirmed using a Perkin Elmer AA400 atomic absorbance spectrophotometer (AA) (Perkin Elmer, Waltham, MA, USA).
2.2. Fungal Growth Conditions and Biomass Propagation
Before starting, a fungal specimen was sent to Inqaba Biotechnical Industries (Pty) Ltd for DNA extraction, PCR amplification, and sequencing to confirm the species. By isolating the calmodulin gene a positive identification of
A. piperis was made. To establish ideal growth conditions, the previously isolated fungus was plated and inoculated to create a spore stock solution as described in de Wet et al. [
23]. The minimum inhibitory concentration from the 2020 study [
23] informed the Pb(II) concentration ranges selected, thus triplicate PDA plates with varying Pb(II) and pH ranges, as well as three control plates with PDA (already at a pH of 5.6 and with no Pb(II)), were prepared. For the acidic media, 0.1 M HNO
3 was added to 100 mL PDA in volumes of 0.01, 0.1 and 1 mL to create a pH of 5, 4, and 3, respectively. They were then shaken vigorously before being distributed to plates. The solution pH was then measured using an Ohaus Starter 3000 pH and temperature probe just before the PDA had cooled down enough to solidify. Similarly the 1000 mg L
−1 Pb(NO
3)
2 stock solution was administered to another batch of 100 mL PDA flasks in volumes of 0.5, 1, and 2.5 mL to create Pb(II) concentrations of 50, 100, and 250 mg L
−1, respectively. 2 mL Pb(II)-infused PDA was retained and diluted 100 times in distilled water before it could set so that the samples could be analysed using the AA to confirm the Pb(II) concentration.
Once the PDA had set, a 0.1 mL pipette tip was used to transfer a 0.2 mm diameter circle of spores to the centre of each plate. The plates were then incubated at 35 C and the distance from the centre, where the spores appear as a minute black dot, to the edge of the mycelium was measured daily to get radial growth estimates. All plates, including controls, were produced in triplicates.
To study the effects of pH, Pb(II), and growth medium, 1 mL of spore solution was used to inoculate 100 mL bioreactors containing TSB in batches of six reactors. The reactors were incubated at 35 C and 135 rpm for three days. The mycelium was then drained, rinsed with distilled water, and dried for four hours at 60 C before being weighed.
For adsorption studies, enough of the biomass (mycelium) needed to be propagated for several experimental runs. To do so, ten 100 mL Erlenmeyer flasks were inoculated and incubated for three days as described above producing on average 4.45 g wet mycelium, or 0.0907 g dry mycelium per 100 mL bioreactor. This averaged out at roughly 1 g dry biomass per litre of tryptic soy broth (TSB). The wet mycelium was then adsorbed from solution using a tea sieve and rinsed with distilled water. Thereafter the mycelium was either used immediately, or dried in an oven at 60 C for four hours.
To compare mycelium grown in the presence and absence of Pb(II), the same method was used to create Pb(II) bioreactors, however 5 mL of 1000 mg L−1 Pb(II) nitrate stock solution was added to create a 50 mg L−1 Pb(II) medium. After incubation the mycelium was washed and placed in 0.1 M HNO3 for three hours to remove any Pb(II) sequestered by the mycelium. Thereafter the mycelium was once again washed and dried.
2.3. Adsorption Conditions
2.3.1. Fractional Factorial Experimental Design
The purpose of this experimental design is to optimize the average response value (% Pb(II) removal) and minimise effects of random variability which is present in most processes [
24]. Procedures like one factor at a time neglects factor interactions such as the combined effects of pH and temperature on Pb(II) adsorption. An alternative approach is to consider all combinations of factors at various levels. Factors studied here are: Pb(II) ion concentration, temperature, pH, and biomass preparation. Each factor has a particular set of levels, or variable values such as a pH of 2, 3, or 4. Attempting to combine all factors at all levels would lead to an exponential amount of samples. For example, to test all interactions between all four factors, each with three levels, would require 3
4 = 81 trials per experimental run, moreso if the trials are to be done in triplicates. Limiting levels to two at a time (such as only considering a pH of 2 and 3) significantly reduces the number of trials (2
3 = 8) and allows for finding optimal conditions using an iterative approach and then applying statistical analysis to assess which factors had the largest effect on the response value and estimate how the factors interacted with each other.
Using a two-level fractional factorial design approach [
24], the runs were broken up into two sets of trials, allowing for all four factor interactions to be explored at four levels and requiring only 16 trials. The 16 trials were broken up into two blocks of eight trials, each of which were done in triplicates. Along with the control samples, each experimental block thus had 27 trials. After every run statistical analysis was applied to the results to determine the level values for the subsequent run. Each trial has a unique combination of levels for each factor, and when the difference between level averages for each factor is calculated, the highest-scoring factors or factor interactions will be the ones with the strongest effect on Pb(II) adsorption. This way the experimental results will quickly converge to an optimised combination of pH, temperature, Pb(II) concentration, and biomass preparation for maximum adsorption.
The level selection was carefully considered: If the range is too wide, much more iteration is required and if the range is too narrow an optimal level may be missed. The selected starting level for Pb(II) concentration was based on reasonable expectations drawn from the fungal studies referred to earlier (see
Section 1: Introduction), while the pH and temperature values were selected based on practical considerations such as the fungal thermal threshold and Pb(II) solubility limits. pH was expected to play a large role in the adsorption as it can affect the metal speciation, sequestration, or mobility. The maximum pH considered was 5 to avoid precipitation effects from Pb(II) hydrolysis which is expected to occur at a pH higher than 6.3 for Pb(NO
3)
2.
To control for variability in biomass water retention, all biomass used in adsorption was dried and preparation fell into two categories: Mycelium grown in the absence of Pb(II), and that grown in 50 mg L
−1 Pb(II) ions, and then submerged in 500 mL 0.1 M nitric acid to remove the Pb(II) from the active sites. The hypothesis was that biomass grown in the presence of Pb(II) could express specific adsorption sites/surface characteristics with elevated Pb(II) removal characteristics as a defense mechanism.
Table 1 displays the levels for the initial run, and based on the outcome thereof, levels for subsequent runs were selected to gain more resolution.
2.3.2. Pb(II) Adsorption Profile
To study the adsorption profile of the mycelium, 0.1 g dried mycelium was added to 50 mL prepared solution in 100 mL vials. With a constant biomass of 10 g L−1 (dry), the solution Pb(II) concentration, temperature, and pH varied according to the experimental design. The samples were then incubated at 100 rpm for two hours in a submerged shaker and then centrifuged to remove the biomass while the supernatant was passed through a 0.45 m filter and kept for AA analysis.
The results of the AA were interpreted using Equation (
1):
where
refers to the amount of Pb(II) ions adsorbed by the biomass in mg g
−1,
and
are the initial and final Pb(II) ion concentrations in mg L
−1,
V refers to the solution volume in L, and
W is the biomass weight in grams. The experimental conditions resulting in the highest adsorption were selected for further runs.
2.3.3. Regeneration of Biomass (Desorption)
To see whether it was possible to regenerate the mycelium, post-adsorbed biomass was added to a 500 mL solution of 0.1 M HNO3, left for 3 h, and centrifuged after which the HNO3 was analysed using AA.
2.4. Adsorption Characterisation: Isotherm Studies
Equilibrium adsorption isotherm experiments were carried out at 30 C over a period of 24 h for initial concentrations of 100, 500, 1500, and 2000 mg L−1.
2.4.1. One and Two-Surface Langmuir Isotherm Models
Langmuir isotherm models were considered for this study and using least squares regression, an isotherm was fit to Equation (
2):
Here refers to the maximum saturated monolayer adsorption capacity in mg g−1, while is the Langmuir equilibrium constant in L mg−1 and is the Pb(II) equilibrium concentration in mg L−1.
Another approach considered is the two-surface Langmuir model, where it is assumed that adsorption takes place on two types of surfaces. Equation (
3) describes this:
Here the two surface type properties are indicated with subscripts.
2.4.2. Freundlich Isotherm Model
To study the reversible, non-ideal, multilayer adsorption, the Freundlich isotherm was used, described in Equation (
4):
In this case, is the Freundlich constant with units of (mg/g)(mg/L)−, where the isotherm is favourable when < 1, linear when = 1, and unfavourable when ≥ 1.
2.5. Adsorption Characterisation: Kinetic Studies
For kinetic studies, all 100 mL reactors with 50 mL solution had a starting Pb(II) concentration of 100 mg L
−1, and were tested under three different temperature conditions: 25
C, 30
C, and 35
C. The reactors were placed in a submerged incubator for an hour until they had reached the desired temperature and samples were taken to get an initial concentration for each of the triplicates. 0.1 g biomass was then rapidly added to each reactor and samples were then taken and filtered in 3 min intervals for the first 10 min, and then over longer periods of time (see
Section 3.4). Various kinetic models were then fitted to these data to determine possible rate and mechanisms of adsorption [
25,
26].
2.5.1. Empirical Models
While the empirical models do not generally describe any physical properties, they can help describe the rate of adsorption.
Pseudo-First-Order (PFO) Model
Proposed by Lagergren [
6], this model is usually applicable when the concentration of adsorbate is high relative to the active sites. This scenario typically occurs during the start of the adsorption. The PFO Pb(II) adsorption rate for
Aspergillus is expected to range from 0.0190 to 0.1676 [
27]. The analytical form of the PFO can be seen in Equation (
5).
where the equilibrium adsorption capacity,
(mg g
−1), and the first order rate constant,
(min
−1), are solved for different initial concentrations,
(mg L
−1).
Two-Phase Adsorption
The two-phase adsorption model is based on the PFO, but assumes that adsorption takes place in a slow and a fast step.
where
is solved for each
, and a global
,
,
, and
are fitted.
Pseudo-Second-Order (PSO) Model
Proposed by Ho and Forster [
28], this model is often applicable when there is an abundance of active sites in a low concentration of adsorbate. When the adsorbate concentration is low enough the Langmuir kinetic model can be simplified to a PSO model. The PSO Pb(II) adsorption rate for
Aspergillus is expected to range from 0.0019 to 0.0200 [
27]. The analytical form of the PSO model can be seen in Equation (
7):
where
and the second order rate constant,
(g mg
−1 h
−1), are solved for each
.
2.5.2. External Diffusion
The external diffusion models assume that diffusion through the boundary layer in the solution is the rate limiting step. In other words external mass transfer (EMT) plays a bigger role than internal mass transfer (IMT).
Mathews and Weber (M & W) Model
Here the term describes the external diffusion, with S the outer surface area per volume of reactor (m−1) and in (m s−1).
2.5.3. Internal Diffusion
Internal diffusion models assume that diffusion from the surface and into the adsorbent pores is the rate limiting step.
Crank Diffusion Model
To quantify this, the EMT model described by Veenhuyzen et al. [
29], which is based on Largritte and Pasquier [
25] as well as Prasad and Srivastava [
30], is used.
Here refers to the bulk adsorbate concentration, a is the total absorbent area, V is the reactor volume, and is the mass transfer coefficient, which is equal to , while is equal to the the outer surface area per reactor volume, S, both of which can be obtained from the M & W model.
Once inside the mycelium, the adsorbent is modeled as a sphere with radius,
r, according to the Crank model (Equation (
11)).
This can be expressed in Equation (
12), which assumes that the IMT is the limiting rate.
As this approaches infinity, it’s useful to break the equations up according to experimental times (Equation (
13)).
Once
and
kf are established, the relative influence of EMT and IMT can be gauged by using the Biot number for mass transfer (Equation (
14)). If
is larger than 100, the adsorption rate might be limited by IMT, otherwise EMT is the controlling factor.
2.5.4. Adsorption onto Active Sites
Active site models assume that the rate is limited by the number of active sites on the adsorbent.
Langmuir Kinetics Model
Unlike the previous models, the Langmuir model represents a reversible reaction where desorption is taken into consideration as well. The nonlinear analytical form can be seen in Equation (
15) [
25].
where
and
denote the adsorption and desorption rate coefficients in s
−1.
2.6. Surface Characterisation
Before and again upon completion of the adsorption and isotherm experiment, the mycelium was characterised by numerous analytical techniques to study the effect of Pb(II) adsorption on the fungus morphology. Particle morphology was studied using ultrahigh resolution field emission scanning electron microscopy (FESEM) from Zeiss Ultra Plus55 (Carl Zeiss AG, Oberkochen, Germany) with an InLens detector for high-resolution topographic imaging, an electron high tension of 2 kV acceleration voltage, and a scan speed of 9. The FESEM was then fitted with an energy dispersive X-ray spectrometer (EDS) to identify elemental compositions of specific sites on the mycelium. Finally fourier transform infrared (FTIR) spectroscopy was recorded on a PerkinElmer Spectrum 2000GX FTIR spectrometer (PerkinElmer, Waltham, MA, USA) used with an attenuated total reflection attachment (ATR), and recorded at a resolution of 1 cm−1 with 32 scans for wavelengths between 4000 and 600 cm−1.
3. Results and Discussion
3.1. Fungal Growth Conditions and Biomass Propagation
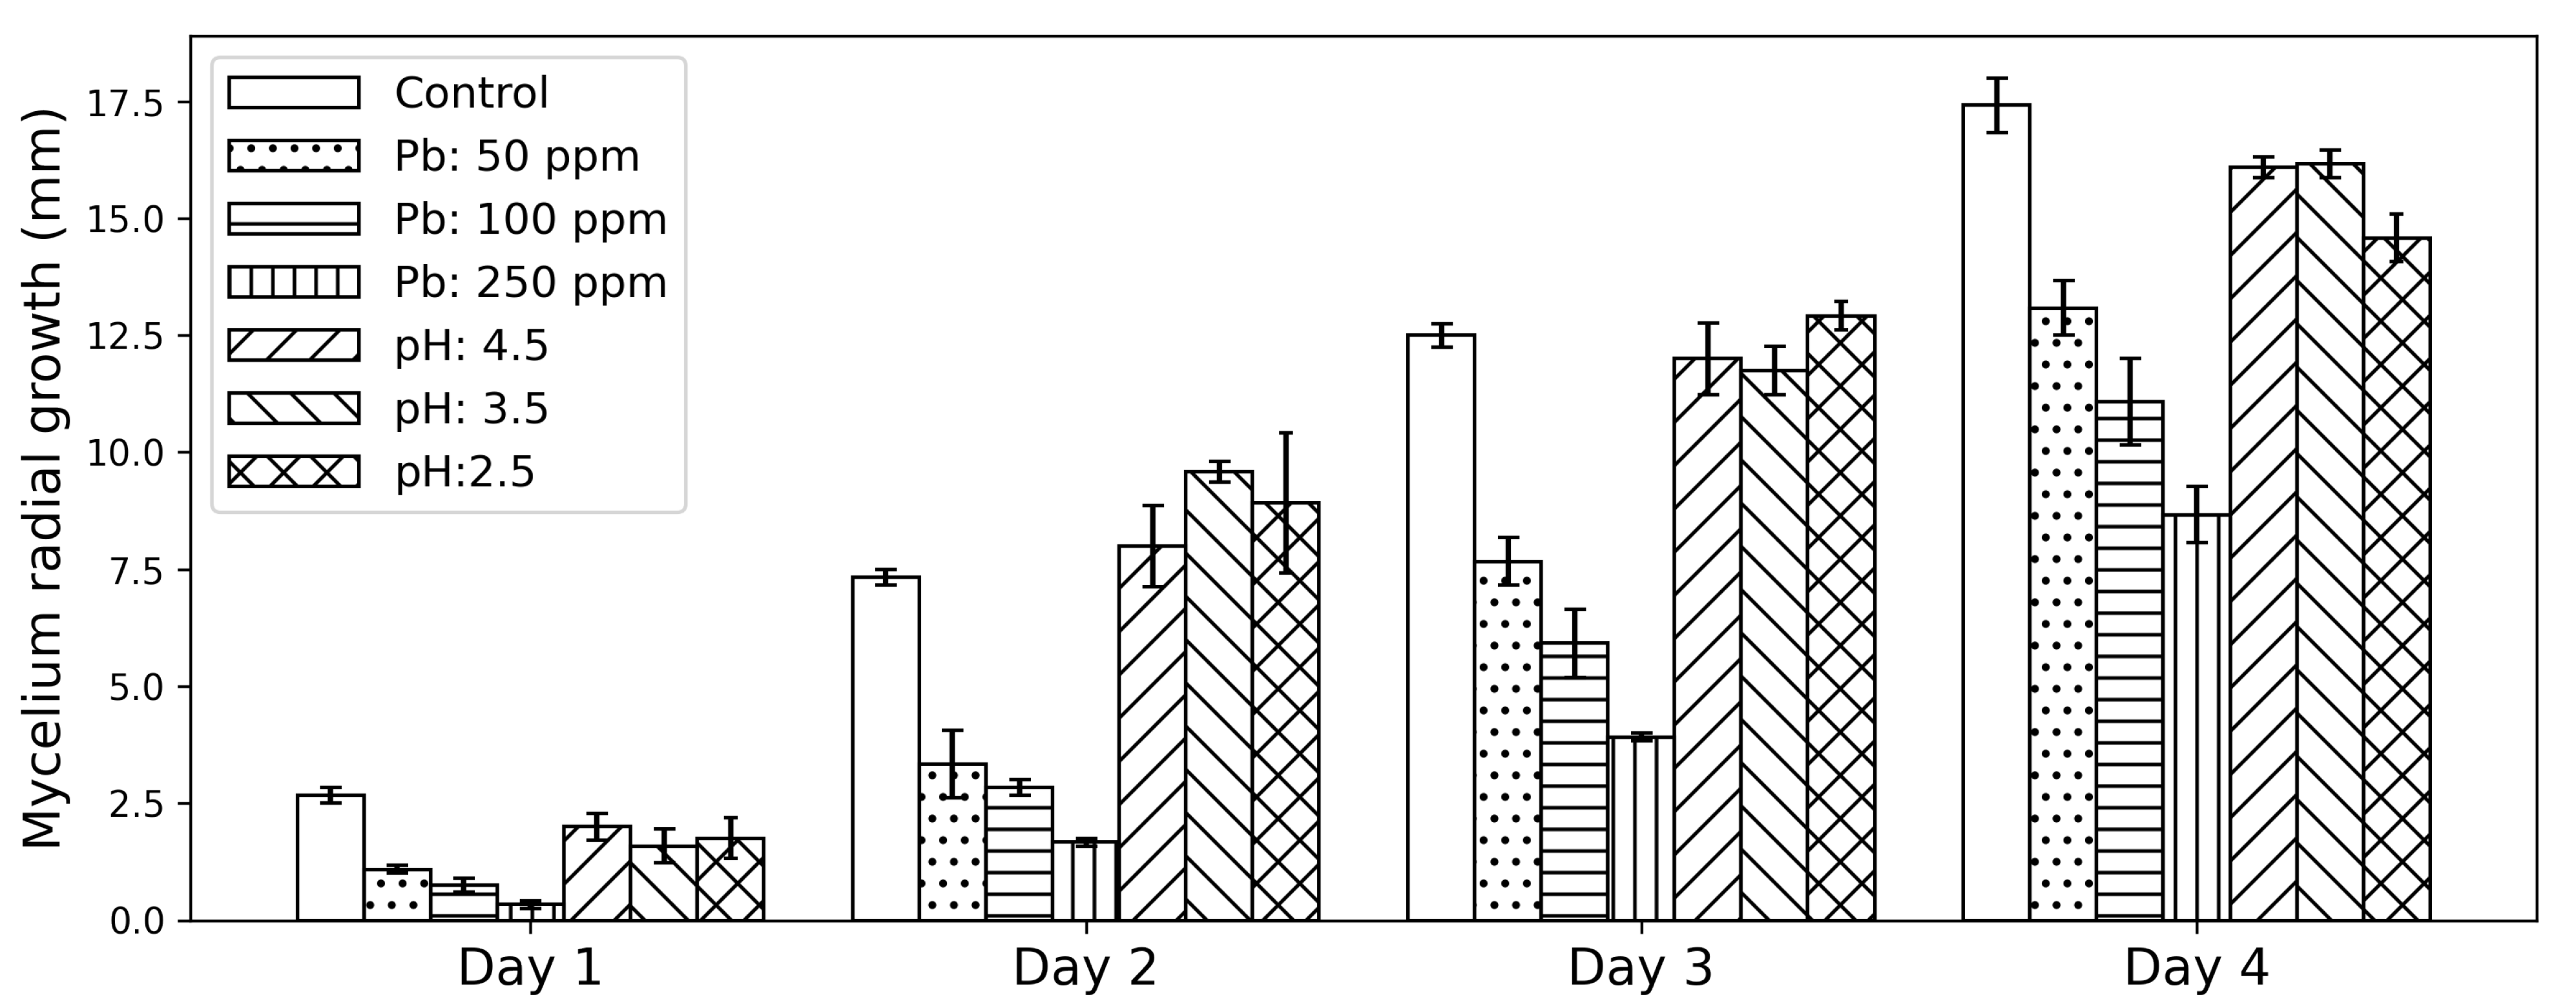
The results for the potato dextrose agar (PDA) plates can be seen in
Figure 1.
As with most fungi [
16],
A. piperis showed good growth at the control pH of 5.6, and by the second day the fungus showed good growth even on a much more acidic medium. While the low pH growth is slightly more stunted than the control group, this property may prove useful for industrial, less controlled applications because it not only buffers against bacterial infection, but Pb(II)-contaminated water is often at a lower pH. Initial Pb(II) concentration seems to have the largest effect on the mycelium growth at the beginning, where the fungus only achieves 40.6%, 28.1%, and 12.5% of the control growth for 50, 100, and 250 mg L
−1, respectively. However this steadily increases and by day four the radial growth for the Pb(II) plates have reached 75.1%, 63.6%, and 49.8% of the control growth. This could imply that the fungus is initially inhibited by the Pb(II) but manufactures a means of coping with the toxic environment.
The submerged fermentation reactors yielded unclear results. Despite the studies being undertaken in sextuplicates, a large variation of biomass yield still occurred within identical experimental conditions. Surprisingly neither a pH of 7, 5, and 3, nor Pb(II) concentrations of 50, 100, and 250 consistently resulted in significant yield differences. In fact biomass yield was often much higher in the presence of Pb(II) than in the control group, but not consistently so.
However the factors that had a consistent impact on biomass yield was spore inoculation and to a lesser extent growth medium. For the 100 mL reactors, the average spore inoculation to biomass ratio (measured in mL spore solution per gram dried biomass after 3 days) were as follows: 3.33, 14.3, and 35.7. Because A. piperis is, like most mold, such a prolific spore producer, increasing inoculation concentration is much more feasible than increasing incubation times for the reactors.
Thus, mass production of the biomass can be undertaken in a variety of conditions without significant inhibition from Pb(II) or pH, and provided that there are ample nutrients available with 50 mL spore solution per litre of medium, a yield of at least 1 g dry biomass per litre of medium can be harvested.
3.2. Adsorption Conditions
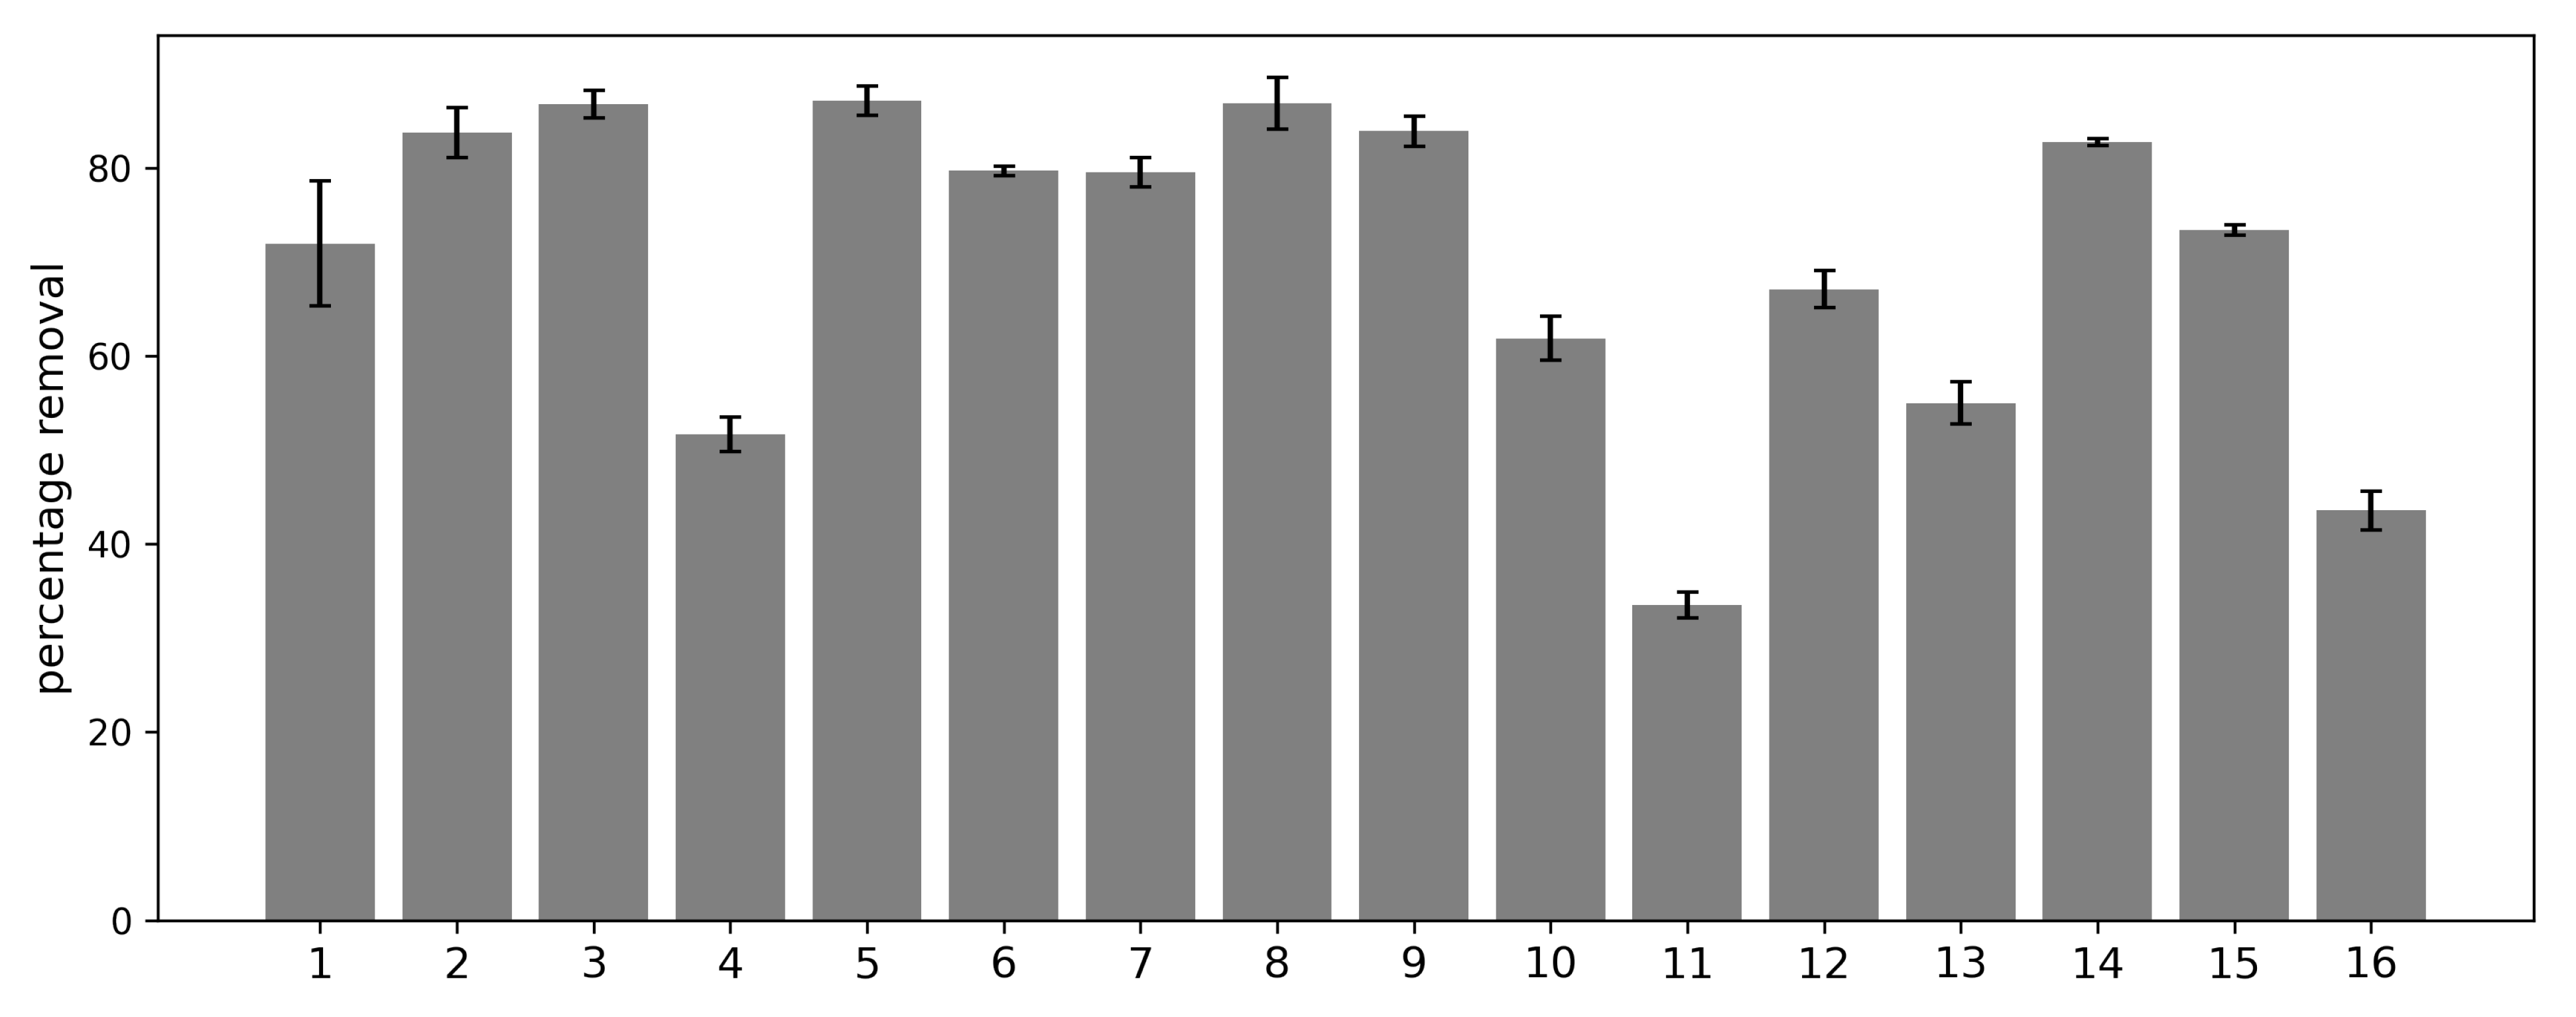
The results of the adsorption experiments can be seen in
Figure 2, with the variable levels for reactors 1 to 16 in
Table 2 and
Table 3. The sample with the highest Pb(II) adsorption was sample 5 with an equilibrium Pb(II) adsorption of 87.34%. This sample had an initial Pb(II) concentration of 200 mg L
−1, initial pH of 5, a constant temperature of 25
, and biomass that was not grown in the presence of Pb(II).
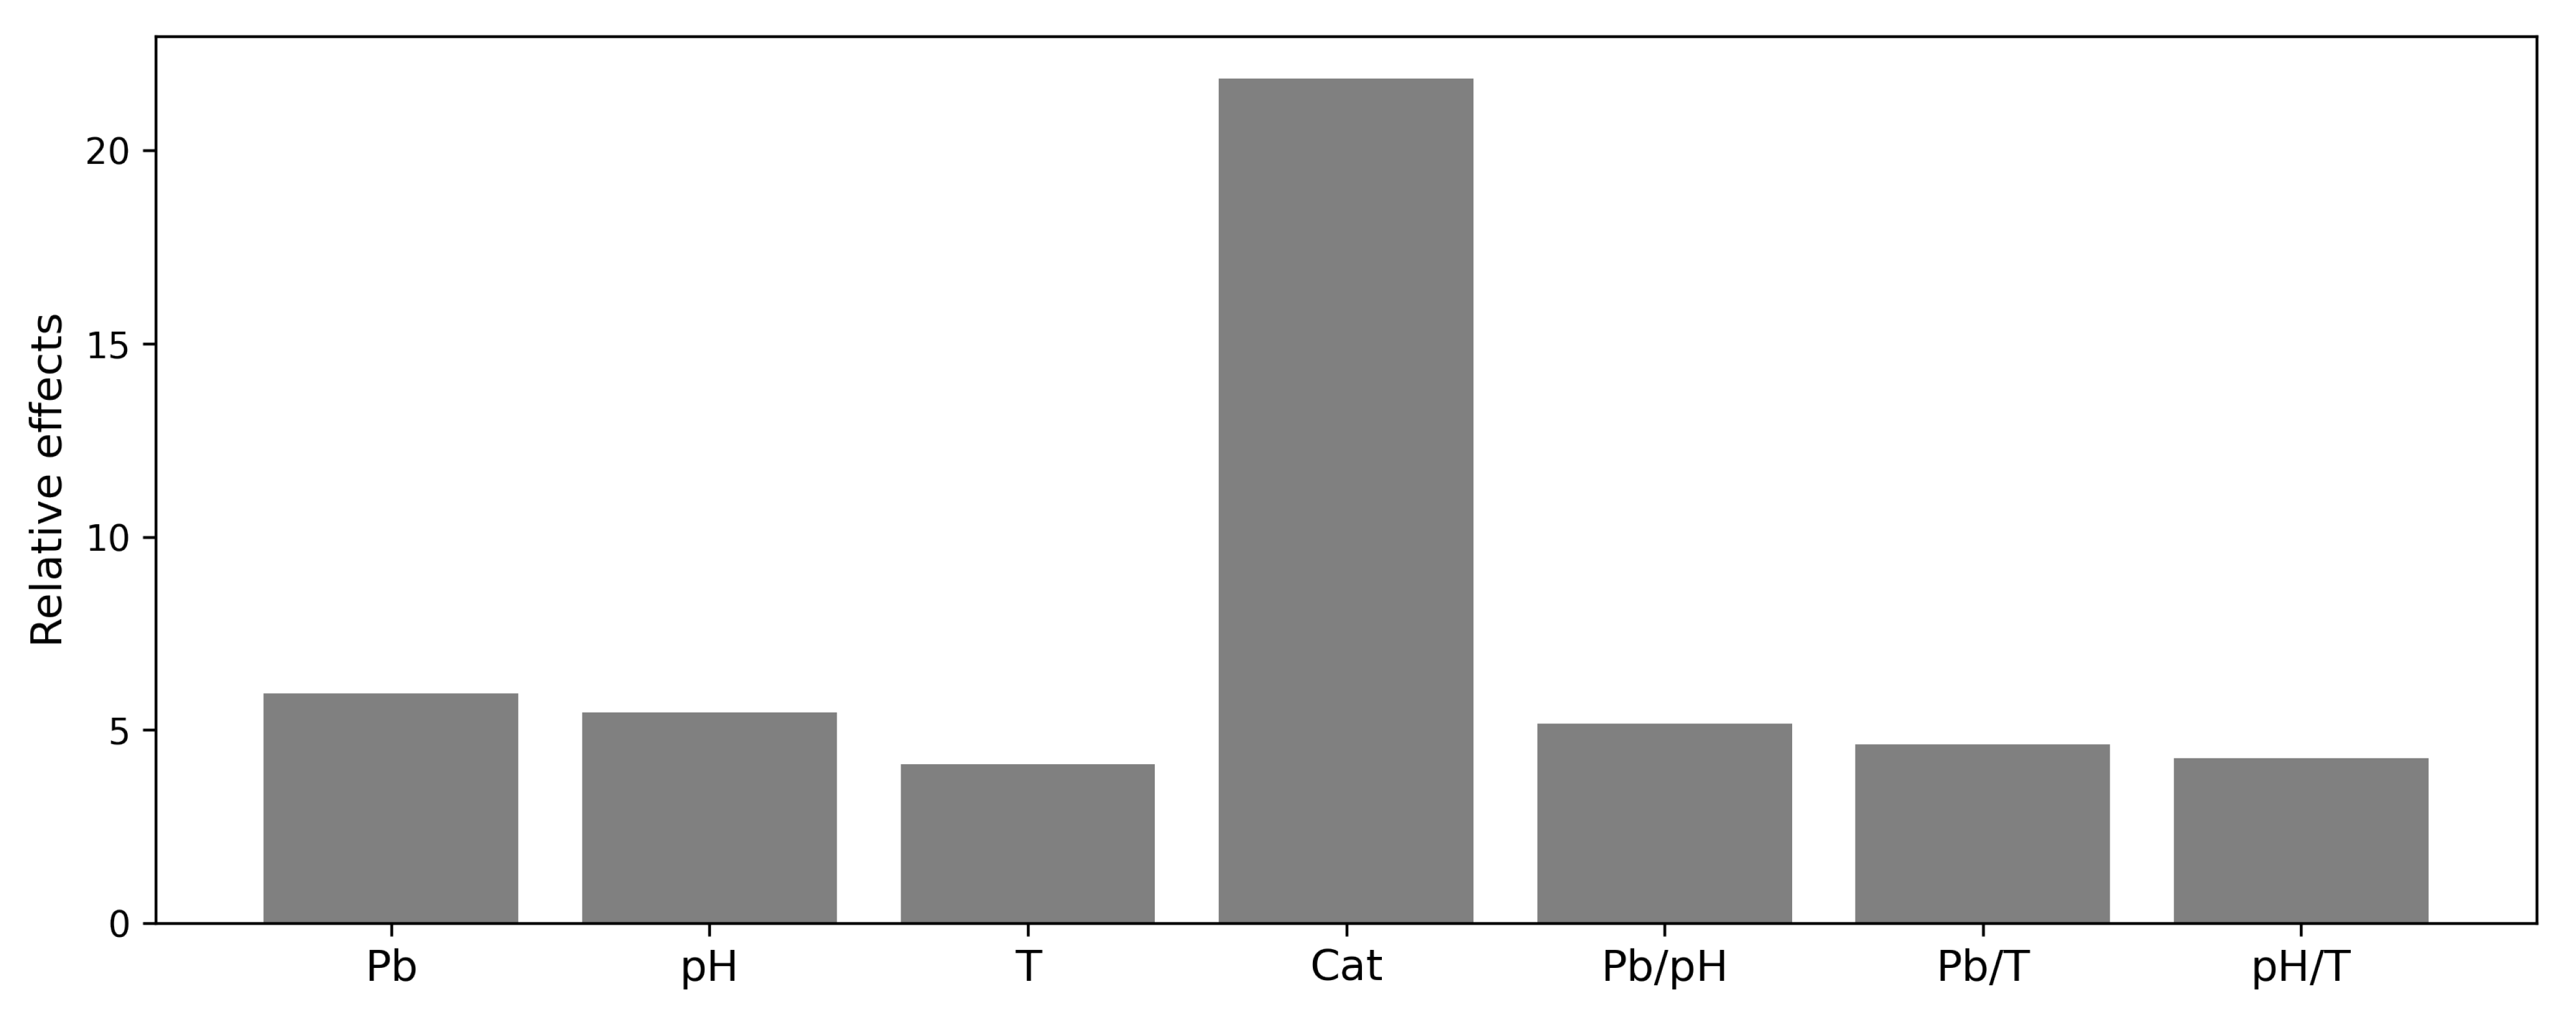
Interaction effects from the different variable levels are shown in
Figure 3. These results suggest that the most prominent factor that affects the Pb(II) adsorption success is the pretreatment of the biomass, with exposure to Pb(II) ions followed by nitric acid treatment having a poor outcome on adsorption.
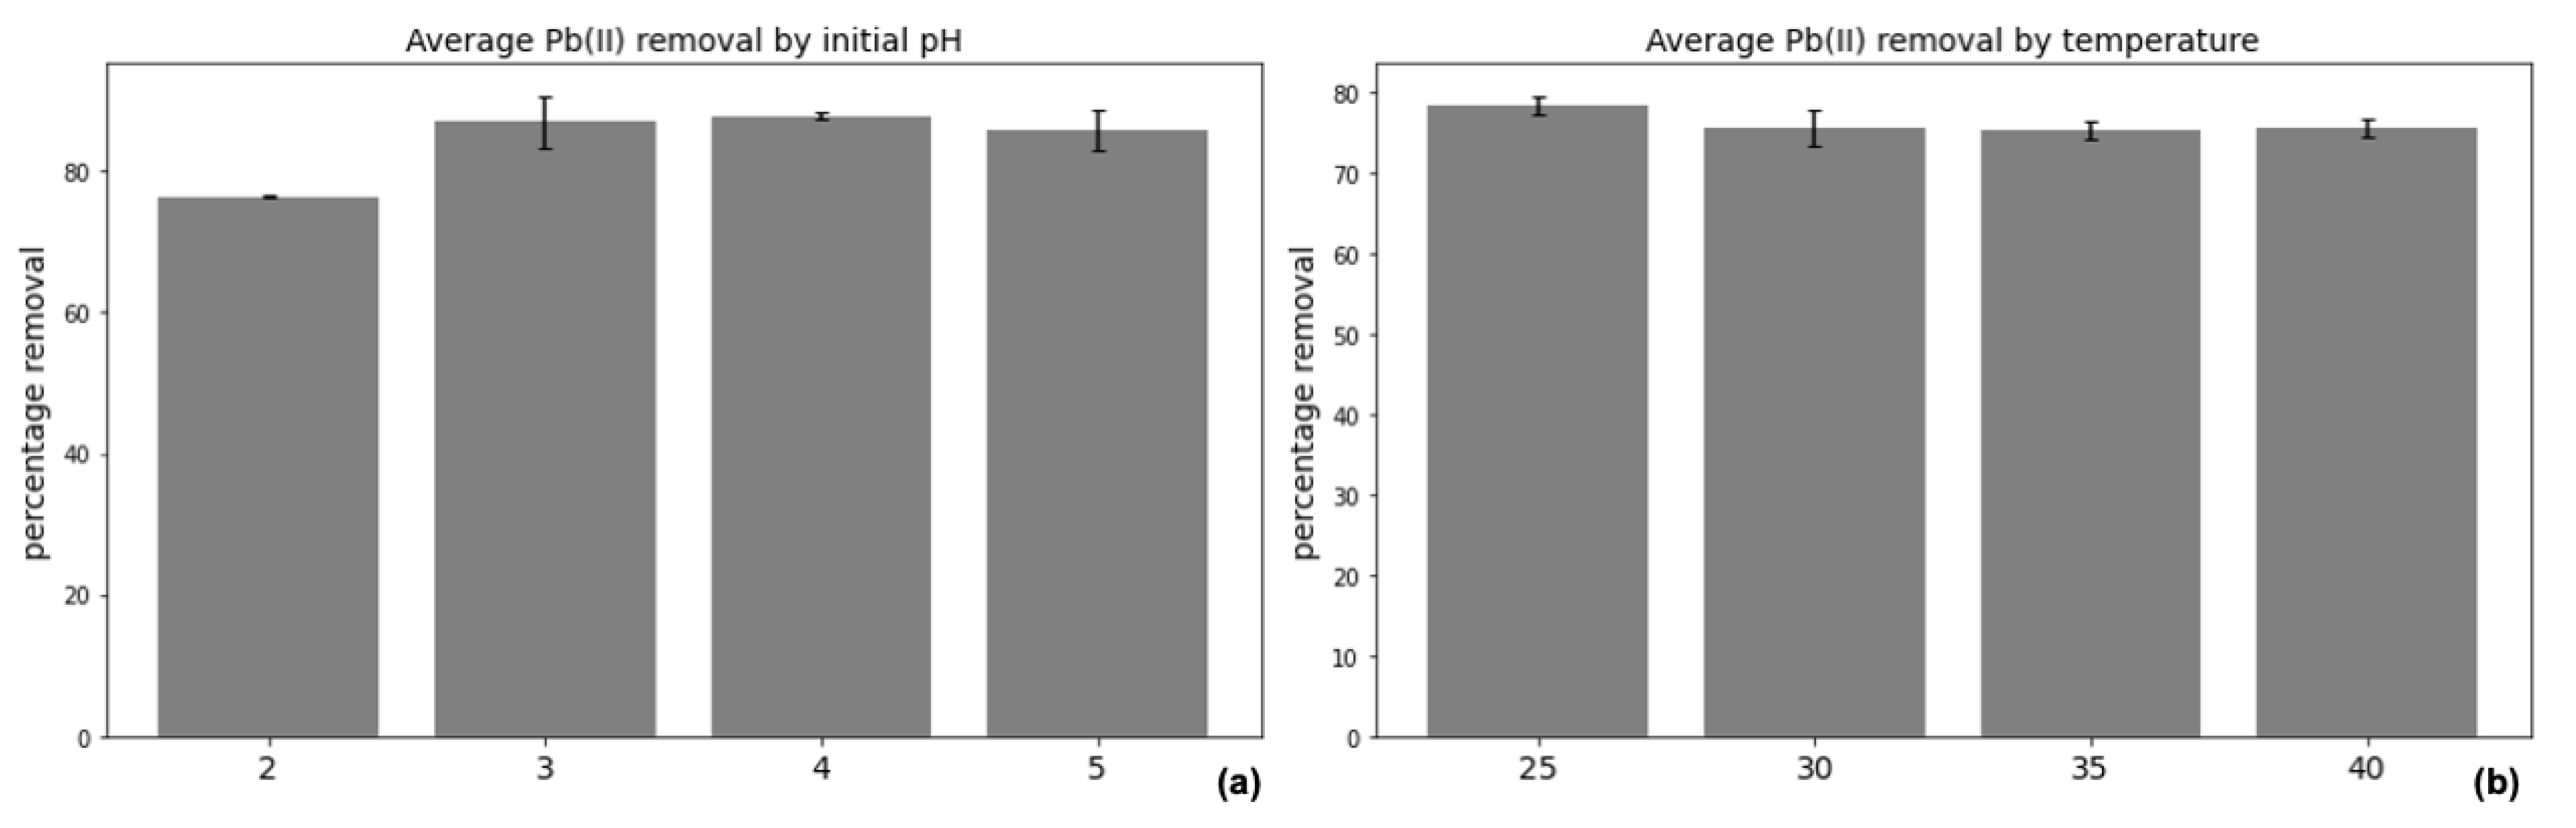
Pb(II) adsorption percentage (
Figure 4a) across a pH of 2–5 had a very small standard error of the mean of 2.64%, with the lowest adsorption taking place at an initial pH of 2 (76.4% adsorption), and the highest at 4 (87.8%). This suggests that optimal initial pH for adsorption should be in the rage of 3–5 rather than below 3, although fungal survival and adsorption capacity is not markedly inhibited by starting pH. The measured effect of temperature on Pb(II) (
Figure 4b) adsorption had a nearly insignificant standard error of the mean of just 1.46% adsorption, with no strong evidence that temperature affects the equilibrium adsorption.
On average, using untreated biomass (in other words grown in TSB in the absence of Pb(II)) resulted in an 11.04% greater Pb(II) removal. This was confirmed in a separate experiment by keeping all other factors the same and only changing the biomass type, which resulted in a 61.15% removal for the untreated biomass, and a 16.02% removal for the Pb(II) treated biomass from an initial concentration of 182.2 mg L−1, confirming that Pb(II) biomass treatment greatly reduces adsorption capacity. It is likely that this reduction in adsorption capacity was a result of adsorption taking place during the growth phase in Pb(II) spiked medium, which reduced the number of available sites for adsorption by the dried adsorbent.
Regeneration of Biomass (Desorption)
To study the biomass regeneration after adsorption, an initial medium concentration of 6.22 mg L−1 was confirmed. After exposing the biomass to one litre of the medium, the concentration had dropped to 3.48 mg L−1, indicating that the biomass retained roughly 2.48 mg of Pb(II) ions. The biomass was then dried and placed in HNO3 for an hour after which the acid was also tested using the AA. The HNO3 concentration turned out to be 2.23 mg L−1, which suggests that some of the Pb(II) ions were not completely adsorbed from the biomass, but that desorption in general is possible.
Regeneration however has proved not to be feasible as indicated by the poor performance of Pb(II)-treated biomass. This is likely due to the destruction or occupancy of surface active sites caused by the strong acid. As previously eluded to by van Veenhuyzen et al. [
29], Ca(NO
3)
2 was used after similarly negative HNO
3 regeneration results were observed, leading to much better regeneration. This will be attempted in future studies.
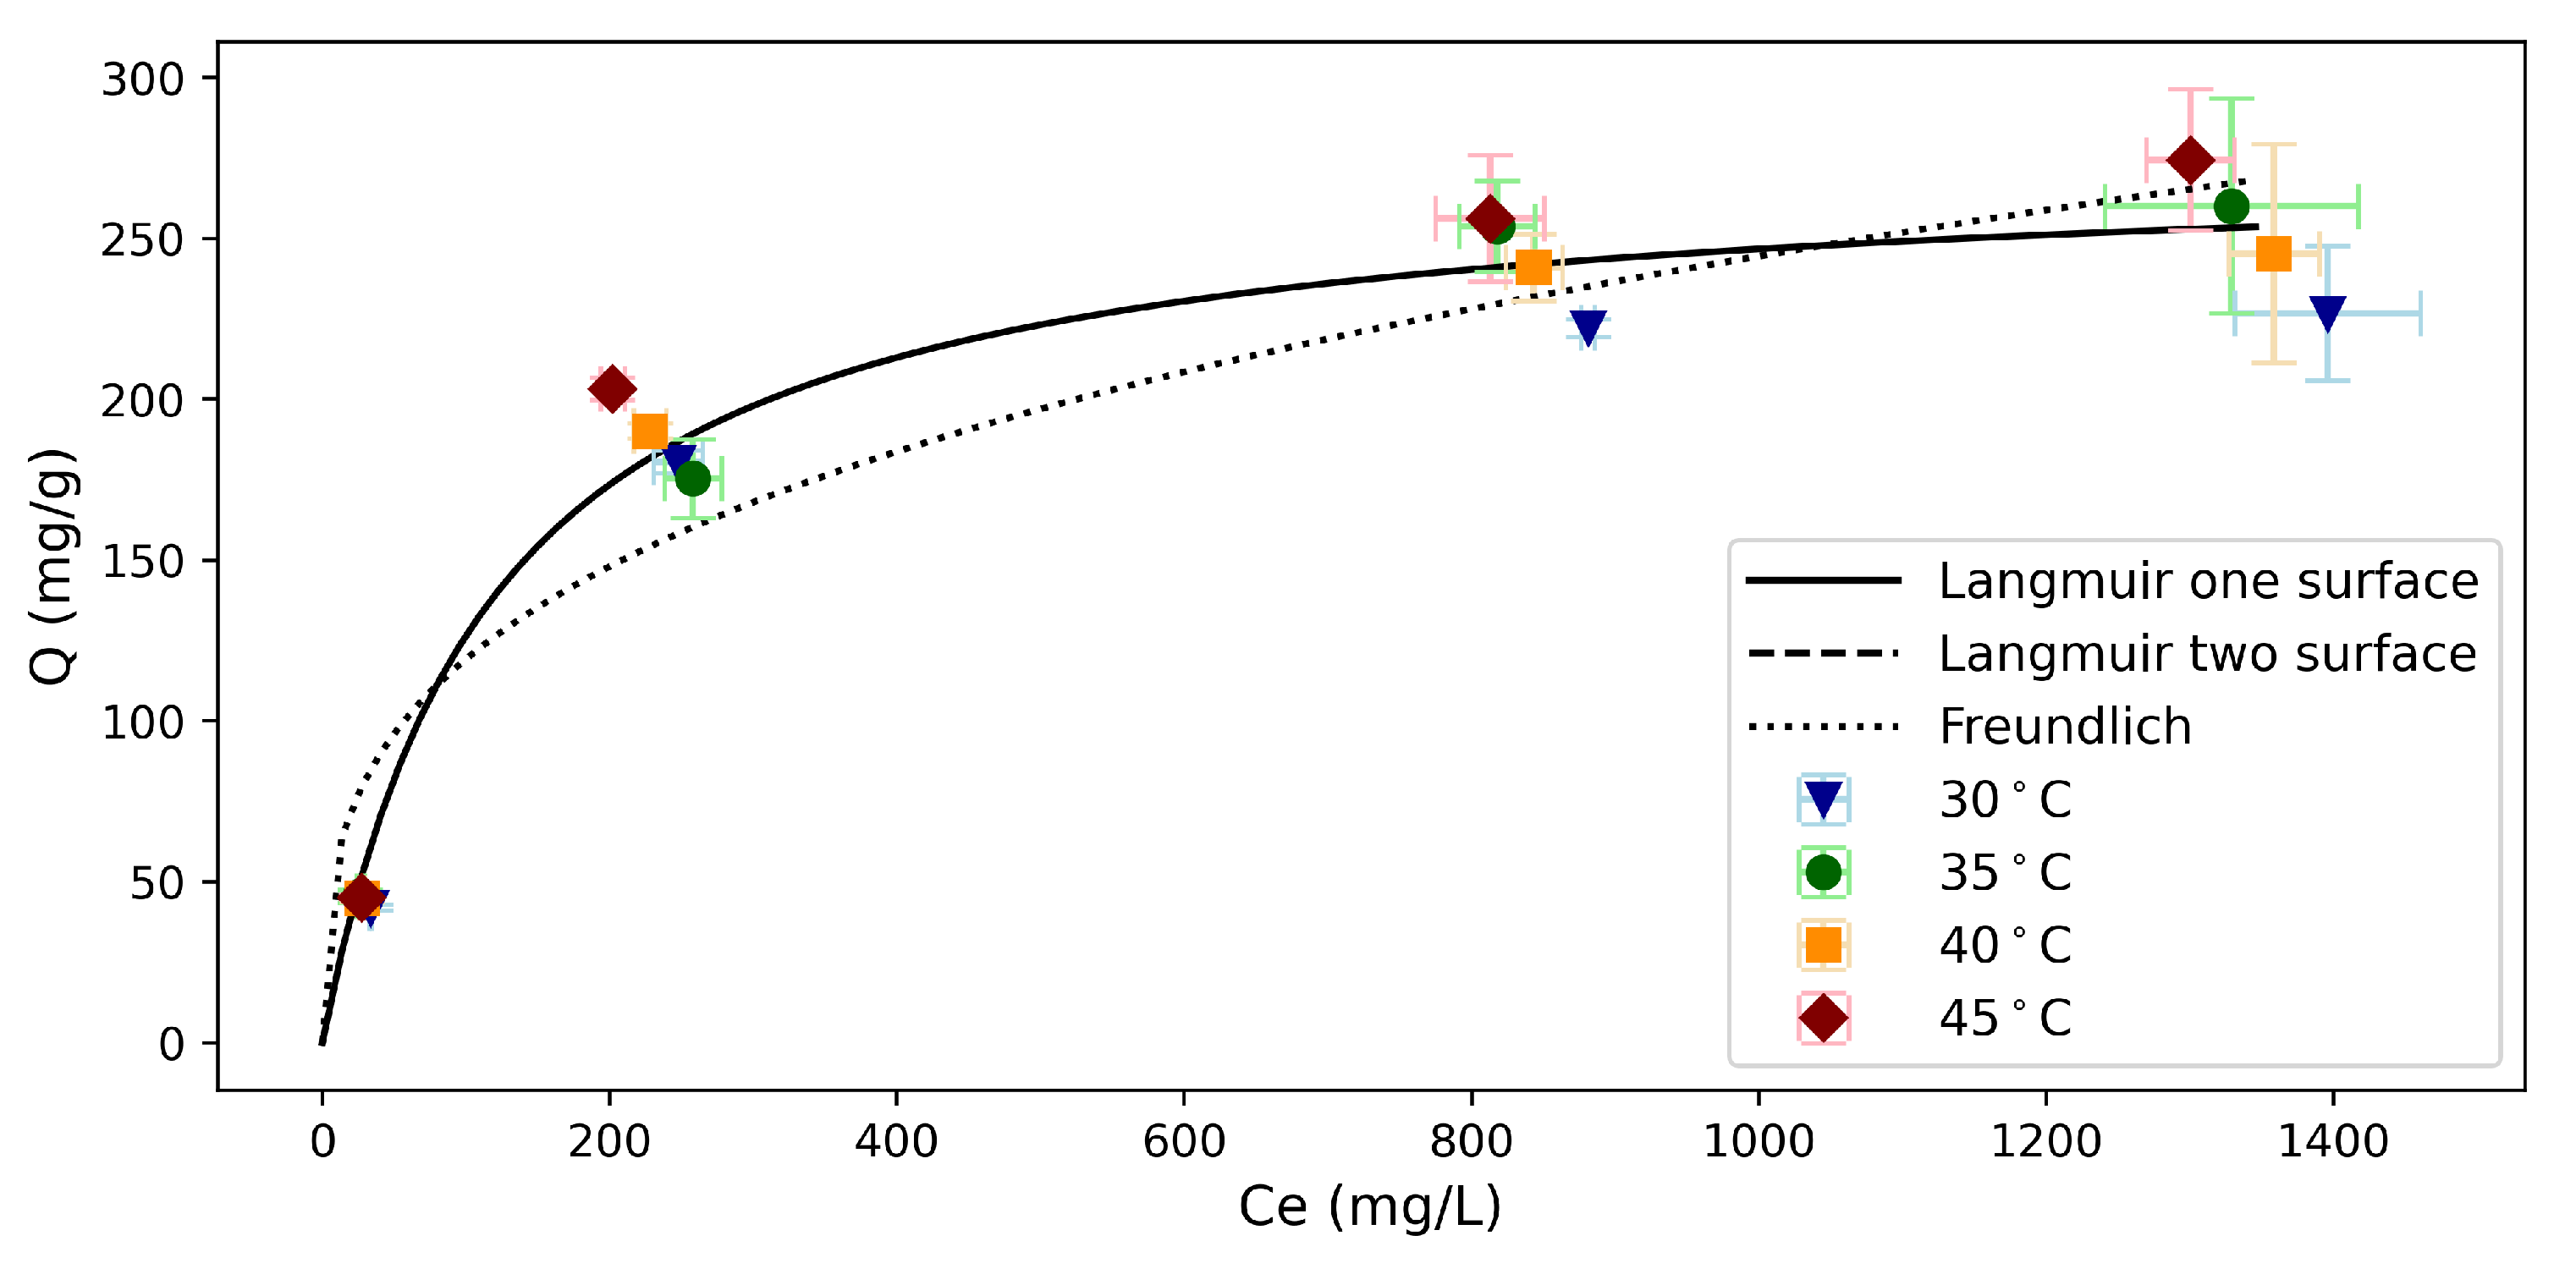
3.3. Adsorption Characterisation: Isotherm Studies
Before fitting the data to models, the maximum experimental adsorption capacity at 30, 35, 40 and 45 C was determined. Initial Pb(II) concentrations above 500 mg L−1 resulted in leveled-out adsorption concentrations, suggesting that the active sites on the biomass are saturated above these levels. Taking the average of all the data points above 500 mg L−1, the experimental is thus 267.41 ± 19.46 mg g−1.
The data used for the isotherm studies contained significant variability at elevated Pb(II) concentrations ( > 1000 mg L−1). This is likely due to small variations during serial dilutions for AA measurement and the exponential effect this has on final concentration readings. Because there was no obvious trend between adsorption results at different temperatures, a one-way ANOVA variance test was done between the datasets for the equilibrium concentration, , and the equilibrium adsorption, , at different temperatures. This was done with the package using the module in a environment. This module uses a one-way ANOVA test to compare the population mean between two or more groups, namely the datasets at different temperatures, as well as the datasets at different temperatures. The null hypothesis for this is that temperature affects and values.
When the values for
and
were not grouped by temperature, these two datasets had F-statistics of 0.02000 and 0.9961, and
p-values of 0.1814 and 0.9085, respectively. Both the F-statistics are low while the
p-values are high. This suggests that temperature didn’t have a significant effect on the isotherm results, confirming the alternative hypothesis, which corresponds to findings in
Section 2.3 which indicate that temperature has a negligible effect on adsorption capacity. This would further indicate that there is a negligible enthalpy of adsorption, which is consistent with observations made by van Veenhuyzen et al. [
29], however the reason for this is unclear at this stage. The dataset in its entirety, for all temperatures was thus used for fitting isotherm models.
Of the models tested (
Figure 5), the Freundlich isotherm performed the worst (
Table 4), while the two surface Langmuir isotherm converged into a one surface Langmuir isotherm. The Langmuir isotherm, with a coefficient of determination of 0.901 produced a
of 0.008479 L mg
−1 and
of 275.82 g mg
−1, which resembles the experimental average. This indicates that the system behaves as a homogeneous surface with a monolayer of adsorbate on the surface [
31].
Compared to other fungi, this maximum theoretical adsorption capacity is at the high end of Pb(II) adsorption compared to similar species (see
Table 5).
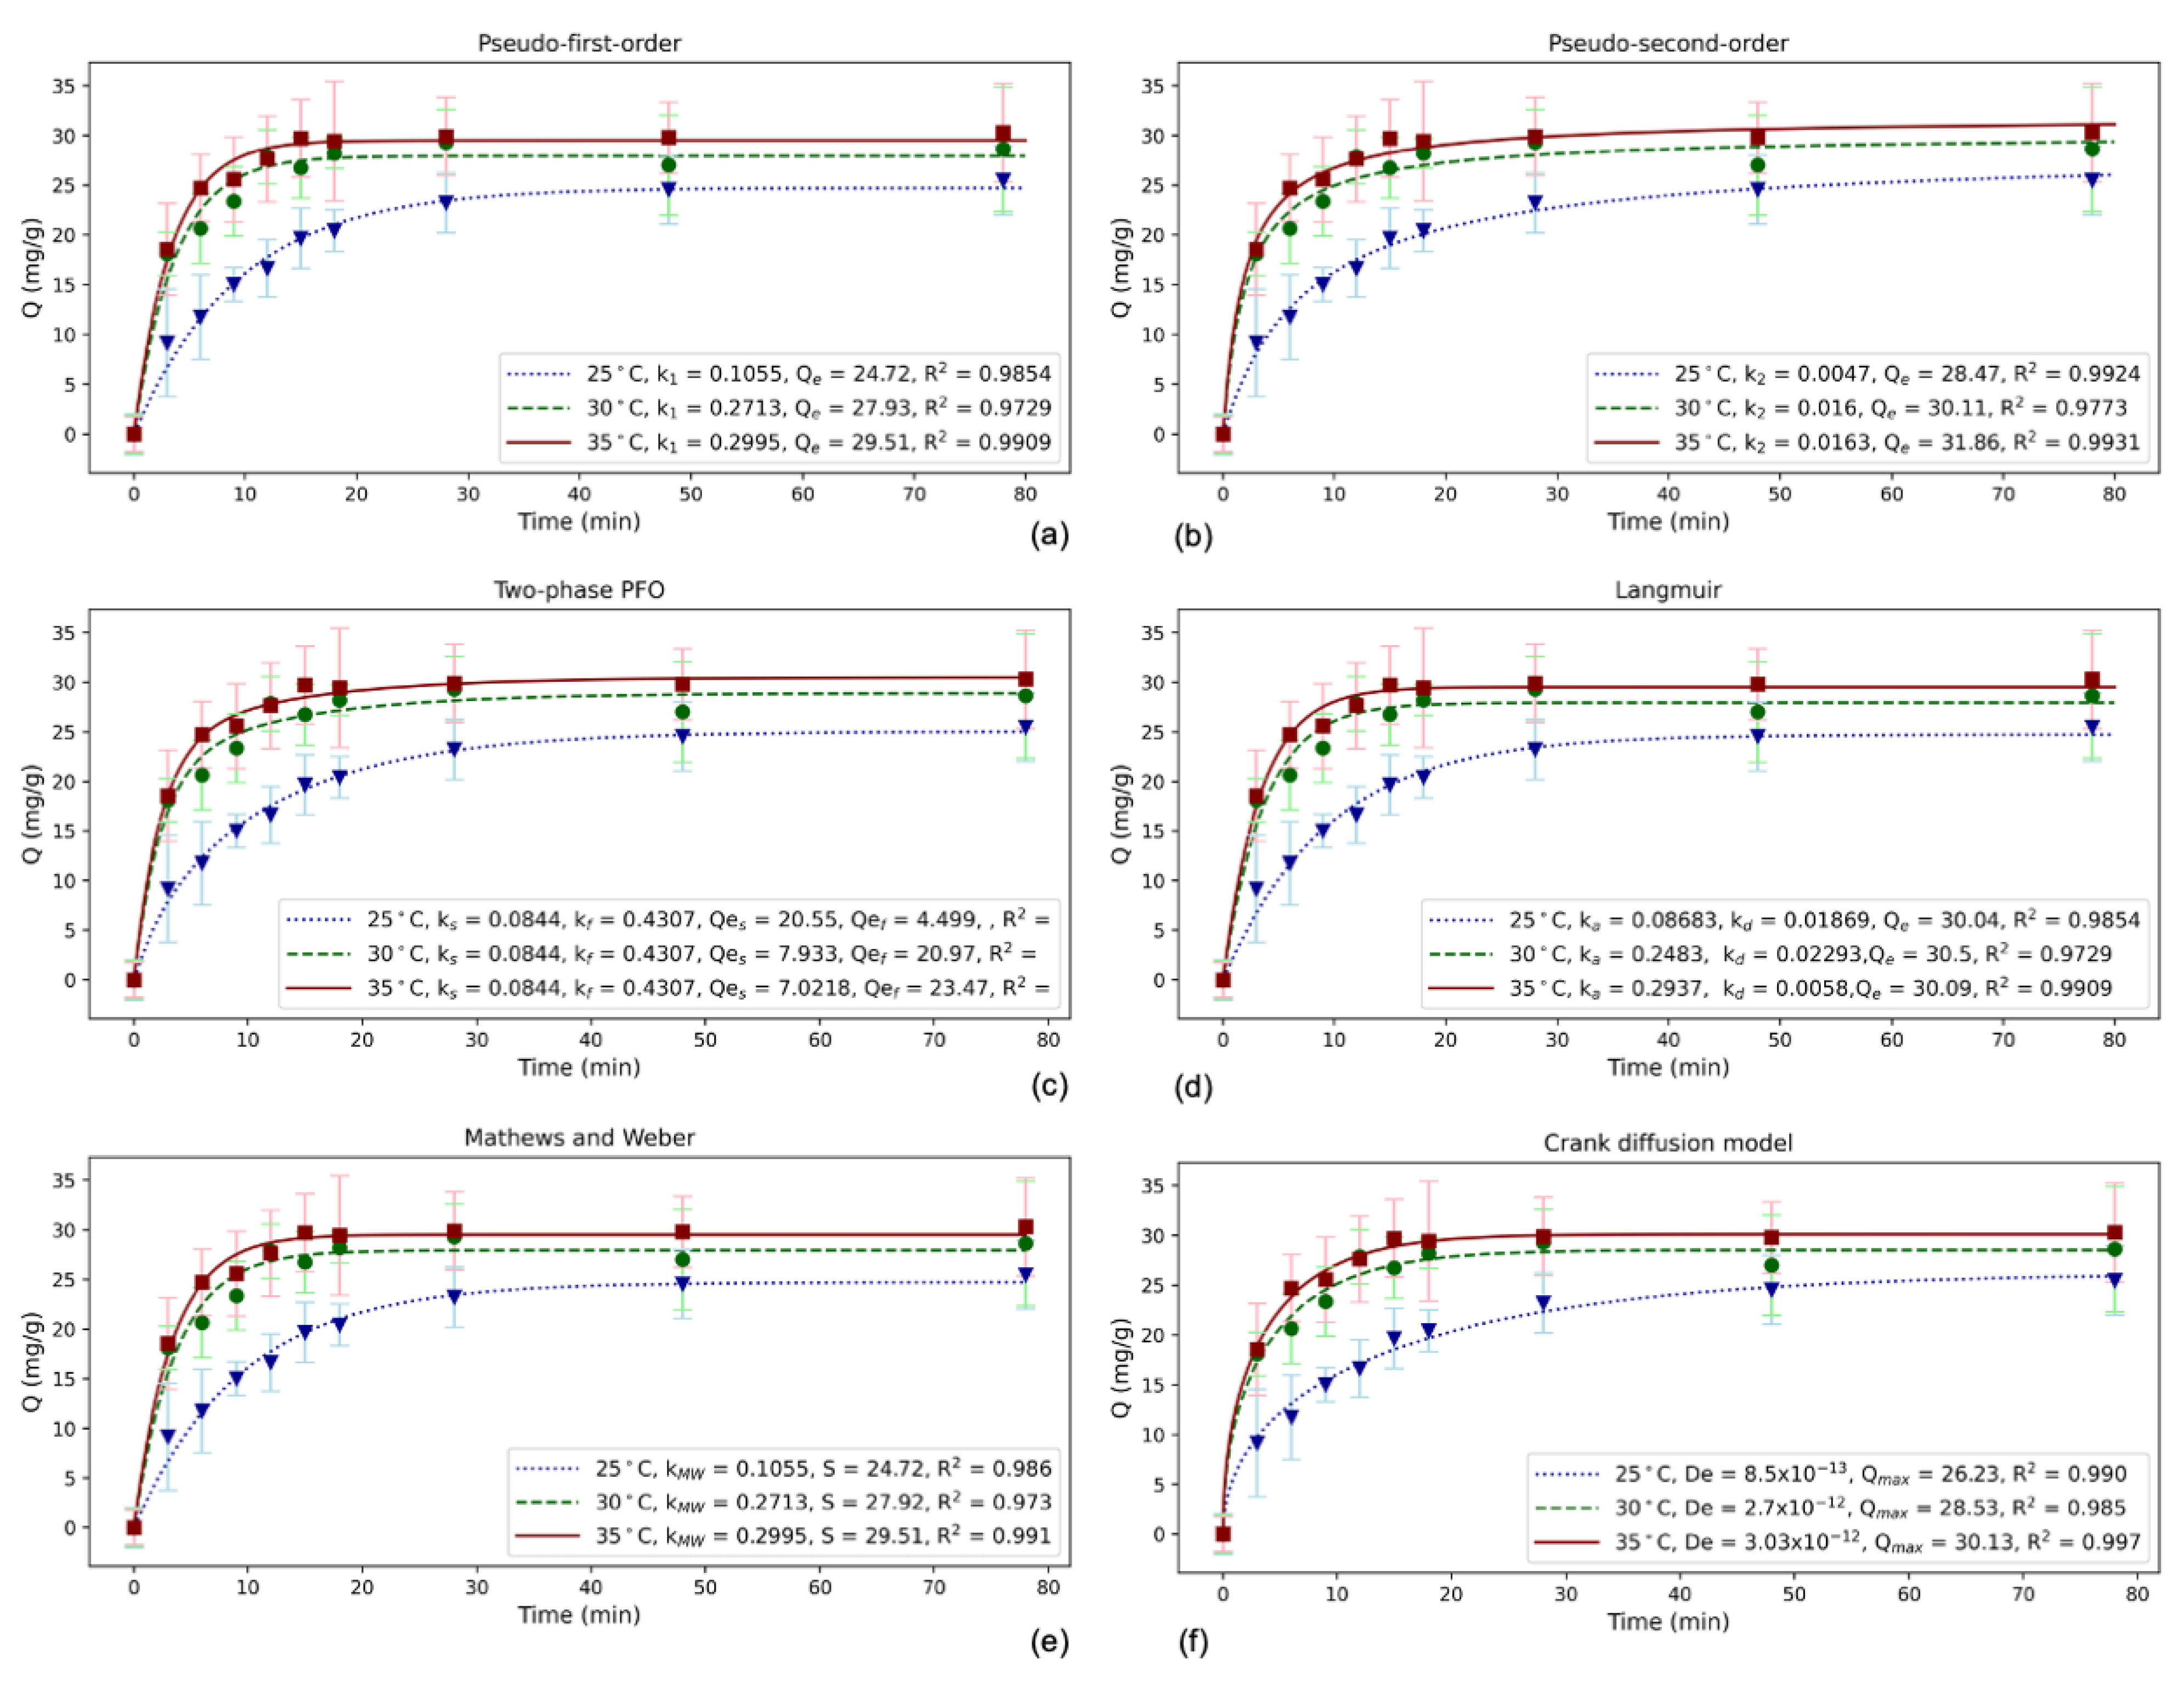
3.4. Adsorption Characterisation: Kinetic Studies
Of the reaction kinetic models (
Figure 6), both the pseudo-first-order (PFO) and two-phase PFO (TP PFO) performed well, however it can be seen that the two surface PFO model has
and
values that would effectively average to the PFO model values. It is interesting to note that the TP PFO model was fit using a single set of
and
values for all temperatures, supporting the observation that the system is insensitive to temperature changes. The empirical and Langmuir model results are in
Table 6.
The Langmuir kinetic model consistently resulted in a higher adsorption rate constant and lower desorption rate constant across all temperatures, which confirms that the reversible desorption mechanism isn’t as powerful as that of adsorption. From the Crank model, the effective diffusivity,
, of the adsorbent ranges from 8.5 × 10
to 3.03 × 10
m
2 s
−1 (
Table 7). Comparing this to the diffusion coefficient of Pb(II) in solution, which is 1.412 × 10
m
2 s
−1 [
36],
of the biomass is much smaller, which supports the notion that mass transfer effects are dominant in the biomass [
37]. Using Mathews and Weber as well as Crank diffusion models, Biot numbers (
Table 8) at all three temperatures strongly suggest that internal mass transfer (
>> 100) is the driving force behind the reaction kinetic results. The better fit for PFO as compared to the PSO model supports the observed mass transfer limited system as the external mass transfer model (Equation (
9)) has a pseudo first order relationship with the bulk concentration of adsorbate. In addition, this tendency for adsorption rate to be throttled by IMT could also be due in part to the fibrous nature of the mycelium which inhibits absorption.
3.5. Surface Characterisation
3.5.1. FESEM and EDS Results
FESEM imaging displayed a difference in texture between the biomass before (
Figure 7a) and after (
Figure 7b) adsorption. This could be due to mechanical deformation from re-drying after adsorption. Five locations were selected for EDS spectra analysis pre- and post-adsorption, revealing little or no Pb(II) present before (
Figure 7c) adsorption, and an average of 71.85 wt% after (
Figure 7d) adsorption. EDS mapping (
Figure 8) reveals the elemental distribution of a selected area on the biomass after adsorption. The changes for all major elements present on the adsorbent surface are compared in
Table 9.
To understand the interaction between the elements, EDS mapping for the pre- and post-adsorption biomass was considered (
Figure 8). An interaction matrix was built using statistical analysis and the software
after careful image processing to remove noise such as border pixels, and normalising against a monotone image [
38]. The image pixel distribution was then compared to find overlap between elemental occupation areas to determine which elements are clustered together and consequently imply interaction. These results are reported with standard deviation in
Table 10 and
Table 11.
From the interaction matrices, it appears as though there is significant interaction between elements such as sodium and chlorine, potassium and chlorine, and sodium and oxygen before adsorption takes place. Post-adsorption the potassium and sodium ions were completely removed from the surface (
Table 10 and
Table 11). The post adsorption surface indicates strong interactions between Pb(II) and O, and Pb(II) and Cl. This provides a strong indication that the Na and K were displaced by the Pb on the surface. It should be noted that even though oxygen shares much of the same regions as Pb(II), there are large areas occupied by O where no Pb(II) is found.
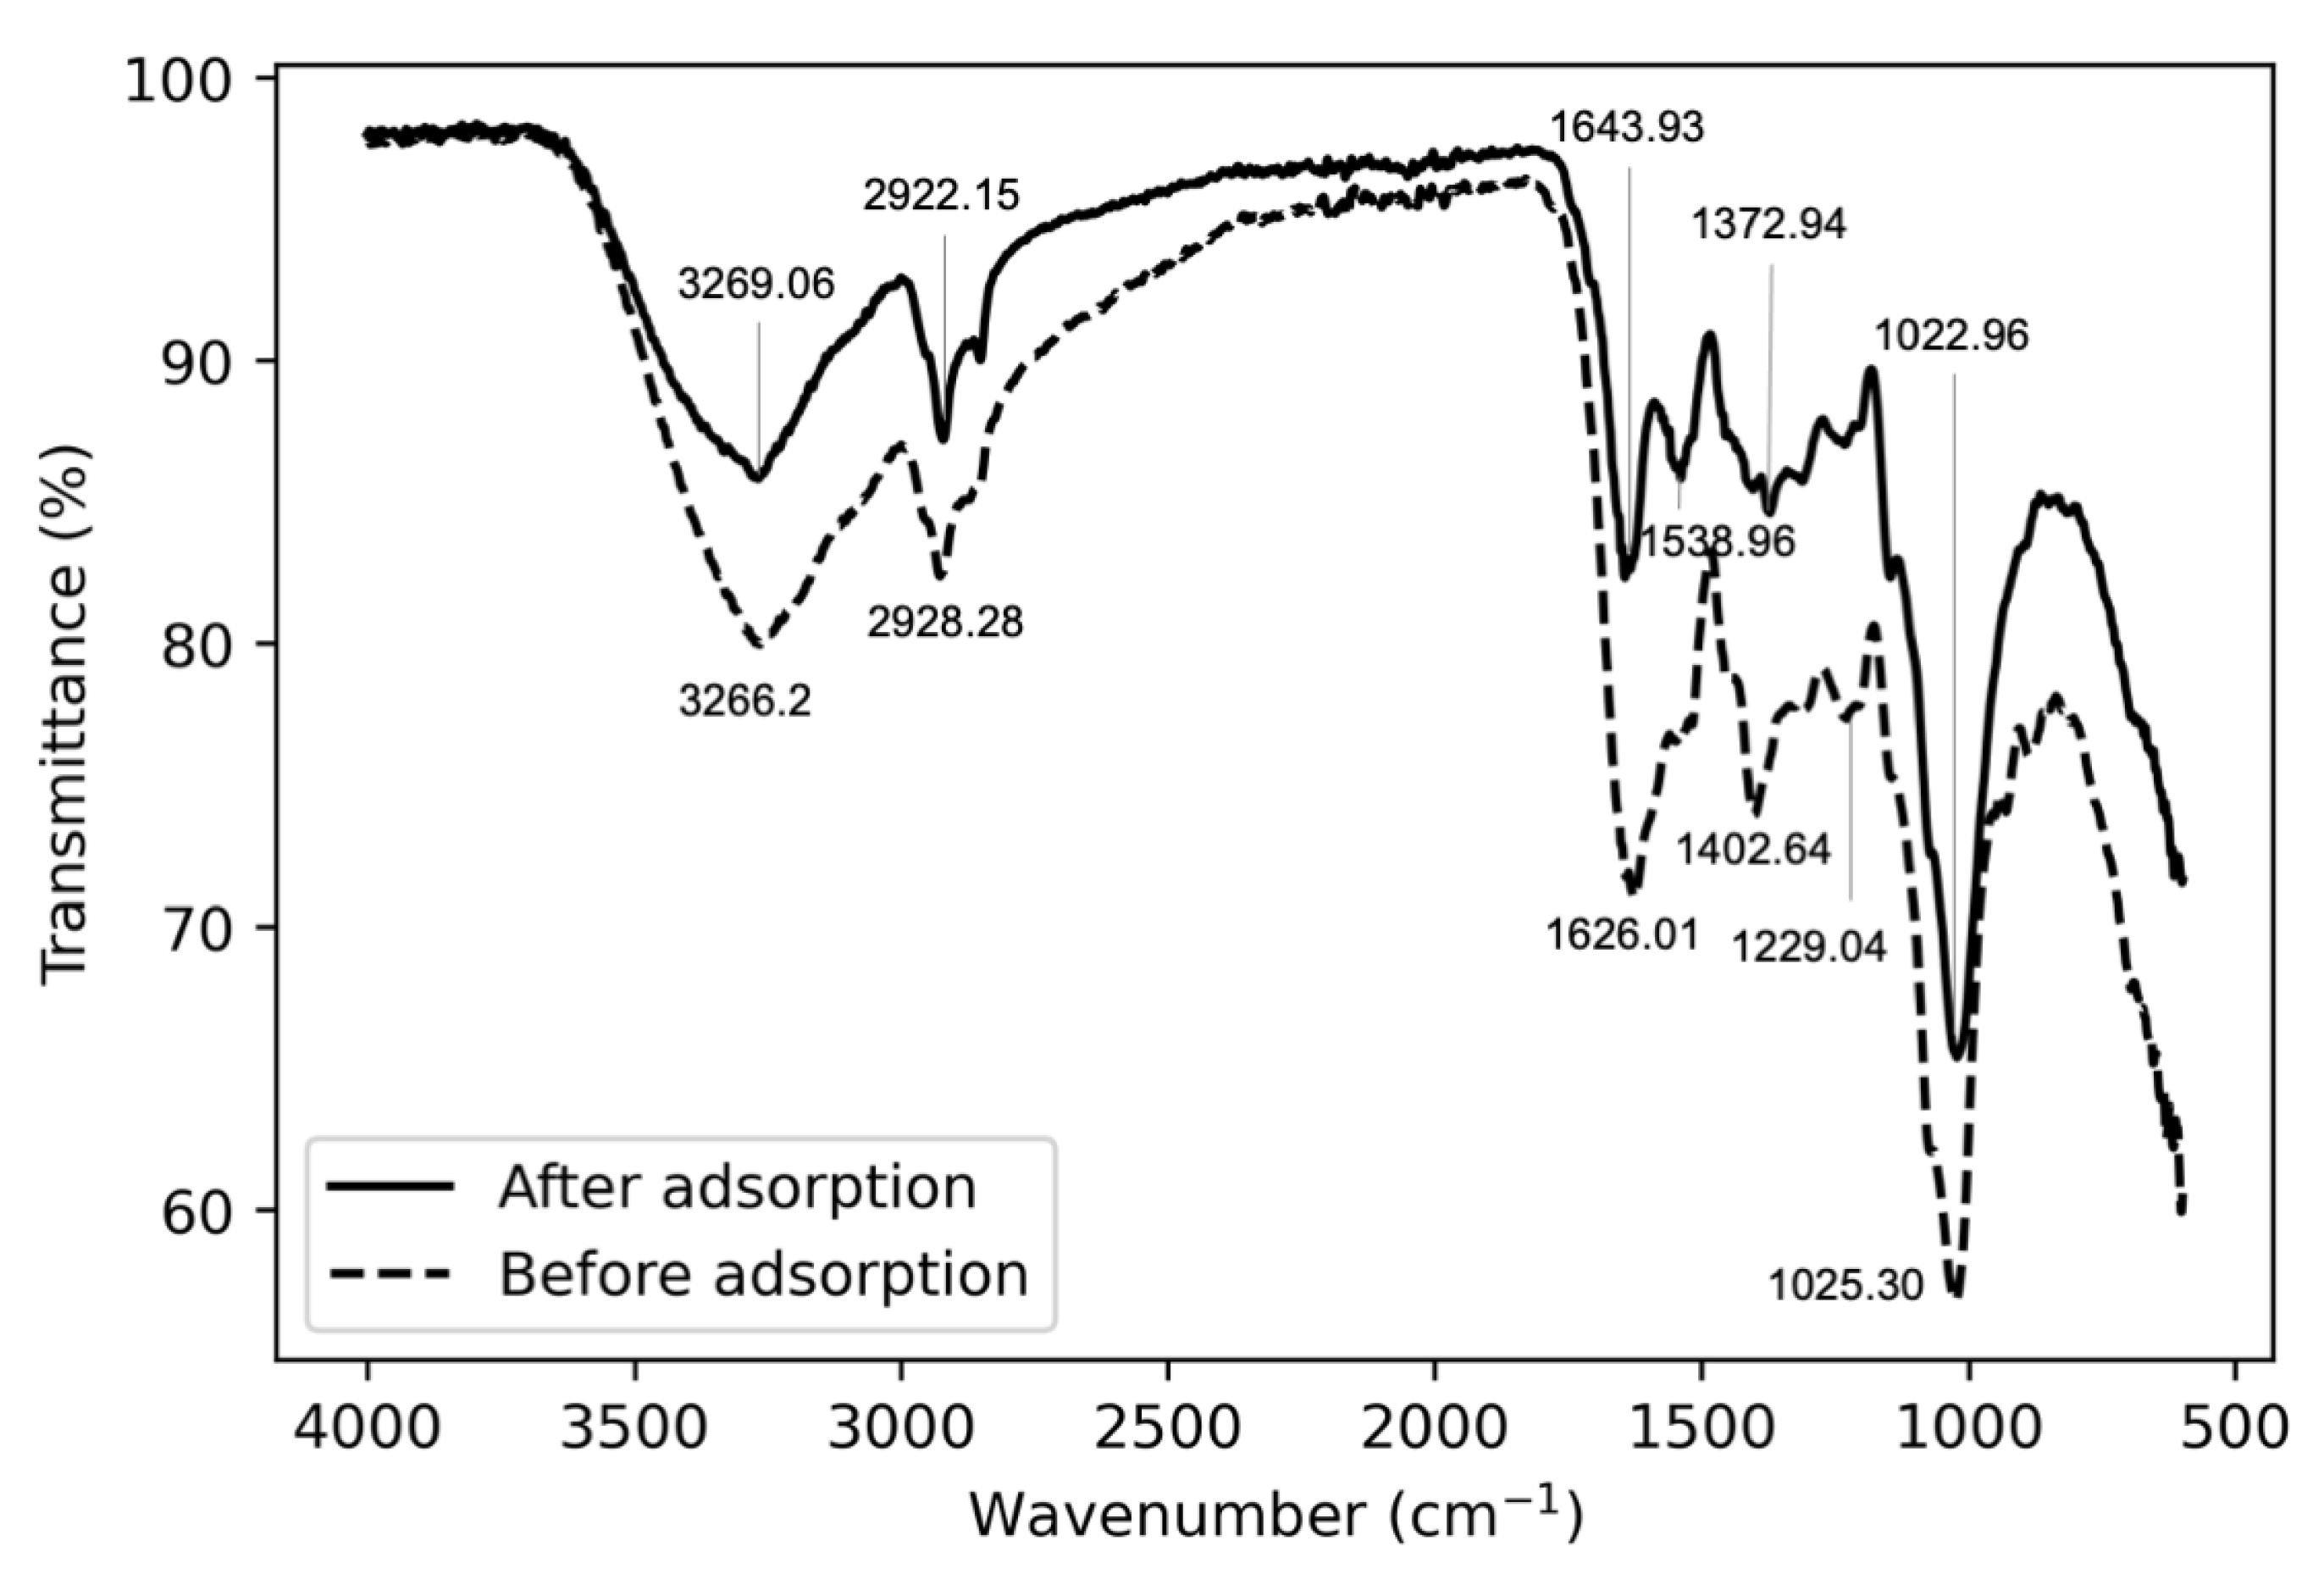
3.5.2. FTIR Results
FTIR spectra peaks (
Figure 9) indicate OH and NH shifting in the 3260–3270 cm
region and CH stretching in the 2920–2930 cm
region. A shift from 1626.01 to 1643.93 cm
in the C=C stretching implies that carboxyl groups may be involved in the adsorption process. Larger changes were seen in the shift from 1402.64 to 1538.96 cm
, implicating that NH deformation may have disappeared and been replaced by OH bending. Additionally, the shift from 1229.04 to 1372.96 cm
suggests that CN stretching was also involved. Both spectra displayed peaks in the 1020–1025 cm
region which could be attributed to phosphate groups [
39].
3.5.3. Suggested Adsorption Mechanisms
To understand what the EDS elemental weight% results mean in terms of molecular amounts, an assumption was made that the oxygen present in the pre- and post-adsorption samples remained constant, and the weight percent for the elements were normalised against this, essentially using 1 wt % O as a basis. After normalisation, the mol percent was calculated for each of the elements to determine the mol fraction change. From this there is a 0.23 mol fraction decrease in Cl and K, and a 0.38 mol fraction decrease in Na, while Pb increased by 0.362 mol fraction. What is notable about this is that the combined decrease in K and Na is roughly double the increase of Pb. This makes sense when considering a simplified version of the ion displacement reaction [
40] (Equation (
16)), supporting the idea that the K
+ and Na
+ monovalent cations were replaced by Pb
2+ ions, as was reported by Bairagi et al. [
14].
In Equation (
16), two salts,
and
, react to exchange cations. In this case
M would be Pb
2+ and
N could be either K
+ or Na
+. To further support the argument for cation exchange over other mechanisms, the interaction matrices indicate that oxygen shares only some regions with Pb(II). If factors such as electrostatic forces were driving the adsorption process one would expect to see more overlap between Pb and O.
While it is unclear which exact salts take part in the ion exchange reactions, the FTIR data supports mechanisms seen in the literature: The shift from 1626.01 to 1643.93 cm
suggesting that carboxyl groups may be involved was reported for other species of fungi [
41], including
Aspergillus [
42]. For
Aspergillus piperis there is always a significant pH drop (on average 36.4 % down to a pH of 2.1) that accompanies adsorption, and this could possibly be attributed to hydrogen ion displacement from carboxyl group interactions. The phosphate peaks in the 1020–1025 cm
region alludes to organophosphorus groups that are expected on the biomass and has previously been shown to be involved in adsorption in
Aspergillus versicolor [
14]. These observations provide a strong case for a cation exchange mechanism involving carboxyl and organophosphorus group interactions. Within this context, the findings in
Section 2.3 can be explained, where biomass previously exposed to Pb(II) has reduced adsorption capabilities due to the reduction in unoccupied active sites for cation exchange. Additionally, the observed correspondence with the pseudo first order kinetic model as well as the Langmuir isotherm are consistent with the cation exchange of Pb(II) observed by Guo et al. [
31].
4. Conclusions
By studying radial mycelium growth and batch fermentation conditions, Aspergillus piperis has shown the capacity to grow under a variety of conditions which makes it easy to propagate in ordinary environments. Adsorption also takes place effectively in a range of temperatures and pH levels (within the solubility limits of Pb(II)), without requiring exposure to Pb(II) during its growing phase. The adsorption isotherm and kinetic data can readily be described by the Langmuir isotherm, pseudo-first order, two phase PFO, and Langmuir kinetic models. Both the Langmuir isotherm and the TP PFO models support the observation that the system is relatively insensitive to temperature changes. This bodes well when considering industrial application as the system would be robust against temperature fluctuations. Diffusion kinetics suggest that internal mass transfer is a strong driving force behind kinetic observations, which appear to favour adsorption over desorption as suggested by the Langmuir kinetic model. Based on surface characterisation, the fungus displays possible adsorption mechanisms similar to other Aspergillus species involving cation exchange of Na+ and K+, as well as carboxyl and organophosphorus group interactions. Compared to other Pb(II)-adsorbing fungi, A. piperis displays remarkably good adsorption capacity, with a Langmuir of 275.82 mg g−1, which closely reflects the experimental average of 267.41 ± 19.46 mg g−1. With its ease of propagation and high adsorption capacity, A. piperis is an excellent candidate for Pb(II) bioremediation.


