Abstract
Irrigation with reclaimed water is a widespread solution to coping with water scarcity, especially in the Middle East and North Africa (MENA) region. This paper presents a systematic evaluation approach of six treatment alternatives proposed for Alexandria WWTP in Egypt as an applied example. This approach evaluates the effluent quality and cubic meter price from the proposed treatment alternatives while managing the health risks associated with reclaimed water irrigation. Rotavirus, Salmonella, Giardia duodenalis, and Ascaris were studied as waterborne pathogens. A quantitative microbial risk assessment model was used for the estimation of annual infection risks. The exposure scenarios include farmers and vegetable consumers. Activated sludge provided the lowest costs; however, it gave the lowest efficiencies and highest health risks. On the other hand, the highest efficiency and lowest health risks were obtained by the membrane bioreactor. The resulting price of a cubic meter of treated wastewater, used in irrigation, ranged from 0.082 to 0.133 USD. Irrigation using tertiary-treated wastewater achieved the target infection risk for unrestricted irrigation without using advanced treatment facilities. The results of this study could give a comprehensive view of reusing wastewater to decision-makers to address both water and food poverty not only in Egypt but also in other countries in MENA with similar economic and agro-ecological conditions.
1. Introduction
One of the major constraints to the socioeconomic sustainability of human livelihoods is water scarcity, which is the disparity between the water supply and demand. The increase in water demand is due to urbanization, population growth, changing patterns of consumption, and supply-side limiting factors, such as water pollution [1]. A reduction in precipitation by 10–20% has been predicted due to climate change [2]. Globally, the largest water demand is from the agricultural sector, accounting for around 70% of all freshwater abstractions. Reusing treated wastewater has become a main low-cost and reliable alternative. It has been considered a sustainable unconventional water resource that will increase in the future due to the continuous population increase especially in urban areas [3]. Macronutrients (nitrogen, phosphorous, and potassium) and several micronutrients (iron, zinc, manganese, and copper) are found more in wastewater than in any synthetic fertilizer, and these components are needed for optimal plant growth [4,5]. As a result, reusing these components may enhance soil structure and physical characteristics and may reduce the chemical fertilizers’ requirements [6].
On the other hand, wastewater reuse has negative impacts that include risks to human health and adjacent ecosystems due to its microbial and chemical components [7]. Excreta-related pathogens and disease agents such as bacteria, nematode eggs, viruses, and protozoa are found in high amounts in wastewater causing health risks for exposed groups. Many excreta-related pathogens have shown resistance to biological wastewater treatment processes [8]. The most affecting pathogens on public health in Egypt are Rotavirus, Salmonella, Giardia duodenalis, and Ascaris. They are considered the pathogenic indicators representing each of the major groups of organisms (i.e., bacteria, viruses, protozoa, and helminths) associated with acute and chronic public health consequences in Egypt. Wastewater irrigation can negatively impact soil properties and fertility, crop productivity, quality of groundwater, and aquatic ecosystems. The magnitude of potential effects depends on several factors such as chemical concentrations in the wastewater, solubility, and inherent toxicity [9].
To reduce the negative impacts, standards and guidelines have been adopted governing wastewater reuse in agriculture. The tolerable health risk of 1 × 10⁻⁶ Disability-adjusted life year (DALY) loss per person per year is recommended to protect public health from different exposures [8,10,11]. Quantitative microbial risk assessment (QMRA) is a probability method that integrates data on pathogen abundance, human exposure, and infection to ensure the safety of the management strategies of wastewater reuse. Quantitative health-based risk assessments incorporate hazard concentrations, dose responses, exposure assessments, and risk characterizations [12]. This framework has been used for the examination of different reuse scenarios. Farmers can become infected by accidentally swallowing soil particles that are saturated with wastewater. Moreover, consumers of crops irrigated with wastewater, especially vegetables eaten uncooked, are at risk of infection since these crops might be exposed to high and unacceptable levels of pathogens [13]. Based on the quantitative microbial risk assessment Monte Carlo program, Mara and Sleigh [14] studied the infection risks of the Rotavirus and bacterial infection while using reclaimed water in restricted and unrestricted irrigation. Hamilton [15], Mara and Sleigh [14,16], and Sant’Ana [17] used QMRA models to estimate infection risks with E. coli, Salmonella, helminths egg, and enteric viruses from irrigation with wastewater for food crops.
Globally, the evaluation and design optimization of wastewater treatment alternatives based on dynamic modeling and simulation is a common practice. Software programs such as GPS-X 8.0 (Hydromantis, Ontario, Canada), BioWin 6.2 (EnviroSim Associates Ltd., Ontario, Canada), STOAT (Sieker, Hoppegarten, Germany), SIMBA (inCTRL Solutions, Ontario, Canada), and WEST (MIKE Powered by DHI) are important tools that can be used for the quick evaluation of alternatives. They give accurate evaluations, improve design, and estimate costs by taking into account all wastewater characteristics [18]. The total cost of wastewater treatment plants includes capital costs (CAPEX) and operation and maintenance costs (OPEX). Capital costs are the expenses associated with long-term investments in assets. The operation cost of a wastewater treatment plant consists of labor cost (operational and maintenance), supervision and administration, power requirements, chemical requirements, cost of all repairs, and miscellaneous supplies and services [19].
In Egypt, the availability of water resources has become a limiting factor for the country’s development. To reduce the effects of water shortage in Egypt, sustainable water resource management practices are required. The main practice of sustainable management is to develop integrated strategies that efficiently allocate the available water to meet all demands such as wastewater reuse [20]. Many studies have looked at the estimation of cubic meters cost from treatment alternatives, but there is no indicative price per cubic meter for reclaimed water used for agriculture in Egypt. There are also several studies evaluating health risks depending on the exposure route for selected pathogens, but there has been little attention given to the most common pathogens affecting public health in Egypt and the effectiveness of low-cost treatment alternatives to achieve health risk management.
This paper attempts to provide an evaluation of six wastewater treatment alternatives for the Alexandria Western Wastewater Treatment Plant (case study). The evaluation approach has three levels: (1) evaluate the treatment efficiency and effluent quality of proposed wastewater treatment alternatives using the software GPS-X 8.0; (2) use QMRA- Monte Carlo simulations model to evaluate health risks from four common waterborne pathogens in Egypt, namely Rotavirus, Salmonella, Giardia duodenalis, and Ascaris, which analyzes the safety of wastewater reuse for farmers during irrigation practices and consumers of wastewater irrigated crops; and (3) estimate the costs of treatment alternatives, and calculate the cost per cubic meter.
2. Materials and Methods
2.1. Case Study
Alexandria Western Wastewater Treatment Plant (AWWWTP) is one of the two main existing WWTPs serving Alexandria. It is located at the western part of Alexandria on the strip of land between Alexandria western harbor and Lake Marriott. AWWWTP discharges primary treated wastewater into Lake Marriott. The proposed upgrade changes the AWWTP from primary treatment with its current capacity of 460,000 m3/day to secondary treatment of 600,000 m3/day to meet the needs up to the year 2050. Figure 1 shows the existing treatment system in Alexandria WWWTP, which includes eight coarse screening channels, eight aerated grit chambers, eight intermediate screening channels (four mechanical screens and four manual screens), and sixteen rectangular primary sedimentation tanks in two batteries. Based on AWWTP laboratory data, the influent wastewater characteristics are shown in Table 1.
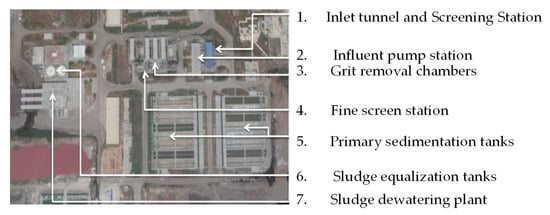
Figure 1.
Layout of existing treatment facilities in Alexandria west WWTP.

Table 1.
Influent wastewater characteristics of Alexandria west WWTP.
2.2. Treatment Alternatives under Consideration
The proposed alternatives are (1) conventional activated sludge (CAS), (2) conventional activated sludge with nitrogen removal (CAS-N), (3) membrane bioreactor (MBR), (4) membrane bioreactor with nitrogen removal (MBR-N), (5) conventional activated sludge with sand filtration (CAS-Sand), and (6) conventional activated sludge with nitrogen removal and sand filtration (CAS-N-Sand). All previous alternatives included disinfection treatments via chlorination to control excess health risks. The preliminary treatment phase of these alternatives includes two units, i.e., screens and grit chambers. Table 2 shows the design criteria and estimated dimensions of the primary and secondary sedimentation tanks, anoxic tanks, membrane bioreactor, and sand filters. Table 3 shows the design criteria and estimated dimensions of aerobic tanks (complete mix).
Table 2.
Design criteria and estimated dimensions of primary and secondary sedimentation tanks, anoxic tanks, membrane bioreactor, and sand filters.
Table 3.
Design criteria and estimated dimensions of aerobic tanks (complete mix).
2.3. Simulation Tool for Assessment of Alternatives
The GPS-X 8.0 simulation software from Hydromantis Inc. package was used to verify the obtained design of the suggested alternatives and the performance of the proposed treatment alternatives. GPS-X 8.0 software is a modular, robust, and multi-purpose modeling platform for the simulation of industrial and domestic WWTPs. The CNPLIB wastewater model was applied as a process model from the library, and BOD-based was used as an influent characterization wastewater model. Verification processes were performed by examining process unit sizes using the performance of the proposed treatment alternatives to ensure the accuracy of the plants to reach the effluent quality requirements. The required input data contain physical and operational plant data, kinetic and stoichiometric model parameters, flow rate, and influent wastewater characteristics. Figure 2 shows the layouts of the alternatives that were used for simulation. After drawing the units, entering their data, and entering the flow rate and wastewater characteristics (influent advisor), the simulation begins and the required results are obtained [21]. Table 4 presents the main data of the influent advisor that are used to input the wastewater characteristics. It consists of three parts: User Inputs, State Variables, and Composite Variables.
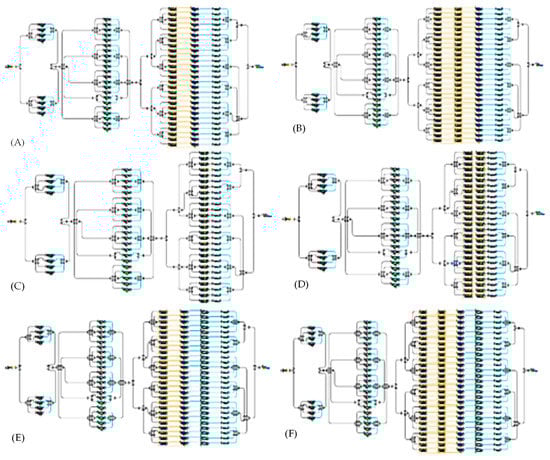
Figure 2.
Layouts of the proposed alternatives used in the GPS-X 8.0 program: (A) CAS, (B) CAS-N, (C) MBR, (D) MBR-N, (E) CAS-Sand, and (F) CAS-N-Sand.
Table 4.
Influent advisor showing the main influent wastewater characterization in GPS-X 8.0.
2.4. Quantitative Microbial Risk Assessment
The enhanced Karavarsamis–Hamilton method was used to estimate the annual infection risks from the QMRA model for farmer and consumer exposure scenarios. The model was simulated for a series of 10,000 iterations using Monte Carlo simulation for a variety of wastewater qualities. The quantitative microbial risk assessment, a Monte Carlo computer program add-on to Excel, was used for the simulation. The tolerable health risk defined as 10−6 DALY loss per person per year is sufficient for health protection from wastewater different exposures [8,11,22]. The quantitative assessment of health-based risk framework incorporates hazard identification, exposures assessment, dose–response assessments, and risk characterization as follows:
2.4.1. Hazard Identification
The infection risks for Rotavirus, Salmonella, Giardia duodenalis, and Ascaris were assessed using the QMRA model. These pathogens are the most affecting public health in Egypt.
2.4.2. Exposure Assessment
Two scenarios of exposure were assessed:
- Accidental ingestion of saturated soil particles contaminated with wastewater by farmers and field workers. The exposure occurs through labor-intensive agriculture and no pathogen die-off [8].
- Consumers’ consumption of crops that are irrigated with wastewater and that are eaten uncooked. Globally, according to FAO statistics, tomatoes are the most essential vegetable, with crop production at about 15% of total vegetable production so tomatoes were selected in the current study as a key crop. The consumption of raw tomatoes in Africa reaches 60 kg per year per capita [23].
2.4.3. Dose–Response Assessment
The dose–response model establishes the relationship between the pathogen dose, and the incidence and likelihood of exposed population infection. The β-Poisson dose–response model used for Rotavirus, Salmonella, and Ascaris is represented in Equation (1) [24,25,26]. The exponential model used for Giardia duodenalis (based on experimental data) is presented in Equation (2) [27].
where PI (d) is the pathogen risk of infection, N50 is the median infection dose equivalent to the number of organisms that would infect 50 percent of the total exposed population (N50 = 6.17 for Rotavirus, 23,600 for Salmonella, and 859 for Ascaris), and α and r are the pathogen infectivity constants (α = 0.253 for Rotavirus, 0.3126 for Salmonella, and 0.104 for Ascaris and r = 0.0199 for Giardia duodenalis).
PI (d) = 1 − e(−rd)
2.4.4. Risk Characterization
The typical concentration of E. coli in wastewater is 108 E. coli/100 mL [8]. The infection risk from n days of exposures for a single-exposure dose per year (d) is presented in Equation (3) [28]
PI (A) (d) = 1 − [1 − PI (d)] n
2.5. Pathogen Reduction
According to the WHO (2006), the achievement of pathogen reduction depends on both treatment alternatives and post-treatment scenarios. Drip irrigation represents a trend in Egypt to rationalize water consumption in order to face water poverty. In Alexandria Governorate, 30,000 feddans of flood irrigation have been diverted to drip irrigation since 2020. The drip irrigation effectiveness is 2-4 (2) log units in pathogen reduction [8].
2.6. Simulation Tool for Economic Analysis
The CapdetWorks 4.0 program from the Hydromantis Inc. package, Ontario, Canada was used to estimate total project costs, and maintenance, materials, chemicals, and energy were calculated for treatment alternatives. CapdetWorks software is an enhancement of the CAPDET model (United States Environmental Protection Agency 1982). Hydromantis added several unit operations that were not originally included in the CAPDET model [29]. The first step in using CapdetWorks v 4.0 is to draw units; then enter their data, flow rate, unit costs, and wastewater characteristics; and after that, extract the results of the capital and operating costs. Layouts of the treatment alternatives are shown in Figure 3. There are three sedimentation tanks in each layout that represents two types of existing rectangular primary sedimentation tanks and new circular primary sedimentation tanks. Table 5 shows current unit prices input data (based on the annual cost indices in Egypt in 2020).
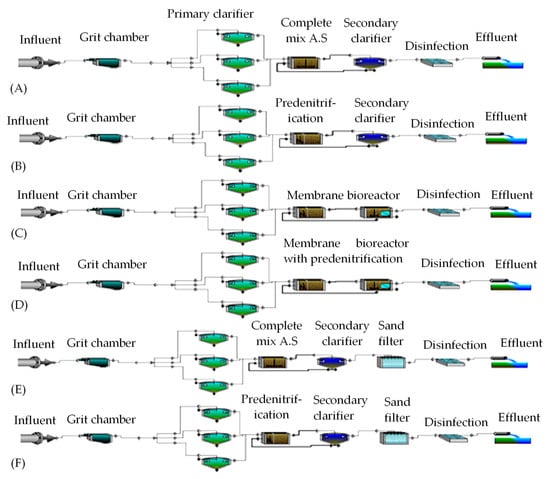
Figure 3.
Layout of treatment alternatives in CapdetWorks 4.0: (A) CAS, (B) CAS-N, (C) MBR, (D) MBR-N, (E) CAS-Sand, and (F) CAS-N-Sand.
Table 5.
Unit costs input into the CapdetWorks 4.0 program *.
3. Results and Discussion
3.1. Simulated Performance of Proposed WWTPs
The GPS-X 8.0 simulation program was used to simulate and verify the proposed treatment alternatives’ performances. The effluent concentrations obtained from the process model were compared with the effluent requirements. Figure 4 shows the effluent concentrations in mg/L as obtained from the proposed treatment alternatives using GPS-X 8.0 simulation program. Membrane bioreactor with nitrogen removal treatment alternative has the highest removal efficiencies. The highest concentrations of COD, BOD5, TSS, and TN are 38.71, 7.35, 13.6, and 22.85 mg/L, respectively, obtained from the activated sludge alternative. Effluent quality from the treatment alternatives agrees with the typical effluent quality obtained by Metcalf and Eddy, 5th edition [30]. The COD removal efficiencies of CAS and MBR are 95 and 97%, respectively, which are the same percentages obtained by Valderrama [31]. The COD, TSS, and TN removal efficiencies of MBR are 97, 99, and 60%, respectively, which are similar to those obtained by Bertanza [32]. The COD and BOD removal efficiencies by tertiary sand filtration from CAS-Sand and CAS-N-Sand alternatives are 30 and 56%, respectively, which are in the range obtained by Hamoda [33]. The BOD and TSS effluent concentrations obtained from the treatment alternatives are in the range of 2.5–7.35 mg/L and 1–13.6 mg/L, respectively, which are lower than 15 mg/L (accepted for the Egyptian code for reuse of treated sewage water in irrigation and use of sludge in agriculture 501/2015).
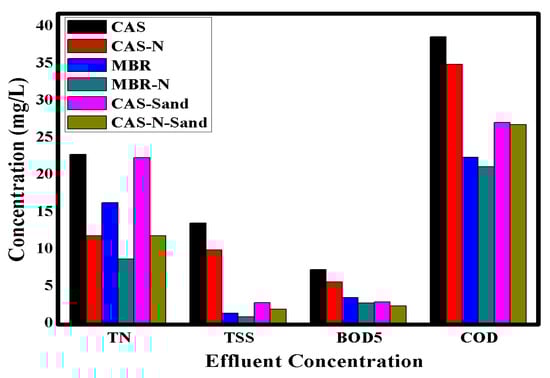
Figure 4.
Effluent concentrations (mg/L) of the proposed treatment alternatives from GPS-X 8.0.
3.2. Pathogen Reduction
Table 6 shows the average pathogen reduction efficiencies of the key pathogens for the proposed wastewater treatment alternatives. The high removal efficiency of protozoa and helminths (6 log reduction) from MBR because micro-filtration membranes have pore sizes ranging from 0.1 to 1 μm, which are significantly smaller than the pore size of protozoa and helminths. Due to the relative size of viruses to micro-filtration membranes, there is a concern about the removal of viruses, which could be removed by disinfection [34]. Valderrama [31] found that the effluent from membrane filtration combined with disinfection processes in Spain met the water reuse standards for agricultural and recreational uses. The effectiveness of drip irrigation equals 2 log units’ removal as a reduction in pathogens. Other control measures such as produce washing, peeling, and cooking depend on consumer practices and were not considered in this study.
Table 6.
Pathogen reduction achieved by wastewater treatment alternatives for key pathogens.
3.3. QMRA Model Outcomes
3.3.1. Maximum Tolerable Infection Risks
The tolerable infection risks for Salmonella, Rotavirus, Giardia duodenalis, and Ascaris equal 2.3 × 10⁻⁵, 1.43 × 10⁻³, 6 × 10⁻⁴, and 1.2 × 10⁻⁴ per person per year (pppy), respectively for a tolerable DALY loss of ≤ 1 × 10⁻⁶, as shown in Table 7. Mara and Sleigh [16] estimated the tolerable infection risk for Ascaris as 1.2 × 10⁻³ pppy, which is higher than the tolerable infection risk in the study because, in Mara’s study, the tolerable DALY loss was 10−5 pppy.
Table 7.
Tolerable infection risks for key pathogens.
3.3.2. QMRA and Monte Carlo Simulation Outputs
Table 8 and Table 9 present the QMRA model outputs, which are the annual infection risks associated with the direct use of wastewater without treatment for Salmonella, Rotavirus, Giardia duodenalis, and Ascaris. The infection risks estimated using the QMRA model were compared with the tolerable risks to estimate log reduction, which is needed to comply with the health-based target. For Salmonella, Rotavirus, Giardia duodenalis, and Ascaris, log unit reduction of 1, 3, 1, and 2 are required from the treatment units in restricted irrigation while 2, 4, 2, and 4 are required in unrestricted irrigation.
Table 8.
Restricted and unrestricted irrigation annual infection risks estimated by QMRA and 10,000 trial Monte Carlo simulations.
Table 9.
Restricted and unrestricted irrigation annual infection risks for Ascaris estimated by QMRA and 10,000 trial Monte Carlo simulations.
3.4. Treatment Effectiveness Verification
The achieved infection risks from treatment alternatives combined with drip irrigation are presented in Table 10. These infection risks were found to be lower than the tolerable infection risks for Salmonella, Rotavirus, Giardia duodenalis, and Ascaris, which are 2.3 × 10⁻⁵, 7.6 × 10⁻⁴, 6 × 10⁻⁴ and 1.2 × 10⁻⁴ pppy, respectively. According to this table, log reductions from treatment alternatives are sufficient for health protection according to guidelines by the WHO [8], the Australian guideline [10], and the EU level [11]. Treatment alternatives give wastewater qualities below the limit of Grade A treatment in the Egyptian code (100 E. coli per 100 mL and 1 Ascaris eggs/L). Based on those results, all proposed treatment alternatives achieved the required pathogen reduction.
Table 10.
Median infection risks pppy for proposed treatment alternatives combined with drip irrigation.
3.5. Simulated Cost Analysis
3.5.1. Capital Costs
The capital costs in the CapdetWorks 4.0 program were estimated in three categories, i.e., unit process costs, other direct units’ costs, and other indirect units’ costs. Figure 5 provides a comparison of those costs for the six proposed treatment alternatives. The unit process costs of MBR are about 1.7 the CAS costs; this may be attributed to the additional costs of membranes, pumps, and blowers, which match the results obtained by Bertanza [32]. Mobilization, site preparation, site electrical, yard piping, instrumentation and control, lab, and administration buildings are the elements of the ‘other direct construction costs’ category. The ‘other direct construction costs’ category is the same for the six proposed treatment alternatives because all its constituent elements are equal. Figure 6 shows the total capital costs of the treatment alternatives. Costs of the treatment alternatives with anoxic tanks are about 1.25 times the cost without anoxic tanks, which is close to the percentage obtained by Arif [18]; this may be attributed to the additional construction costs of the anoxic tanks.
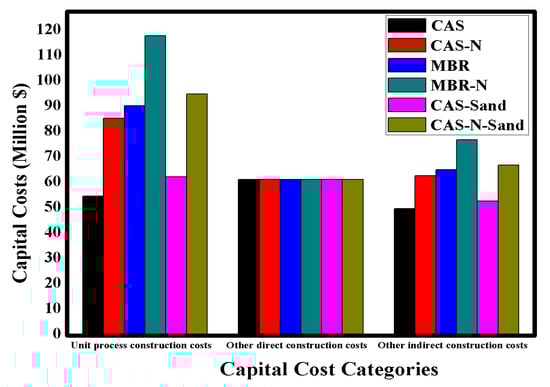
Figure 5.
Capital costs categories of the proposed treatment alternatives obtained from CapdetWorks 4.0.
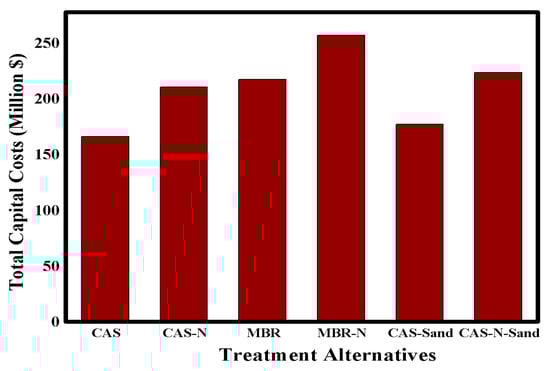
Figure 6.
Total capital costs for treatment alternatives from CapdetWorks 4.0.
3.5.2. Operation and Maintenance
The annual operation and maintenance cost categories in CapdetWorks 4.0 are operation labor (administration, laboratory, and unit process operation labor cost), maintenance labor, energy, chemicals, and materials. Figure 7 provides a comparison of the treatment alternatives based on the O&M cost categories. MBR provides the highest energy costs due to the higher energy consumption of the membrane pumps than those used in the CAS. MBR is higher than CAS and CAS-sand systems in terms of the O&M labor costs because MBR is a sensitive technology that requires qualified labor. The MBR system is highly influenced by contaminants contained in the feed water, which can produce various forms of fouling [18,39].
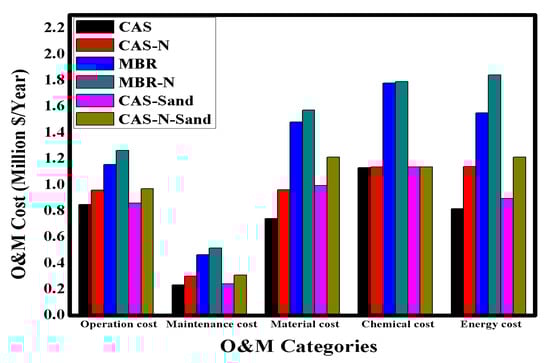
Figure 7.
Operation and maintenance cost categories for treatment alternatives from CapdetWorks 4.0.
The total costs of operation and maintenance are shown in Figure 8. The operation and maintenance costs of systems with membrane filtration are higher than those without membranes due to the costs of the membrane replacement, chemicals required for membrane cleaning, higher energy usage, and more operation and maintenance labor required for MBR. The total operation and maintenance cost of MBR is about 70% higher than CAS, which is similar to the percentages obtained by Bertanza [32] and Smith [40].
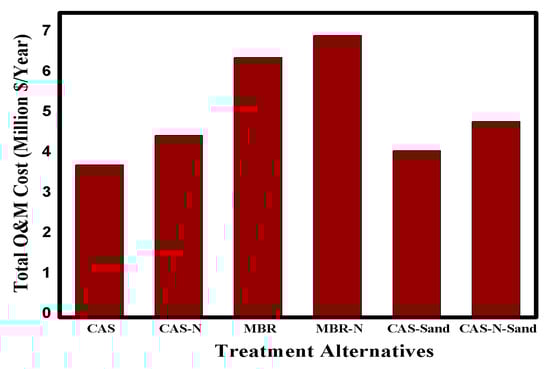
Figure 8.
Total operation and maintenance costs for treatment alternatives from CapdetWorks 4.0.
3.5.3. Cost per Cubic Meter of Wastewater Flow
The following relation is used to estimate the annualized construction cost: annualized construction cost = total construction cost × CRF. The capital recovery factor (CRF) is a factor that divides the capital costs of the project cost into annual payments [18]. CRF is estimated from the following equation: (Low Emissions Analysis Platform (LEAP))
The interest rate is 8.25% in Egypt from 16/11/2020 (Egypt Central Bank key rates). The project planning period is 40 years. The cubic meter price of the six proposed treatment alternatives is shown in Table 11. According to this table, it could be indicated that the direct cost to treat a cubic meter of wastewater for agricultural purposes in Egypt ranges from 0.082 USD to 0.133 USD. The cost of a cubic meter of the treated wastewater from the CAS (activated sludge) alternative is 0.082 USD, which is lower than the cost of a cubic meter that was estimated by WHO/CEHA [41] for activated sludge WWTPs in Egypt (0.12 USD) because the cost of conveyance and pumping is not included in the estimation of cubic meter cost. The cost of a cubic meter of treated wastewater from the CAS-Sand (activated sludge with sand filter) alternative is 0.088 USD which is in the range (0.07–0.1 USD) obtained by ALMAR [42] for Mediterranean countries.
Table 11.
Cost of cubic meter for treatment alternatives.
3.6. Overall Assessment of Proposed Alternatives
Table 12 shows a summary of effluent quality, cubic meter price, and acceptability of effluent usage in irrigation with health risk management. The treatment alternatives give wastewater qualities acceptable for the Egyptian code for reuse of treated sewage water in irrigation and for the use of sludge in agriculture 501/2015 and other guidelines set by the WHO [8], the Australian guideline [10], and the EU level [11] with the price of a cubic meter ranging from 0.082 to 0.133 USD. The CAS treatment alternative provides effluents with suitable characteristics for restricted irrigation with a cost per cubic meter of 0.082 USD. Using activated sludge with sand filtration provides effluent that is acceptable for unrestricted irrigation with a cost per cubic meter of 0.088 USD.
Table 12.
Summary of results for the treatment alternatives.
4. Conclusions
This paper aimed to evaluate the restricted and the unrestricted treatment alternatives’ efficiencies, estimating the cubic meter cost of reclaimed water that can be used in irrigation and managing health risks to achieve the target annual infection risk. The CAS, CAS-N, MBR, MBR-N, CAS-Sand, and CAS-N-Sand treatment alternatives were evaluated using simulation programs to estimate effluent quality, cost, and health risks. The GPS-X 8.0 simulation program was used to verify the designed processes. CapdetWorks 4.0 program was used to estimate the treatment alternatives costs. Log unit reductions from treatment and post-treatment were checked to be sufficient in reducing infection risks estimated using the QMRA model to tolerable risks.
Based on the value of pathogen concentrations in wastewater in Egypt, it can be noticed that both Salmonella and Giardia duodenalis, compared with Rotavirus and Ascaris, seem to have limited significance when reclaimed water is utilized for irrigation. Therefore, under the investigation conditions used in this study, only Rotavirus and Ascaris can be used for the evaluation and comparison of the public health protection effectiveness of different treatment alternatives. This study indicated that irrigation with tertiary treated wastewater can achieve the target microbial risk reduction for unrestricted irrigation (one DALY loss per million people per year) without the need to add advanced treatment facilities. Although activated sludge alternative gave higher health risks than other alternatives, it produced an effluent with appropriate qualities that can be used in restricted irrigation.
Based on the results of this study, it can be concluded that the cubic meter cost of wastewater treatment for agricultural purposes in Egypt was estimated and ranges from 0.082 USD to 0.133 USD. Using activated sludge with sand filtration provides effluent with suitable characteristics for unrestricted irrigation with a small cost per cubic meter of 0.088 USD. Although CAS provides the lowest capital and O&M costs, it gives lower efficiencies and higher health risks than other treatment alternatives. The usage of membrane filtration provides higher protection from health risks, especially those caused by Giardia duodenalis and Ascaris. Membrane filtration also gave higher removal efficiencies and a lower footprint, but it requires higher construction and running costs.
Usage of the GPS-X 8.0 and CapdetWorks 4.0 programs was very helpful in verifying the process performance for treatment alternatives and in estimating the costs of the treatment alternatives. It is necessary to investigate pathogen concentration in further research and to test the effectiveness of different treatments in pathogen removal for different case studies. The GPS-X 8.0 and CapdetWorks 4.0 programs should be tested in other case studies with different conditions; the wastewater flow, wastewater characterizations, and results should be compared to results obtained by other simulation programs.
Author Contributions
S.A., analysis and writing—original draft preparation; M.T.S. and S.A.A.A., supervision and writing—review of the manuscript and editing. All authors have read and agreed to the published version of the manuscript.
Funding
This research received no external funding.
Institutional Review Board Statement
Not applicable.
Informed Consent Statement
Not applicable.
Data Availability Statement
Not applicable.
Acknowledgments
The authors are grateful to Hydromantis Inc., Ontario, Canada.
Conflicts of Interest
The authors declare no conflict of interest.
References
- Bedawy, R. Water Resources Management: Alarming Crisis for Egypt. J. Manag. Sustain. 2014, 4, 108–124. [Google Scholar] [CrossRef]
- Hertel, T. Food security under climate change. Nat. Clim. Chang. 2015, 6, 10–13. [Google Scholar] [CrossRef]
- Winpenny, J.; Heinz, I.; Koo-Oshima, S. The Wealth of Waste: The Economics of Wastewater Use in Agriculture; Food and Agriculture Organization of the United Nations (FAO): Roma, Italy, 2010. [Google Scholar]
- Qadir, M.; Wichelns, D.; Raschid-Sally, L.; Minhas, P.; Drechsel, P.; Bahri, A.; McCornick, P. Agricultural use of marginal—Quality water—Opportunities and challenges. In Water for Food, Water for Life: A Comprehensive Assessment of Water Management in Agriculture; Molden, D., Ed.; Earthscan: London, UK, 2007; Volume 4, pp. 425–453. [Google Scholar]
- Mojid, M.; Wyseure, G.; Biswas, S. Requirement of nitrogen, phosphorus and potassium fertilizers for wheat cultivation under irrigation by municipal wastewater. Soil Sci. Plant Nutr. 2012, 12, 655–665. [Google Scholar] [CrossRef][Green Version]
- Chojnacka, K.; Witek-Krowiak, A.; Moustakas, K.; Skrzypczak, D.; Mikula, K.; Loizidou, M. A transition from conventional irrigation to fertigation with reclaimed wastewater: Prospects and challenges. Renew. Sustain. Energy Rev. 2020, 130, 109959. [Google Scholar] [CrossRef]
- Jaramillo, M.; Restrepo, I. Wastewater Reuse in Agriculture: A Review about Its Limitations and Benefits. Sustainability 2017, 9, 1734. [Google Scholar] [CrossRef]
- World Health Organization. Guidelines for the Safe Use of Wastewater, Excreta and Greywater; WHO: Geneva, Switzerland, 2006; Volume 1, pp. 19–45. [Google Scholar]
- Singh, A.; Agrawal, M. Effects of Wastewater Irrigation on Physical and Biochemical Characteristics of Soil and Metal Partitioning in Beta vulgaris L. Agric Res. 2012, 1, 379–391. [Google Scholar] [CrossRef]
- EPHC; NRMMC; AHMC. Australian Guidelines for Water Recycling: Managing Health and Environmental Risks (Phase 1). In Proceedings of the Environment Protection and Heritage Council, the Natural Resource Management Ministerial Council & the Australian Health Ministers’ Conference, Canberra, Australia, November 2006; pp. 83–119. [Google Scholar]
- Alcalde-Sanz, L.; Gawlik, M. Minimum Quality Requirements for Water Reuse in Agricultural Irrigation and Aquifer Recharge—Towards a Water Reuse Regu-Latory Instrument at EU Level; Publications Office of the European Union: Luxembourg, 2017; pp. 10–33. [Google Scholar]
- Sano, D.; Haas, C.; Rose, J. A QMRA Framework for Sanitation Treatment Decisions. In Part 1: The Health Hazards of Excreta: Theory and Control; UNESCO: Paris, France, 2019. [Google Scholar]
- Mara, D.; Sleigh, A.; Blumenthal, U.; Carr, R. Health risks in wastewater irrigation: Comparing estimates from quantitative microbial risk analyses and epidemiological studies. J. Water Health 2007, 5, 39–50. [Google Scholar] [CrossRef]
- Mara, D.; Sleigh, A. Understanding and Updating the 2006 WHO Guidelines for the Safe Use of Wastewater in Agriculture. In Proceedings of the Jornadas Sobre la Reutilización de Aguas Regeneradas: Cuestiones Actuales y Retos de Futuro Conference, Murcia, Spain, 1–2 June 2009. [Google Scholar]
- Hamilton, J.; Stagnitti, F.; Premier, R.; Boland, A.; Hale, G. Quantitative Microbial Risk Assessment Models for Consumption of Vegetables Irrigated with Reclaimed Water. Appl. Environ. Microbiol. 2006, 75, 3284–3290. [Google Scholar] [CrossRef] [PubMed]
- Mara, D.; Sleigh, A. Estimation of Ascaris infection risks in children under 15 from the consumption of wastewater-irrigated carrots. J. Water Health 2010, 8, 8–35. [Google Scholar] [CrossRef]
- Sant’Ana, A.; Franco, B.; Schaffner, D. Risk of infection with Salmonella and Listeria monocytogenes due to consumption of ready-to-eat leafy vegetables in Brazil. Food Control 2014, 42, 1–8. [Google Scholar] [CrossRef]
- Arif, A.; Sorour, M.; Aly, S. Cost analysis of activated sludge and membrane bioreactor WWTPs using CapdetWorks simulation program: Case study of Tikrit WWTP (middle Iraq). Alex. Eng. J. 2020, 59, 4659–4667. [Google Scholar] [CrossRef]
- Sethi, S.; Wiesner, M. Cost Modeling and Estimation of Crossflow Membrane Filtration Processes. Env. Eng. Sci. 2000, 17, 61–79. [Google Scholar] [CrossRef]
- Allam, M.; Allam, G. Water Resources in Egypt: Future Challenges and Opportunities. Water Int. 2007, 32, 205–218. [Google Scholar] [CrossRef]
- Abbasi, N.; Ahmadi, M.; Naseri, M. Quality and cost analysis of a wastewater treatment plant using GPS-X and CapdetWorks simulation programs. J. Environ. Manag. 2021, 284, 111993. [Google Scholar] [CrossRef]
- World Health Organization. Quantitative Microbial Risk Assessment: Application for Water Safety Management; WHO: Geneva, Switzerland, 2016. [Google Scholar]
- Elgallal, M. Development of an Approach for the Evaluation of Wastewater Reuse Options for Arid and Semi-arid Area. Ph.D. Thesis, University of Leeds, Leeds, UK, 2017. [Google Scholar]
- Ward, R.; Bernstein, D.; Young, E.; Sherwood, J.; Knowlton, D.; Schiff, G. Human rotavirus studies in volunteers: Determination of infectious dose and serological response to infection. J. Infect. Dis. 1986, 154, 871–880. [Google Scholar] [CrossRef] [PubMed]
- Haas, C.; Rose, J.; Gerba, C. Quantitative Microbial Risk Assessment; John Wiley and Sons: New York, NY, USA, 1999. [Google Scholar]
- Navarro, I.; Jiménez, B.; Lucario, S.; Cifuentes, E. Application of helminth ova infection dose curve to estimate the risks associated with biosolid application on soil. J. Water Health 2009, 7, 31–44. [Google Scholar] [CrossRef]
- Rendtorff, R. The experimental transmission of human intestinal protozoan parasites II. Giardia lamblia cysts given in capsules. Am. J. Epidemiol. 1954, 59, 209–222. [Google Scholar] [CrossRef]
- Sakaji, R.; Funamizu, N. Microbial risk assessment and its role in the development of wastewater reclamation policy. Wastewater Reclam. Reuse 1998, 10, 705–756. [Google Scholar]
- Jafarinejad, S. Comparison of the Full-Scale Municipal Wastewater Treatment Plant Designs Consisting of Modified Bardenpho Process with and Without Membrane Bioreactor for Nutrient Removal: Cost Analysis. In Proceedings of the International Conference on Sustainable Development of Water and Environment, Bangkok, Thailand, 12 March 2021; Jeon, H.Y., Ed.; Environmental Science and Engineering, Springer: Cham, Switzerland, 2021; pp. 47–63. [Google Scholar]
- Tchobanoglous, G.; Burton, F.; Tsuchihashi, R.; Stensel, D. Wastewater Engineering: Treatment and Resource Recovery, 4th ed.; Metcalf & Eddy Inc.: Boston, MA, USA; McGraw-Hill Professional: New York, NY, USA, 2003; pp. 1369–1383. [Google Scholar]
- Valderrama, C.; Ribera, G.; Bahi, N.; Rovira, M.; Gimenez, T.; Nomen, R.; Lluch, S.; Yuste, M.; Martinez-Llado, X. Winery wastewater treatment for water reuse purpose: Conventional activated sludge versus membrane bioreactor (MBR): A comparative case study. Desalination 2012, 306, 1–7. [Google Scholar] [CrossRef]
- Bertanza, G.; Canato, M.; Laera, G.; Vaccari, M.; Svanström, M.; Heimersson, S. A comparison between two full-scale MBR and CAS municipal wastewater treatment plants: Techno-economic-environmental assessment. Env. Sci. Pollut. Res. 2017, 24, 17383–17393. [Google Scholar] [CrossRef]
- Hamoda, M.; Al-Ghusain, I.; Nayef, N. Sand filtration of wastewater for tertiary treatment and water reuse. Desalination 2004, 164, 203–211. [Google Scholar] [CrossRef]
- Riley, T.; Hai, F.; Shawkat, S.; Magram, S.; Yamamoto, K. Removal of Pathogens by Membrane Bioreactors: A Review of the Mechanisms, Influencing Factors and Reduction in Chemical Disinfectant Dosing. Water 2014, 6, 3603–3630. [Google Scholar]
- Rose, J.B.; Farrah, S.R.; Harwood, V.J.; Levine, A.D.; Lukasik, J.; Menendez, P.; Scott, T.M. Reduction of Pathogens, Indicator Bacteria, and Alternative Indicators by Wastewater Treatment and Reclamation Processes; Final Report; Water Environment Research Foundation; IWA Publishing: London, UK, 2005; pp. 3-1–3-29. [Google Scholar]
- Jiménez, B.; Mara, D.; Carr, R.; Brissaud, F. Wastewater Treatment for Pathogen Removal and Nutrient Conservation: Suitable Systems for Use in Developing Countries; Reports H042608; IWMI (International Water Management Institute): Colombo, Sri Lanka, 2010. [Google Scholar]
- Bastian, R.; Murray, D. Guidelines for Water Reuse; EPA/600/R-12/618; US EPA Office of Research and Development: Washington, DC, USA, 2012. [Google Scholar]
- Kirk, D.; Pires, S.; Black, R.; Caipo, M.; Crump, J.; Devleesschauwer, B.; Döpfer, D.; Fazil, A.; Fischer-Walker, L.; Hald, T. World Health Organization Estimates of the Global and Regional Disease Burden of 22 Foodborne Bacterial, Protozoal, and Viral diseases, 2010: A Data Synthesis. PLoS Med. 2015, 12, e1001940. [Google Scholar]
- Zioui, D.; Tigrine, Z.; Aburideh, H.; Hout, S.; Abbas, M.; Kasbadji, N. Membrane Technology for Water Treatment Applications. In Proceedings of the International Conference on Communication, Computing and Electronics Systems, Istanbul, Turkey, 9–12 January 2015. [Google Scholar]
- Smith, D. Treating Wastewater in a Conventional Activated Sludge (CAS) System or a Membrane Bioreactor (MBR): A Comparison of Capital and Operating Costs. Master’s Thesis, University of Cape Town, Cape Town, South Africa, 2020. [Google Scholar]
- World Health Organization. Regional Office for the Eastern Mediterranean. A Regional Overview of Wastewater Management and Reuse in the Eastern Mediterranean Region; WHO, Regional Office for the Eastern Mediterranean, Regional Centre for Environmental Health Activities (CEHA): Geneva, Switzerland, 2005. [Google Scholar]
- ALMAR. Desalination Technologies and Economics: CAPEX, OPEX & Technological Game Changers to Come. In Proceedings of the Mediterranean Regional Technical Meeting, Marseille, France, 12–14 December 2016; Center for Mediterranean Integration (CMI): Marseille, France, 2016. [Google Scholar]
Publisher’s Note: MDPI stays neutral with regard to jurisdictional claims in published maps and institutional affiliations. |
© 2021 by the authors. Licensee MDPI, Basel, Switzerland. This article is an open access article distributed under the terms and conditions of the Creative Commons Attribution (CC BY) license (https://creativecommons.org/licenses/by/4.0/).