Article

An Air Route Network Planning Model of Logistics UAV Terminal Distribution in Urban Low Altitude Airspace

College of Civil Aviation, Nanjing University of Aeronautics and Astronautics, Nanjing 210016, China
*
Author to whom correspondence should be addressed.
Sustainability 2021, 13(23), 13079; https://doi.org/10.3390/su132313079
Submission received: 21 October 2021 / Revised: 17 November 2021 / Accepted: 23 November 2021 / Published: 25 November 2021

Abstract

:
Traditional terminal logistics distribution in urban areas is mainly concentrated on the ground, which leads to increasingly serious air pollution and traffic congestion. With the popularization of unmanned aerial vehicle (UAV) techniques and the reform of low altitude airspace, terminal logistics distribution is expected to be carried out by drones. Therefore, it is of great significance to construct a reasonable air route network for logistics UAV to ensure the safety and efficiency of operations. In this paper, a single route planning model and an air route network planning model for UAV were constructed by fully considering the complex urban low altitude environment, the flight performance of UAV and the characteristics of logistics tasks to regulate the flights of drones. Then, taking Jiangjun Road Campus of Nanjing University of Aeronautics and Astronautics as an example, the improved cellular automata (CA) was adopted to search for the optimal route between different waypoints, and the optimal spanning tree algorithm was used to construct the route network. The experimental results demonstrated that the improved CA could greatly reduce search time and obtain the optimal route while enhancing safety. With the satisfaction of the voyage, the needs of logistics and distribution constraints, a network that had smaller intersection points and redundancy was generated. The models and core ideas proposed in this paper can not only regulate operation of drones but also provide a solid foundation for the distribution of logistics UAV in the future.

1. Introduction

In the information age, UAV logistics, as a rapidly developing new strategic industry, has shown great virtues in both military and civilian fields. In the civilian sector, with the development of e-commerce and the aggravation of distribution demand, the traditional distribution mode of supply centers and couriers gradually has shown defects. Issues such as road congestion, air pollution and low distribution efficiency brought by the last mile community terminal distribution cannot be ignored. Therefore, UAV logistics has become a new distribution mode with broad prospects and vast audiences, driving the iterative update of logistics UAV technology.
UAV logistics belongs to the domain of Urban Air Mobility (UAM) [1]. It is defined by NASA as a safe and efficient urban air traffic system, which is a significant support for social and economic activities and the essence of future urban construction and development [2]. With the vigorous expansion of technologies such as autonomous driving, 5G communications, and electric propulsion [3], Uber [4], Airbus [5], NASA [6], Ehang [7] and other companies have proposed UAM concepts successively. In addition, they are expanded with Electric Vertical Take-off and Landing (eVTOL) as the main vehicle. With regard to the logistics field in UAM, Amazon [8], DHL [9], JD [10] and other enterprises have successively attempted to deliver parcels by drones in order to seize opportunities in this emerging field. In the outbreak of COVID-19 in 2020, the unique strengths of UAV, such as non-contact service and flexibility, forged its core competitiveness in the logistics field. RAND Corporation predicts that by 2030, drones will replace more than 20% of ground logistics distribution [11]. By then, it will not be surprising to see drones delivering packages over cities, and logistics drone operations will become normal.
Based on previous research, air route network planning can be divided into two categories: the local air route network planning and the global air route network planning. The former is the local optimization and/or adjustment of segments and nodes based on the optimization theory; the latter is to abandon the existing network and construct a new layout in a certain region [12]. At present, the air route network of UAV terminal distribution has not been formed, so it belongs to the latter. It can generally be transformed into a path search problem in state space, and a search algorithm is adopted to solve the route [13]. A wide array of methods have been used on this issue. In [14,15], the improved A* algorithm was established to solve the route planning model of low-altitude logistics UAV with multiple restriction conditions. The particle swarm optimization algorithm was proposed for the first time in [16]. Then, multi-intelligent particle filter on this basis was created to deal the path planning issue in unknown environment in [17]. Based on the improved ant colony algorithm, the route of single drone was constructed in [18,19]. It shows that the improved algorithm can greatly improve search efficiency and reduce path redundancy. In [20], the same algorithm was adopted to plan routes for cluster drones. Another method called CA aims to settle the network node optimization problem of avoiding the three areas. In [21], three air routes in Beijing flight information area were taken as examples to verify the effectiveness of the CA. However, the previously mentioned researches only planning a single route, and there are few studies on the air route network. In addition, the influencing factors considered in the planning are relatively simple, and the constraints of the UAV’s performance and external operating environment are not fully considered.
Therefore, this paper proposes an air route network planning method based on improved CA and optimal spanning tree after considering the characteristics of urban low altitude environment and the operational limitations of logistics UAV. Firstly, the three-dimensional modeling of the planned region is carried out by using the grid method to construct the low altitude grid environment. Then, under the constraints of complex low altitude environment and UAV performance, an improved CA based on cost function is raised to search for the optimal route between target points, thus generating the optimal route set. After that, according to the regional logistics needs and operational features of service providers, the optimal spanning tree is adopted to select the routes from the set. Finally, the air route network for trunk and branch is constructed. Multiple indicators are selected to conduct comprehensive evaluation and analysis to ensure the rationality and scientificity of the network.

2. Models

With the support of detailed traffic flow data, the planning method for the air route network in high altitude has been very mature,. However, since China has not adopted UAV to carry out logistics transportation on a large scale, the research on the route network of urban low-altitude logistics UAV is still in the initial stage, and detailed flow data cannot be obtained. The environment at low altitude is more complex, with more obstacles and protection zones than at high altitude. Traditional route network planning is mainly aimed at high-altitude areas without obstacles. The main restrictions at high-altitude are bad weather, military restricted zones and so on. Low-altitude route planning has not only the basic factors of high-altitude areas, but also the avoidance of dense buildings, trees and other factors in low-altitude areas. Therefore, the traditional route network planning method is not suitable for the urban low-altitude logistics UAV route network planning. Without the support of traffic flow data, the route network planning was divided into two steps: single air route planning and air route network planning.

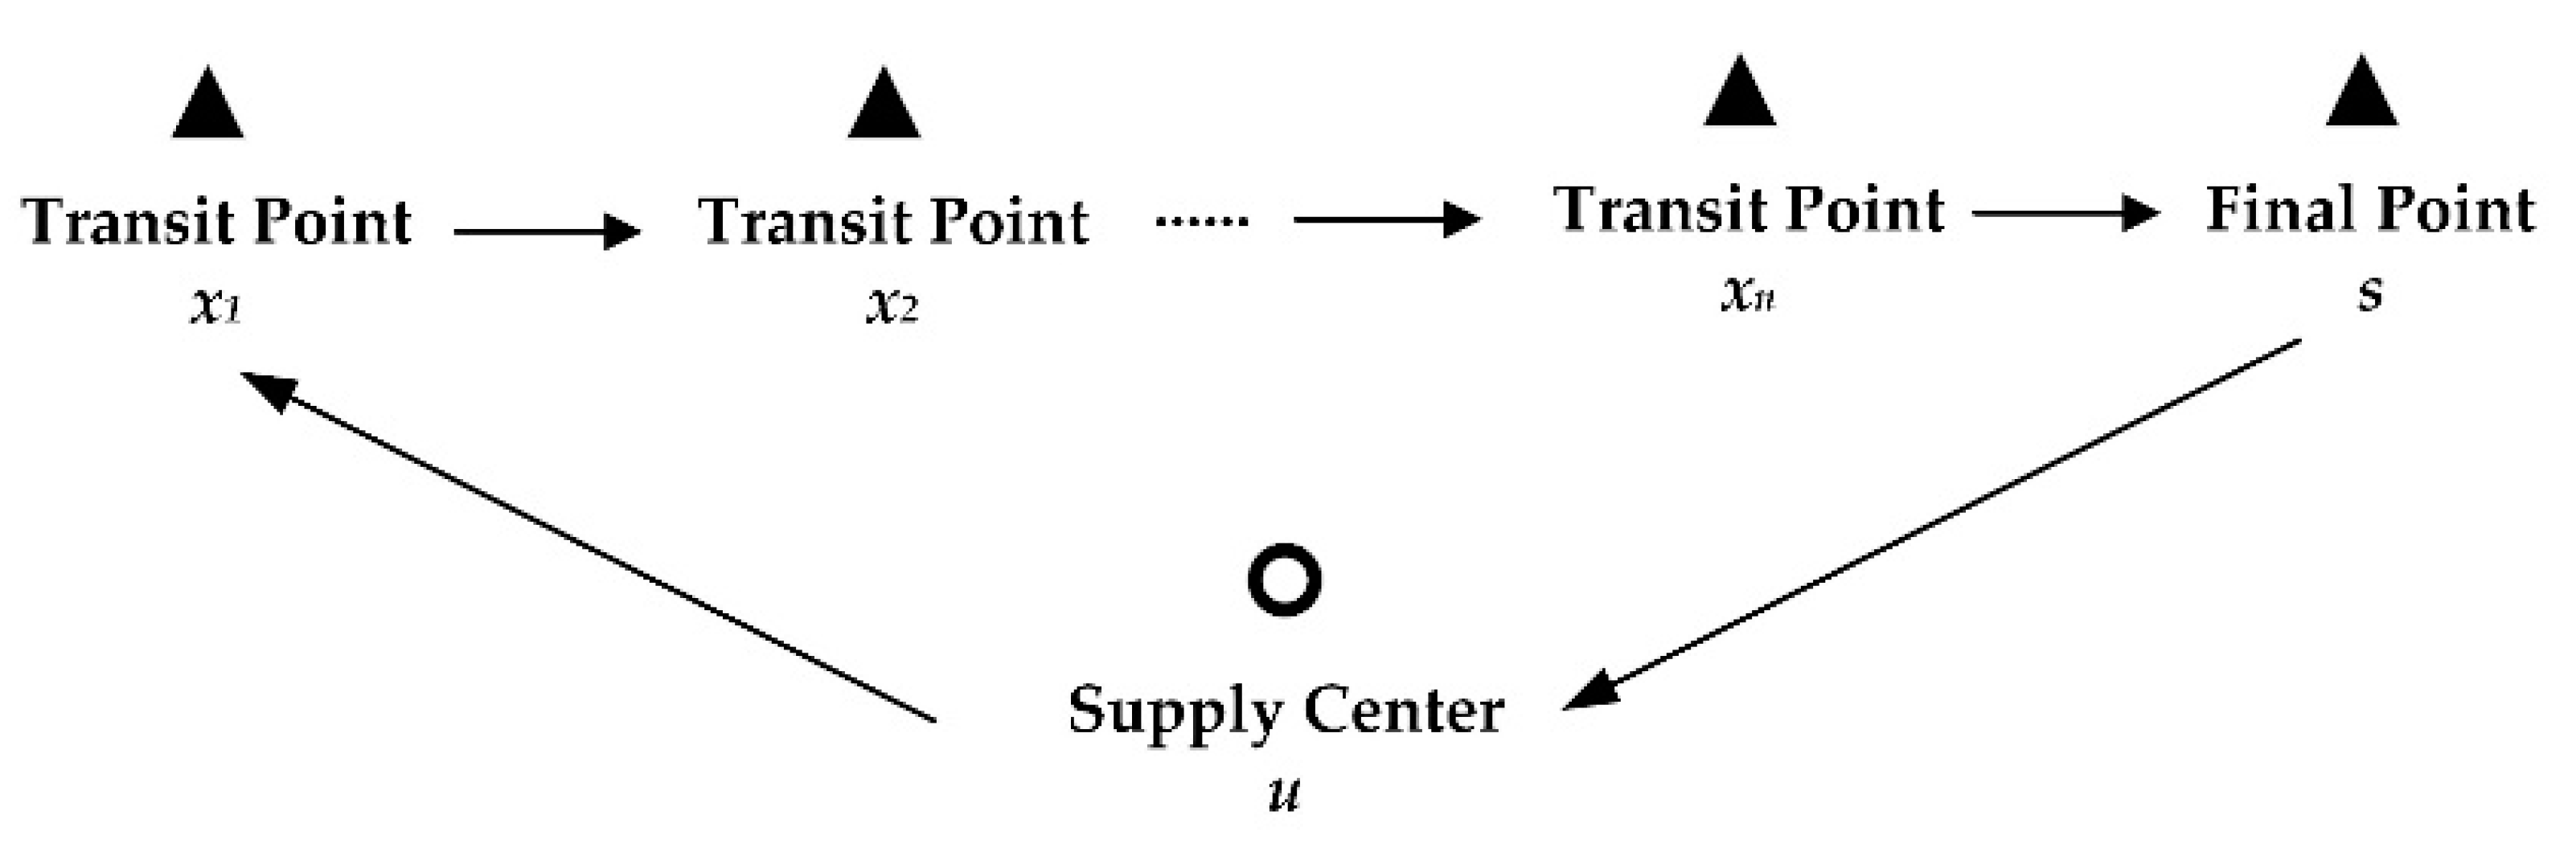
2.1. Problem Description
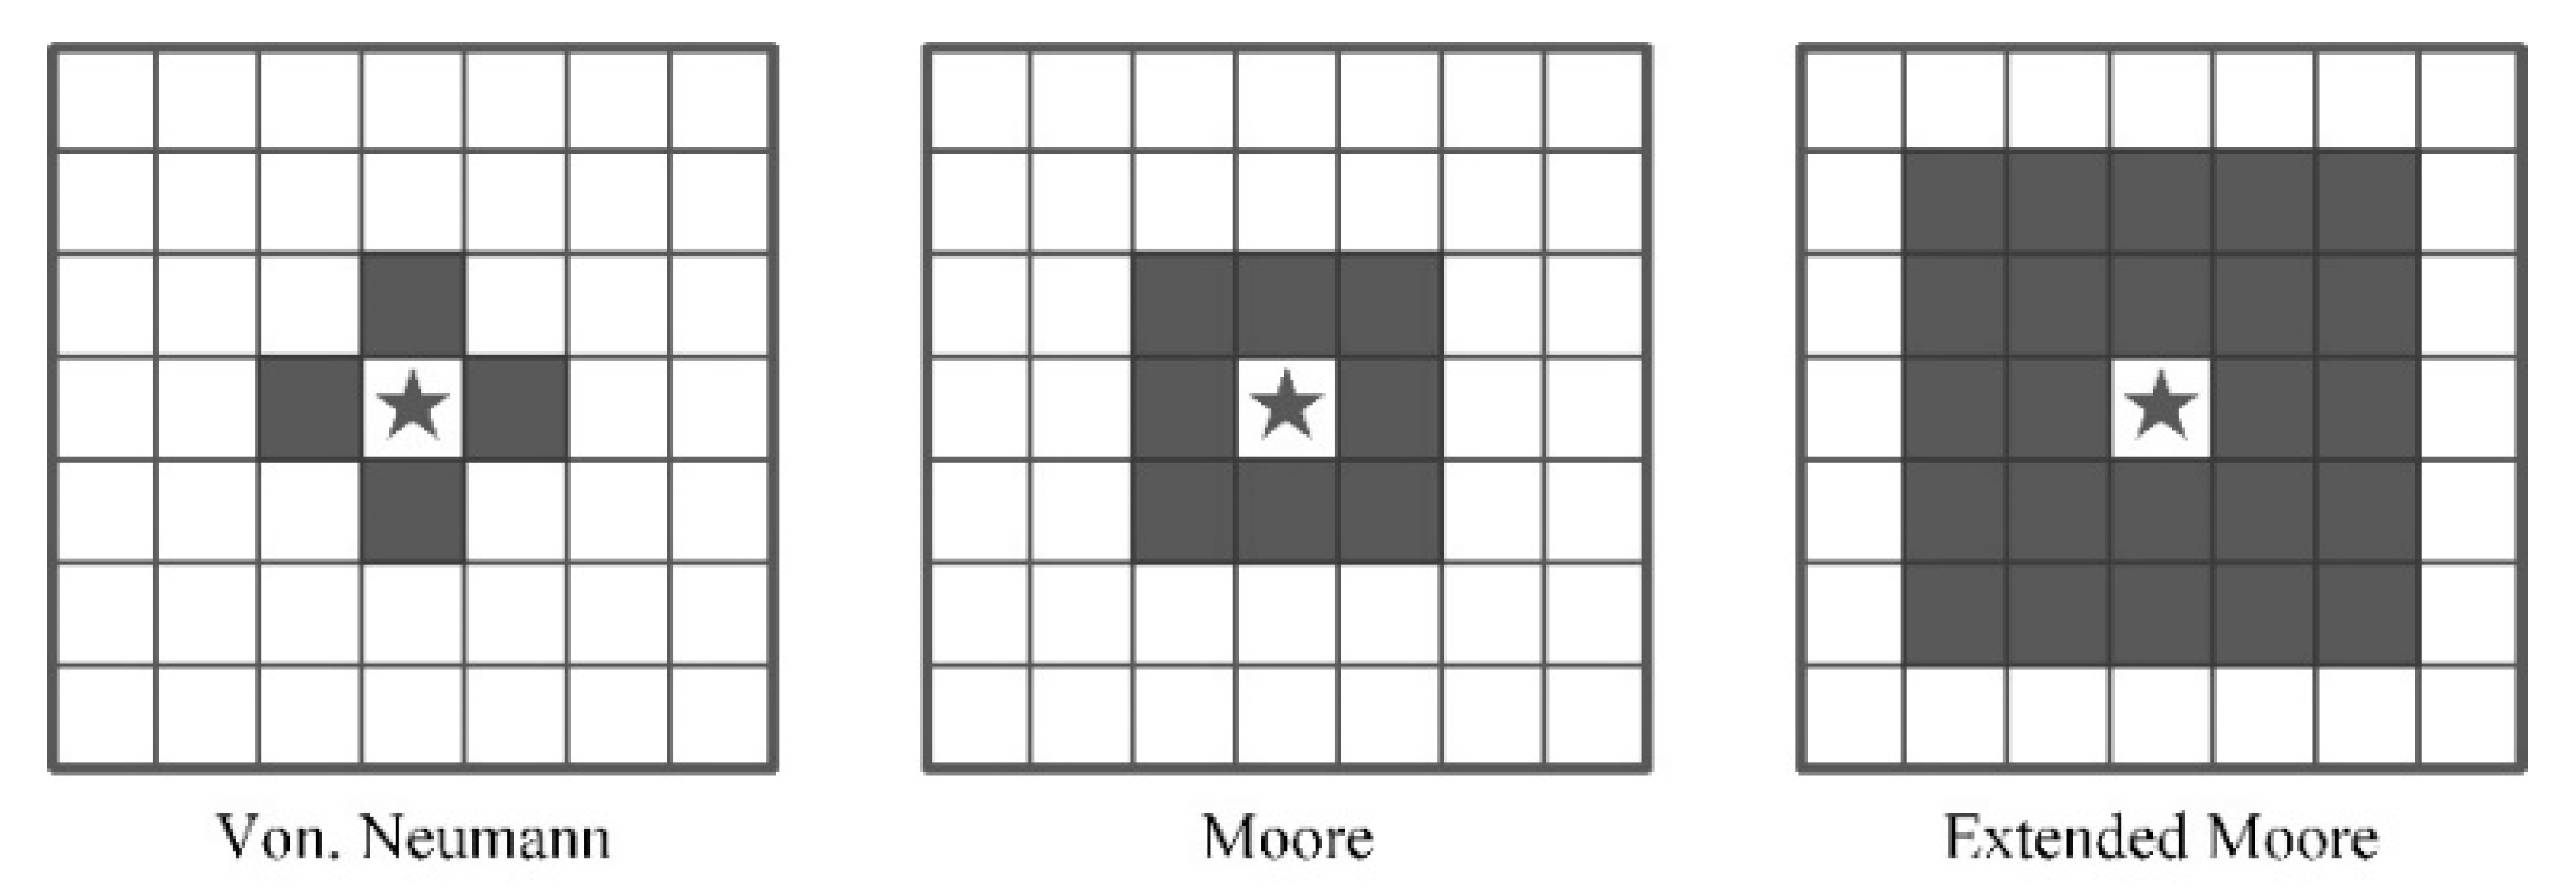
In a certain region, there are numerous demand points and supply centers belonging to different service providers. The demand points have distribution requirements for each service provider. They need to be within the service range of each supply center. To ensure the safe, stable and smooth operation of drones and reduce the difficulty of the network management, this paper constructs a unified air route network of terminal distribution. Through it, various supply centers can distribute cargoes and mails to demand points. This network has two layers, and each of them is at the same flight level. The upper layer is the distribution network; the lower layer is the return network. After completing the distribution task at the demand point, the drones of different service providers can only choose to return to their own service provider’ s supply center.

2.2. Airspace Grid

The grid method is adopted to model the airspace and divide it into grid cells. At the same flight level, the space where the drones perform logistics tasks is a rectangle with length L , width W and ABCD as vertexes. It is divided into grid cells whose length and width are respectively l g and v g . Then, the task space can be divided into m × n grid cells, where m = int ( L / l g ) , n = int ( W / v g ) , int ( ) is a upward rounding function. The center of each grid cell is considered an alternative waypoint.
Multi-rotor UAVs that can take off and land vertically are often used in terminal distribution. In the airspace of UAV operation, there are special areas such as obstacles, prohibited areas and restricted areas, which need to be avoided when planning an air route. Given that, protection zones were set up to enhance the safety margin of the route. The scope of the protection zone is the smallest convex polygon formed by special area expanding z / 2 outward, where z is the wheelbase of the drone.
Based on the discriminant function P ( x , y ) , whether the grid cell with center point ( x , y ) has protection zone is identified.
P ( x , y ) = { 0 , there   is   no   protection   zone   in   grid   cell 1 , otherwise
In the light of neighbor structures, cellular neighbors are divided into three forms, such as Von. Neumann neighborhood, Moore neighborhood and extended Moore neighborhood in Figure 1.
For grid cell ( x , y ) , the density of the protection zone in the neighbors of it is calculated by analysing u grid cells adjacent to it. It is defined as the risk degree.
r ( x , y ) = 1 u | k = 1 u P ( x k , y k ) |
where, u is the number of cellular neighbors.

2.3. Single Air Route Planning Model of Logistics UAV

The center of the grid cell is considered as a waypoint, and the route consists of a series of adjacent waypoints. Set the coordinates of the start point and the end point of the route as ( x 0 , y 0 ) and ( x n , y n ) respectively. A series of adjacent waypoints of the planning route are ( x i , y i ) , i = 1 , 2 , 3 n 1 .

2.3.1. Objective Functions

(1) Length of single route.
D = i = 1 n 1 ( x i + 1 x i ) 2 + ( y i + 1 y i ) 2
(2) Risk degree of single route.
R = i = 1 n 1 r ( x i , y i ) = i = 1 n 1 [ 1 u i | k = 1 u i P i ( x k , y k ) | ]
To sum up, the objective function of a single route can be described by the following formular:
min Q = α 1 D + α 2 ( β R ) , α 1 + α 2 = 1
where Q is the cost of route, and α 1 , α 2 are weight coefficients, and β is scaling factor.

2.3.2. Constraint Conditions

(1) Turning angle. Due to the limitation of the UAV’s maximum turning radius, the turning angle of each single turn within the route needs to be restricted. If the coordinates of the three adjacent waypoints are ( x i 1 , y i 1 ) , ( x i , y i ) , ( x i + 1 , y i + 1 ) , the turning angle of the route can be obtained by the vector formula based on cosine law, and it should be satisfied with the following formula:
0 φ i = arccos [ ( x i x i 1 ) ( x i + 1 x i ) + ( y i y i 1 ) ( y i + 1 y i ) ( x i x i 1 ) 2 + ( y i y i 1 ) 2 ( x i + 1 x i ) 2 + ( y i + 1 y i ) 2 ] φ max
where φ max refers to the maximum turning angle of the route.
(2) Turning buffer distance. For the sake of a safe turn, the drone needs to have a buffer distance before turning. If the coordinates of two adjacent turning points are ( x i , y i ) , ( x j , y j ) , the default is to fly in a straight line between the turning points.
( x i x j ) 2 + ( y i y j ) 2 > d min
where d min means the minimum turning buffer distance.

2.4. Air Route Network Planning Model of Logistics UAV

After all the optimal routes of any two points in the region have been obtained through the algorithm in Section 2.3, the appropriate nodes and the corresponding optimal route between nodes would be selected to construct the air route network according to the characteristics and constraints of the logistics task to model the logistics UAV network in the region.

2.4.1. Related Conception

(1) Adjacent matrix. For any two nodes, A i j is used to express whether there is a direct route between i and j . Direct route means a route without transit points from the start point to the end point.
A i j = { 0 , there   is   no   direct   route   between   i   and   j 1 , otherwise
(2) Connection matrix. For any two nodes, B i j is applied to indicate whether there is at least one direct or transit route between i and j . Transit route refers to the route from the start point to the end point after passing through the transit points.
B i j = { 0 , there   is   no   connected   route   between   i   and   j 1 , otherwise
(3) Distance matrix. For any two nodes, D i j is utilized to show the distance of direct route between i and j .

2.4.2. Objective Functions

There are k different service providers in the region, and the total number of supply centers of the service provider w is e w , w = 1 , 2 , 3 , k ; u j w is the j th supply center of w , j [ 1 , e w ] ; s i is the demand point, i = 1 , 2 , 3 , m ; and N represents the set of all points in the region.
(1) Node importance. In order to reflect the positions of demand point and supply center in the air route network, the importance index I is established.
I s i = η 1 N s i N ¯ + η 2 G s i G ¯ + η 3 M o n s i M o n ¯ I u j w = η 1 S t u j w S t ¯ + η 2 S q u j w S q ¯ + η 3 N u u j w N u ¯
where N s i , G s i , M o n s i express demand point’s population, the number of deliveries and average income respectively; S t u j w , S q u j w , N u u j w represent supply center’s employees, site area and daily delivery volume, respectively; N ¯ , G ¯ , M o n ¯ , S t ¯ , S q ¯ , N u ¯ are means of the mentioned factors; and η i , η i are weights.
(2) Segment weight. The segment weight q between point a and point b is composed of segment gravity F and distance D , which can be expressed as follows.
F a b = M I a I b D a b A a b , a , b N
q a b = λ 1 μ F a b + λ 2 D a b A a b , a , b N
where λ 1 , λ 2 are weight coefficients and μ is the scaling factor.
In conclusion, the objective function of the air route network can be described by the following formula:
min Q = min ( 1 2 j = 1 m i = 1 m q s i s j + i = 1 m w = 1 k j = 1 e w q s i u j w + 1 2 w = 1 k i = 1 e w j = 1 e w q u i w u j w ) , i j
where Q is the cost of the network.

2.4.3. Constraint Conditions

(1) Voyage distance. The route length between demand point and supply center ought to be within the maximum range of UAV L max
2 D s i , u j w L max 2 D s i , s j L max , i j 2 D u i w , u j w L max , i j
For a route with transit, if the drone starts from the supply center u , and passes through n transit points x before arriving at the demand point. Then, it goes straight from the demand point to the supply center as shown in Figure 2. The total voyage distance needs to meet the following formula:
D u , x 1 + i = 1 n 1 D x i , x i + 1 + D x n , s + D s , u L max
where D s , u represents the distance of return route.
(2) Demand point. Under the premise that there is no isolated demand point in the network, arbitrary demand point s i needs to be delivered by all service providers.
w = 1 k j = 1 e w B s i , u j w 1
(3) Supply center. Under the premise that there is no isolated supply center in the network, arbitrary supply center u j w ought to be linked with at least one demand point.
i = 1 m A s i , u j w 1
(4) Service provider. Based on the requirements of logistics operation, there is no direct route between supply centers of different service providers.
a = 1 w 1 j = 1 e w b = 1 e a A u j w , u b a + c = w + 1 k j = 1 e w b = 1 e c A u j w , u d c = 0

3. Algorithms

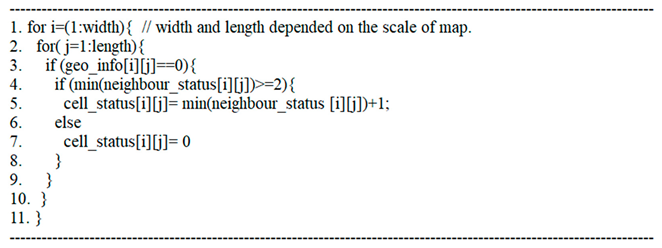
3.1. Single Air Route Generation Based on the Improved CA

3.1.1. Basic Principle

CA was first created by J. von Neumann, the father of computers, in order to simulate the self-replication function of living systems. It is composed of cells, space, state, neighbors and evolution rule [22], which can be expressed as the following quaternion:
A ( C q , S , N , R )
where A represents CA system, C q expresses q -dimentional space, S indicates finite discrete state of cell, N is the set of cellular neighbors, and R is the evolution rule.

3.1.2. Parameters

In the layered air route network, the routes at the same flight level are regarded as a two-dimensional plane network; thus, q = 2 . Based on the low altitude grid environment, the Moore neighborhood is adopted, so u = 8 . Then, the start point cell state value is 2, the end point cell state value is 3, the protection zone cell state value is −1, and the passable cell state value is 0.

3.1.3. Cost Function

In traditional CA, the route planning only depends on the step values. However, there are many points with the same step values, so the traditional CA randomly selects one of the points with the same value, which leads to winding, rather than straight routes. To overcome the defects of traditional CA, the cost function is introduced as a signal for route searching, so a better next step can be quickly found as long as all the costs of the potential next points are calculated. The cost function can optimize the route between start point and end point, and it can be expressed as follows:
P n o w = d s t a r t , n o w + d n o w , e n d + β r n o w
where d s t a r t , n o w indicates the Euclidean distance from the start point to the current cell, d n o w , e n d represents the Euclidean distance from the current cell to the end point, r n o w expresses the risk degree of current cell, and β is the scaling factor.

3.1.4. Pseudo-Code

The first stage of this algorithm was to calculate all the step values from start point to end point. The matrix cell_status was to record the state value of each point. Neighbour_status takes the mean of the state value set of the current cell’s neighbours. The status of start point and end point were set as 2 and 3 respectively. Geo_info was the matrix which recorded the information of obstacle or non-obstacle, if this point was obstacle, the value of geo_info[i][j] equaled −1 and it would be 0 for point without obstacle.
Sustainability 13 13079 i001
All the values of cell_status except start point, end point and obstacles minus 2 are the step values of each cell from start point to themselves.
The second stage is to find the best route from end point to start point. The route is searched in descending order of cellular steps, which means the search orientation of the grid cell. A cell in the neighborhood of the end point was selected, which had the smallest state value among all neighbors. Then according to Equation (20), the costs p of those cells were obtained, and the operations shown in pseudo code were performed. Step[i][j] represents the step values of current cell to the start point. Neighbour_step indicates the step values of current cell’s neighbour. Neighbour_p meaned the costs of neighbour cells. Route_point was the matrix of the selected waypoint.
Sustainability 13 13079 i002

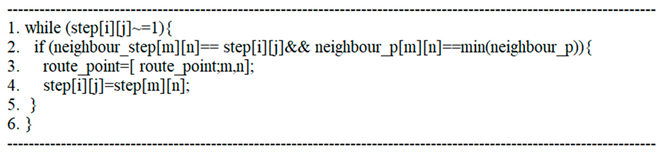
3.2. Air Route Network Planning Based on the Optimal Spanning Tree

3.2.1. Basic Principle

The optimal spanning tree algorithm was adopted to generate a connected tree without cycles among all nodes, which minimizes the sum of weights of all segments. All points are set as a i , i = 1 , 2 , 3 , , N , including the supply center and the demand point. Based on the Equation (12), the weight of each branch is defined as follows:
w i j = { λ 1 μ F i j + λ 2 D i j , there   is   a   connected   route   between   point   i   and   point   j 0 , otherwise

3.2.2. Algorithm Flow

On the grounds of above analyses, the processes can be described as follows:
Step 1. A N × N route weight matrix W is constructed.
w 1 w N w 1 w N { w 11 w 1 N w N 1 w N N }
Step 2. Random line k in the matrix is selected, and it is recorded in the branch list. That means the tree grows from this node. Then, the corresponding column of the line is deleted to avoid forming a circle.
Step 3. The smallest element w i j in the branch list is chosen, and it is put in the route list. Then, row i is placed in the branch list and column j is deleted. The elements and columns in the route list and the branch list are not chosen again.
Step 4. Examine whether all columns have been added to the branch list. If all of them are added, the algorithm terminates, and the adjustment and expansion stage is entered. Otherwise, return to Step 3.
Step 5. Check whether all demand points and supply centers meet (18) and (19). If the constraints are met, proceed to the next step; otherwise, after connecting the demand points that do not satisfy the constraints with the adjacent need points that can satisfy (16) and (17), put them in the route list and proceed to the next step.
Step 6. For a number of demand points with greater importance, in order to meet their distribution needs, they are directly connected with the supply centers. Then, these routes are added into the route list as a branch so that the network is gradually transformed from tree to network.
Step 7. The repetitive routes from the route list are deleted to get the final network structure.

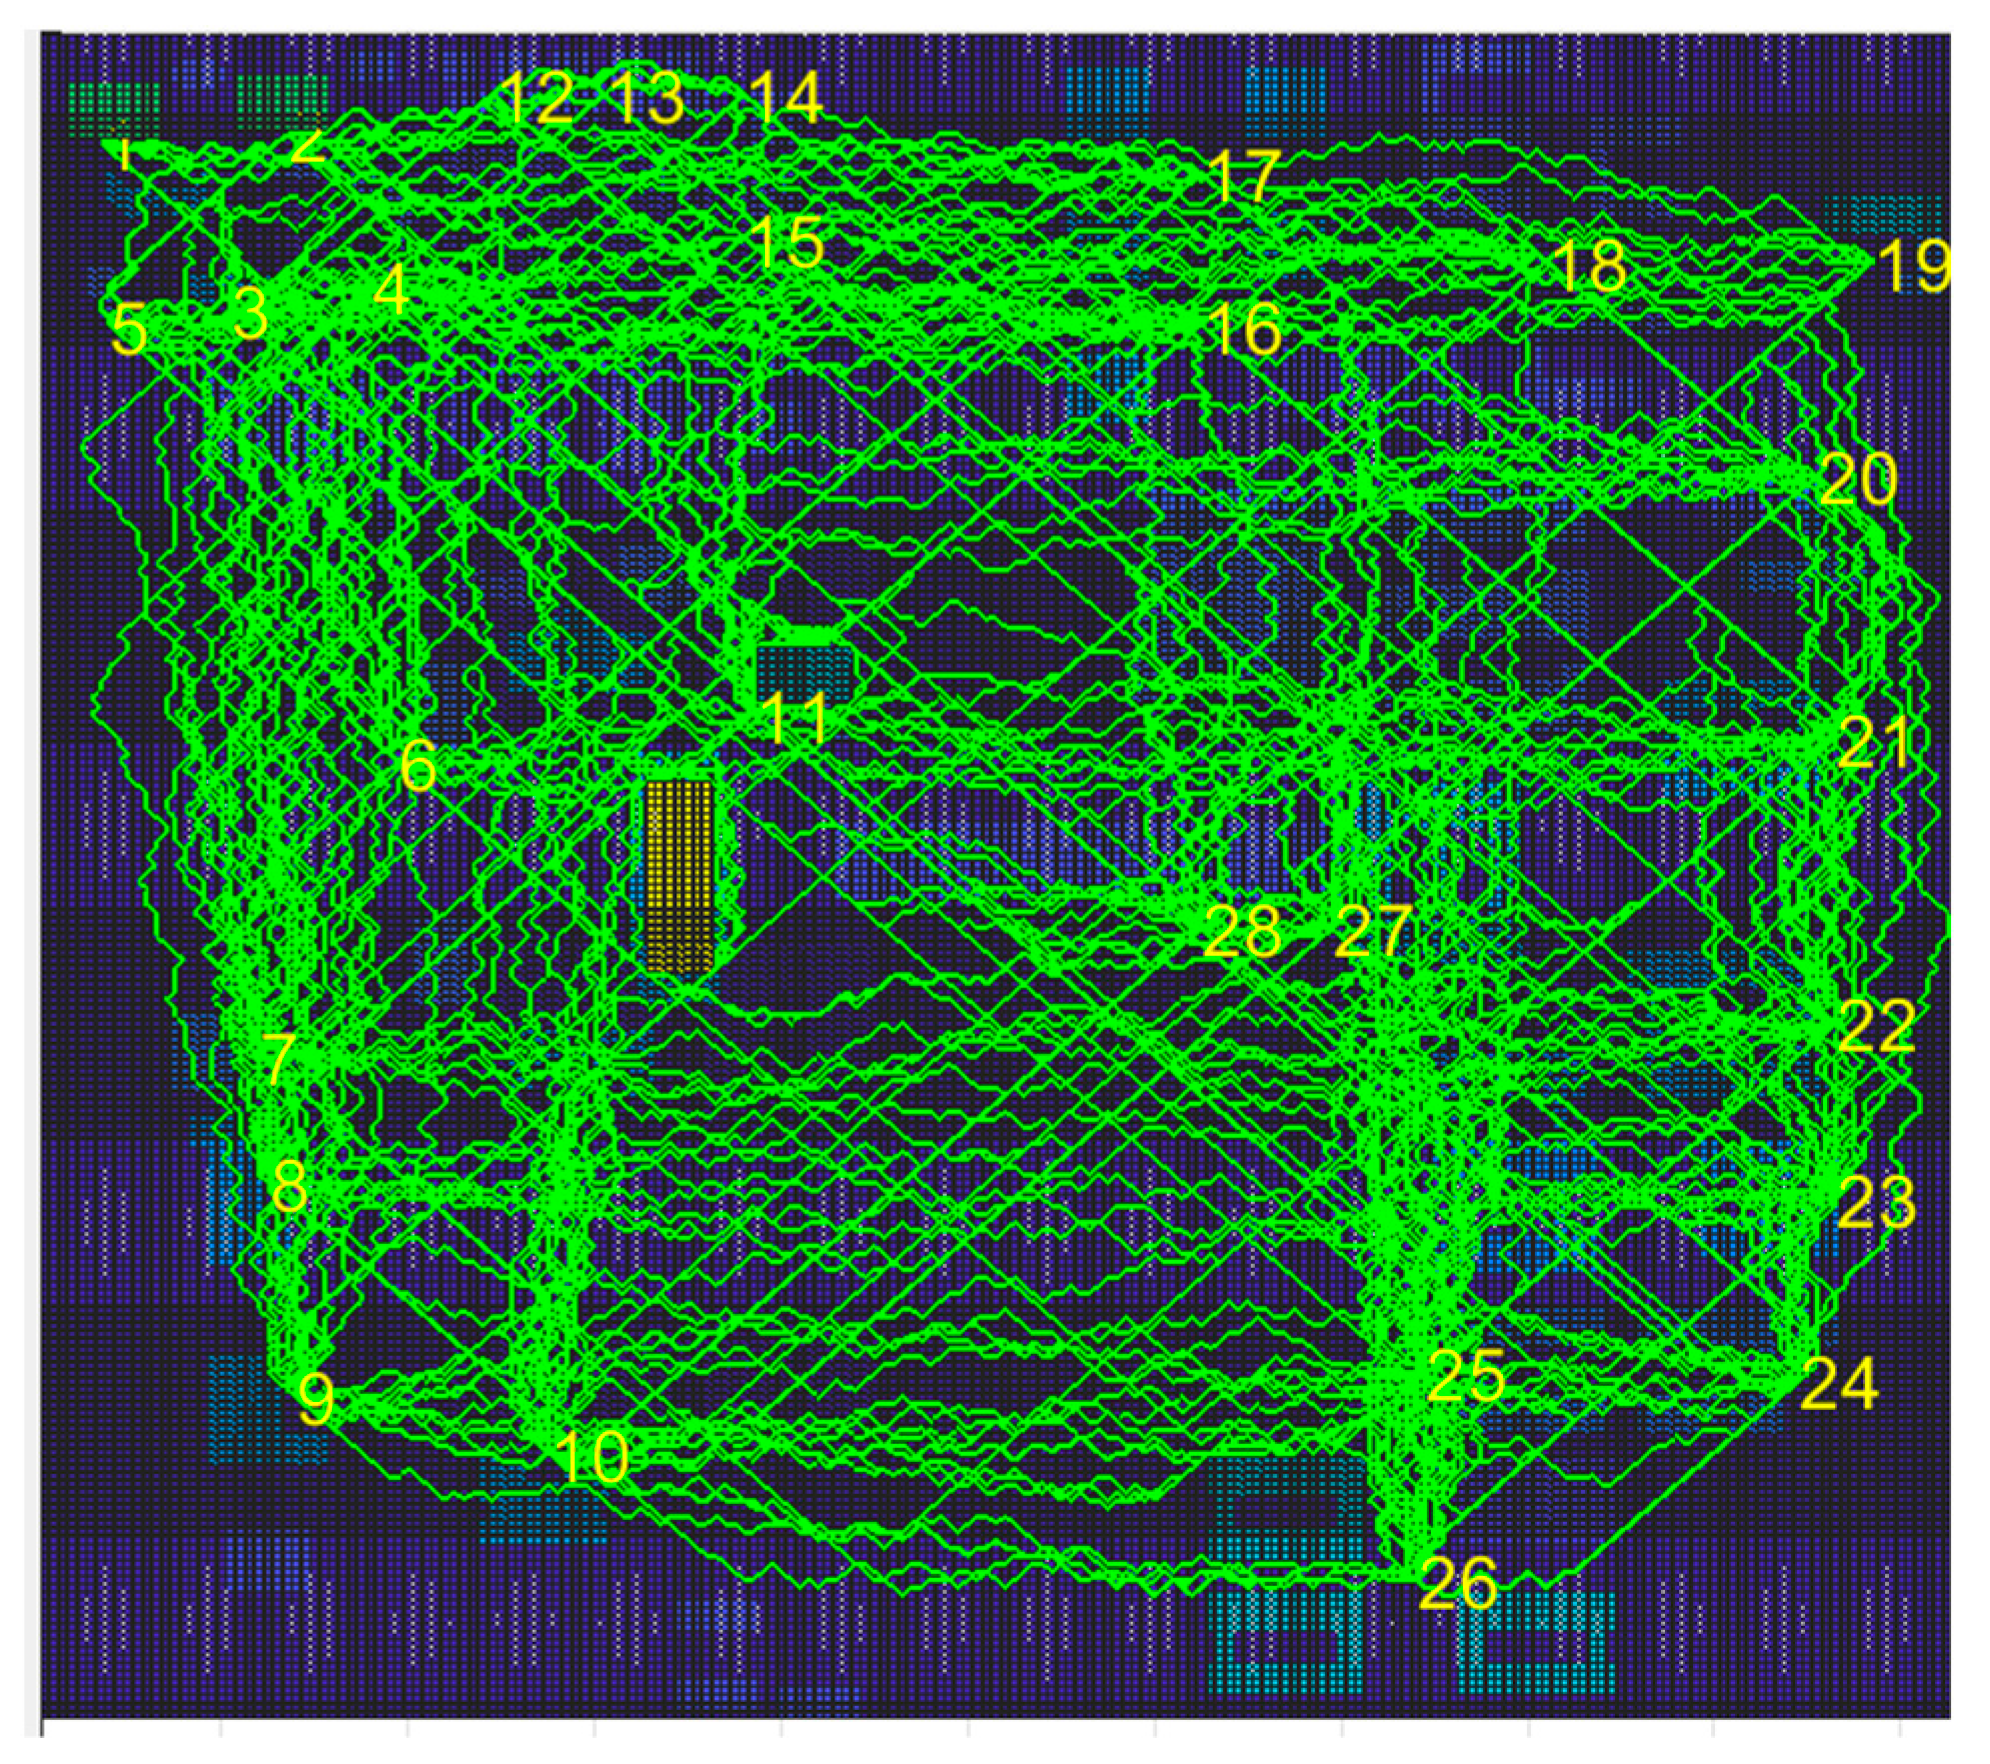
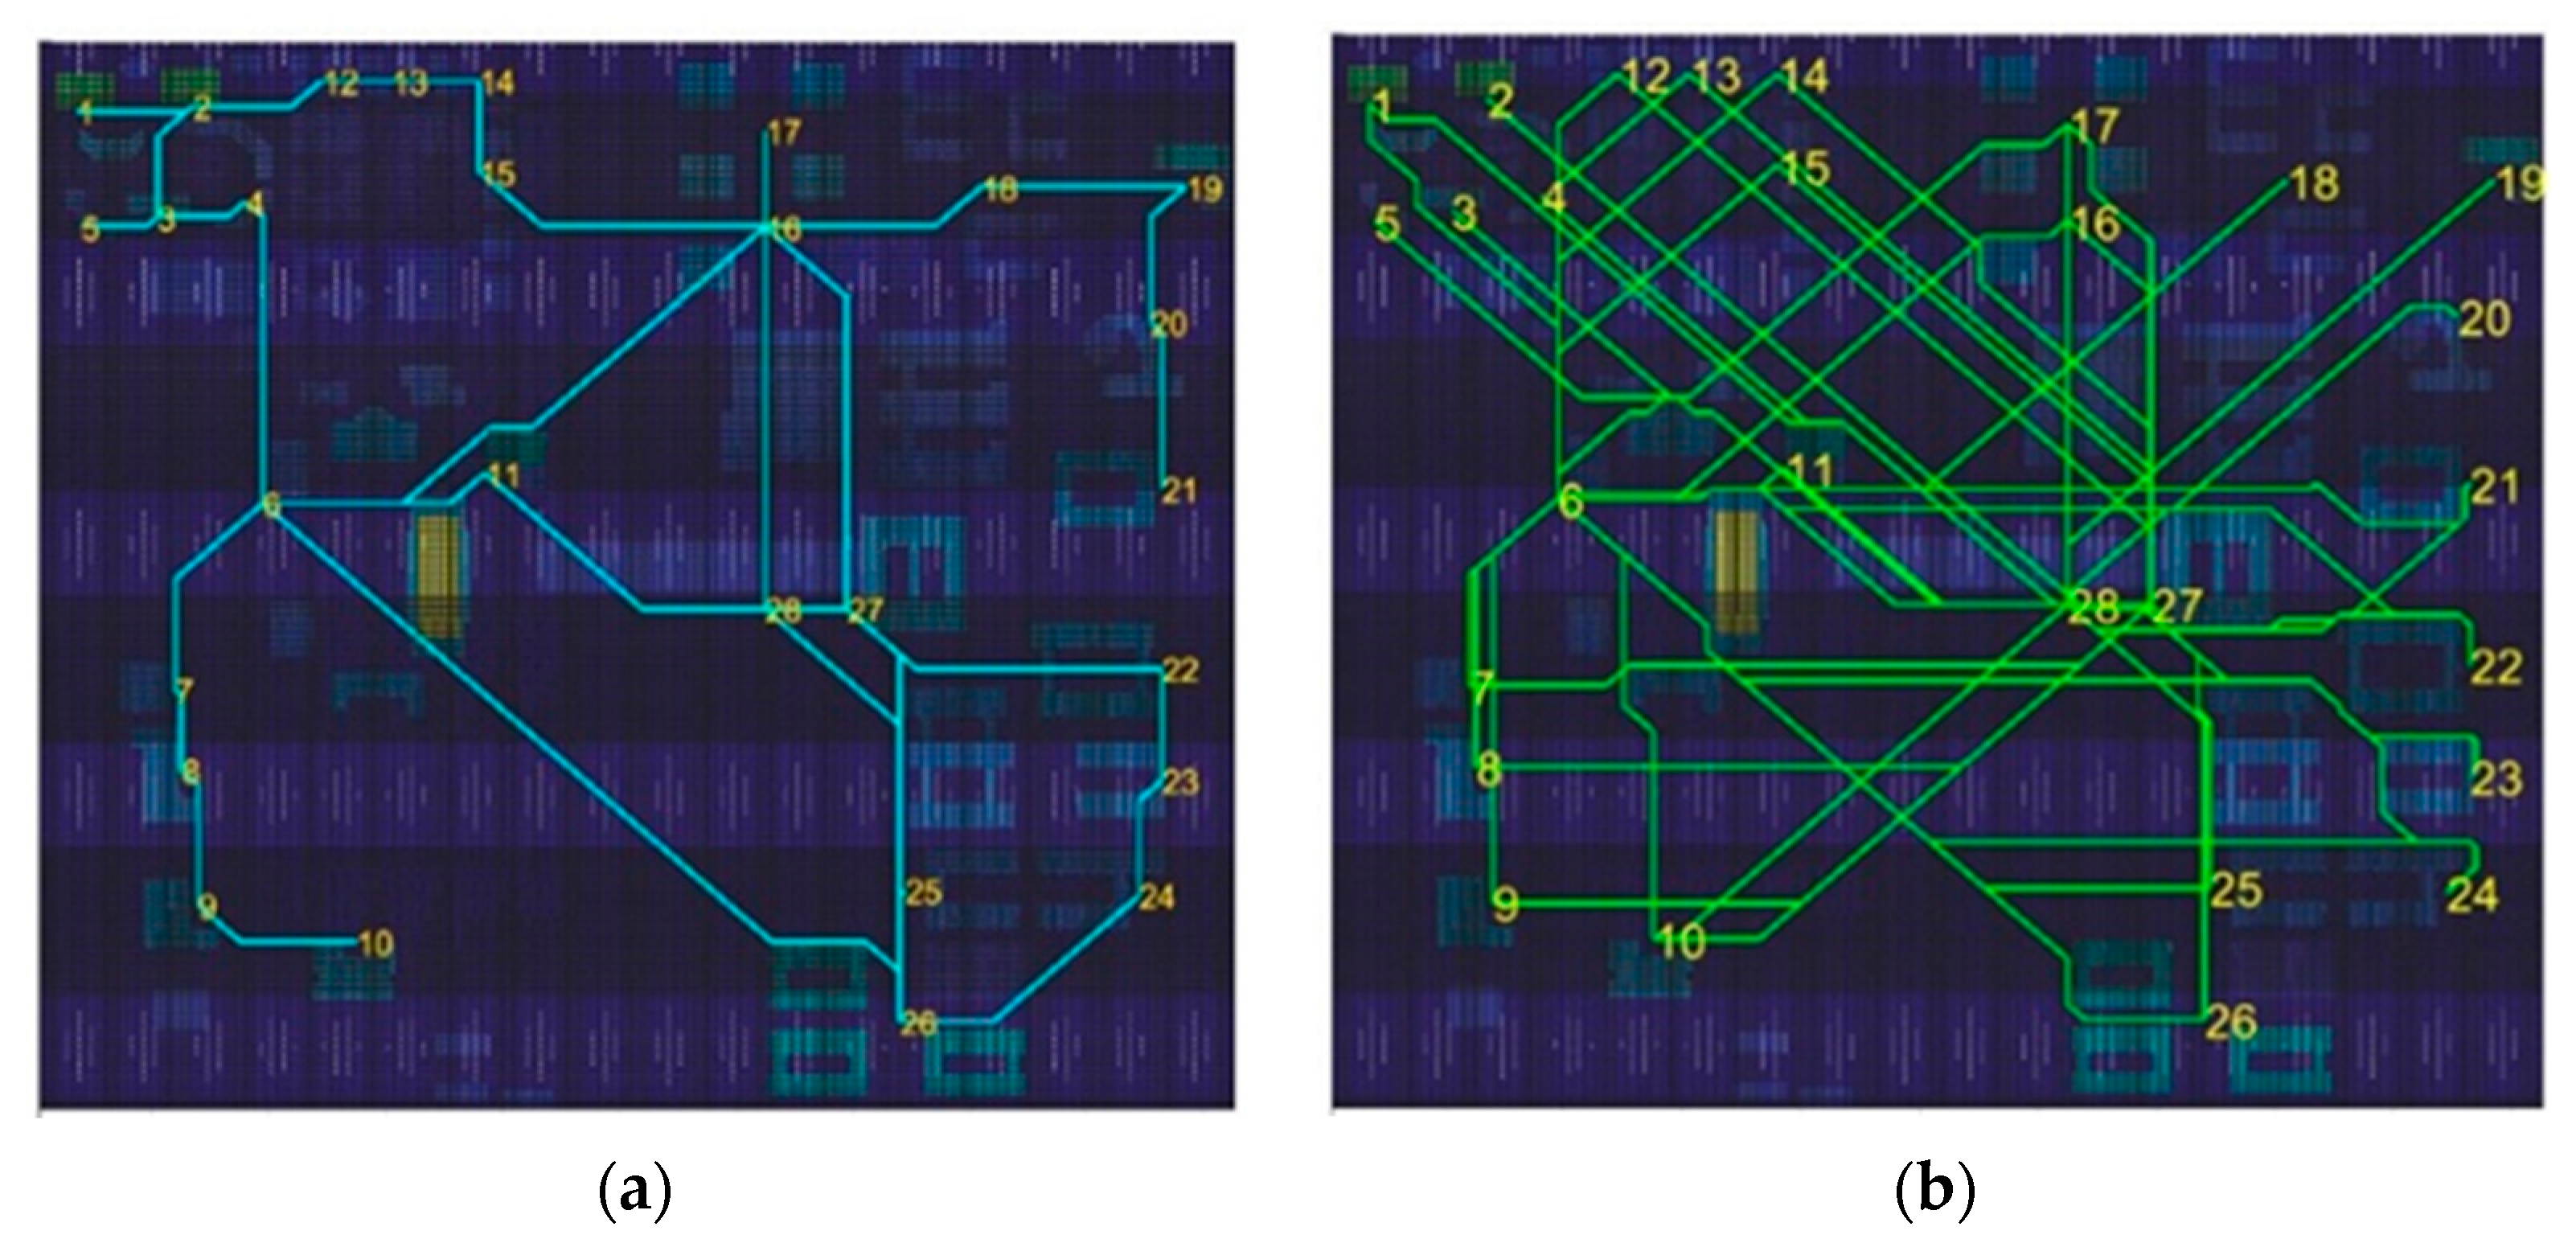
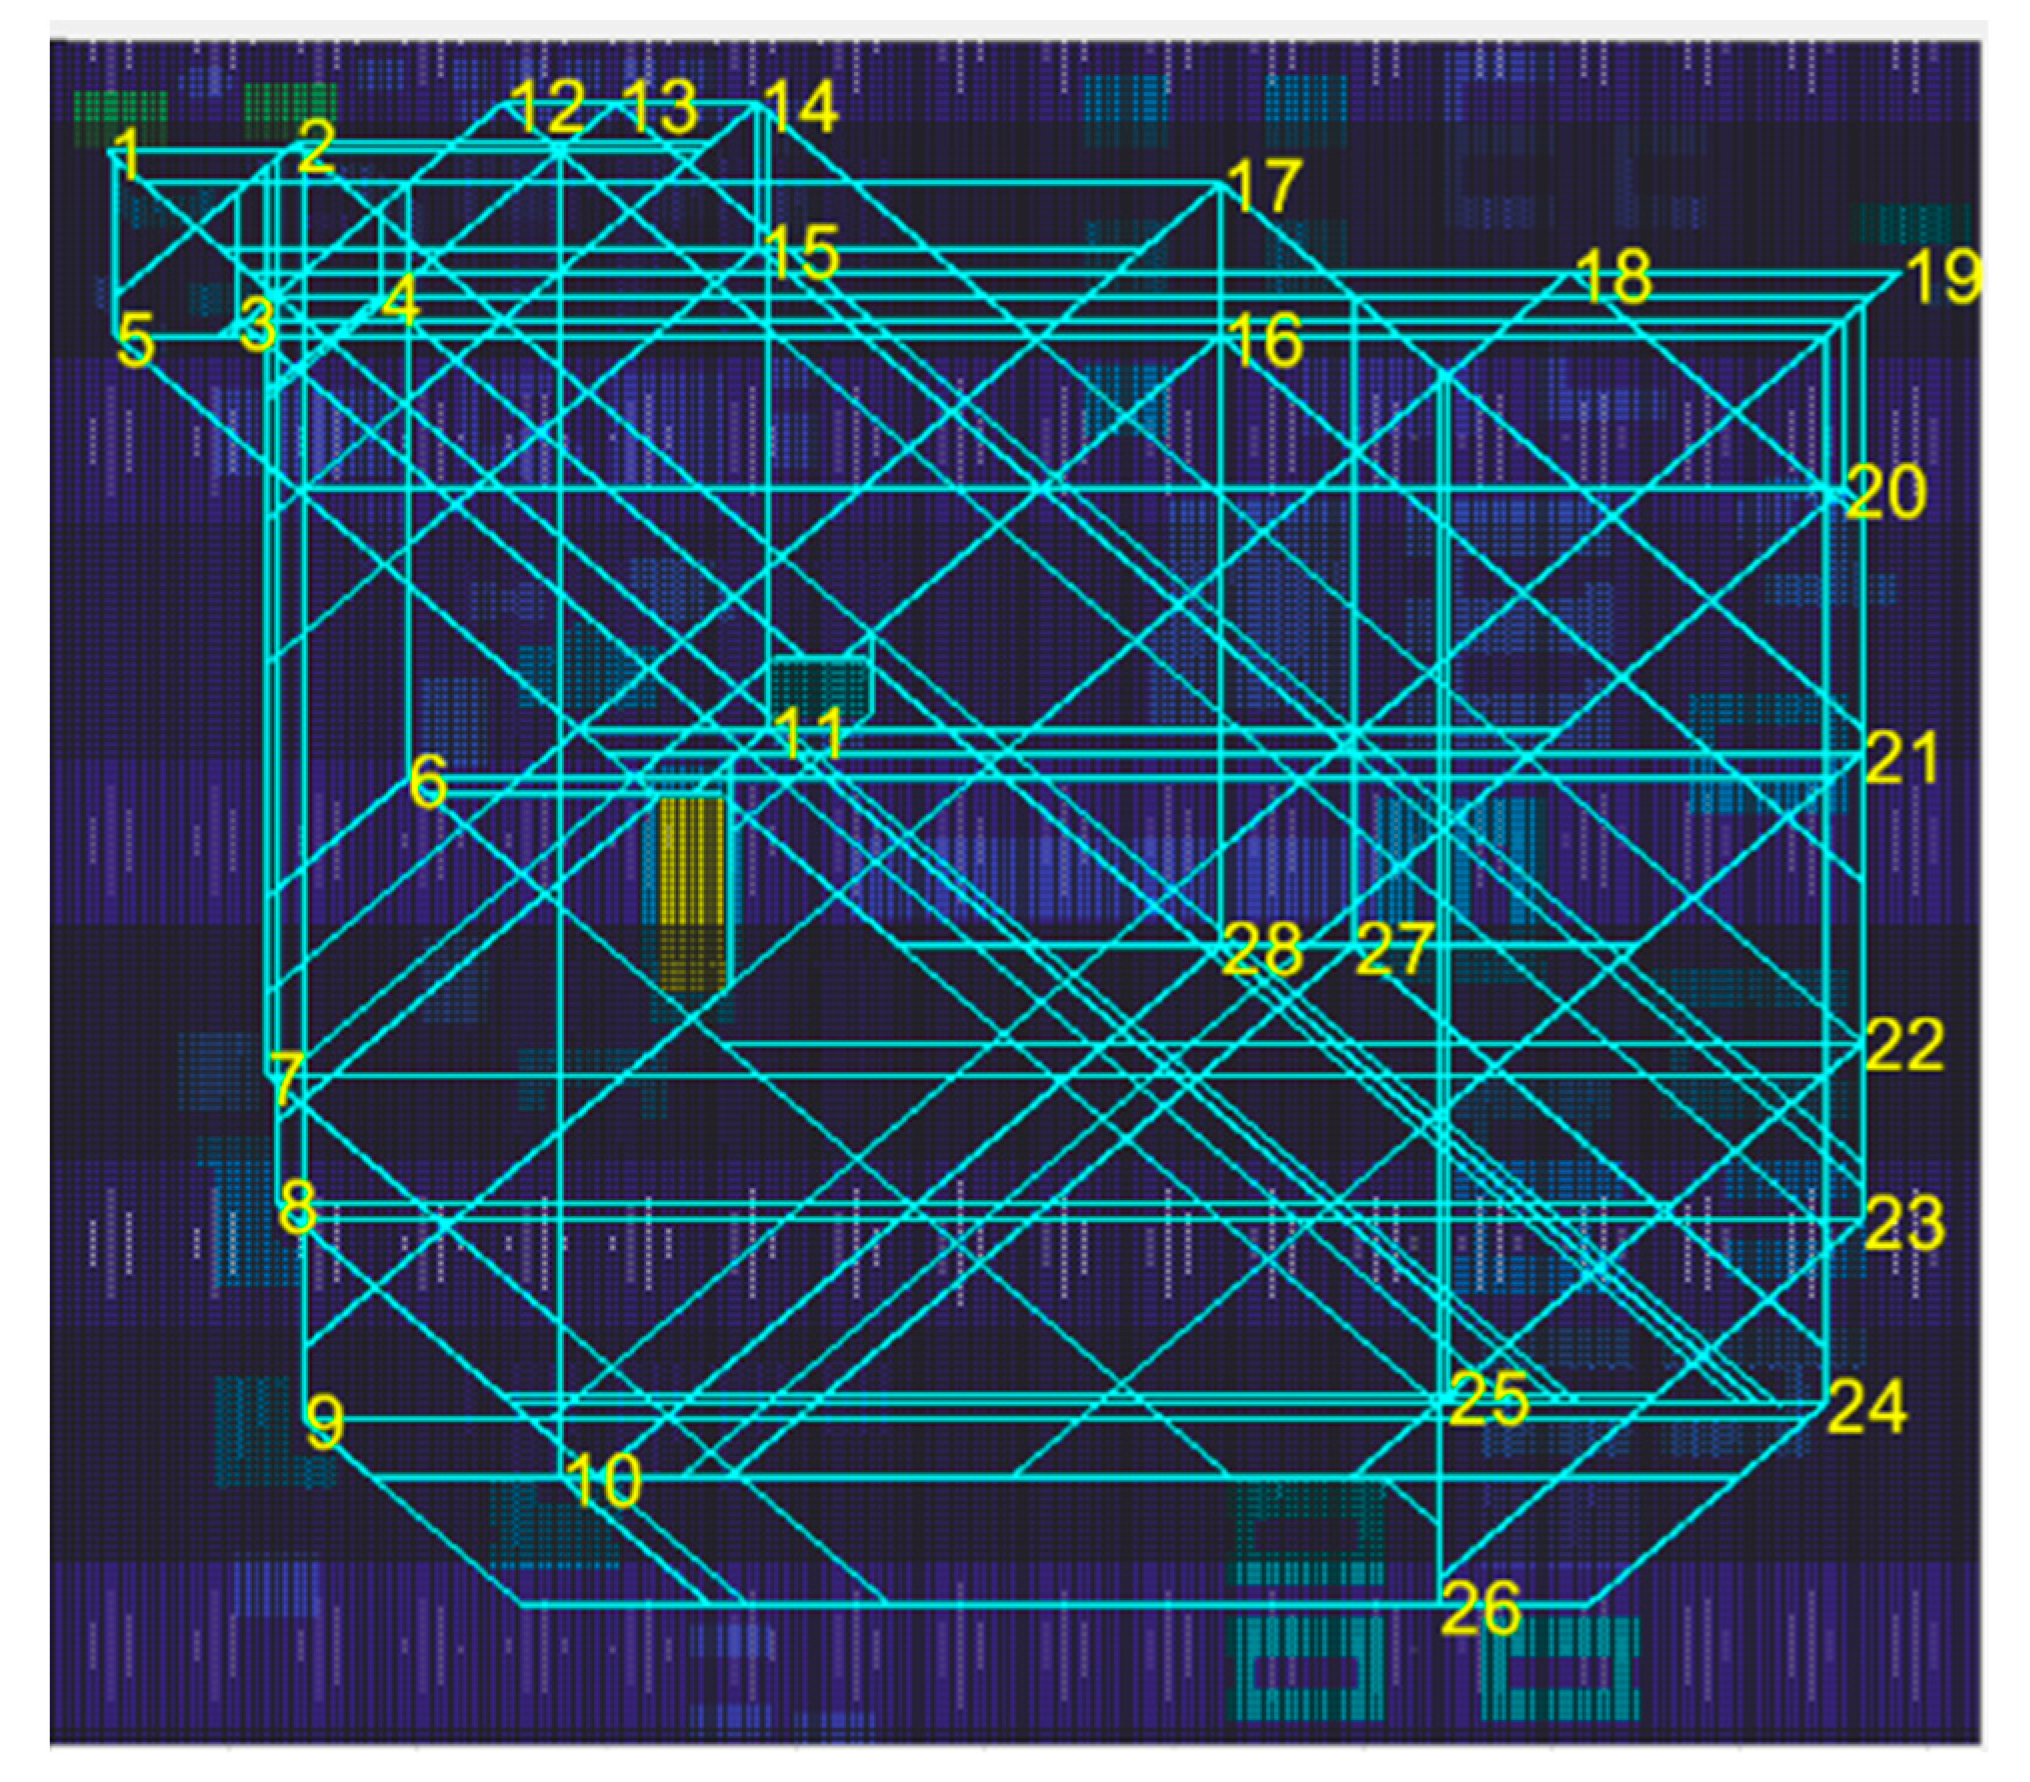
4. Simulation and Analysis

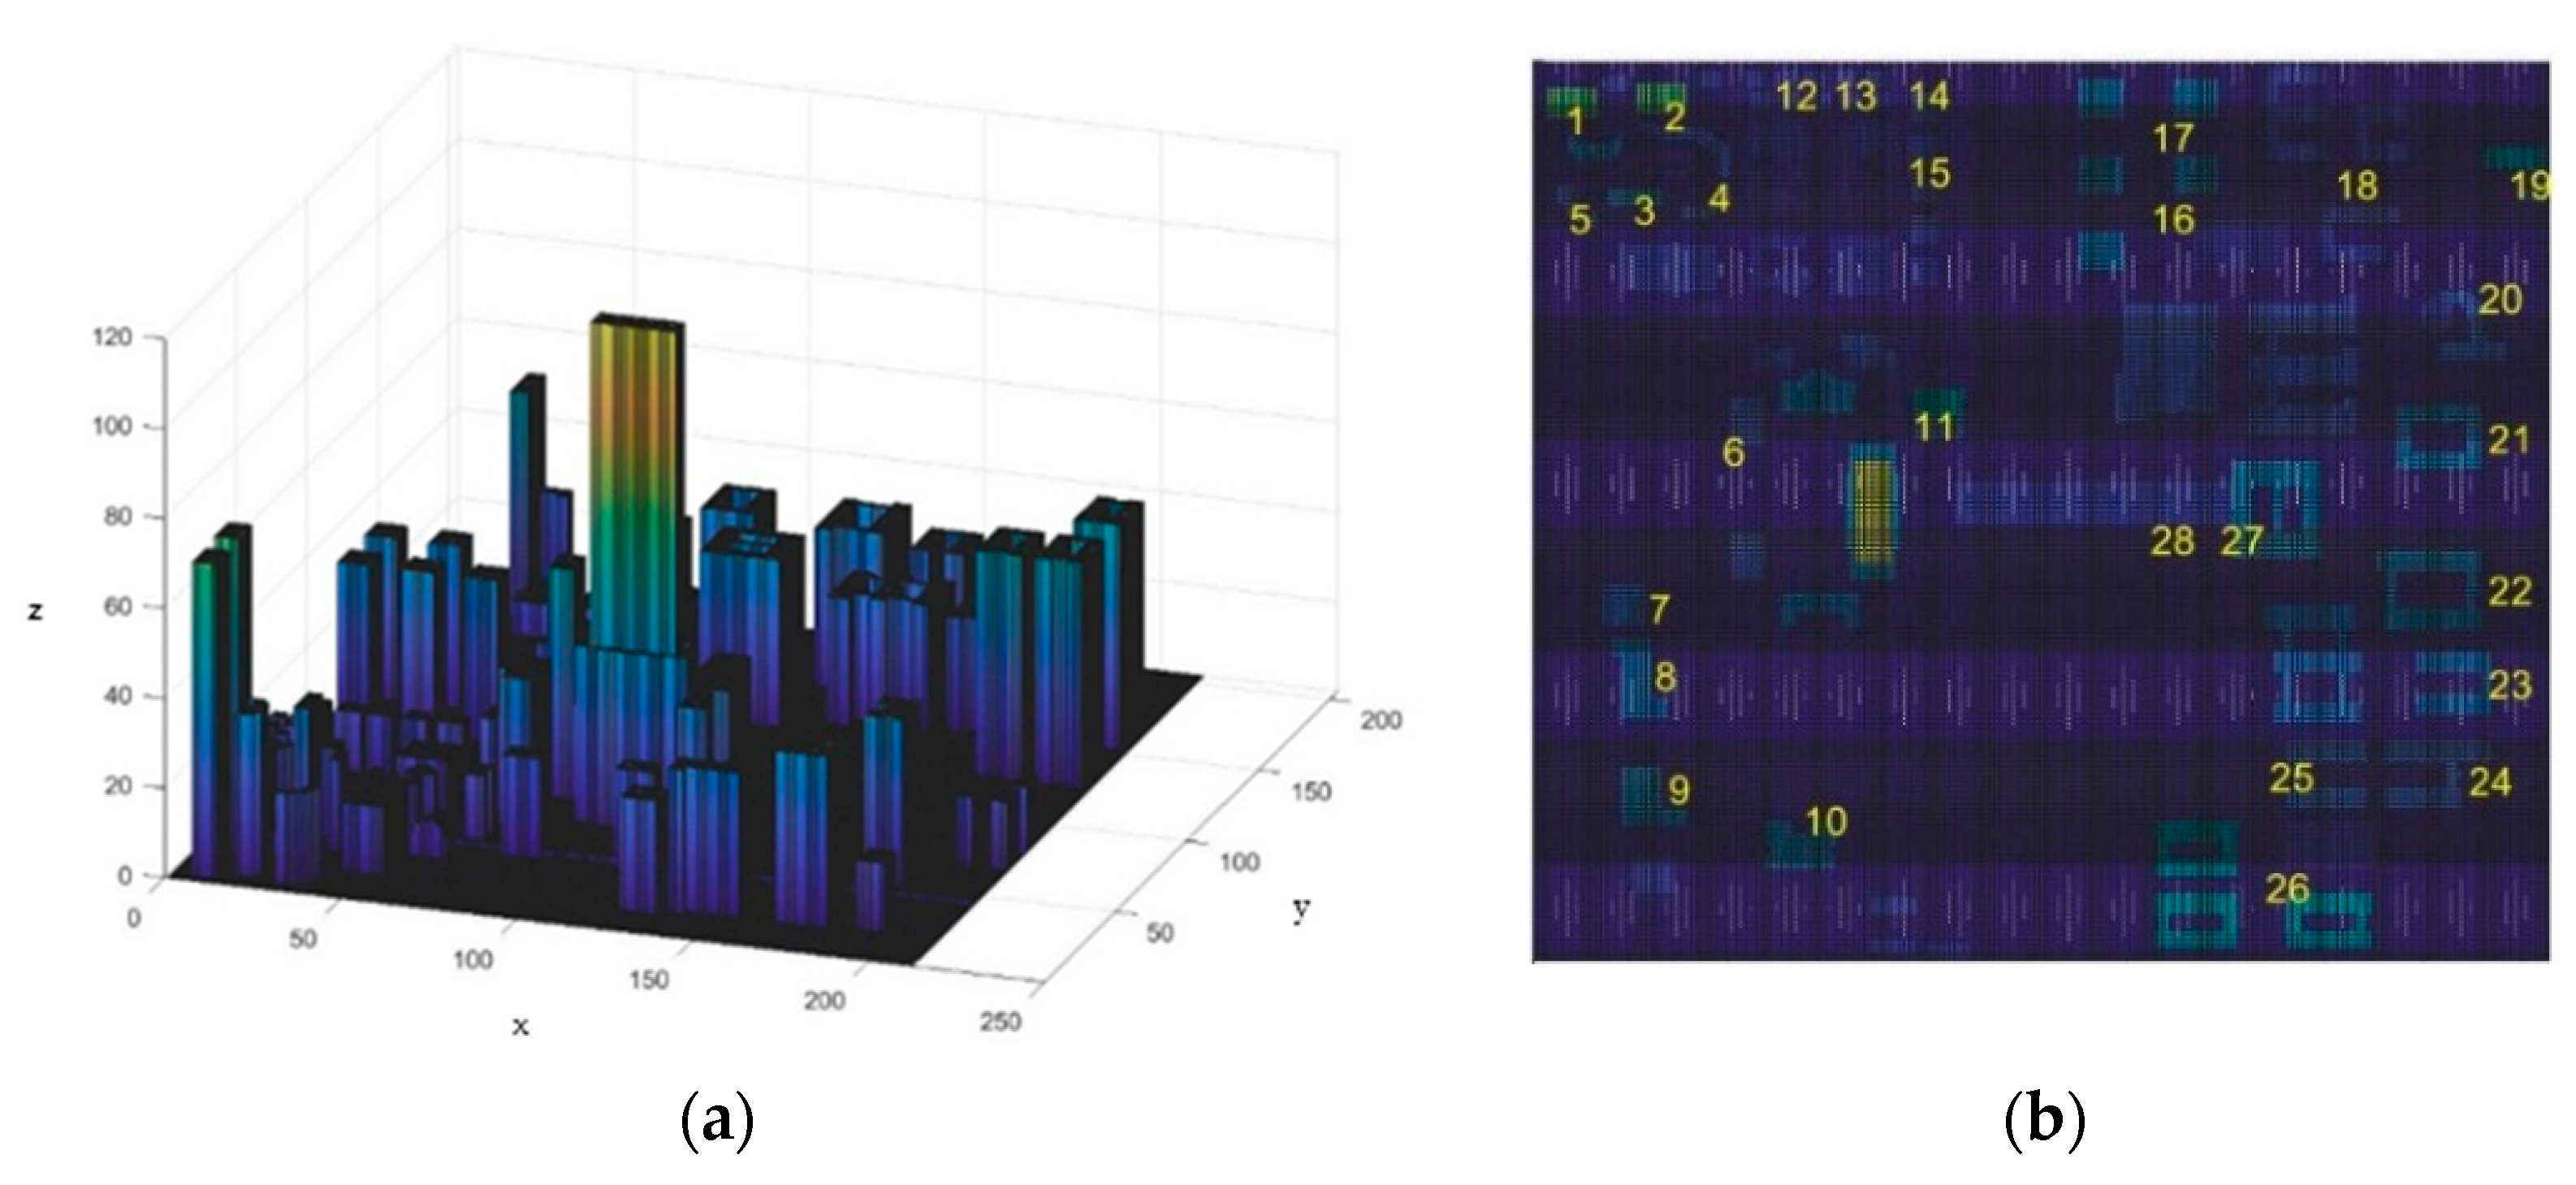
4.1. Simulation Environment

To prove the validity of the method proposed in this paper, Jiangjun Road Campus of Nanjing University of Aeronautics and Astronautics was selected as the environment of the air route network which can be seen in Figure 3. According to the actual situation, there were three supply centers belonging to two different service providers in this scenario. The demand points were fixed and concentrated in student dormitories and office buildings. Based on relevant data collection and analysis, experimental parameters and node information are shown in Table 1 and Table 2 respectively. All of the elevation data was obtained by field measurements. After airspace rasterization, a matrix of 215 by 205 was obtained. The altitude of logistics network was assumed at 50 m and the return layer was set at 30 m. The height of obstacles was mainly concentrated in the range of 30 to 50 m and the highest was 112 m.

4.2. Performance of Algorithm

According to the above descriptions, simulation was conducted. The contrasts of air route between improved CA and traditional CA can be seen in Table 3, Figure 4 and Figure 5, comprehensive factors of the air route network based on improved algorithm are shown in Table 4. Based on the improved CA algorithm, the route could effectively avoid obstacles and reduced the risk degree, especially in the area with dense obstacles, which effectively guarantees the flight safety. From the perspective of configuration, it was apparent that the route was relatively straight compared with the route solved by traditional CA, which decreased unnecessary turns and enabled the UAV to operate more quickly. The average distance of single route was 20% less than the traditional CA so that the flight time per route decreased by 18.2 s. Furthermore, through orientation of cellular step values and localization of cost, the improved algorithm was more intelligent in the search process. The average single path search time was only 3.5 s, which was 1.2 s quicker than that of the traditional search time.
In this case, the 28 waypoints in the region constituted 378 origin-destination (OD) pairs. The route set was established according to the optimal routes which found by the improved CA among all OD pairs. As shown in Figure 6, the optimal spanning tree algorithm was used to select 30 routes from it to build the distribution network, and the routes of the UAV directly returning to each supply center after completing the distribution task at the demand point constituted the return route network. Therefore, the double layer air route network was composed of logistics route network and direct return route, which is shown in Figure 7.
In the optimal spanning tree algorithm, from the view of the rationality of the distribution route network, in the absence of traffic flow data, the idea of gravity was innovatively introduced, which could effectively connect the important nodes and reduce the waste of resources. At the same time, the distances of all routes were within the range of 2800 m of the UAV. From the perspective of route configuration, the optimal spanning tree algorithm could reduce the intersection points, and the total number of intersection points was as low as 5, which reduced the conflict among different routes. The non-linear coefficient was 1.25, indicating that there was an approximate linear connection between waypoints and transportation was relatively convenient in this network. In the view of logistics distribution, the route network could not only meet the distribution requirements of service providers but also meet the service needs of customers. In terms of the route network connectivity, the global network connectivity reached 2.14, denoting that the network connectivity was mature and capable of rapid distribution.

5. Conclusions

An air route network planning algorithm based on the improved CA and the optimal spanning tree for logistics UAV in urban low altitude environment was proposed in this paper. The cost function was introduced in CA, which could effectively reduce route searching time, decrease unnecessary turns, and greatly shorten route length. In addition, the safety factor of the route was effectively improved, including the area of dense obstacles, which could also effectively avoid obstacles and would not be trapped in a local search. Furthermore, by introducing gravity in optimal spanning tree, the important nodes could be connected as far as possible to ensure mature network connectivity and convenience. Based on this air route network planning method, a network with less redundancy, minor airway intersections, and reasonable structure could be established. With the large-scale operation of drones, the probability of conflicts between different flights increases. In the future, we will further consider conflict resolution between drones. Another promising direction is to research the dynamic route networks to guarantee the safe and stable operation of drones.

Author Contributions

Conceptualization, H.Z.; methodology, H.Z.; software, S.L.; data curation, S.L.; writing—original draft preparation, Z.L.; writing—review and editing, H.L. All authors have read and agreed to the published version of the manuscript.

Funding

This research was funded by National Natural Science Foundation of China (71971114).

Institutional Review Board Statement

Not applicable.

Informed Consent Statement

Not applicable.

Data Availability Statement

Not applicable.

Acknowledgments

The authors acknowledge with thanks the support for this work by the College of Civil Aviation at Nanjing University of Aeronautics and Astronautics.

Conflicts of Interest

The authors declare no conflict of interest.

References

  1. Li, C.L.; Qu, W.Q.; Li, Y.D.; Huang, L.Y.; Wei, P. Overview on traffic management of urban air mobility (UAM) with eVTOL aircraft. J. Trfc. Trnsp. Eng. 2020, 20, 35–54. [Google Scholar]
  2. Zhang, H.H.; Zou, Y.Y.; Zhang, Q.Q.; Liu, H. Review of Research on Future Urban Air Mobility (UAM) Management. Acta Aeronaut. Astronaut. Sin. 2020, 42, 1–28. [Google Scholar]
  3. Menouar, H.; Guvenc, I.; Akkaya, K.; Uluagac, A.S.; Kadri, A.; Tunce, A. UAV-Enabled Intelligent Transportation Systems for the Smart City: Applications and Challenges. IEEE Commun. Mag. 2017, 55, 22–28. [Google Scholar] [CrossRef]
  4. Holden, J.; Goel, N. Fast-Forwarding to a Future of on-Demand Urban Air Transportation. Available online: https://www.uber.com/elevate.pdf (accessed on 27 October 2016).
  5. Airbus. Blueprint for the Sky: The Roadmap for the Safe Integration of Autonomous Aircraft. Available online: https://storage.googleapis.com/blueprint/Airbus_UTM_Blueprint.pdf (accessed on 5 September 2018).
  6. Thipphavong, D.P.; Apaza, R.; Barmore, B.; Battiste, V.; Verma, S.A. Urban air mobility airspace integration concepts and considerations. In Proceedings of the Aviation Technology, Integration, and Operations Conference, Atlanta, GA, USA, 25–29 June 2018. [Google Scholar]
  7. Xu, H.X. Ehang Intelligent City Air Traffic System White Paper. Available online: https://www.ehang.com/app/%E4%BA%BF%E8%88%AA%E6%99%BA%E8%83%BD%E5%9F%8E%E5%B8%82%E7%A9%BA%E4%B8%AD%E4%BA%A4%E9%80%9A%E7%B3%BB%E7%BB%9F%E7%99%BD%E7%9A%AE%E4%B9%A6.pdf (accessed on 18 January 2020).
  8. Amazon.com Inc. Amazon Prime Air. Available online: http://www.amazon.com/b?node=8037720011 (accessed on 12 June 2021).
  9. Dew Atlas. DHL Parcelcopter Takes to Tanzanian Skies. Available online: https://newatlas.com/dhl-parcelcopter-africa/56663/ (accessed on 5 October 2018).
  10. Zhao, J.; Xie, F. Cognitive and artificial intelligence system for logistics industry. Int. J. Innov. Comput. Appl. 2020, 11, 84–88. [Google Scholar] [CrossRef]
  11. Zhao, Y.; Zheng, Y. Construction and optimization of flight mission profile of urban logistics UAV. Flt. Dyn. 2021, 39, 54–59. [Google Scholar]
  12. Gong, Y.H. Research on Air Route Network Planning Technology. Master’s Thesis, Nanjing University of Aeronautics and Astronautics, Nanjing, China, 2015. [Google Scholar]
  13. Fan, H.D.; Ma, X.L.; Ye, W. Aircraft Low Altitude Penetration Route Planning Technology; National Defense Industry Press: Beijing, China, 2007. [Google Scholar]
  14. Zhang, Q.Q.; Xu, W.W.; Zhang, H.H.; Zou, Y.Y.; Chen, Y.T. Path planning for logistics UAV in complex low-altitude airspace. J. Beijing. Univ. Aeronaut. Astronaut. 2020, 46, 1275–1286. [Google Scholar]
  15. Zhang, H.H.; Li, H.; Liu, H.; Xu, W.W.; Zou, Y.Y. Path Planning for Logistics Unmanned Aerial Vehicle in Urban Area. J. Trnsp. Syst. Eng. Inf. Technol. 2020, 20, 22–29. [Google Scholar]
  16. Eberhart, R.; Kennedy, J. A new optimizer using particle swarm theory. In MHS’95, Proceedings of the Sixth International Symposium on Micro Machine and Human Science, Nagoya, Japan, 4–6 October 1995; IEEE: Manhattan, NY, USA, 1995. [Google Scholar]
  17. Tang, X.L.; Li, L.M.; Jiang, B.J. Mobile robot SLAM method based on multi-agent particle swarm optimized particle filter. J. China Univ. Posts Telecommunications 2014, 21, 78–86. [Google Scholar] [CrossRef]
  18. Xu, C.C.; Liao, X.H.; Yue, H.Y.; Lu, M.; Chen, X.W. Construction of a UAV Low-altitude Public Air Route based on an Improved Ant Colony Algorithm. J. Geo-Inf. Sci. 2019, 21, 570–579. [Google Scholar]
  19. Xu, C.; Liao, X.; Ye, H.; Yue, H. Iterative construction of low-altitude UAV air route network in urban areas: Case planning and assessment. J. Geogr. Sci. 2020, 30, 1534–1552. [Google Scholar] [CrossRef]
  20. Duan, H.B.; Zhang, X.Y.; Wu, J.; Ma, G.J. Max-Min Adaptive Ant Colony Optimization Approach to Multi-UAVs Coordinated Trajectory Replanning in Dynamic and Uncertain Environments. J. Bionic Eng. 2009, 6, 161–173. [Google Scholar] [CrossRef]
  21. Wang, S.J.; Gong, Y.H. Research on air route network nodes optimization with avoiding the three areas. Saf. Sci. 2014, 66, 9–18. [Google Scholar] [CrossRef]
  22. Mccaskill, J.S.; Packard, N.H. Analysing Emergent Dynamics of Evolving Computation in 2D Cellular Automata. In Proceedings of the International Conference on Theory and Practice of Natural Computing, Kingston, ON, Canada, 9–11 December 2019. [Google Scholar]
Figure 1. Three common cellular neighbor structures.
Sustainability 13 13079 g001
Figure 2. Schematic diagram of transit route.
Sustainability 13 13079 g002
Figure 3. Simulation environment, where (a) represents the simulation scene and (b) represents the serial number of all demand points and supply centers.
Sustainability 13 13079 g003
Figure 4. Routes planned by improved CA.
Sustainability 13 13079 g004
Figure 5. Routes planned by traditional CA.
Sustainability 13 13079 g005
Figure 6. Air route network, where (a) represents the the distribution route network and (b) represents the return route network.
Sustainability 13 13079 g006
Figure 7. Double layer air route network.
Sustainability 13 13079 g007
Table 1. Parameter setting for air route network.
ParameterValueParameterValue
Length of grid cell l g 5 mWidth of grid cell v g 5 m
Planned area 1.0865 km2Supply centers’ number3
Distance weight α 1 0.6Demand points’ number m 25
Risk degree weight α 2 0.4Weight of segment gravity λ 1 0.5
Scaling factor of risk degree β 100Weight of segment distance λ 2 0.5
Maximum turning Angle φ max π / 2 Scaling factor of segment μ 100
Turning buffer distance d min 5 mMaximum range of UAV L max 2800 m
Service providers’ number k 2UAV speed 5 m/s
Table 2. Index of demand point (D) and supply center (S).
No.TypeCoordinateNode ImportanceNo.TypeCoordinateNode Importance
1D(14, 7)0.05963815D(26, 76)0.036818
2D(13, 27)0.060116D(37, 125)0.115057
3D(35, 21)0.02454617D(18, 125)0.050571
4D(32, 36)0.01227318D(29, 162)0.050571
5D(37, 8)0.01227319D(29, 197)0.019176
6S of A(92, 39)0.720D(56, 191)0.019176
7D(129, 24)0.02454621D(89, 193)0.019176
8D(145, 25)0.02454622D(125, 193)0.019176
9D(172, 28)0.02454623D(147, 193)0.019176
10D(179, 55)0.02454624D(170, 189)0.019176
11D(86, 77)0.02454625D(169, 149)0.019176
12D(8, 49)0.0265426D(195, 148)0.115057
13D(8, 61)0.0265427S of A(113, 139)0.3
14D(8, 76)0.02454628S of B(113, 125)0.5
Notes: A denotes the first service provider, and B represents the second service provider.
Table 3. Comparison between traditional CA and improved CA.
IndexTraditional CAImproved CA
Total time consuming/s18261410.1
Average time consuming/s4.73.5
Average number of search steps135108
Average single route length/m716625.3
Average flight time/s143.2125.1
Average number of turns176
Table 4. Air route network evaluation index.
IndexOptimized Network
Total length D / m 7233.3
Nonlinear coefficient ξ 1.25
Segment number M 30
Intersection number5
Network connectivity 2 M N 2.14
Network density M S 6.657
Publisher’s Note: MDPI stays neutral with regard to jurisdictional claims in published maps and institutional affiliations.

