
Analysis of Changes in Land Use/Land Cover and Hydrological Processes Caused by Earthquakes in the Atsuma River Basin in Japan


Abstract
:
1. Introduction
2. Data and Methods
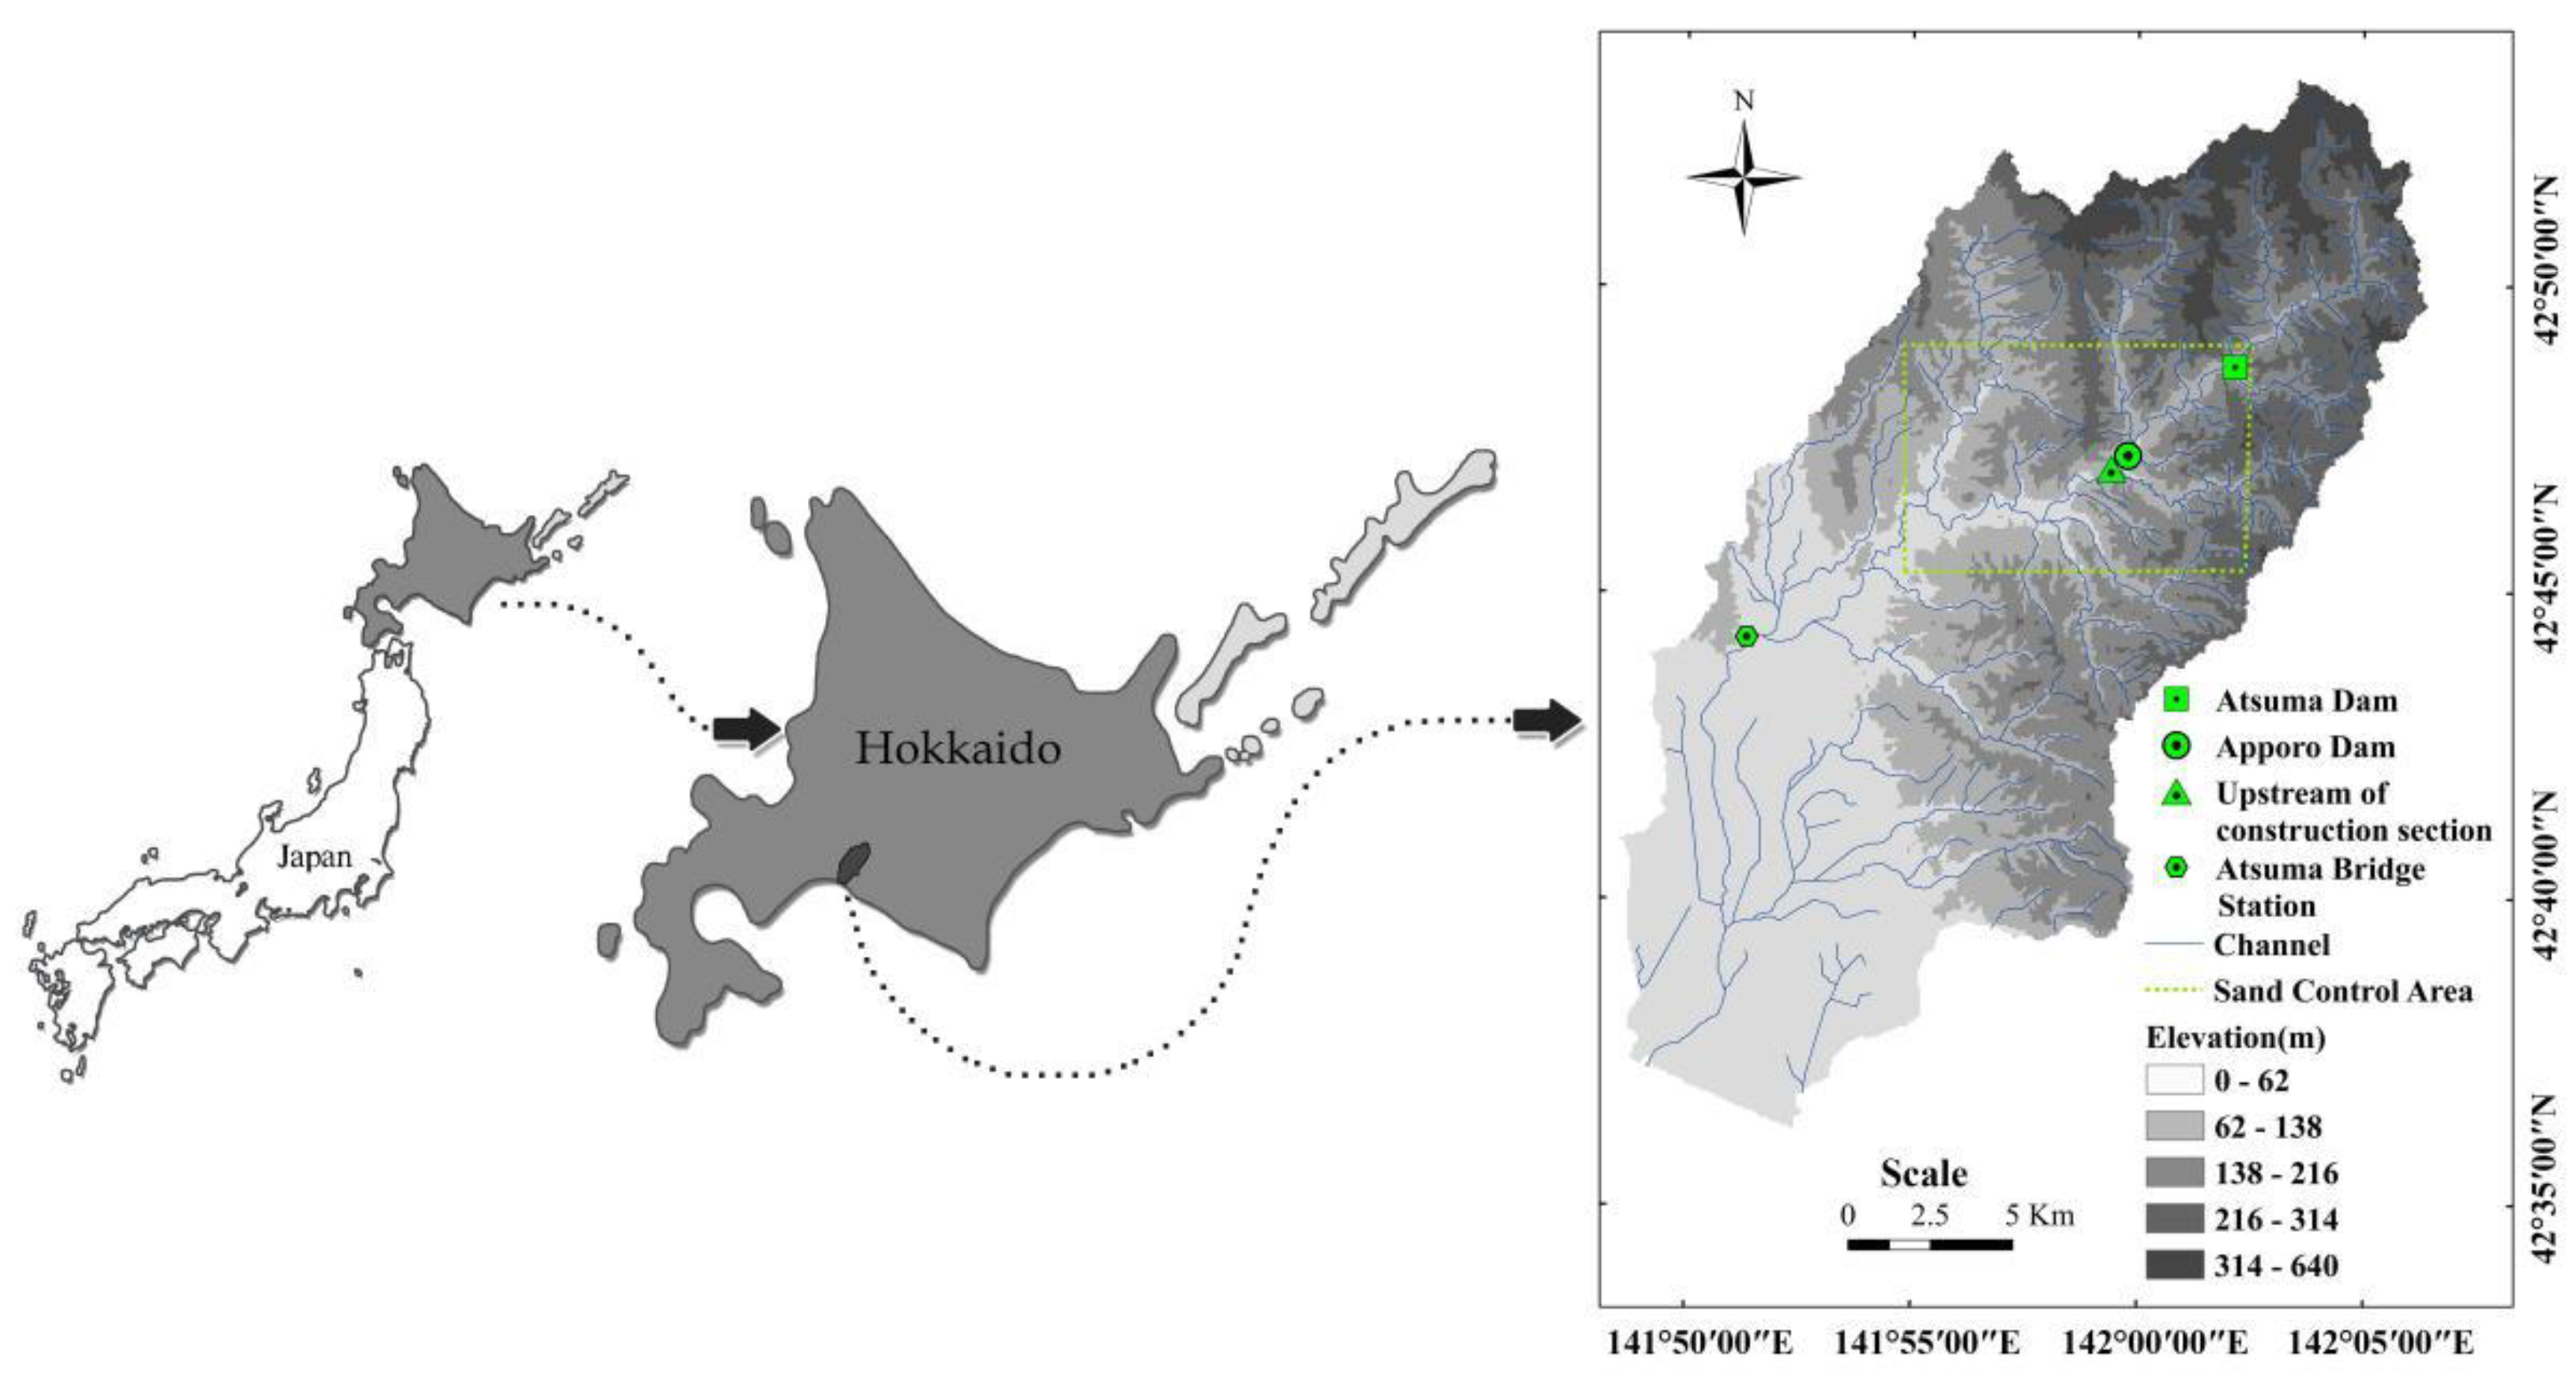
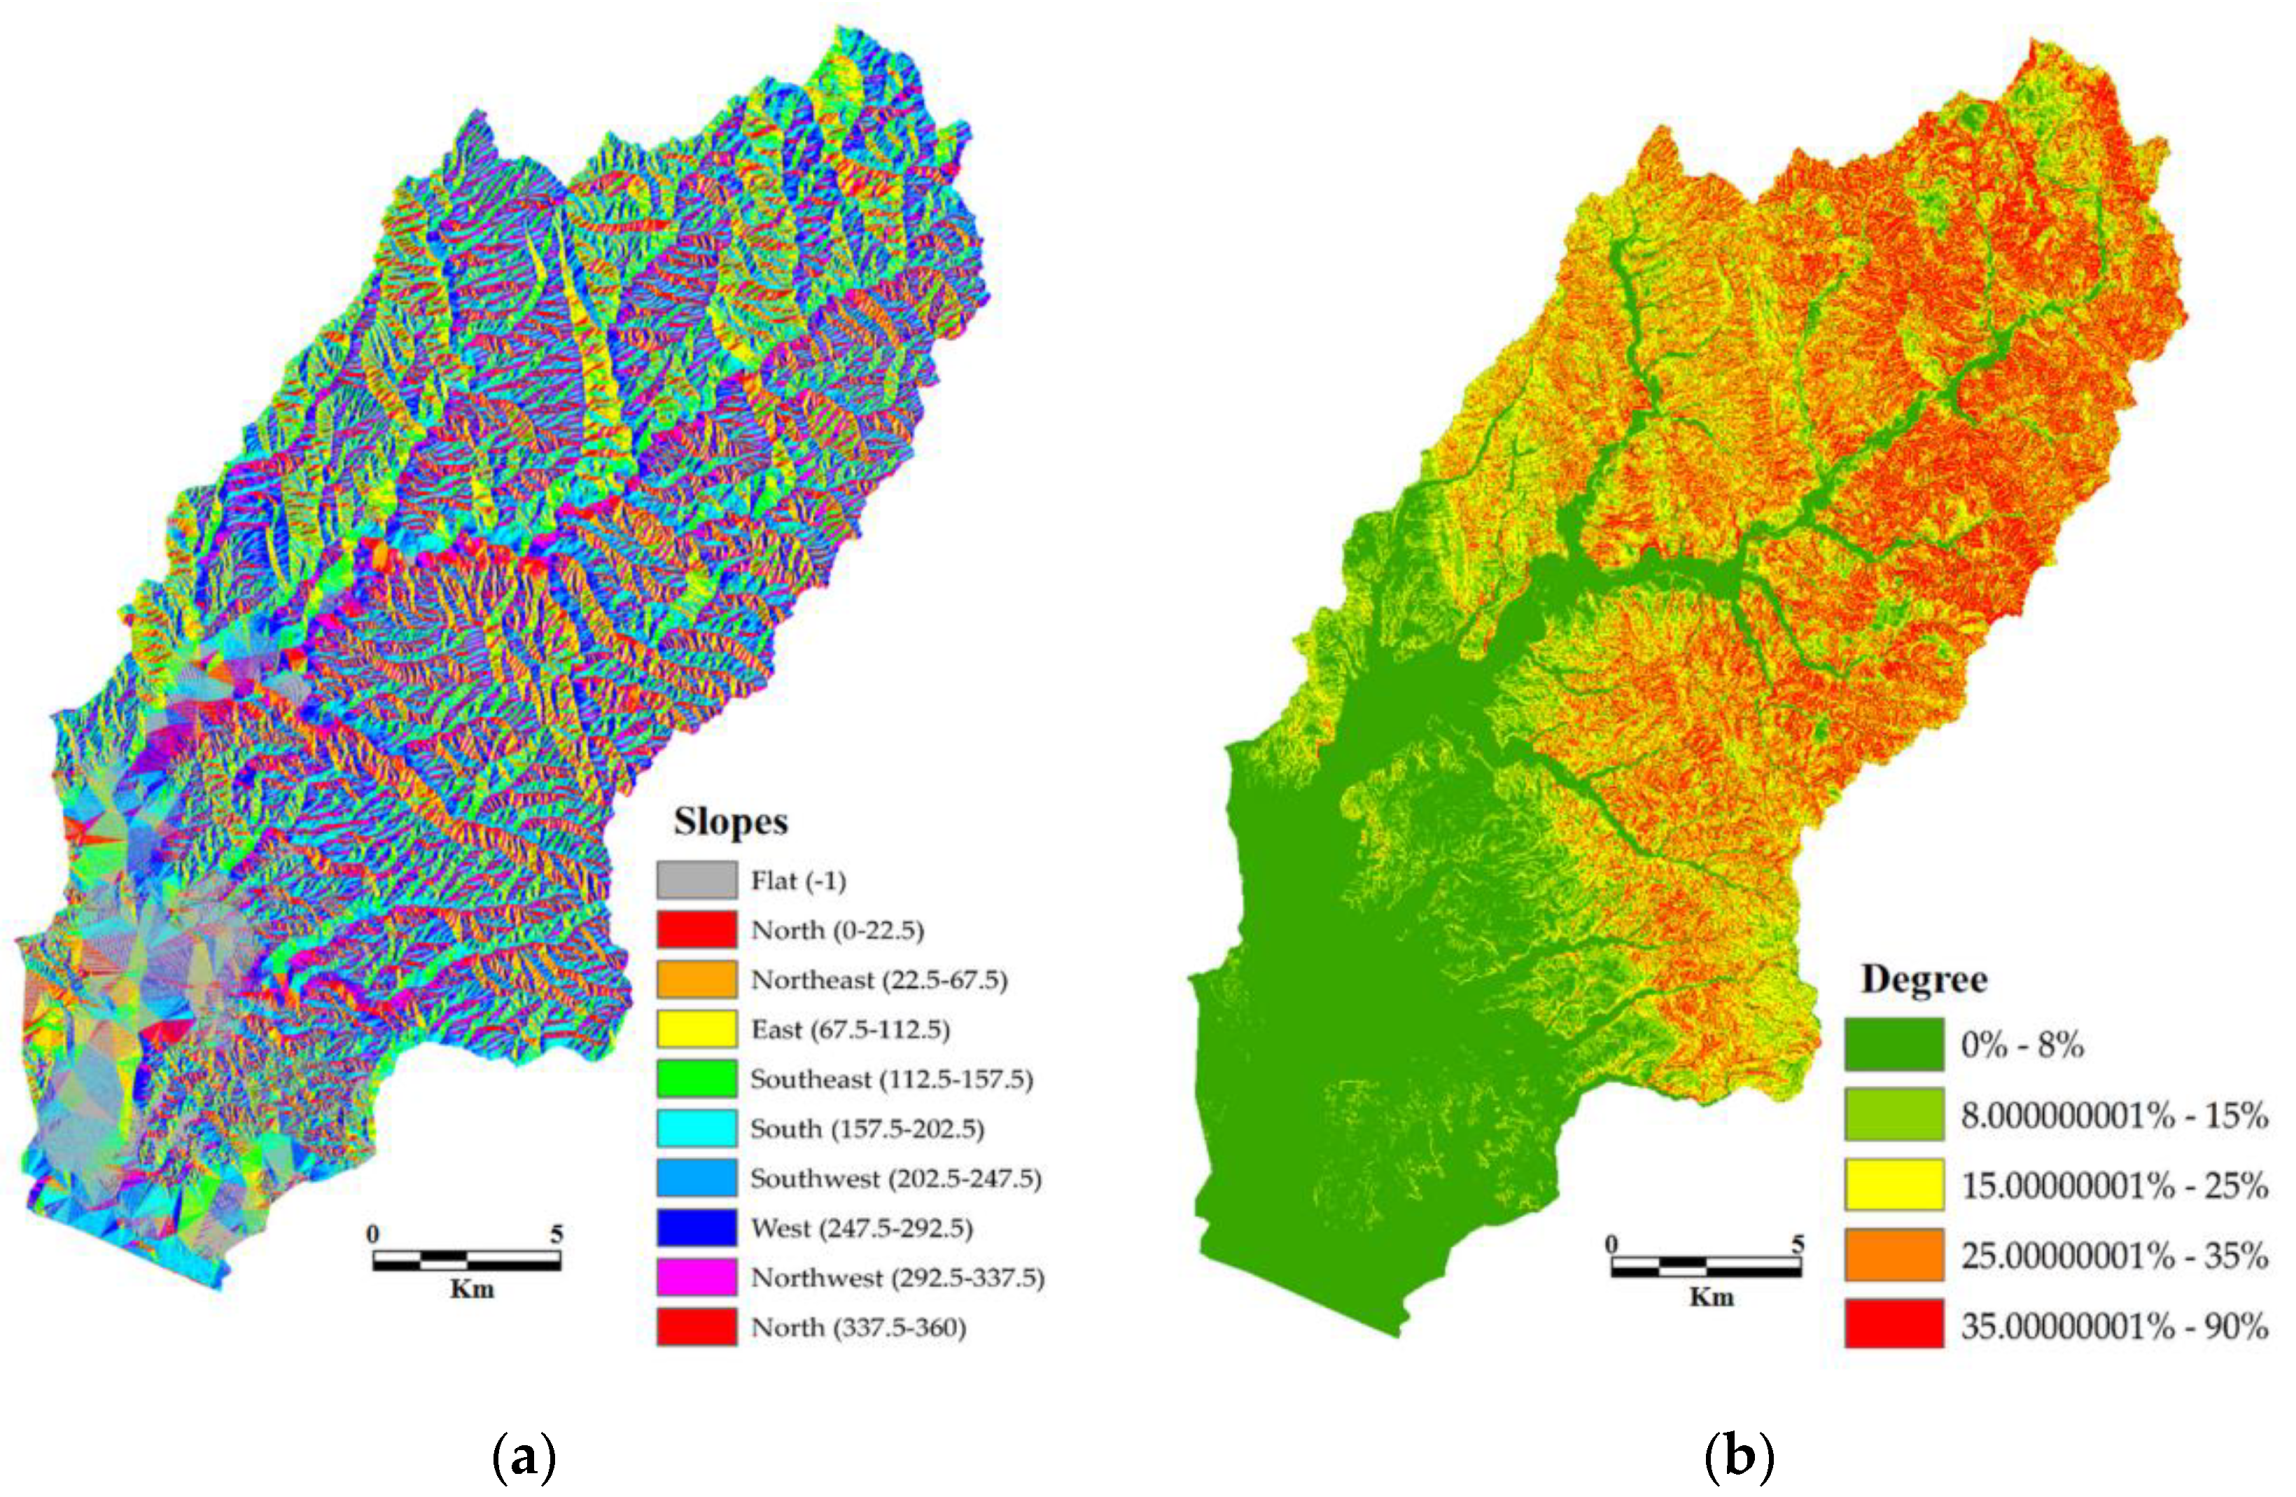
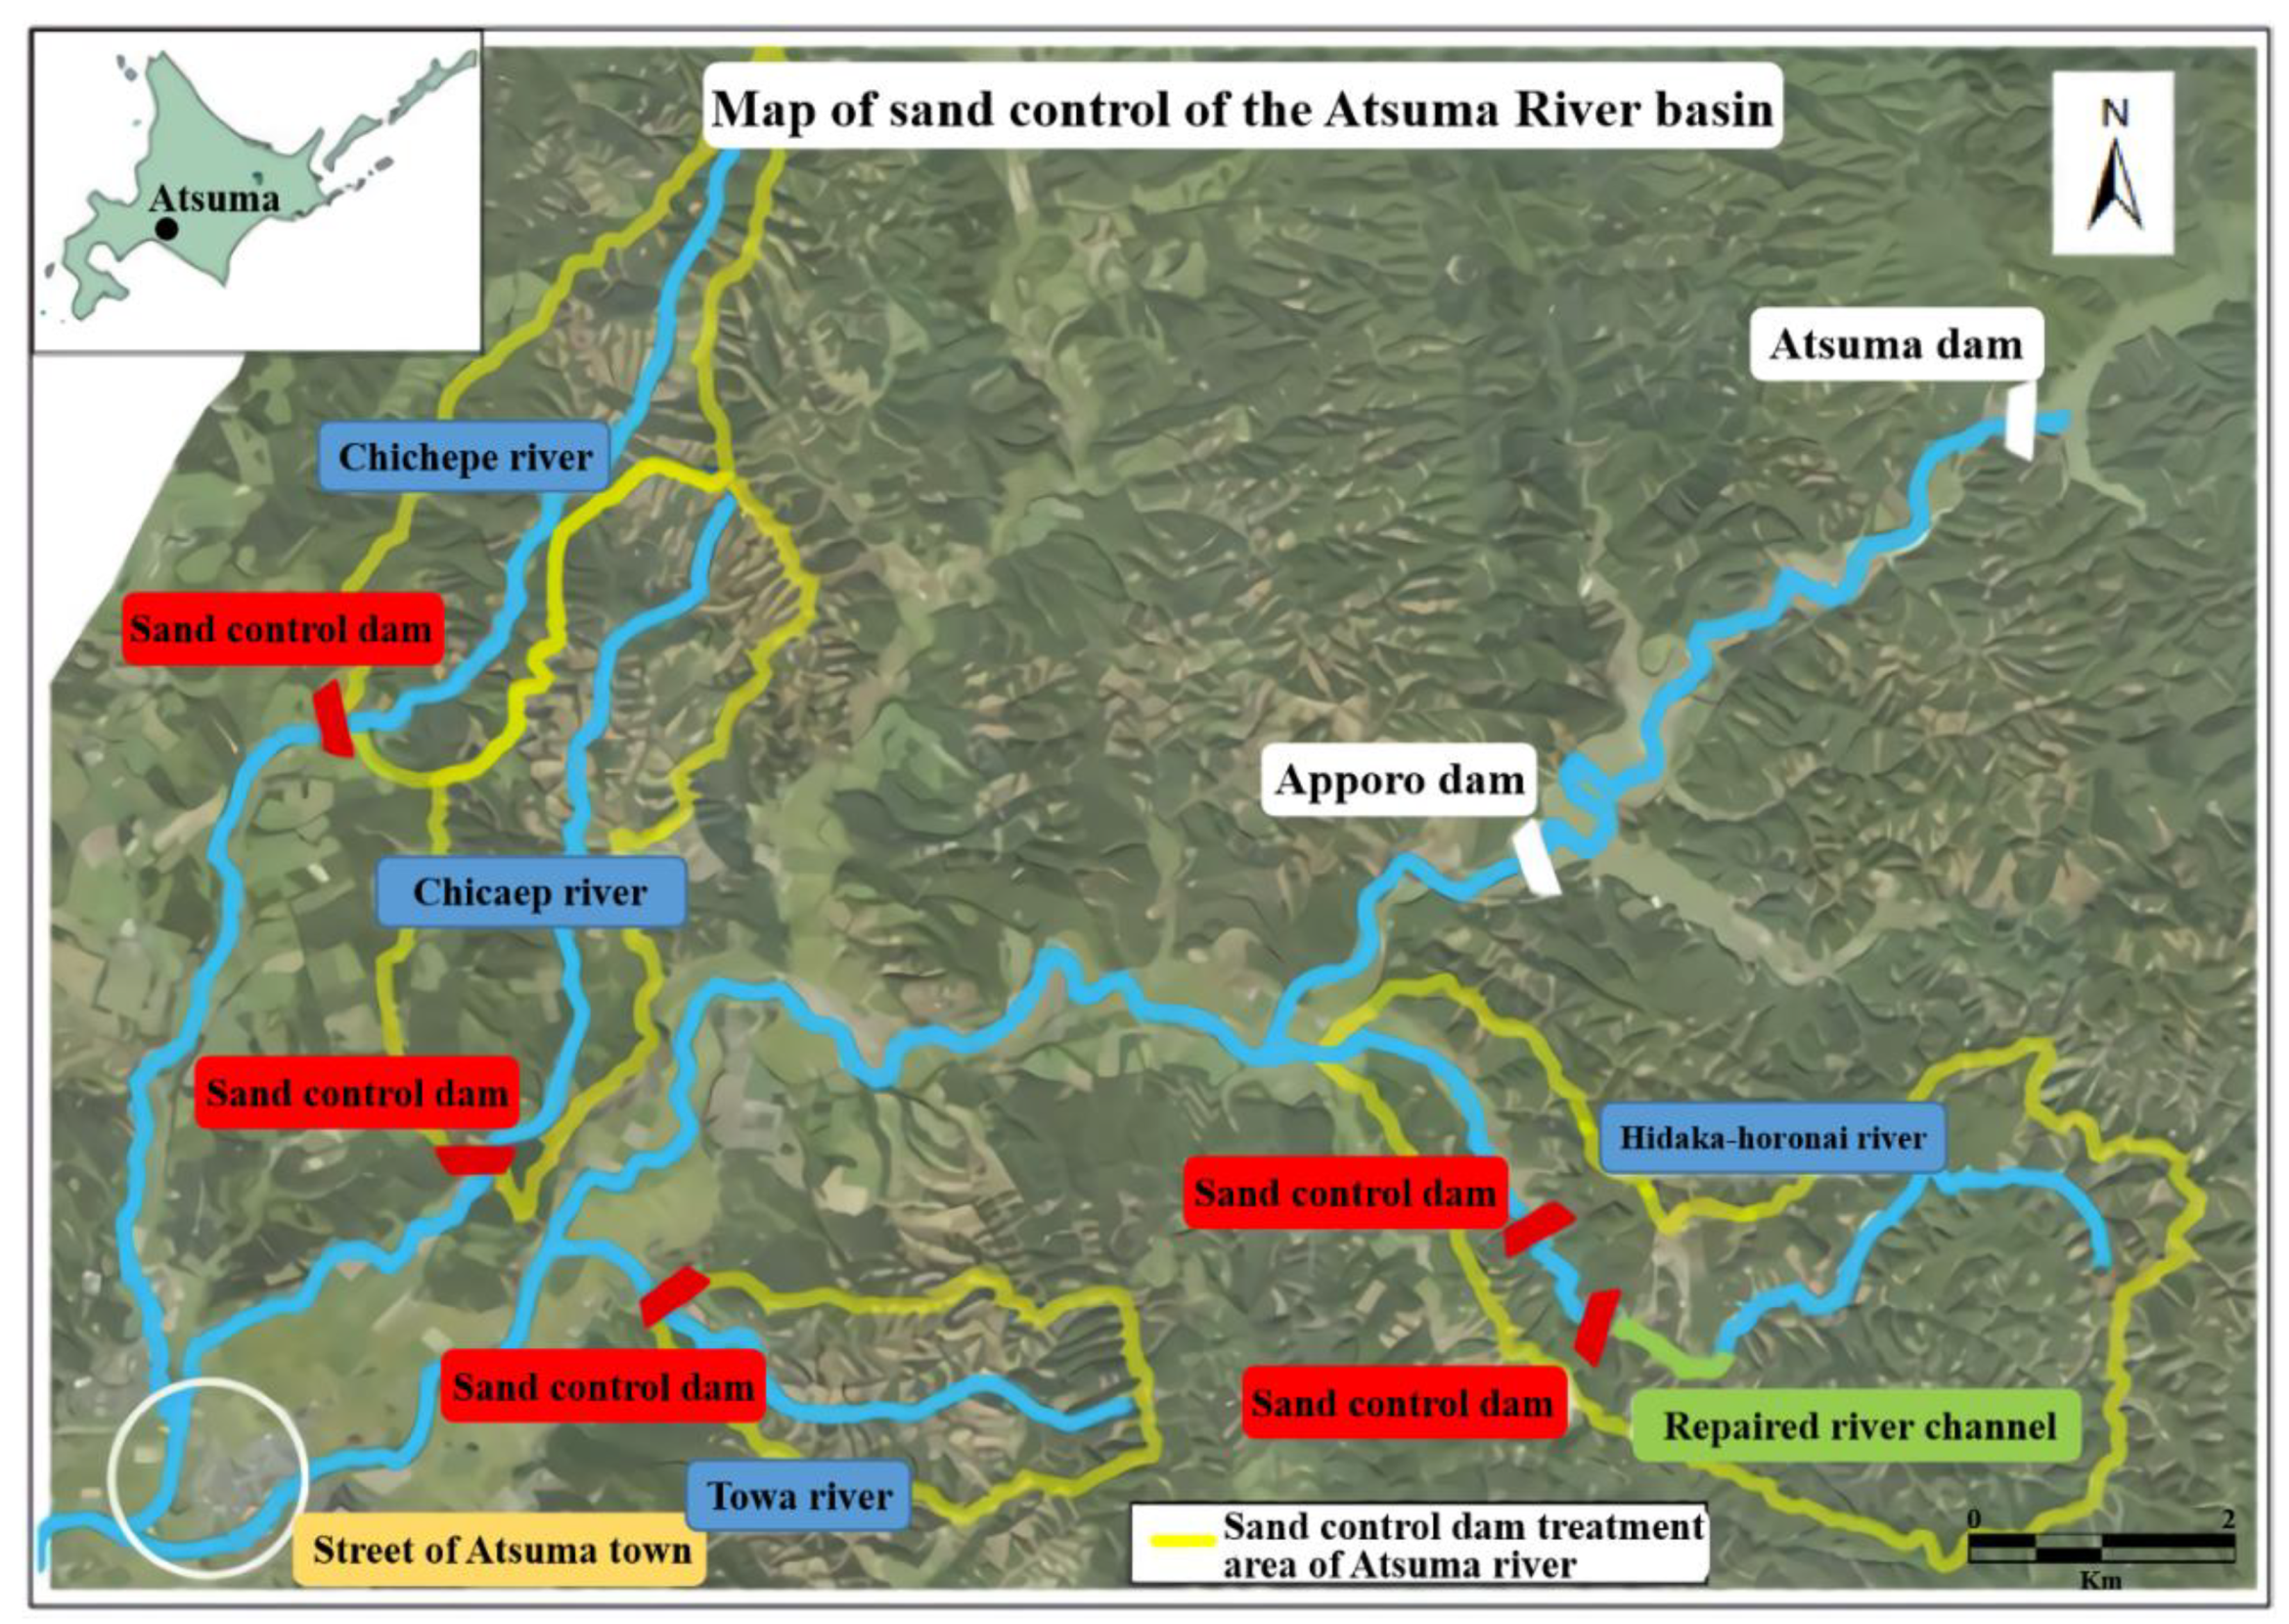
2.1. Study Ragion
2.2. Main Event
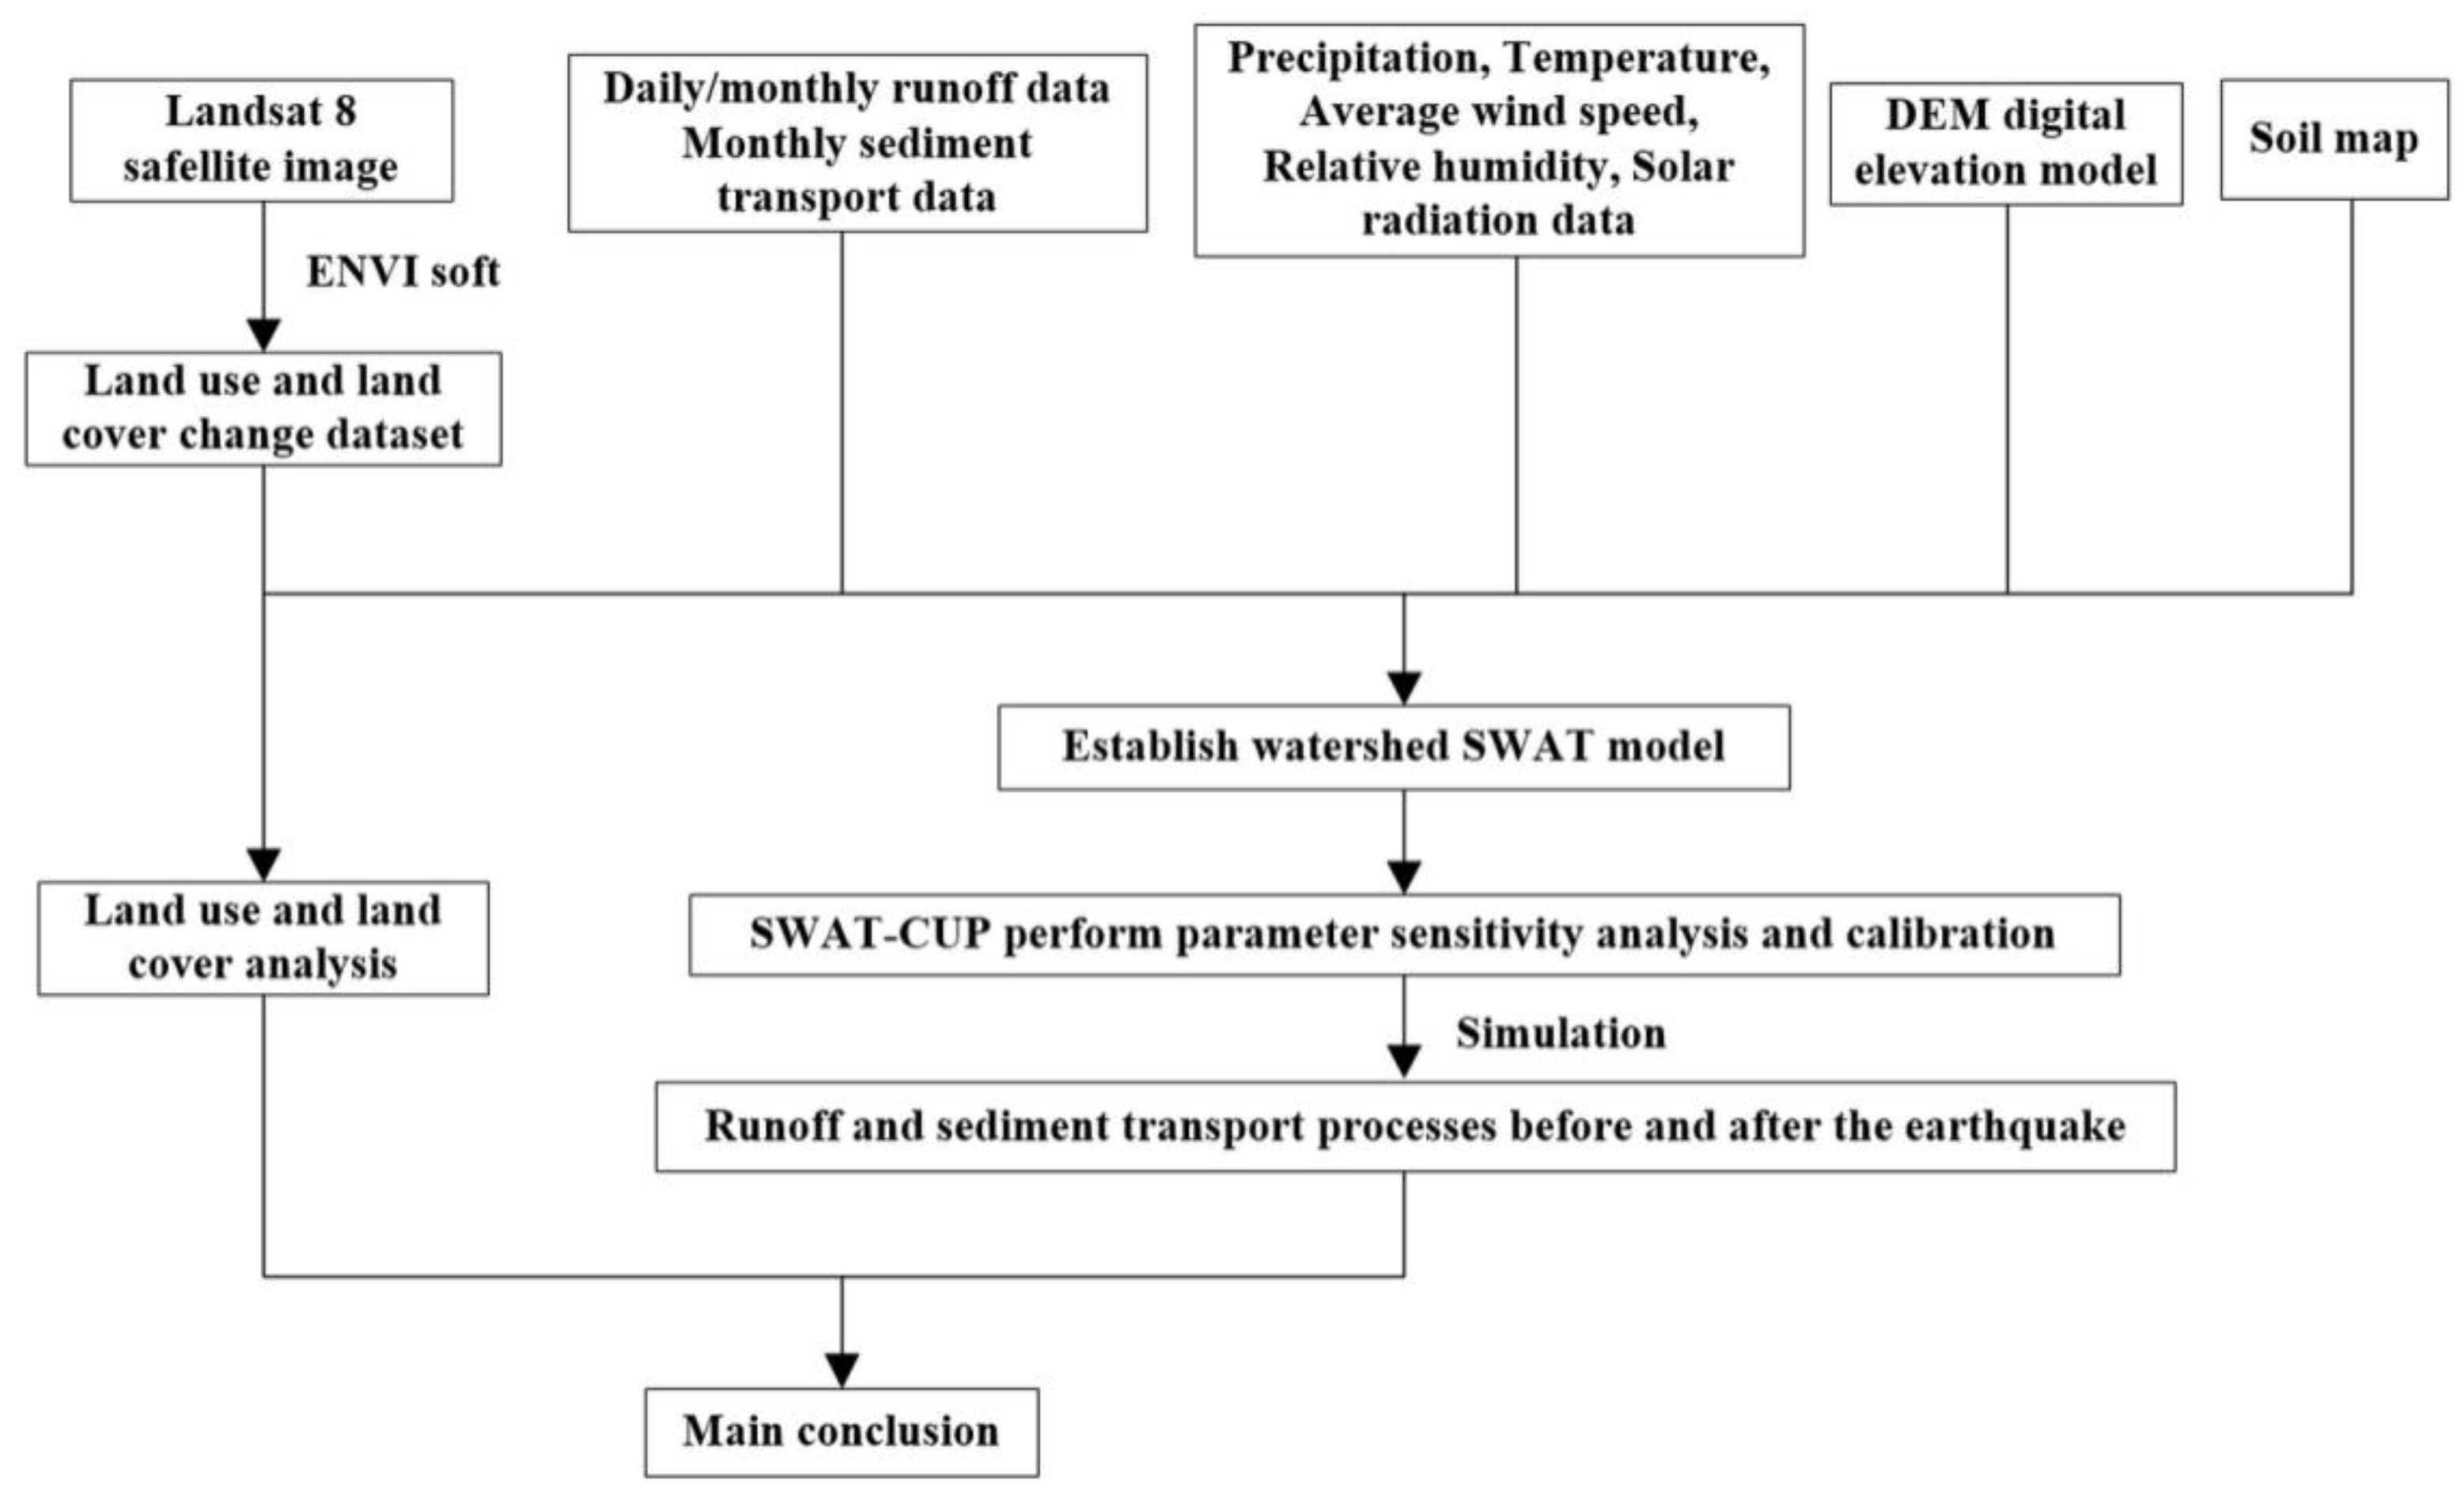
2.3. Hydrological Modeling
2.4. Datasets
2.5. Methods
3. Results and Discussion
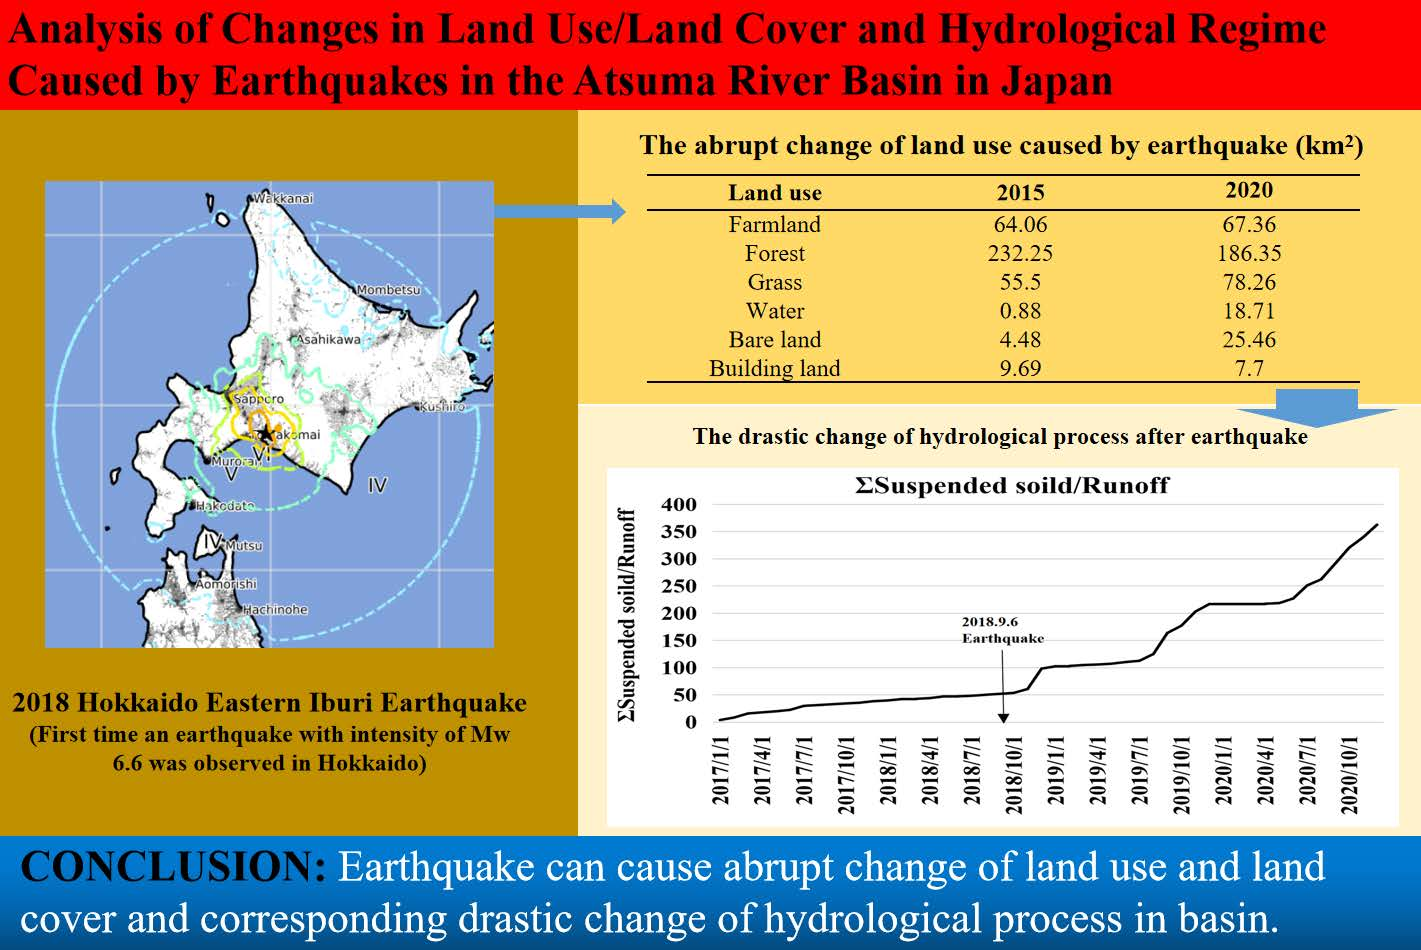
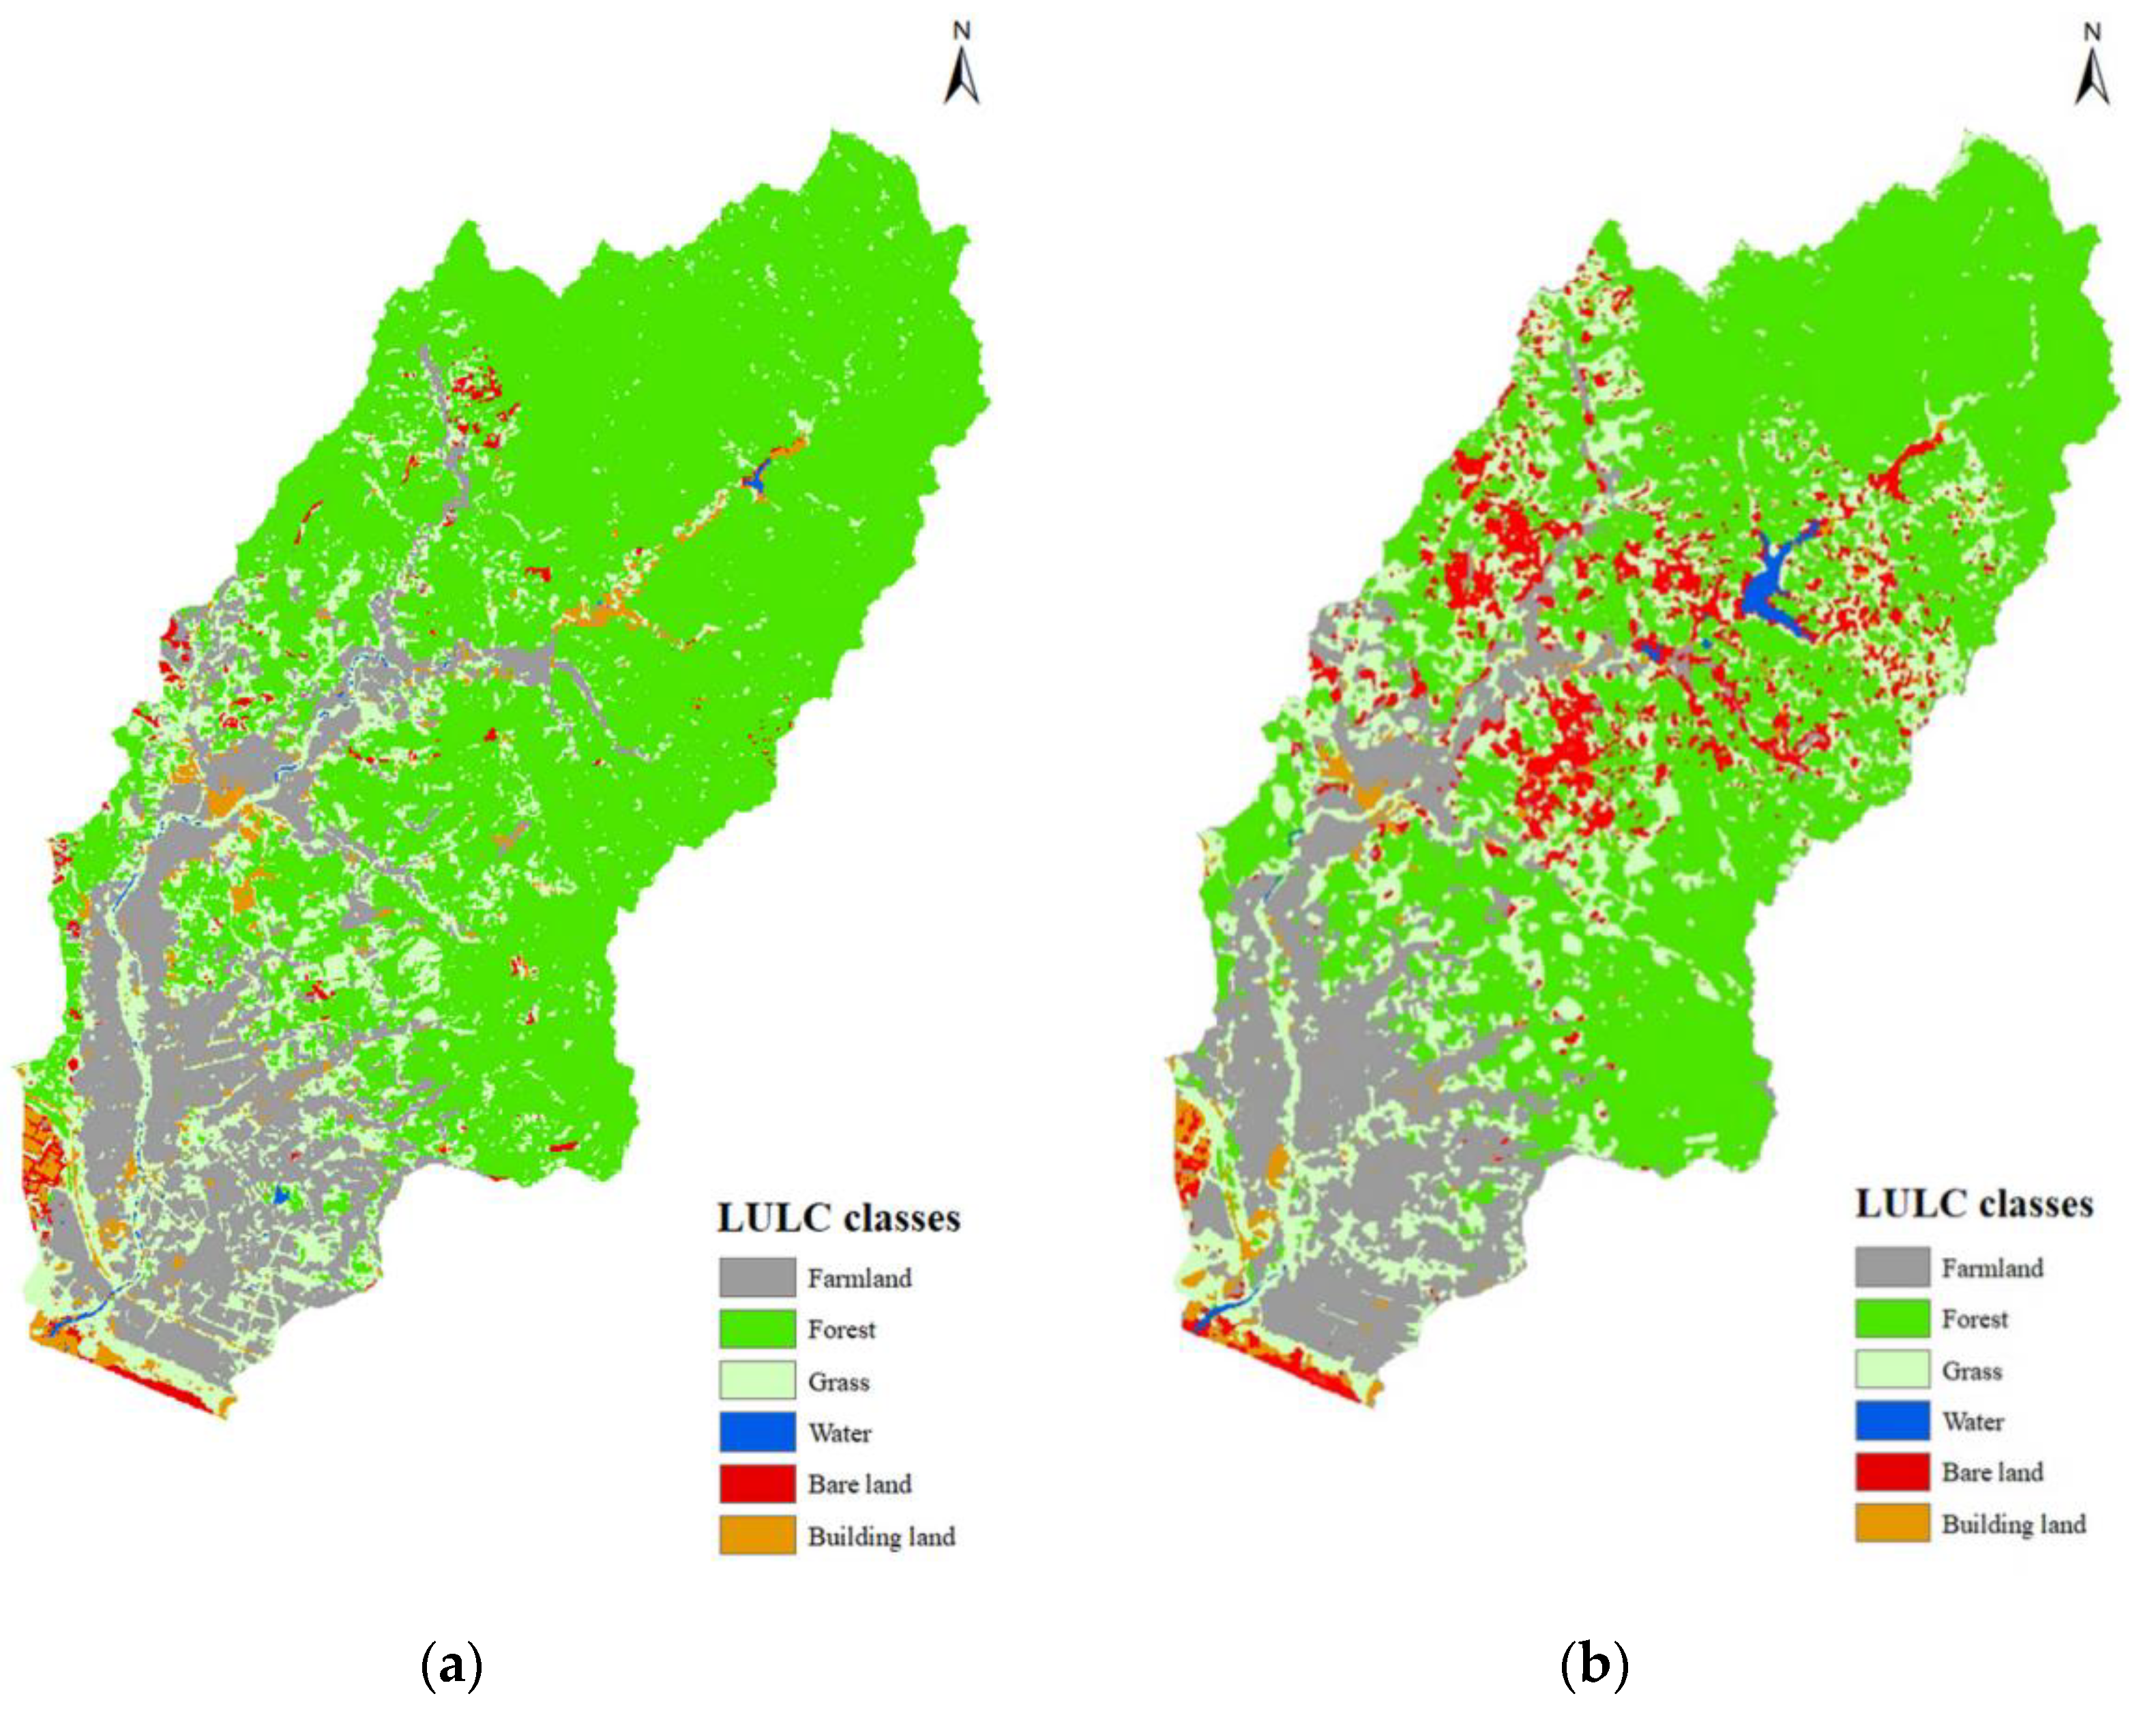
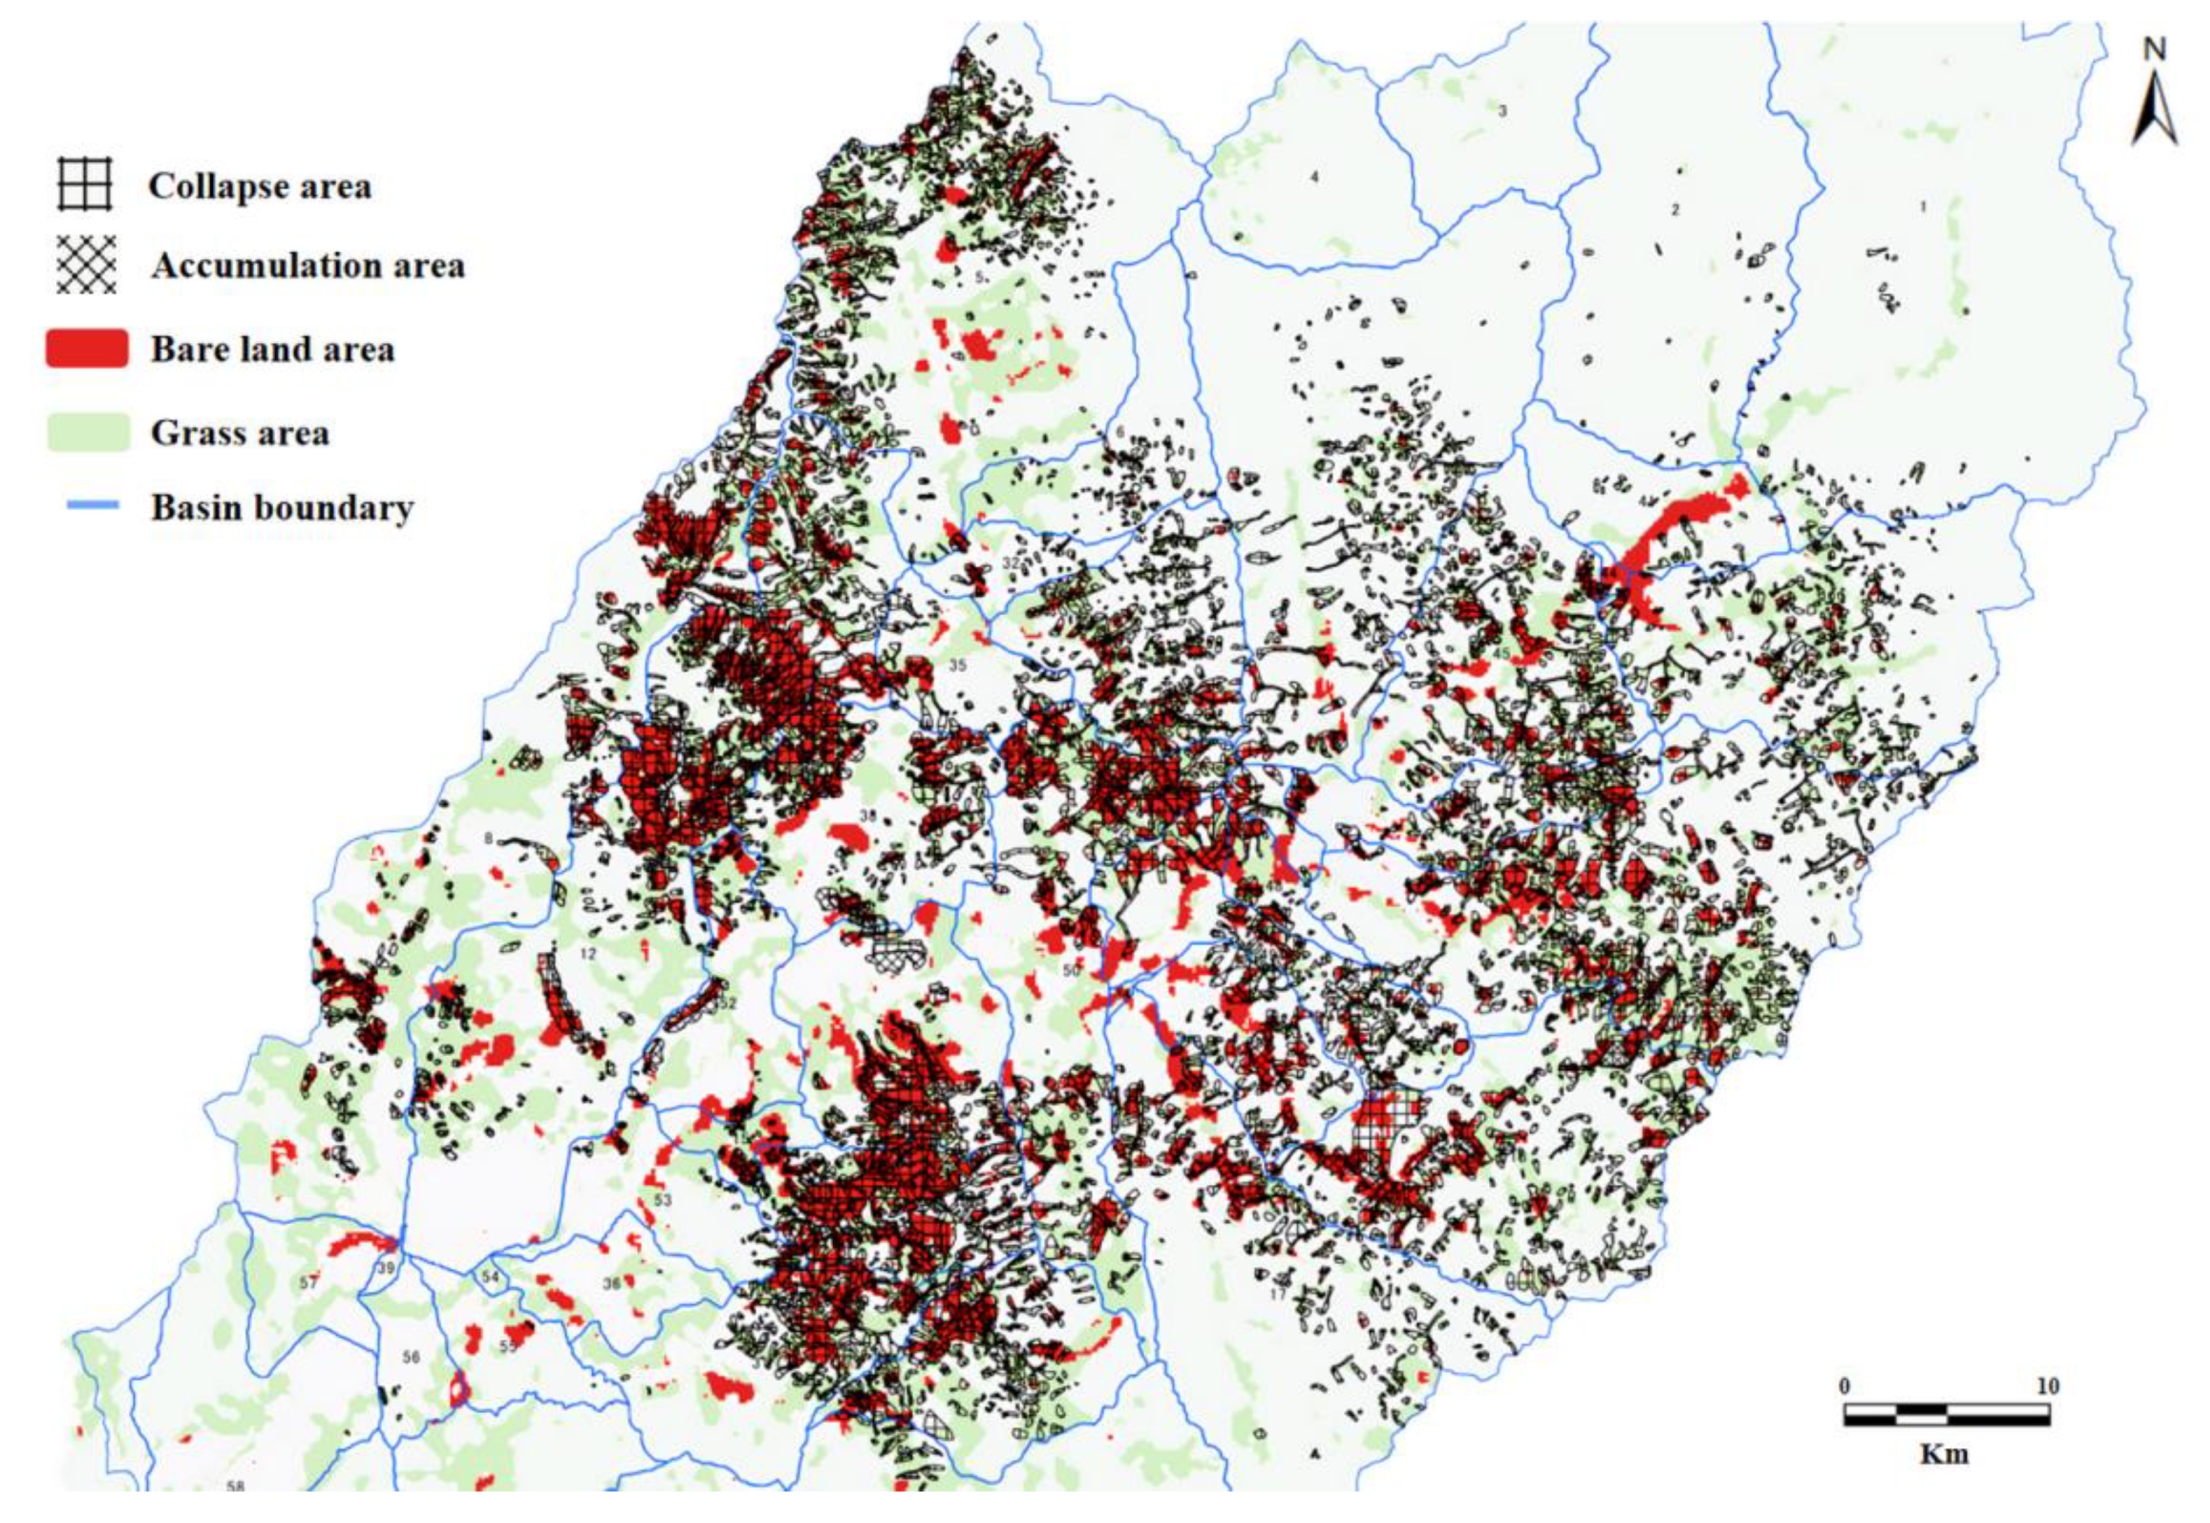
3.1. Land Use and Land Cover Change Analysis
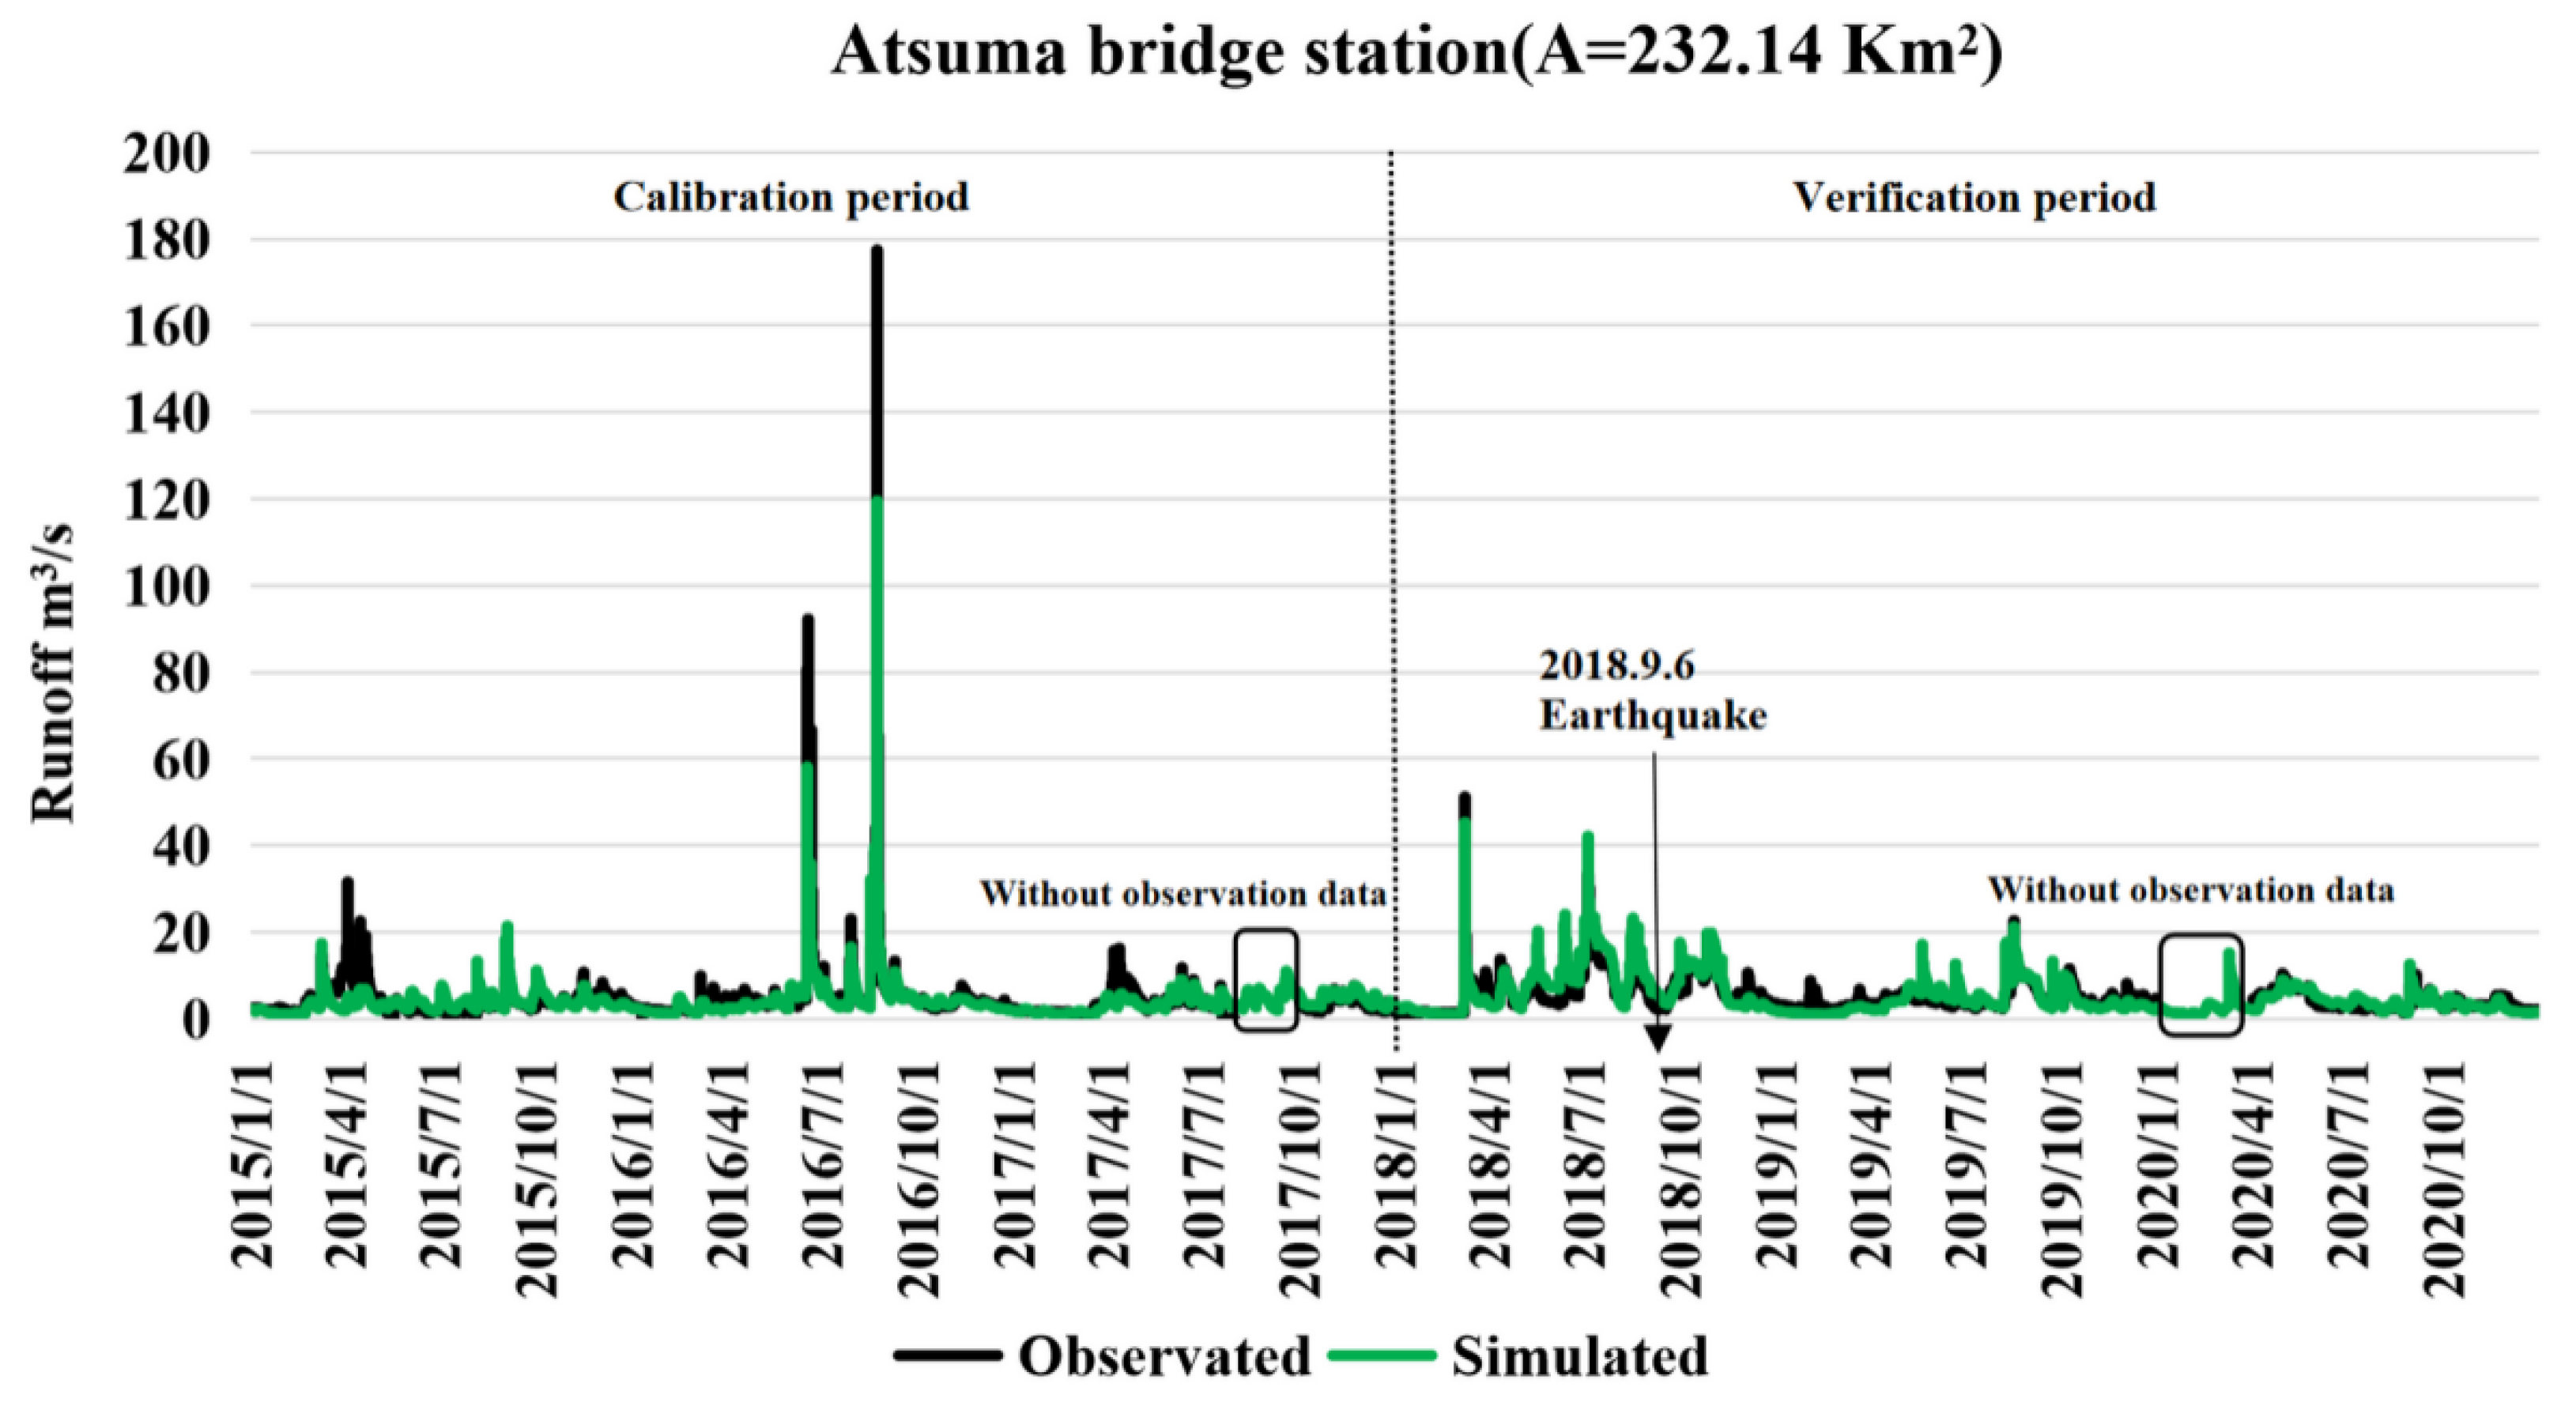
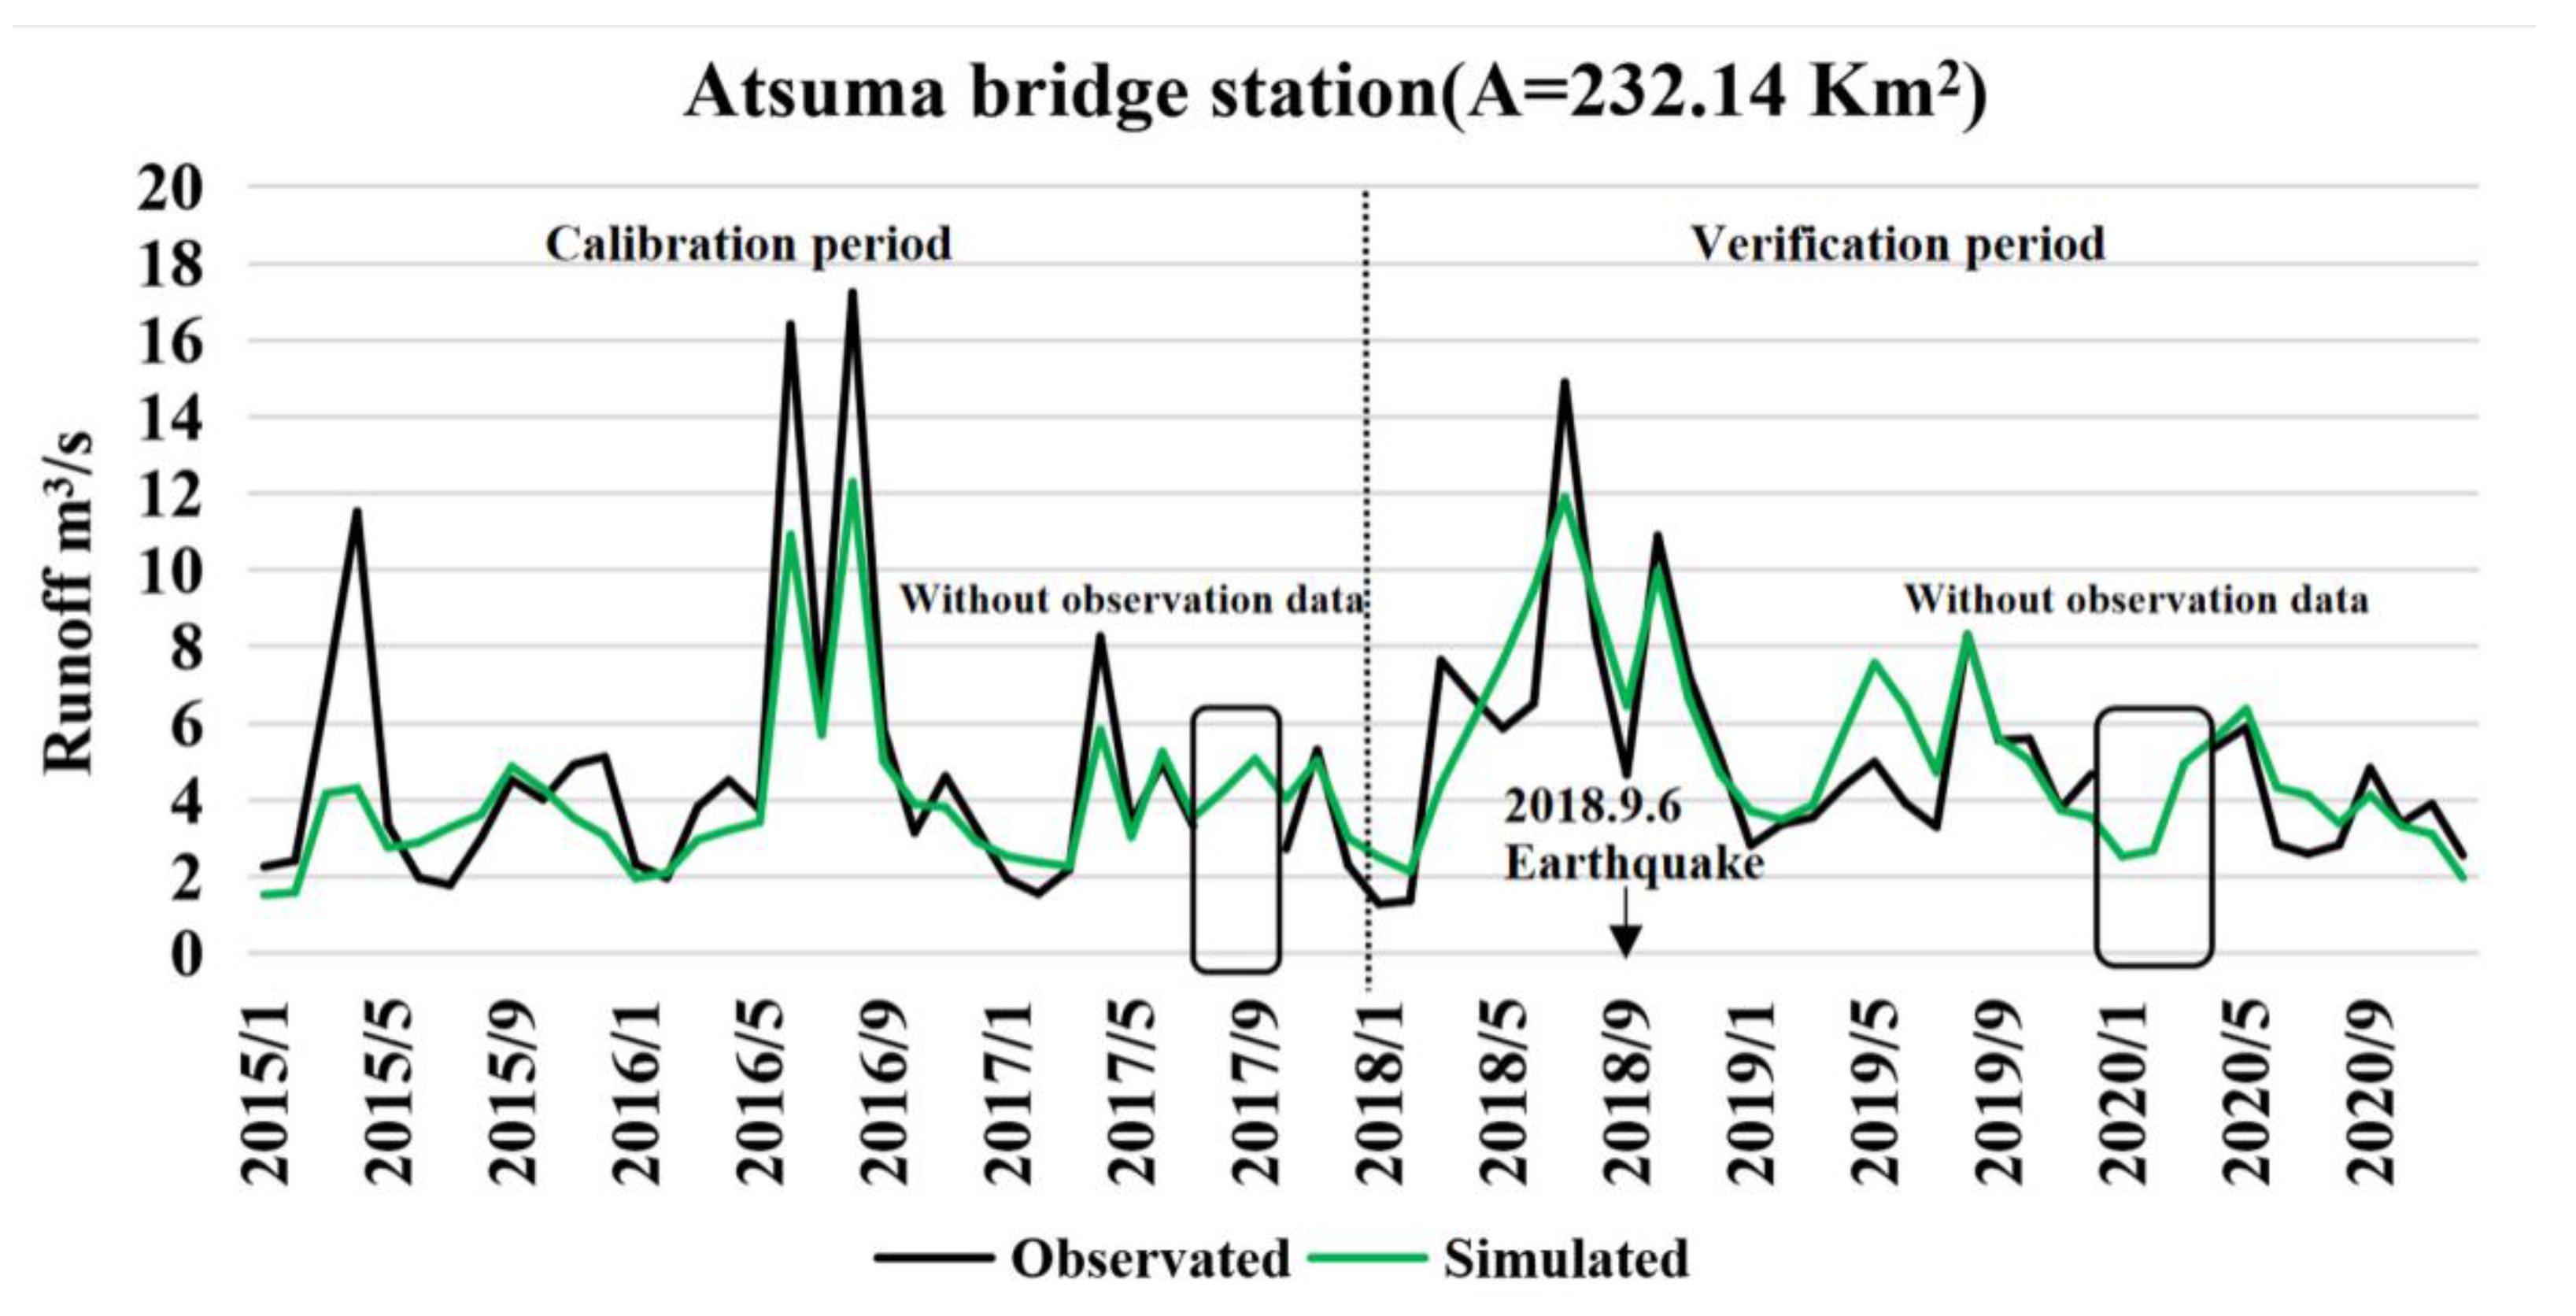
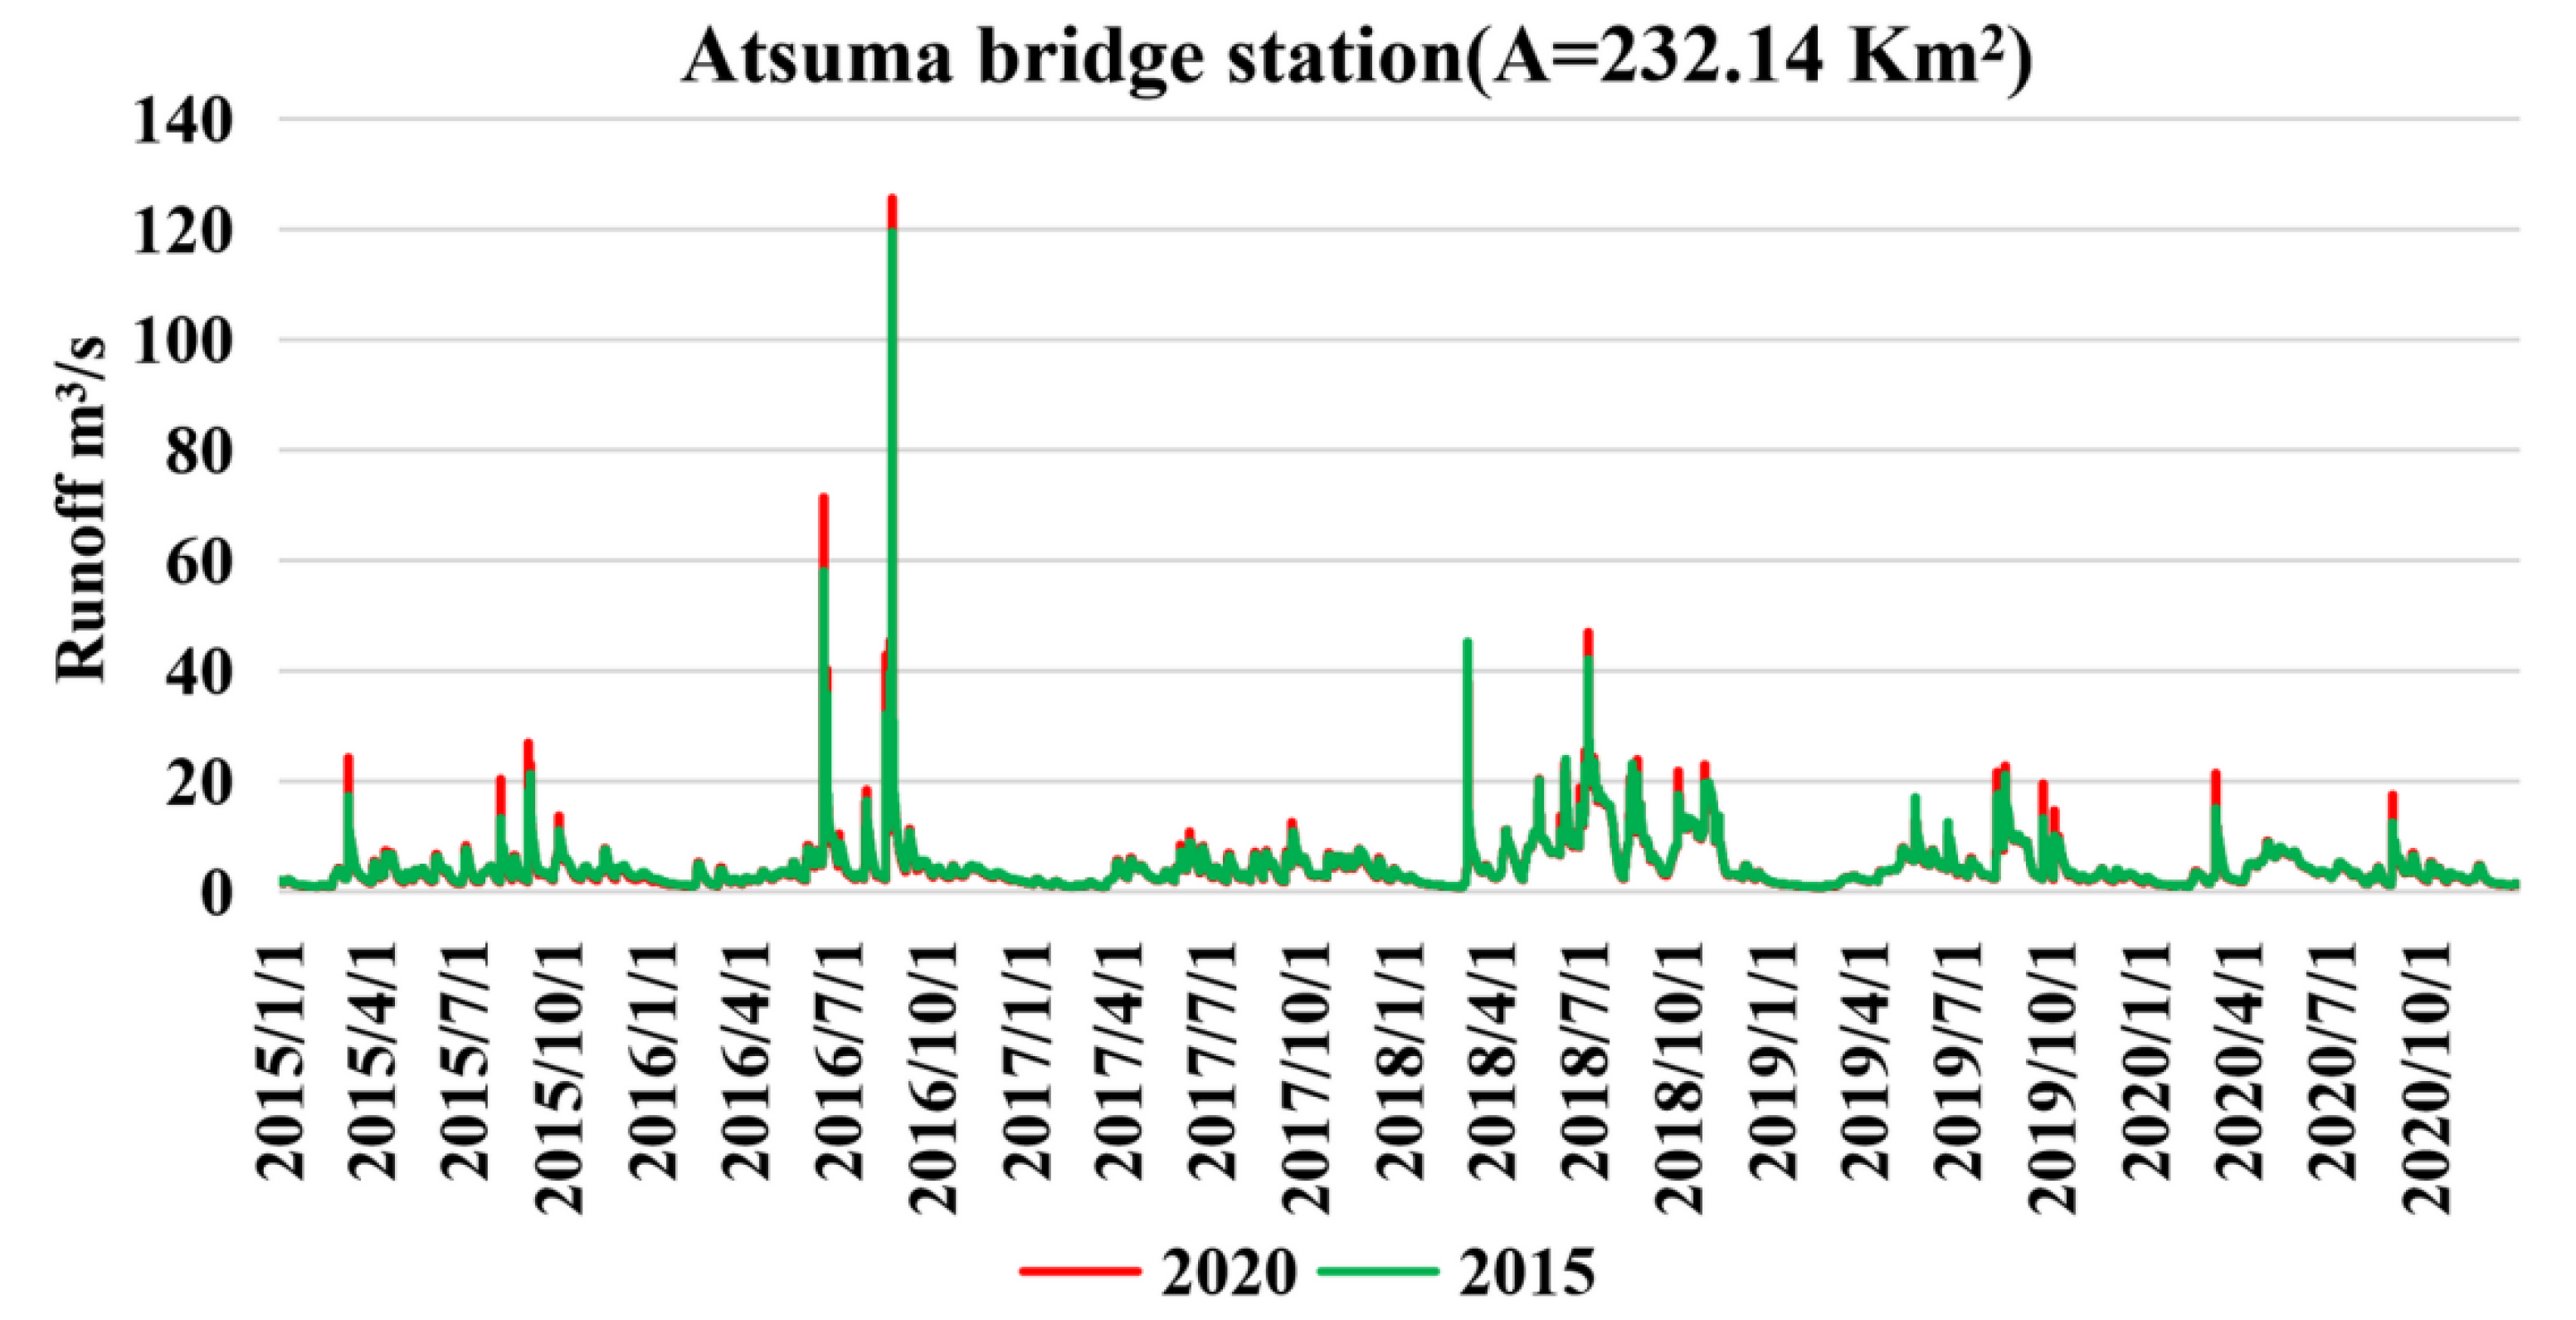
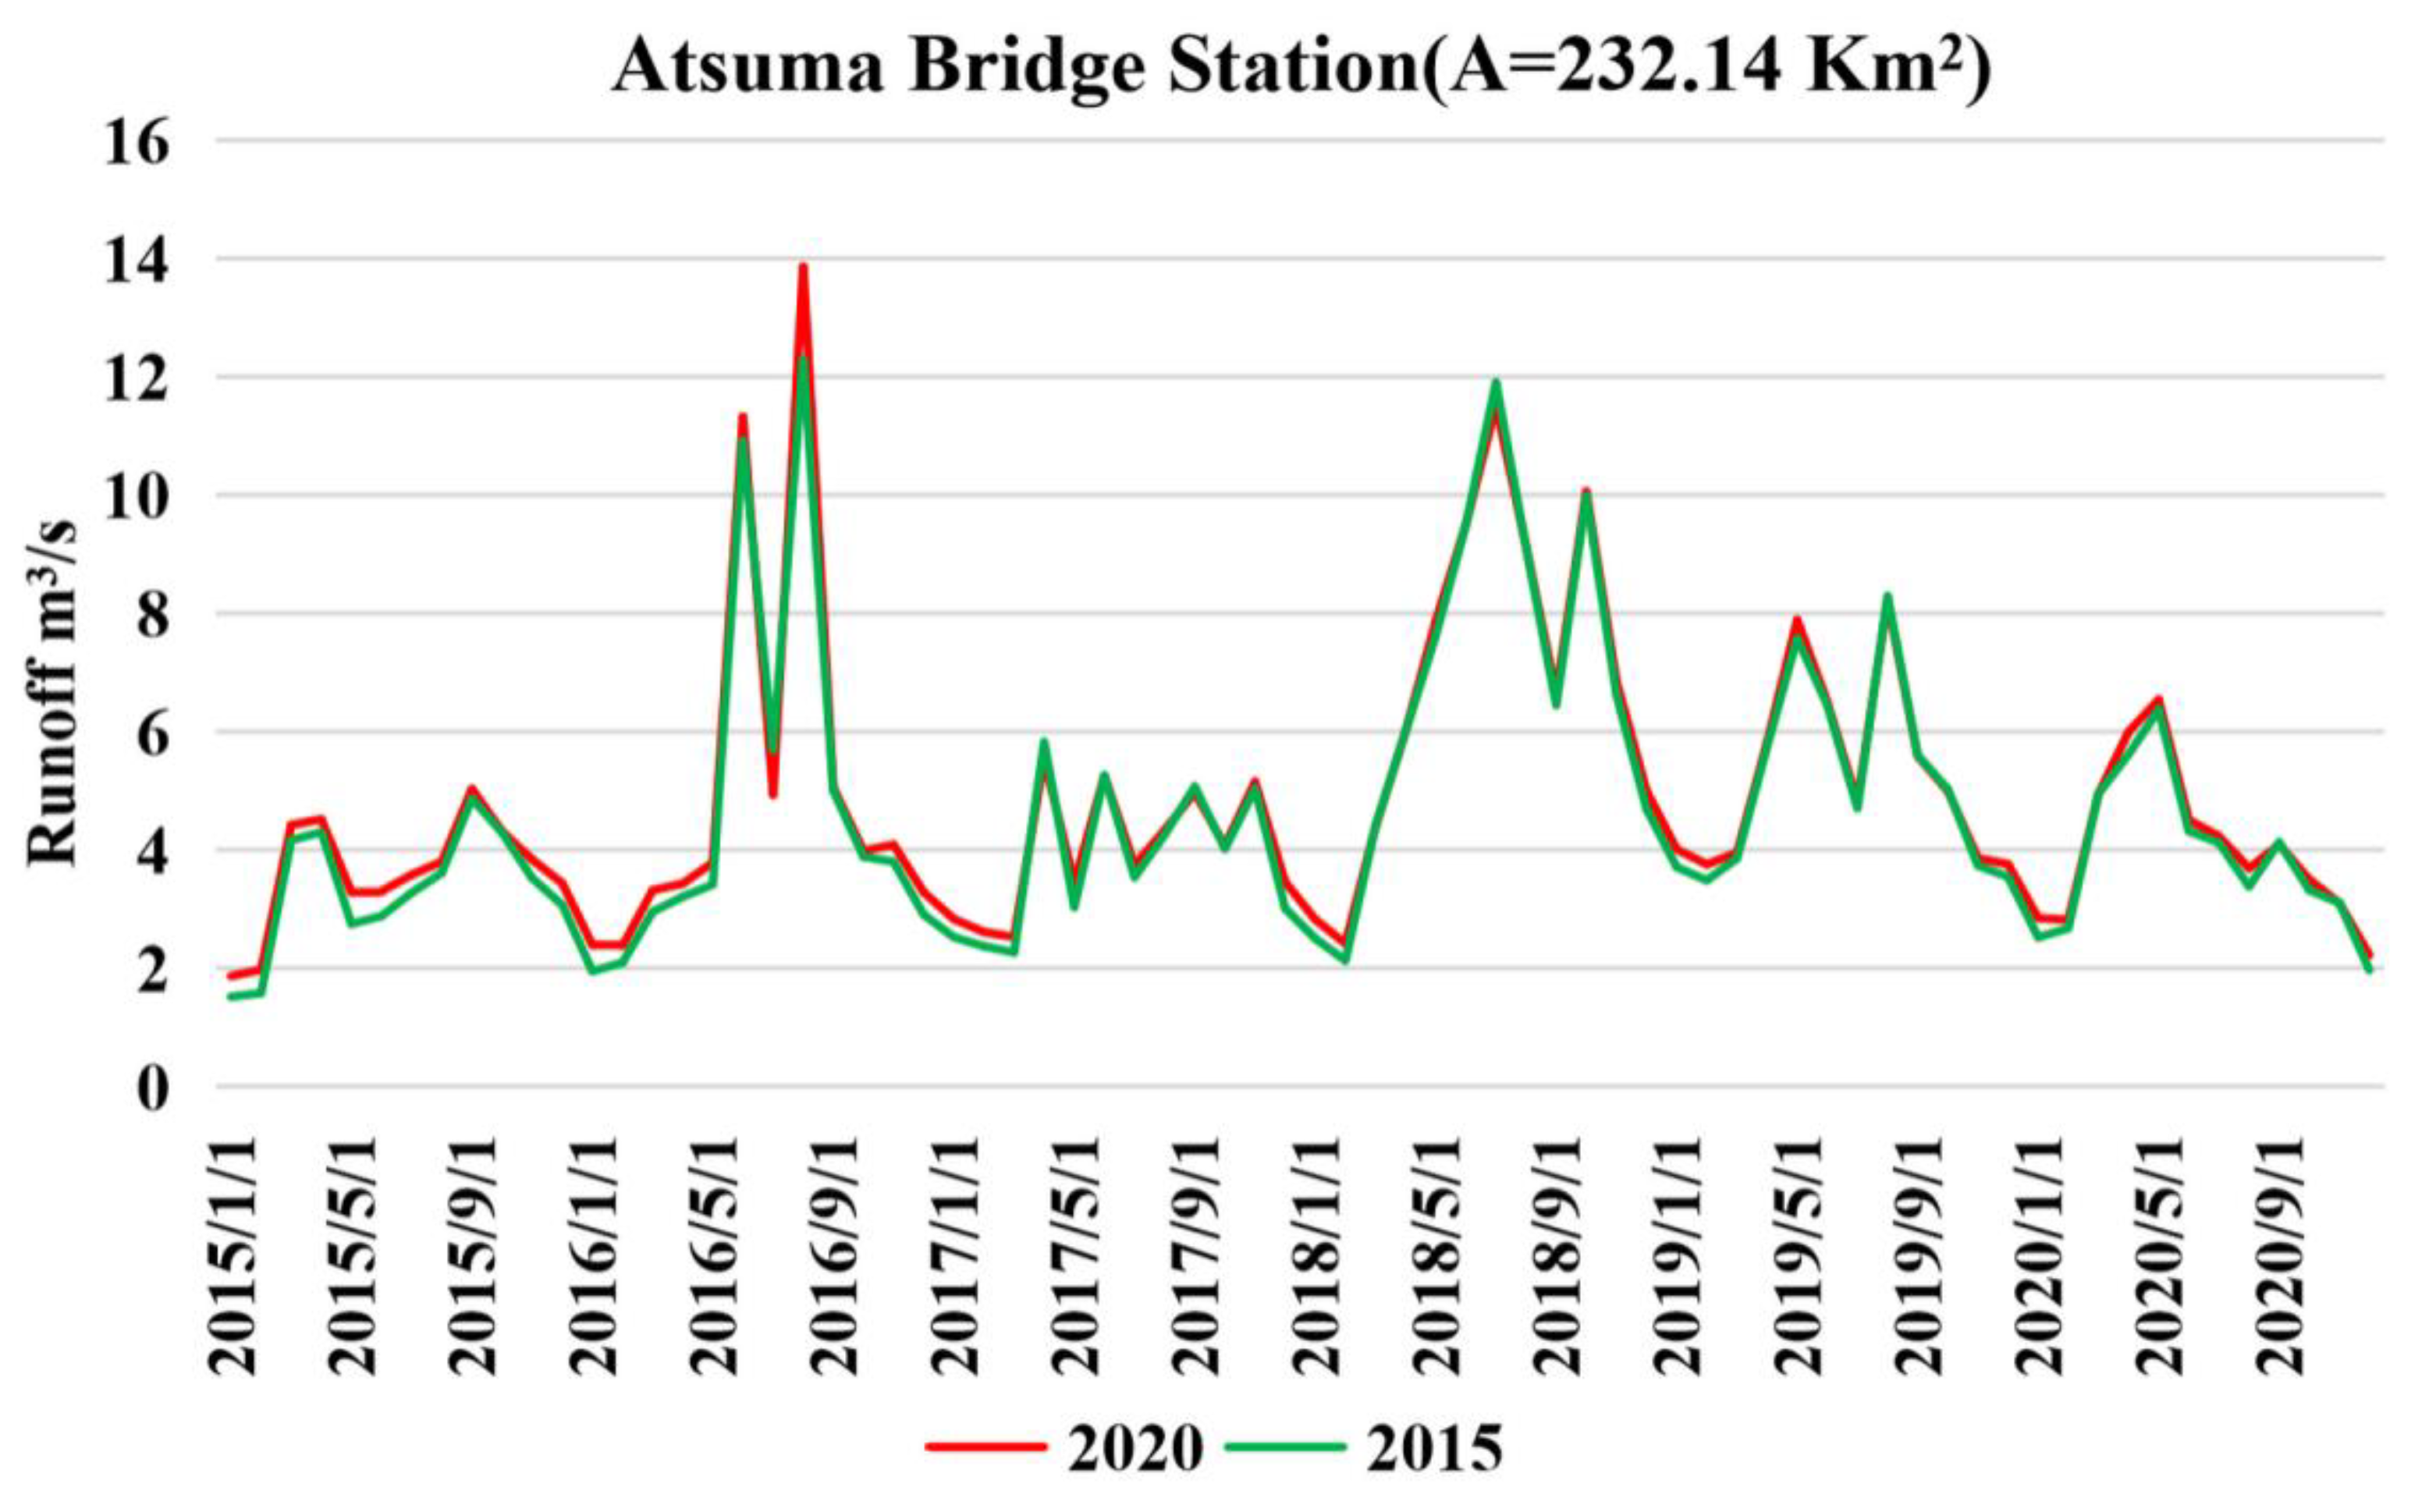
3.2. Runoff
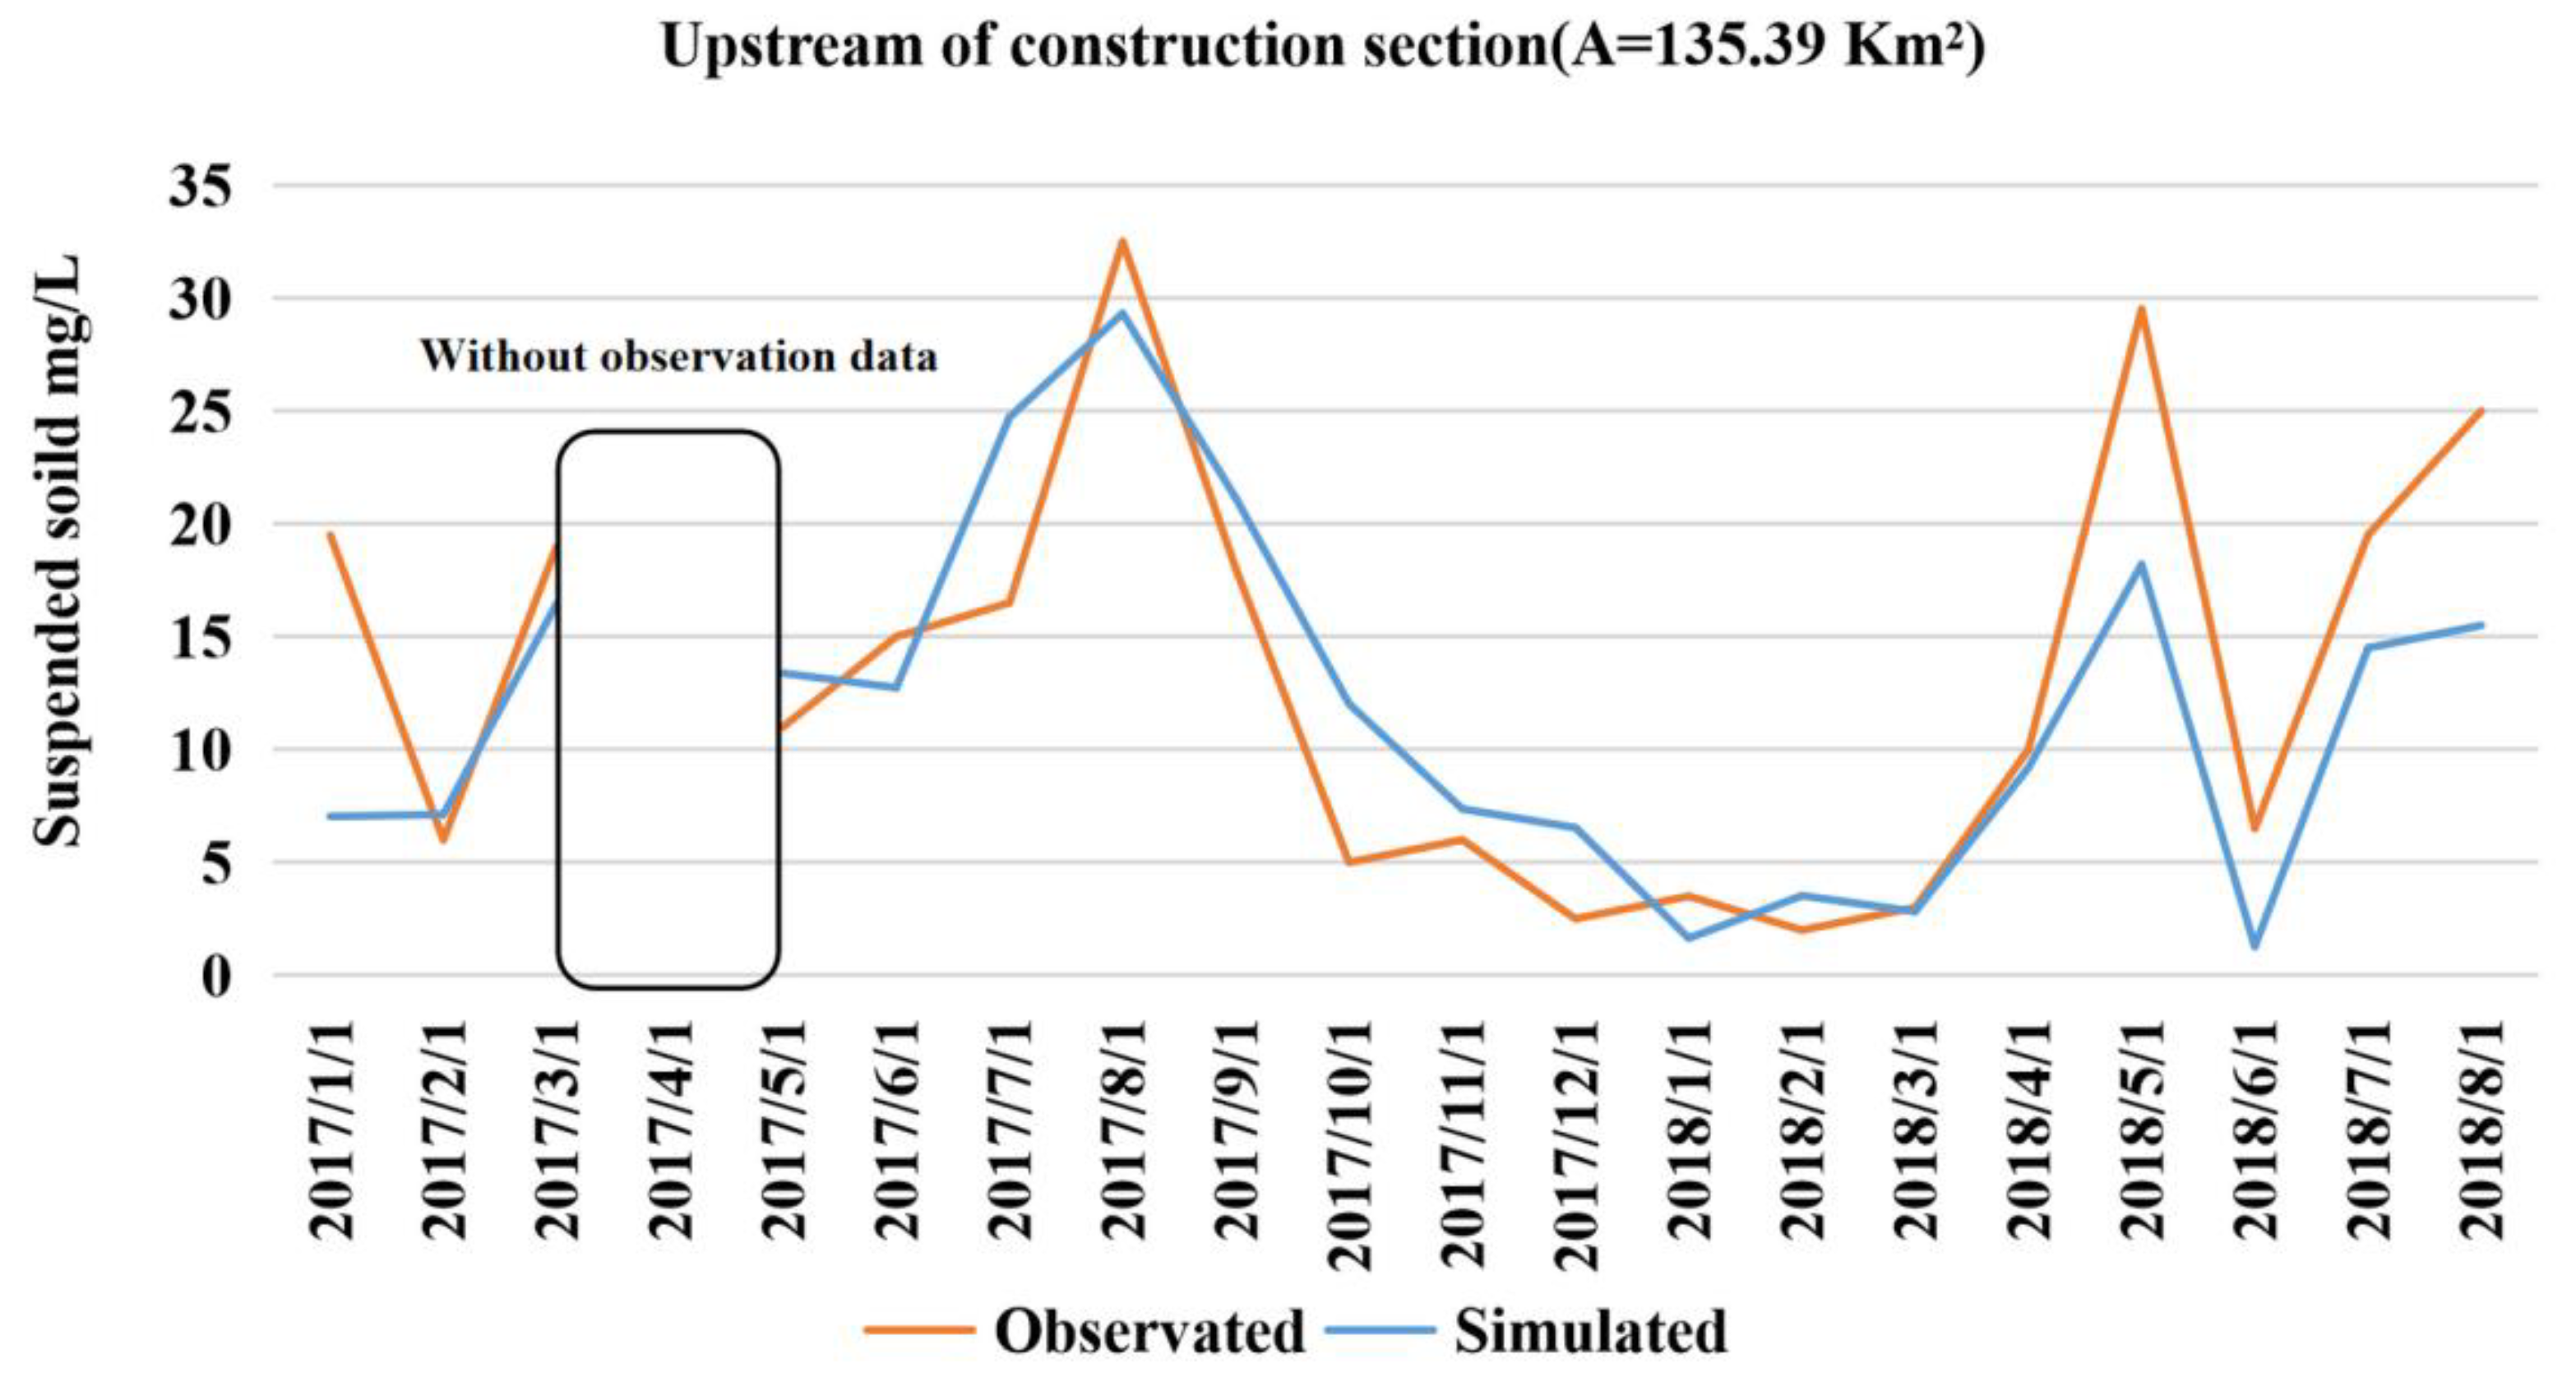
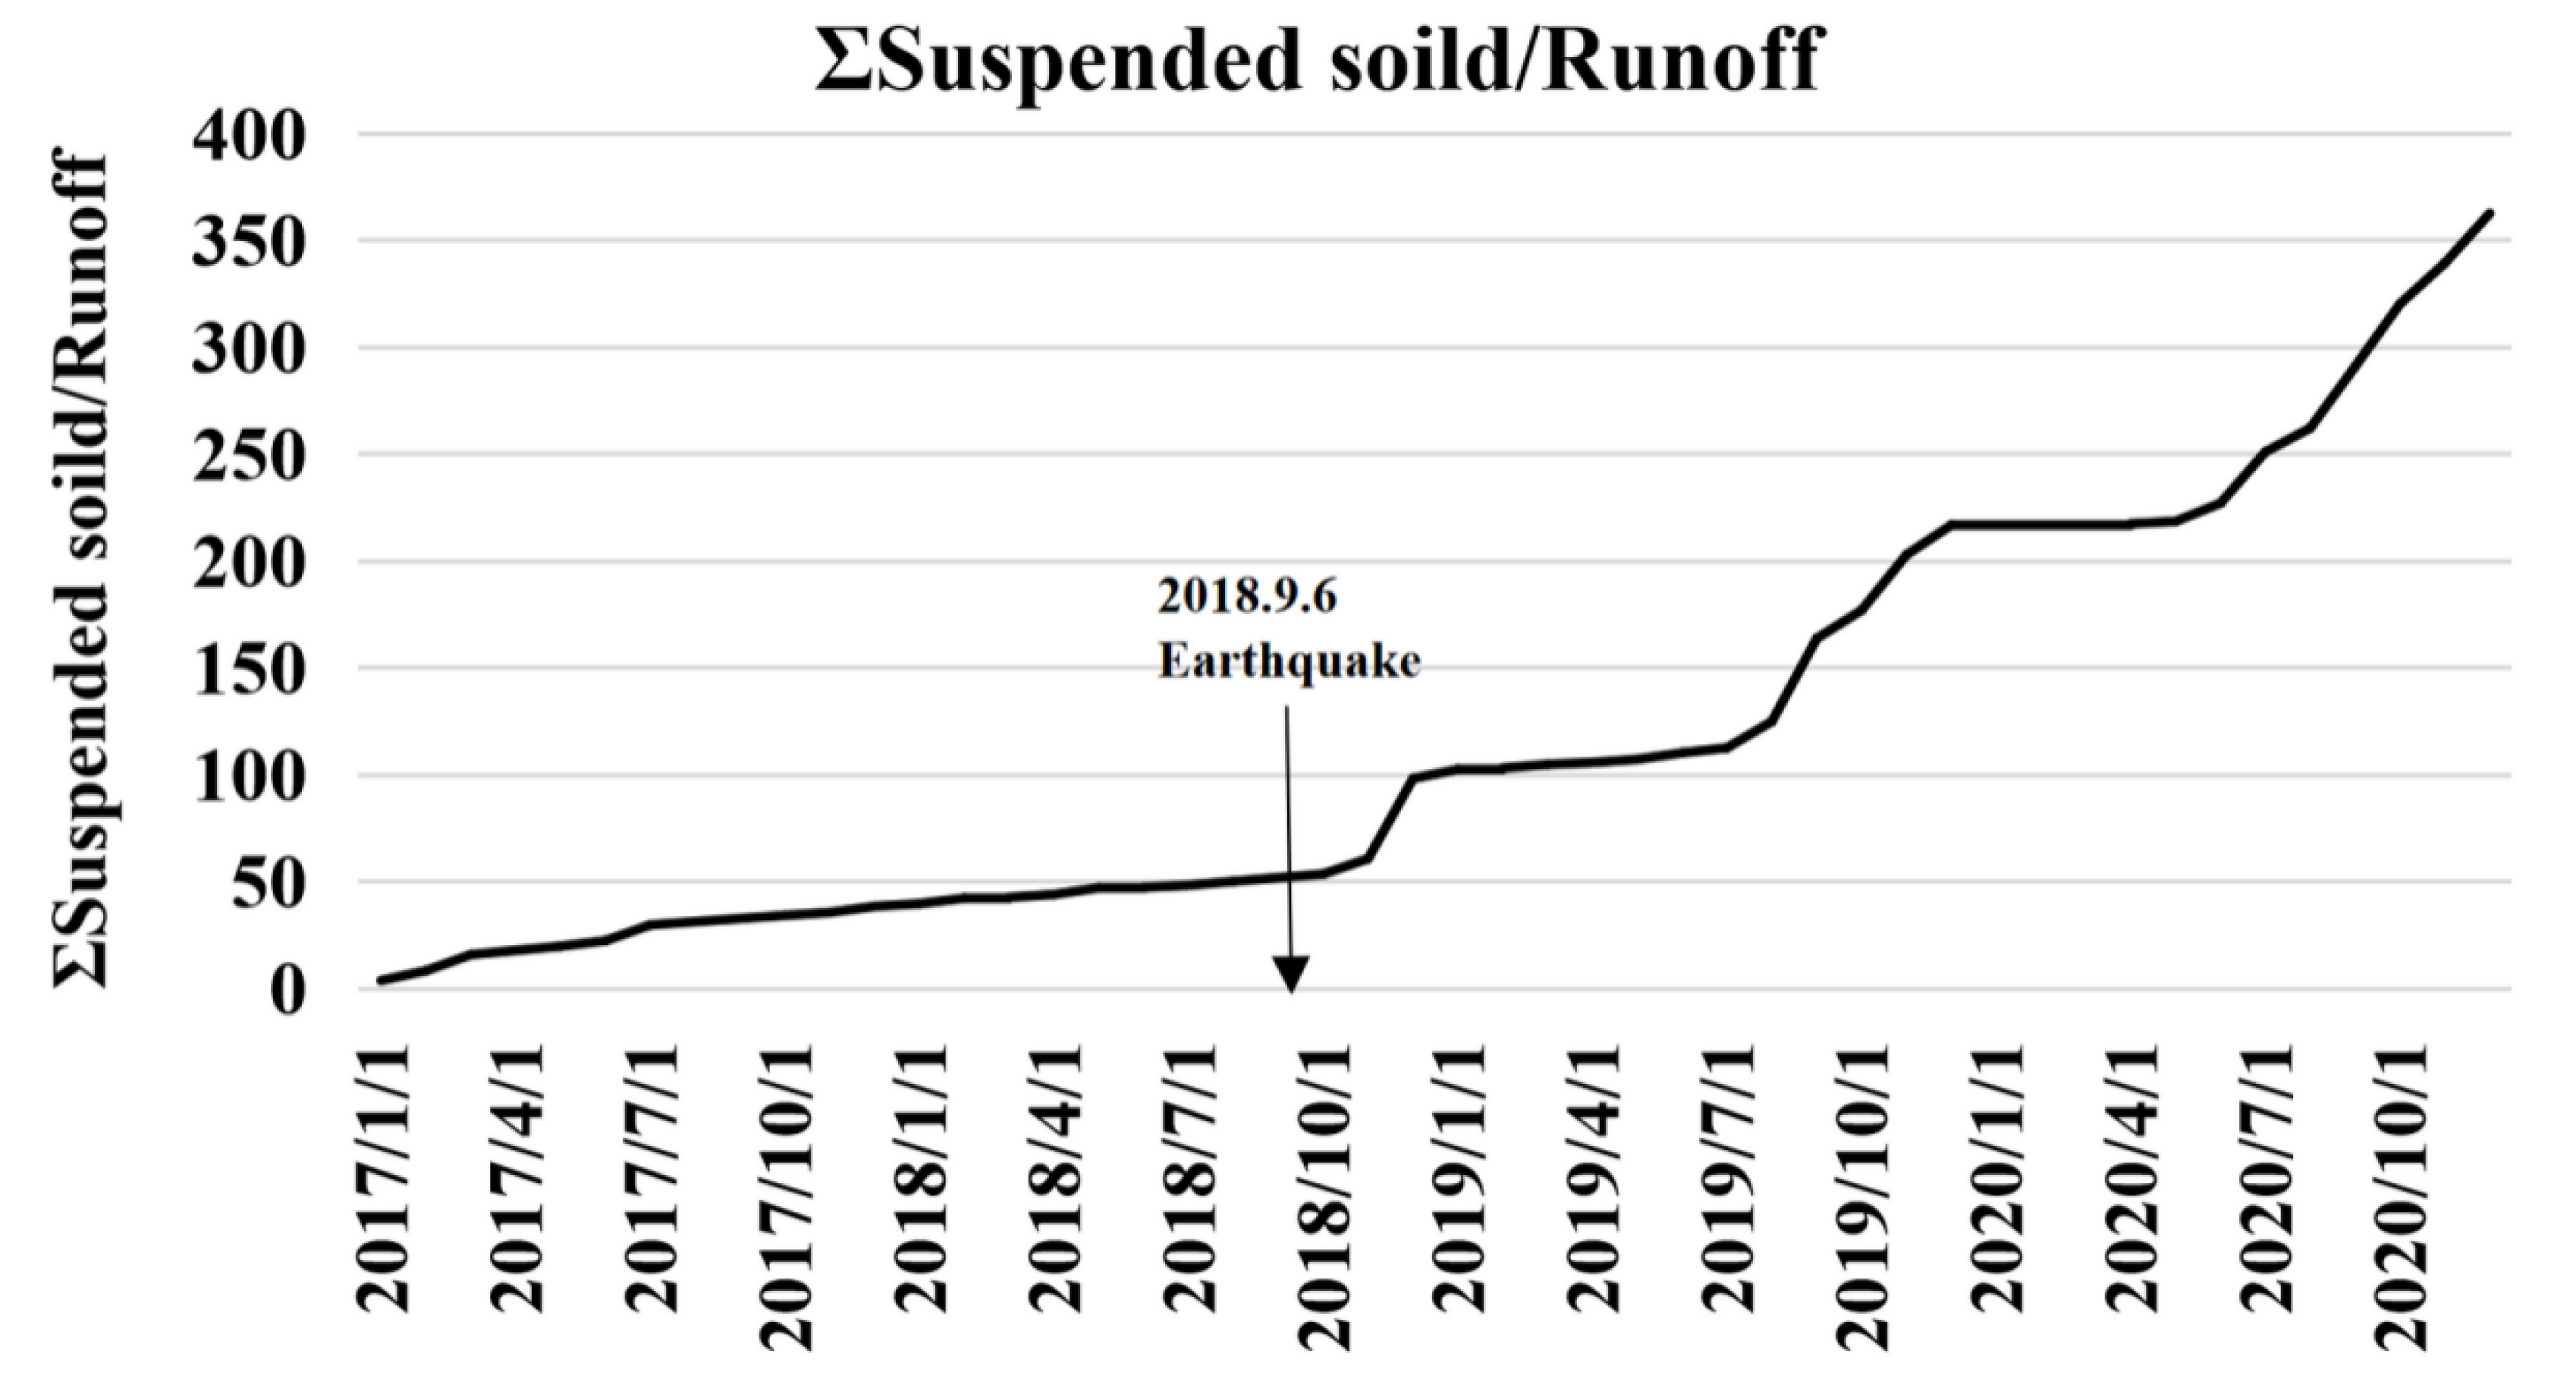
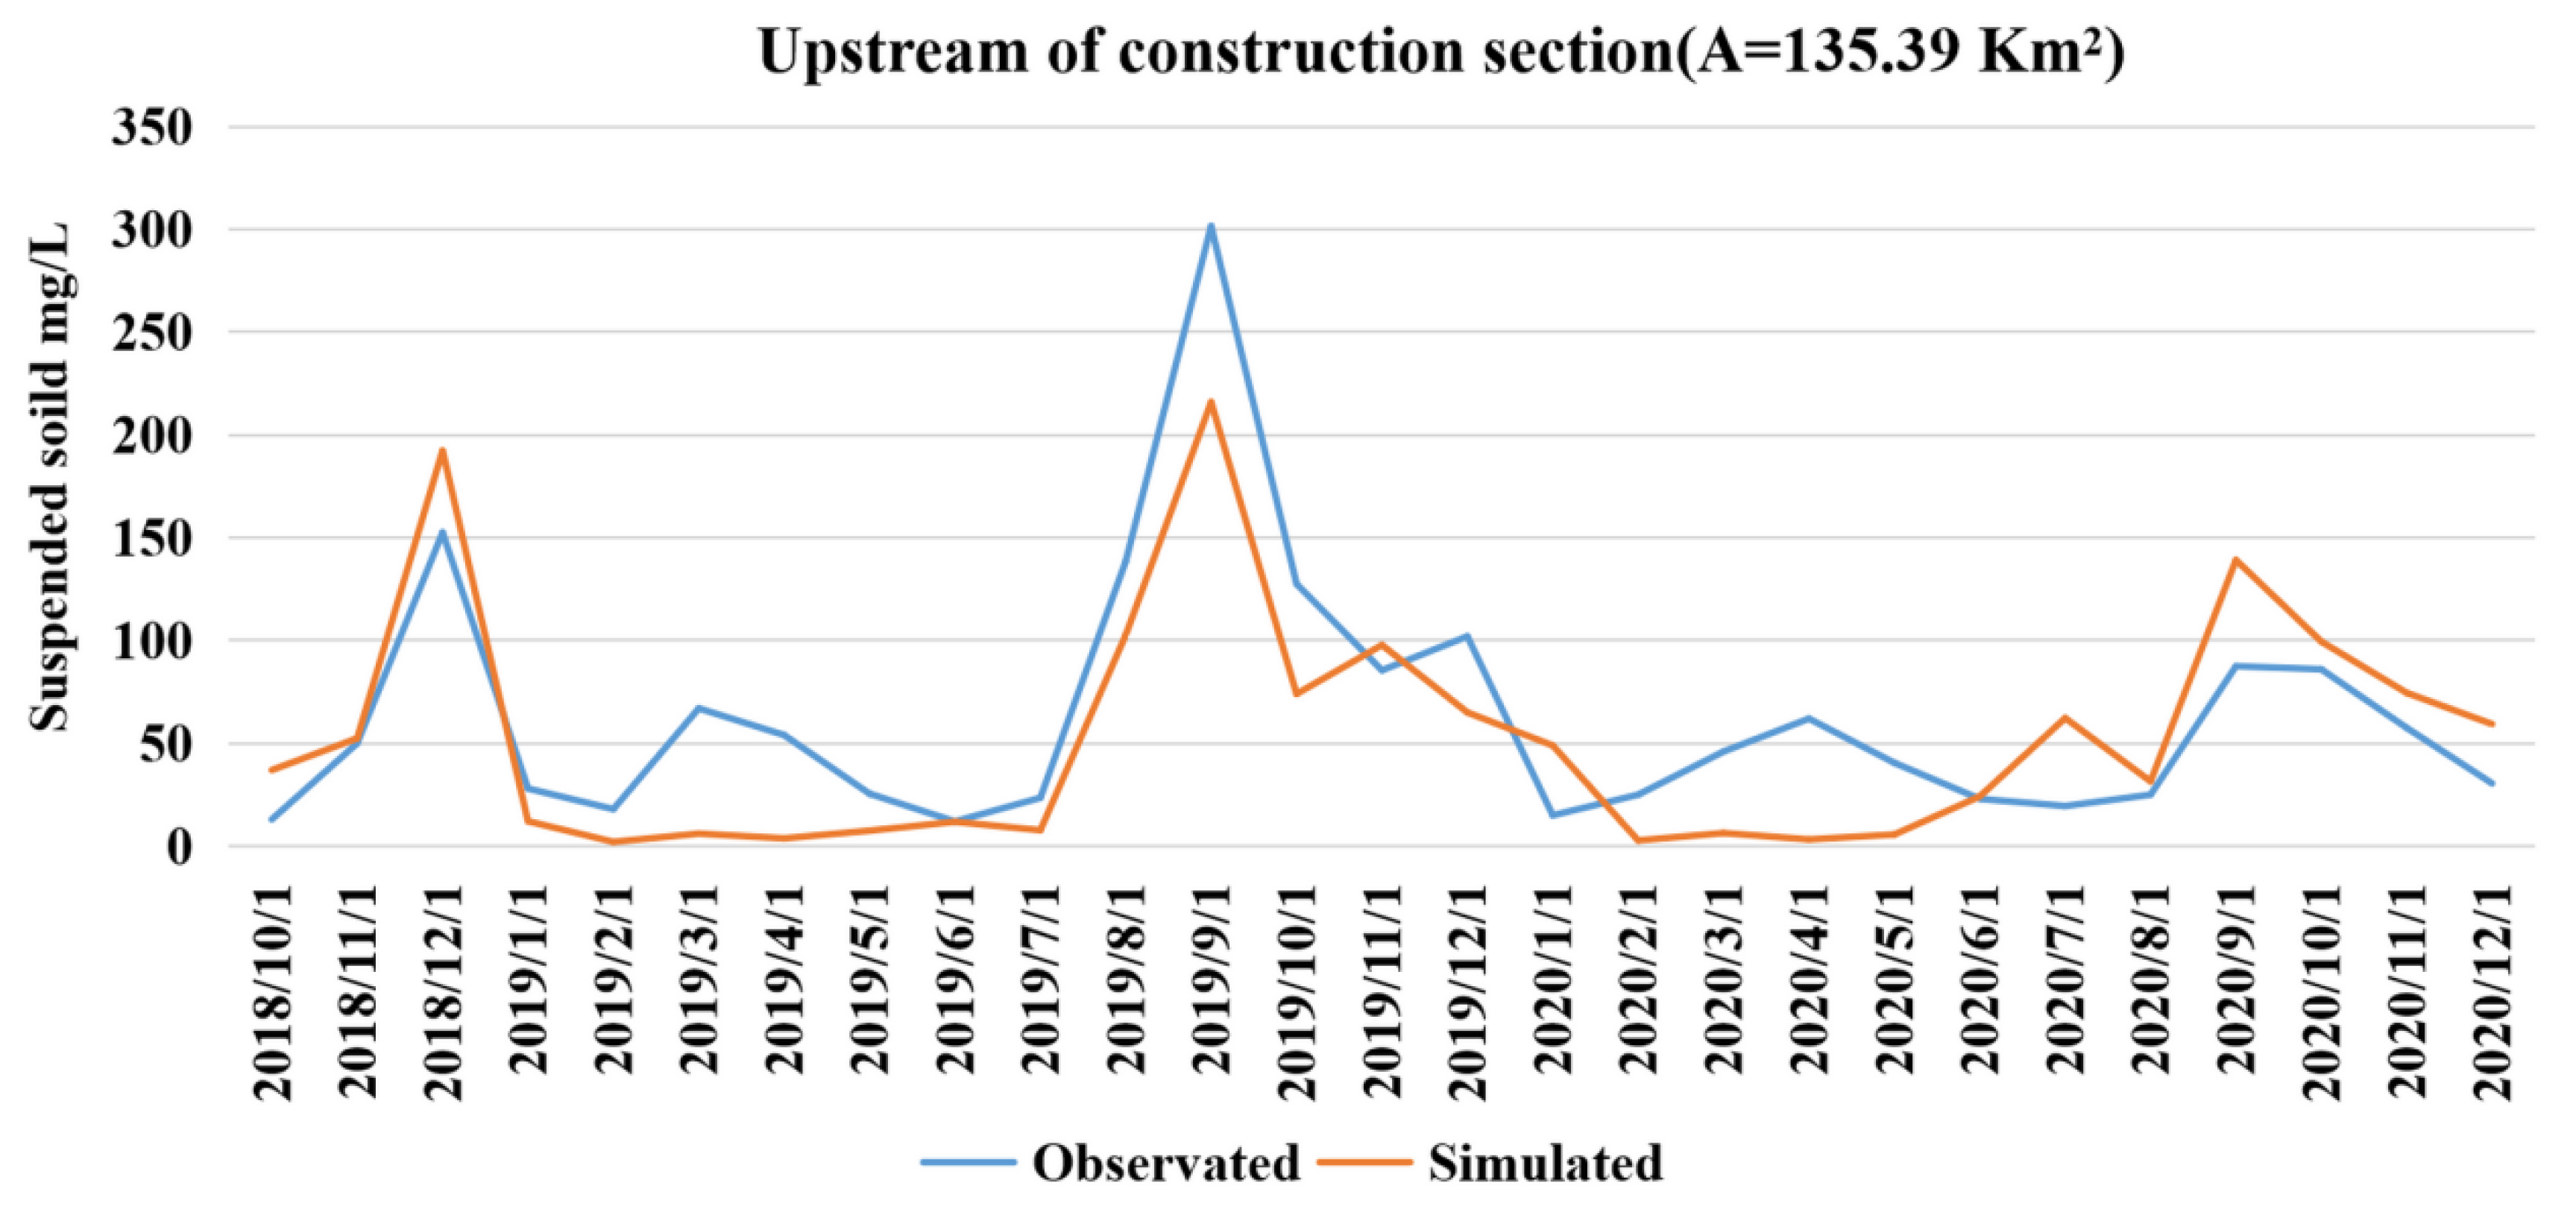
3.3. Sediment Transport
4. Conclusions
Supplementary Materials
Author Contributions
Funding
Data Availability Statement
Acknowledgments
Conflicts of Interest
Abbreviations
| Acronym | Description |
| SWAT | Soil and Water Assessment Tool |
| LULC | Land Use and Land Cover |
| DEM | Digital Elevation Model |
| USDA | United States Department of Agriculture |
| HRU | Hydrological Response Unit |
| SWAT-CUP | Soil and Water Assessment Tool Calibration and Uncertainty Programs |
| SUFI-2 | Sequential Uncertainty Fitting Procedure Version 2 |
| R2 | Coefficient of Determination |
| NSE | Nash–Sutcliffe Efficiency Coefficient |
| PBIAS | Percent Bias |
| PPMCC | Pearson Product-Moment Correlation Coefficient |
References
- Liu, G.; Li, W.; Li, Y.; Xie, Z.; Wang, D.; Fan, Q. Elevation-based and crustal thickness-based spatial statistical analysis of global strong earthquakes (Mw ≥ 6.0). Phys. A Stat. Mech. Appl. 2021, 566, 125669. [Google Scholar] [CrossRef]
- China Earthquake Administration. Available online: https://www.cea.gov.cn/cea/xwzx/zyzt/index.html (accessed on 11 August 2021).
- Smith, K. Environmental Hazards: Assessing Risk and Reducing Disaster, 6th ed.; Routledge: London, UK, 2013; pp. 3–12. [Google Scholar] [CrossRef]
- Zhang, G.T.; Cui, P.; Jin, W.; Zhang, Z.T.; Wang, H.; Bazai, N.A.; Li, Y.; Liu, D.Z.; Alessandro, P. Changes in hydrological behaviours triggered by earthquake disturbance in a mountainous watershed. Sci. Total Environ. 2021, 760, 143349. [Google Scholar] [CrossRef]
- Kawser, U.; Hoque, A.; Nath, B. Observing the impacts of 1950s great Assam earthquake in the tectono-geomorphological deformations at the Young Meghna Estuarine Floodplain of Bangladesh: Evidence from Noakhali Coastal Region. Arab. J. Geosci. 2021, 14, 306. [Google Scholar] [CrossRef]
- Feng, Y.; Lei, Z.; Tong, X.; Gao, C.; Chen, S.; Wang, J.; Wang, S. Spatially-explicit modeling and intensity analysis of China’s land use change 2000–2050. J. Environ. Manag. 2020, 263, 110407. [Google Scholar] [CrossRef]
- Amano, H.; Iwasaki, Y. Land Cover Classification by Integrating NDVI Time Series and GIS Data to Evaluate Water Circulation in Aso Caldera, Japan. Int. J. Environ. Res. Public Health 2020, 17, 6605. [Google Scholar] [CrossRef] [PubMed]
- Meshesha, D.T.; Tsunekawa, A.; Tsubo, M.; Ali, S.A.; Haregeweyn, N. Land-use change and its socio-environmental impact in Eastern Ethiopia’s highland. Reg. Environ. Chang. 2014, 14, 757–768. [Google Scholar] [CrossRef]
- Ruiz, I.; Sanz-Sánchez, M.J. Effects of historical land-use change in the Mediterranean environment. Sci. Total Environ. 2020, 732, 139315. [Google Scholar] [CrossRef]
- Matlhodi, B.; Kenabatho, P.K.; Parida, B.P.; Maphanyane, J.G. Analysis of the Future Land Use Land Cover Changes in the Gaborone Dam Catchment Using CA-Markov Model: Implications on Water Resources. Remote Sens. 2021, 13, 2427. [Google Scholar] [CrossRef]
- Ahmadisharaf, E.; Lacher, I.L.; Fergus, C.; Benham, B.L.; Akre, T.; Kline, K.S. Projecting land use change impacts on nutrients, sediment and runoff in multiple spatial scales: Business-as-usual vs. stakeholder-informed scenarios. J. Clean. Prod. 2020, 257, 120466. [Google Scholar] [CrossRef]
- Susukida, Y.; Katsumata, K.; Ichiyanagi, M.; Ohzono, M.; Aoyama, H.; Tanaka, R.; Takada, M.; Yamaguchi, T.; Okada, K.; Takahashi, H.; et al. Focal mechanisms and the stress field in the aftershock area of the 2018 Hokkaido Eastern Iburi Earthquake (M JMA = 6.7). Earth Planets Space 2021, 73, 1. [Google Scholar] [CrossRef]
- Zhou, H.; Che, A.; Wang, L.; Wang, L. Investigation and mechanism analysis of disasters under Hokkaido Eastern Iburi earthquake. Geomatics. Nat. Hazards Risk 2021, 12, 1–28. [Google Scholar] [CrossRef]
- Shibata, T.; Takahashi, R.; Takahashi, H.; Kagoshima, T.; Takahata, N.; Sano, Y.; Pinti, D.L. Coseismic changes in groundwater level during the 2018 Hokkaido Eastern Iburi Earthquake. Earth Planets Space 2020, 72, 23. [Google Scholar] [CrossRef]
- Kubo, H.; Iwaki, A.; Suzuki, W.; Aoi, S.; Sekiguchi, H. Estimation of the source process and forward simulation of long-period ground motion of the 2018 Hokkaido Eastern Iburi, Japan, earthquake. Earth Planets Space 2020, 72, 20. [Google Scholar] [CrossRef] [Green Version]
- Li, R.; Wang, F.; Zhang, S. Controlling role of Ta-d pumice on the coseismic landslides triggered by 2018 Hokkaido Eastern Iburi Earthquake. Landslides 2020, 17, 1233–1250. [Google Scholar] [CrossRef]
- Ohtani, M.; Imanishi, K. Seismic potential around the 2018 Hokkaido Eastern Iburi Earthquake assessed considering the viscoelastic relaxation. Earth Planets Space 2019, 71, 57. [Google Scholar] [CrossRef] [Green Version]
- Gou, T.; Huang, Z.; Zhao, D.; Wang, L. Structural heterogeneity and anisotropy in the source zone of the 2018 Eastern Iburi earthquake in Hokkaido, Japan. J. Geophys. Res. 2019, 124, 7052–7066. [Google Scholar] [CrossRef]
- Fujiwara, S.; Nakano, T.; Morishita, Y.; Kobayashi, T.; Yarai, H.; Une, H.; Hayashi, K. Detection and interpretation of local surface deformation from the 2018 Hokkaido Eastern Iburi Earthquake using ALOS-2 SAR data. Earth Planets Space 2019, 71, 64. [Google Scholar] [CrossRef]
- Nakamura, R.; Shiina, T. Three-dimensional S-wave attenuation structure in and around source area of the 2018 Hokkaido Eastern Iburi Earthquake, Japan. Earth Planets Space 2019, 71, 114. [Google Scholar] [CrossRef]
- Fukuda, K.; Shibata, Y.; Sato, H.; Okabe, S. How the large-scale blackout following the 2018 Hokkaido Eastern Iburi earth-quake impacted adolescents’ sleep patterns. Sleep Biol. Rhythm. 2020, 18, 351–354. [Google Scholar] [CrossRef]
- Chen, Y.C.; Nakatsugawa, M.; Ohashi, H. Research of Impacts of the 2018 Hokkaido Eastern Iburi Earthquake on Sediment Transport in the Atsuma River Basin Using the SWAT Model. Water 2021, 13, 356. [Google Scholar] [CrossRef]
- Tiwari, S.; Kar, S.C.; Bhatla, R.; Bansal, R. Temperature index based snowmelt runoff modelling for the S atluj R iver basin in the western H imalayas. Meteorol. Appl. 2018, 25, 302–313. [Google Scholar] [CrossRef]
- Yaduvanshi, A.; Sharma, R.K.; Kar, S.C.; Sinha, A.K. Rainfall–runoff simulations of extreme monsoon rainfall events in a tropical river basin of India. Nat. Hazards 2018, 90, 843–861. [Google Scholar] [CrossRef]
- Martínez-Salvador, A.; Conesa-García, C. Suitability of the SWAT model for simulating water discharge and sediment load in a karst watershed of the semiarid Mediterranean basin. Water Resour. Manag. 2020, 34, 785–802. [Google Scholar] [CrossRef]
- Yang, X.; He, R.; Ye, J.; Tan, M.L.; Ji, X.; Tan, L.; Wang, G. Integrating an hourly weather generator with an hourly rainfall SWAT model for climate change impact assessment in the Ru River basin, China. Atmos. Res. 2020, 244, 105062. [Google Scholar] [CrossRef]
- Sowah, R.A.; Bradshaw, K.; Snyder, B.; Spidle, D.; Molina, M. Evaluation of the soil and water assessment tool (SWAT) for simulating E. coli concentrations at the watershed-scale. Sci. Total Environ. 2020, 746, 140669. [Google Scholar] [CrossRef]
- Ahn, S.; Sheng, Z. Assessment of water availability and scarcity based on hydrologic components in an irrigated agricultural watershed using SWAT. J. Am. Water Resour. Assoc. 2021, 57, 186–203. [Google Scholar] [CrossRef]
- Babur, M.; Shrestha, S.; Bhatta, B.; Datta, A.; Ullah, H. Integrated assessment of extreme climate and landuse change impact on sediment yield in a mountainous transboundary watershed of India and Pakistan. J. Mt. Sci. 2020, 17, 624–640. [Google Scholar] [CrossRef]
- Perazzoli, M.; Pinheiro, A.; Kaufmann, V. Effects of scenarios of landuse on water regime and sediment transport in the Concórdia River basin, SC. Rev. Árvore 2013, 37, 859–869. [Google Scholar] [CrossRef] [Green Version]
- Sadeghi, S.; Saghafian, B.; Najarchi, M. Assessment of impacts of change in land use and climatic variables on runoff in Tajan River basin. Water Supply 2020, 20, 2779–2793. [Google Scholar] [CrossRef]
- Anand, J.; Gosain, A.K.; Khosa, R. Prediction of land use changes based on Land Chasnge Modeler and attribution of changes in the water balance of Ganga basin to land use change using the SWAT model. Sci. Total Environ. 2018, 644, 503–519. [Google Scholar] [CrossRef]
- Ghaderpour, E.; Vujadinovic, T.; Hassan, Q.K. Application of the least-squares wavelet software in hydrology: Athabasca River basin. J. Hydrol.-Reg. Stud. 2021, 36, 100847. [Google Scholar] [CrossRef]
- Zerouali, B.; Chettih, M.; Alwetaishi, M.; Abda, Z.; Elbeltagi, A.; Augusto Guimarães Santos, C.; Hussein, E.E. Evaluation of Karst Spring Discharge Response Using Time-Scale-Based Methods for a Mediterranean Basin of Northern Algeria. Water 2021, 13, 2946. [Google Scholar] [CrossRef]


| Data Type | Description | Resolution | Source | Download Path | Data number | Acquisition date | Formats |
|---|---|---|---|---|---|---|---|
| Topography map | Digital elevation model (DEM) | 0.4” ×0.4” (about 10 m square) | Geographical information Authority of Japan | https://fgd.gsi.go.jp/download/mapGis.php?tab=dem (accessed on 20 November 2021) | DEM10B 6342 | 3 November 2019 | TIF |
| Land use and land cover map | Land use and land cover classifications | 30 m (OLI) 100 m (TIRS) | United States Geological Survey | https://earthexplorer.usgs.gov/ (accessed on 20 November 2021) | LC08_L2SP_107030_20150923_20200908_02, LC08_L2SP_107030_20200531_20200820_02 | 15 March 2021 | |
| Soils map | Soil types | 1/200,000 | Ministry of Land, Infrastructure, Transport and Tourism of Japan | https://nlftp.mlit.go.jp/kokjo/inspect/landclassification/land/l_national_map_20-1.html (accessed on 20 November 2021) | Hokkaido_1 200,000 Land Classification Basic Survey | 3 November 2019 | GRID |
| Meteorological data | Radar precipitation data | Daily (450 stations) | Japan Meteorological Business Support Center | http://www.jmbsc.or.jp/jp/ (accessed on 20 November 2021) | 1 January 2009–31 December 2020 | 9 May 2021 | CSV |
| Minimum and maximum temperature | Daily (Atsuma station) | Japan Meteorological Agency | https://www.data.jma.go.jp/gmd/risk/obsdl/index.php(accessed on 20 November 2021) | ||||
| Wind speed | |||||||
| Relative humidity | Daily (Tomakomai station) | ||||||
| Solar radiation | Daily (Sapporo station) | TXT |
| LULC | 2015 | 2020 | |
|---|---|---|---|
| 1 | Farmland | 64.06 | 67.36 |
| 2 | Forest | 232.25 | 186.35 |
| 3 | Grass | 55.5 | 78.26 |
| 4 | Water | 0.88 | 18.71 |
| 5 | Bare land | 4.48 | 25.46 |
| 6 | Building land | 9.69 | 7.7 |
| No | Name | Description | Daily | Monthly | ||||||
|---|---|---|---|---|---|---|---|---|---|---|
| 2015 | 2020 | 2015 | 2020 | 2015 | 2020 | 2015 | 2020 | |||
| Default Values | Corrected Values | Default Values | Corrected Values | |||||||
| 1 | TIMP.bsn | Snowpack temperature lag factor | 1 | 1 | 1 | 1 | 1 | 0.161241 | ||
| 2 | CN2.mgt | Initial SCS runoff curve number for moisture condition II | 79 | 87 | 63.189432 | 69.588362 | 79 | 87 | 46.119094 | 50.789382 |
| 3 | SMFMN.bsn | Melt factor for snow on December 21 (mm H2O/°C-day) | 4.5 | 4.5 | 1.359352 | 4.5 | 4.5 | 4.916194 | ||
| 4 | SMFMX.bsn | Melt factor for snow on June 21 (mm H2O/°C-day) | 4.5 | 4.5 | 2.048258 | 4.5 | 4.5 | 1.638298 | ||
| 5 | TLAPS.sub | Temperature lapse rate (°C/km) | 0 | 0 | −2.392 | 0 | 0 | −1.221248 | ||
| 6 | SOL_AWC.sol | Available water capacity of the soil layer (mm H2O/mm soil) | 0.1 | 0.1 | 0.025737 | 0.1 | 0.1 | 0.09 | ||
| 7 | SMTMP.bsn | Snowmelt base temperature (°C) | 0.5 | 0.5 | 0.108525 | 0.5 | 0.5 | 3.543045 | ||
| 8 | CH_K2.rte | Effective hydraulic conductivity in tributary channel alluvium (mm/hrh) | 0 | 0 | 52.697681 | 0 | 0 | 16.700487 | ||
| 9 | CH_K1.sub | Effective hydraulic conductivity in tributary channel alluvium (mm/h) | 0 | 0 | 12.198375 | 0 | 0 | 0.503748 | ||
| 10 | SNOCOVMX.bsn | Minimum snow water content that corresponds to 100% snow cover, SNO100 (mm H2O) | 1 | 1 | 0.639671 | 1 | 1 | 0.375468 | ||
| 11 | CH_N2.rte | Manning’s “n” value for the main channel | 0.014 | 0.014 | 0.304582 | 0.014 | 0.014 | 0.032119 | ||
| 12 | CH_N1.sub | Manning’s “n” value for the main channel | 0.014 | 0.014 | 0.230863 | 0.014 | 0.014 | 0.513274 | ||
| 13 | ESCO.hru | Soil evaporation compensation factor | 0.95 | 0.95 | 0.7684 | 0.95 | 0.95 | 0.61147 | ||
| 14 | PLAPS.sub | Precipitation lapse rate (mm H2O/km) | 0 | 0 | 173.700012 | 0 | 0 | −109.683922 | ||
| 15 | SFTMP.bsn | Snowfall temperature (°C) | 1 | 1 | −0.908274 | 1 | 1 | −1.100187 | ||
| 16 | ALPHA_BF.gw | Baseflow alpha factor (days) | 0.048 | 0.048 | 0.972874 | 0.048 | 0.048 | 0.004363 | ||
| 17 | SURLAG.bsn | Surface runoff lag coefficient | 4 | 4 | 4 | 4 | 4 | 0.932302 | ||
| 18 | GW_DELAY.gw | Groundwater delay time (days) | 31 | 31 | 62.261829 | 31 | 31 | 84.258835 | ||
| 19 | SNO50COV.bsn | Fraction of snow volume represented by SNOCOVMX that corresponds to 50% snow cover. | 0.5 | 0.5 | 0.743382 | 0.5 | 0.5 | 0.771502 | ||
| 20 | GWQMN.gw | Threshold depth of water in the shallow aquifer required for return flow to occur (mm H2O). | 1000 | 1000 | 0.362763 | 1000 | 1000 | 2.610365 | ||
| Atsuma Bridge Station | R2 | NSE | PBIAS | PPMCC | |
|---|---|---|---|---|---|
| Daily | Calibration period (2015–2017) | 0.876 | 0.707 | 10.52% | 0.876 |
| Verification period (2018–2020) | 0.874 | 0.620 | −6.85% | 0.874 | |
| Monthly | Calibration period (2015–2017) | 0.910 | 0.691 | 16.15% | 0.911 |
| Verification period (2018–2020) | 0.861 | 0.729 | −6.028% | 0.610 |
| Year | 2015 | 2016 | 2017 | 2018 | 2019 | 2020 | Average |
|---|---|---|---|---|---|---|---|
| Precipitation | 1274 | 1540 | 1171 | 1451 | 1067 | 985 | 1248 |
| Rainfall | 994 | 1299 | 1068 | 1253 | 999 | 915 | 1088 |
| Snowfall | 280 | 241 | 103 | 198 | 68 | 70 | 160 |
| Runoff | 585 | 835 | 490 | 918 | 615 | 518 | 660 |
| Runoff/Precipitation | 0.46 | 0.54 | 0.42 | 0.63 | 0.58 | 0.53 | 0.53 |
| No | Name | Description | Before Earthquake | After Earthquake | ||
|---|---|---|---|---|---|---|
| Default Values | Corrected Values | Default Values | Corrected Values | |||
| 1 | USLE_P.mgt | USLE equation support practice factor | 1 | 0.090052 | 1 | 0.060287 |
| 2 | SOL_BD().sol | Moist bulk density (Mg/m3 or g/cm3) | 0.3 | 1.37037 | 0.3 | 1.954686 |
| 3 | REVAPMN.gw | Threshold depth of water in the shallow aquifer for “revap” or percolation to the deep aquifer to occur (mm H2O) | 750 | 186.166534 | 750 | 401.453583 |
| 4 | USLE_C{2}.plant.dat | Minimum value of USLE C factor for water erosion applicable to the land cover/plant (Forest) | 0.001 | 0.0008159 | 0.001 | 0.00102348 |
| 5 | SPCON.bsn | Linear parameter for calculating the maximum amount of sediment that can be reentrained during channel sediment routing | 0.0001 | 0.006331 | 0.0001 | 0.002783 |
| 6 | USLE_C{3}.plant.dat | Minimum value of USLE C factor for water erosion applicable to the land cover/plant (Grass) | 0.003 | 0.00083717 | 0.003 | 0.00069073 |
| 7 | CH_ERODMO.rte | CH_ERODMO is set to a value between 0.0 and 1.0. A value of 0.0 indicates a non-erosive channel, while a value of 1.0 indicates no resistance to erosion. | 0 | 3.744806 | 0 | 8.263742 |
| 8 | HRU_SLP.hru | Average slope steepness (m/m) | 0.05155 | 0.0708287 | 0.6687 | 0.58217958 |
| 9 | USLE_K.sol | USLE equation soil erodibility (K) factor (units: 0.013 (metric ton m2 hr)/(m3-metric ton cm)) | 0.0628 | 0.3016999 | 0.0628 | 0.484151 |
| 10 | EPCO.hru | Plant uptake compensation factor | 1 | 0.490527 | 1 | 0.992019 |
| 11 | SOL_K.sol | Saturated hydraulic conductivity (mm/hr) | 10.63 | 6.69041 | 10.63 | 13.267877 |
| 12 | OV_N.hru | Manning’s “n” value for overland flow | 0.1 | 0.0937598 | 0.14 | 0.249963 |
| 13 | GW_REVAP.gw | Groundwater “revap” coefficient | 0.02 | 0.02342478 | 0.02 | 0.01479886 |
| 14 | CH_COV1.rte | Channel cover factor | 0 | 25.236423 | 0 | 11.92763 |
| 15 | CH_L2.rte | Length of main channel (km) | 10.9016 | 10.4795119 | 10.9016 | 13.864849 |
| 16 | CH_S2.rte | Average slope of tributary channels (m/m) | 0.011634 | 0.0117971 | 0.011634 | 0.02539592 |
| 17 | CH_COV2.rte | Channel cover factor | 0 | 22.798399 | 0 | 21.584068 |
| 18 | USLE_C{1}.plant.dat | Minimum value of USLE C factor for water erosion applicable to the land cover/plant (Farmland) | 0.001 | 0.0013788 | 0.001 | 0.00027133 |
| 19 | SPEXP.bsn | Exponent parameter for calculating sediment reentrained in channel sediment routing | 1 | 1.321381 | 1 | 1.156308 |
| 20 | SLSUBBSN.hru | Average slope length (m) | 60.97561 | 60.97561 | 9.14634 | 7.10126411 |
| Upstream of Construction Section | R2 | NSE | PBIAS | PPMCC |
|---|---|---|---|---|
| January 2017–August 2018 | 0.802 | 0.621 | 10.205% | 0.802 |
| October 2018–December 2020 | 0.823 | 0.638 | 15.755% | 0.823 |
Publisher’s Note: MDPI stays neutral with regard to jurisdictional claims in published maps and institutional affiliations. |
© 2021 by the authors. Licensee MDPI, Basel, Switzerland. This article is an open access article distributed under the terms and conditions of the Creative Commons Attribution (CC BY) license (https://creativecommons.org/licenses/by/4.0/).
Share and Cite
Chen, Y.; Nakatsugawa, M. Analysis of Changes in Land Use/Land Cover and Hydrological Processes Caused by Earthquakes in the Atsuma River Basin in Japan. Sustainability 2021, 13, 13041. https://doi.org/10.3390/su132313041
Chen Y, Nakatsugawa M. Analysis of Changes in Land Use/Land Cover and Hydrological Processes Caused by Earthquakes in the Atsuma River Basin in Japan. Sustainability. 2021; 13(23):13041. https://doi.org/10.3390/su132313041
Chicago/Turabian StyleChen, Yuechao, and Makoto Nakatsugawa. 2021. "Analysis of Changes in Land Use/Land Cover and Hydrological Processes Caused by Earthquakes in the Atsuma River Basin in Japan" Sustainability 13, no. 23: 13041. https://doi.org/10.3390/su132313041
APA StyleChen, Y., & Nakatsugawa, M. (2021). Analysis of Changes in Land Use/Land Cover and Hydrological Processes Caused by Earthquakes in the Atsuma River Basin in Japan. Sustainability, 13(23), 13041. https://doi.org/10.3390/su132313041