Article

Techno-Economic Assessment of a Hybrid Gas Tank Hot Water Combined Heat and Power System

School for Engineering of Matter, Transport and Energy, Arizona State University, Tempe, AZ 85287, USA
*
Author to whom correspondence should be addressed.
Sustainability 2021, 13(23), 13040; https://doi.org/10.3390/su132313040
Submission received: 5 November 2021 / Revised: 20 November 2021 / Accepted: 22 November 2021 / Published: 25 November 2021
(This article belongs to the Section Energy Sustainability)

Abstract

:
Combined heat and power (CHP) systems with an integrated solid oxide fuel cell (SOFC) is a promising technology to increase overall efficiency of traditional residential combustion systems. One potential system is gas tank hot water heaters where partial oxidation of the fuel serves as a means of fuel reforming for SOFCs while producing thermal energy for heating water. In this study, a residential hybrid gas tank hot water heater with an integrated SOFC model was developed and a thorough techno-economic analysis was performed. Fuel-rich combustion characterization was performed at equivalence ratios 1.1 to 1.6 to assess synthesis gas production for the SOFC. The effect of fuel utilization and operating voltage of the model SOFC stack were analyzed to provide an in-depth characterization of the potential of the system. CHP and electrical efficiencies over >90% and >16% were achieved, respectively. The techno-economic analysis considers the four major census regions of the United States to evaluate regional savings based on respective utility costs and hot water demand. The results show the hybrid system is economically feasible for replacement of an electrical water heater with the longest payback period being approximately six years.

1. Introduction

The use of combined heat and power (CHP) systems is expected to increase in popularity worldwide with an estimated global capacity increase from 864.2 GWe in 2018 to 1051 GWe by 2025 [1]. In the United States alone, there are over 4650 commercial and industrial installations with a total capacity of 80.8 GWe [2]. Additionally known as co-generation systems, CHP systems produce electricity while supplying thermal energy for heating purposes. The combined electrical and thermal energy generation in a CHP system results in an overall efficiency of 65–85% compared to 45–55% when the two devices are separated [3]. CHP systems benefit from the ability to provide greater energy independence and lower energy costs, making them more economically competitive compared to stand-alone systems. The capacity of these installations varies depending on the industry sector implemented in, from kilowatts up to a gigawatt [2]. Some of the most common CHP installations in the United States are in tandem with wastewater treatment plants, educational buildings (universities and schools), and chemical plants [3,4,5]. In addition to the commercial and industrial sector, installation of CHP systems in residential buildings has become an important technology for energy savings and environmental conservation [6,7,8,9].
Additionally known as micro-combined heat and power (mCHP) systems, residential CHP systems normally have a capacity of no more than 15 kWe [10,11]. Due to their smaller volumetric footprint, mCHP systems have a great market potential to be installed in apartments, houses, and duplexes across the world. The five major prime movers utilized in the majority of CHP systems include: reciprocating engines, gas turbines, steam turbines, fuel cells and microturbines [3]. Unfortunately, heat engine technologies tend to have lower electrical efficiency at smaller scales [5,6]. Fuel cells, in contrast, can achieve high electrical efficiency at smaller scales, are quiet due to no moving parts, and have low to zero emissions [6,8,12]. These features make fuel cells ideal prime movers for mCHP systems. Several manufactures have successfully commercialized residential fuel cell-based mCHP systems with thousands of mCHP installations performed in Japan, South Korea and Europe [8,9,13,14].
Fuel cells are electrochemical prime movers that convert chemical energy into electrical energy directly, bypassing the chemical-mechanical-electrical energy conversion processes needed by other prime movers (i.e., internal combustion engine and gas turbine systems) [15]. The two main fuel cell technologies in mCHP systems include proton exchange membrane fuel cells (PEMFCs) and solid oxide fuel cells (SOFCs). In contrast with other fuel cell technologies, SOFCs are considered fuel flexible with the ability to utilize hydrogen, carbon monoxide, and methane as fuel with the byproducts of water and carbon dioxide. These devices consist of two cermet electrodes and a solid ceramic electrolyte. At high operating temperatures (500–1000 °C), the electrolyte permits oxygen ion diffusion to occur across the electrolyte via oxygen vacancies. Although they can use other fuels, hydrogen is the optimal fuel choice for SOFCs due to its faster electrochemical oxidation rate at the triple phase boundary while also eliminating the risk of carbon deposition from occurring [16]. The reforming of fuel to hydrogen, however, is expensive and usually requires complex fuel reformers to be installed in mCHP systems.
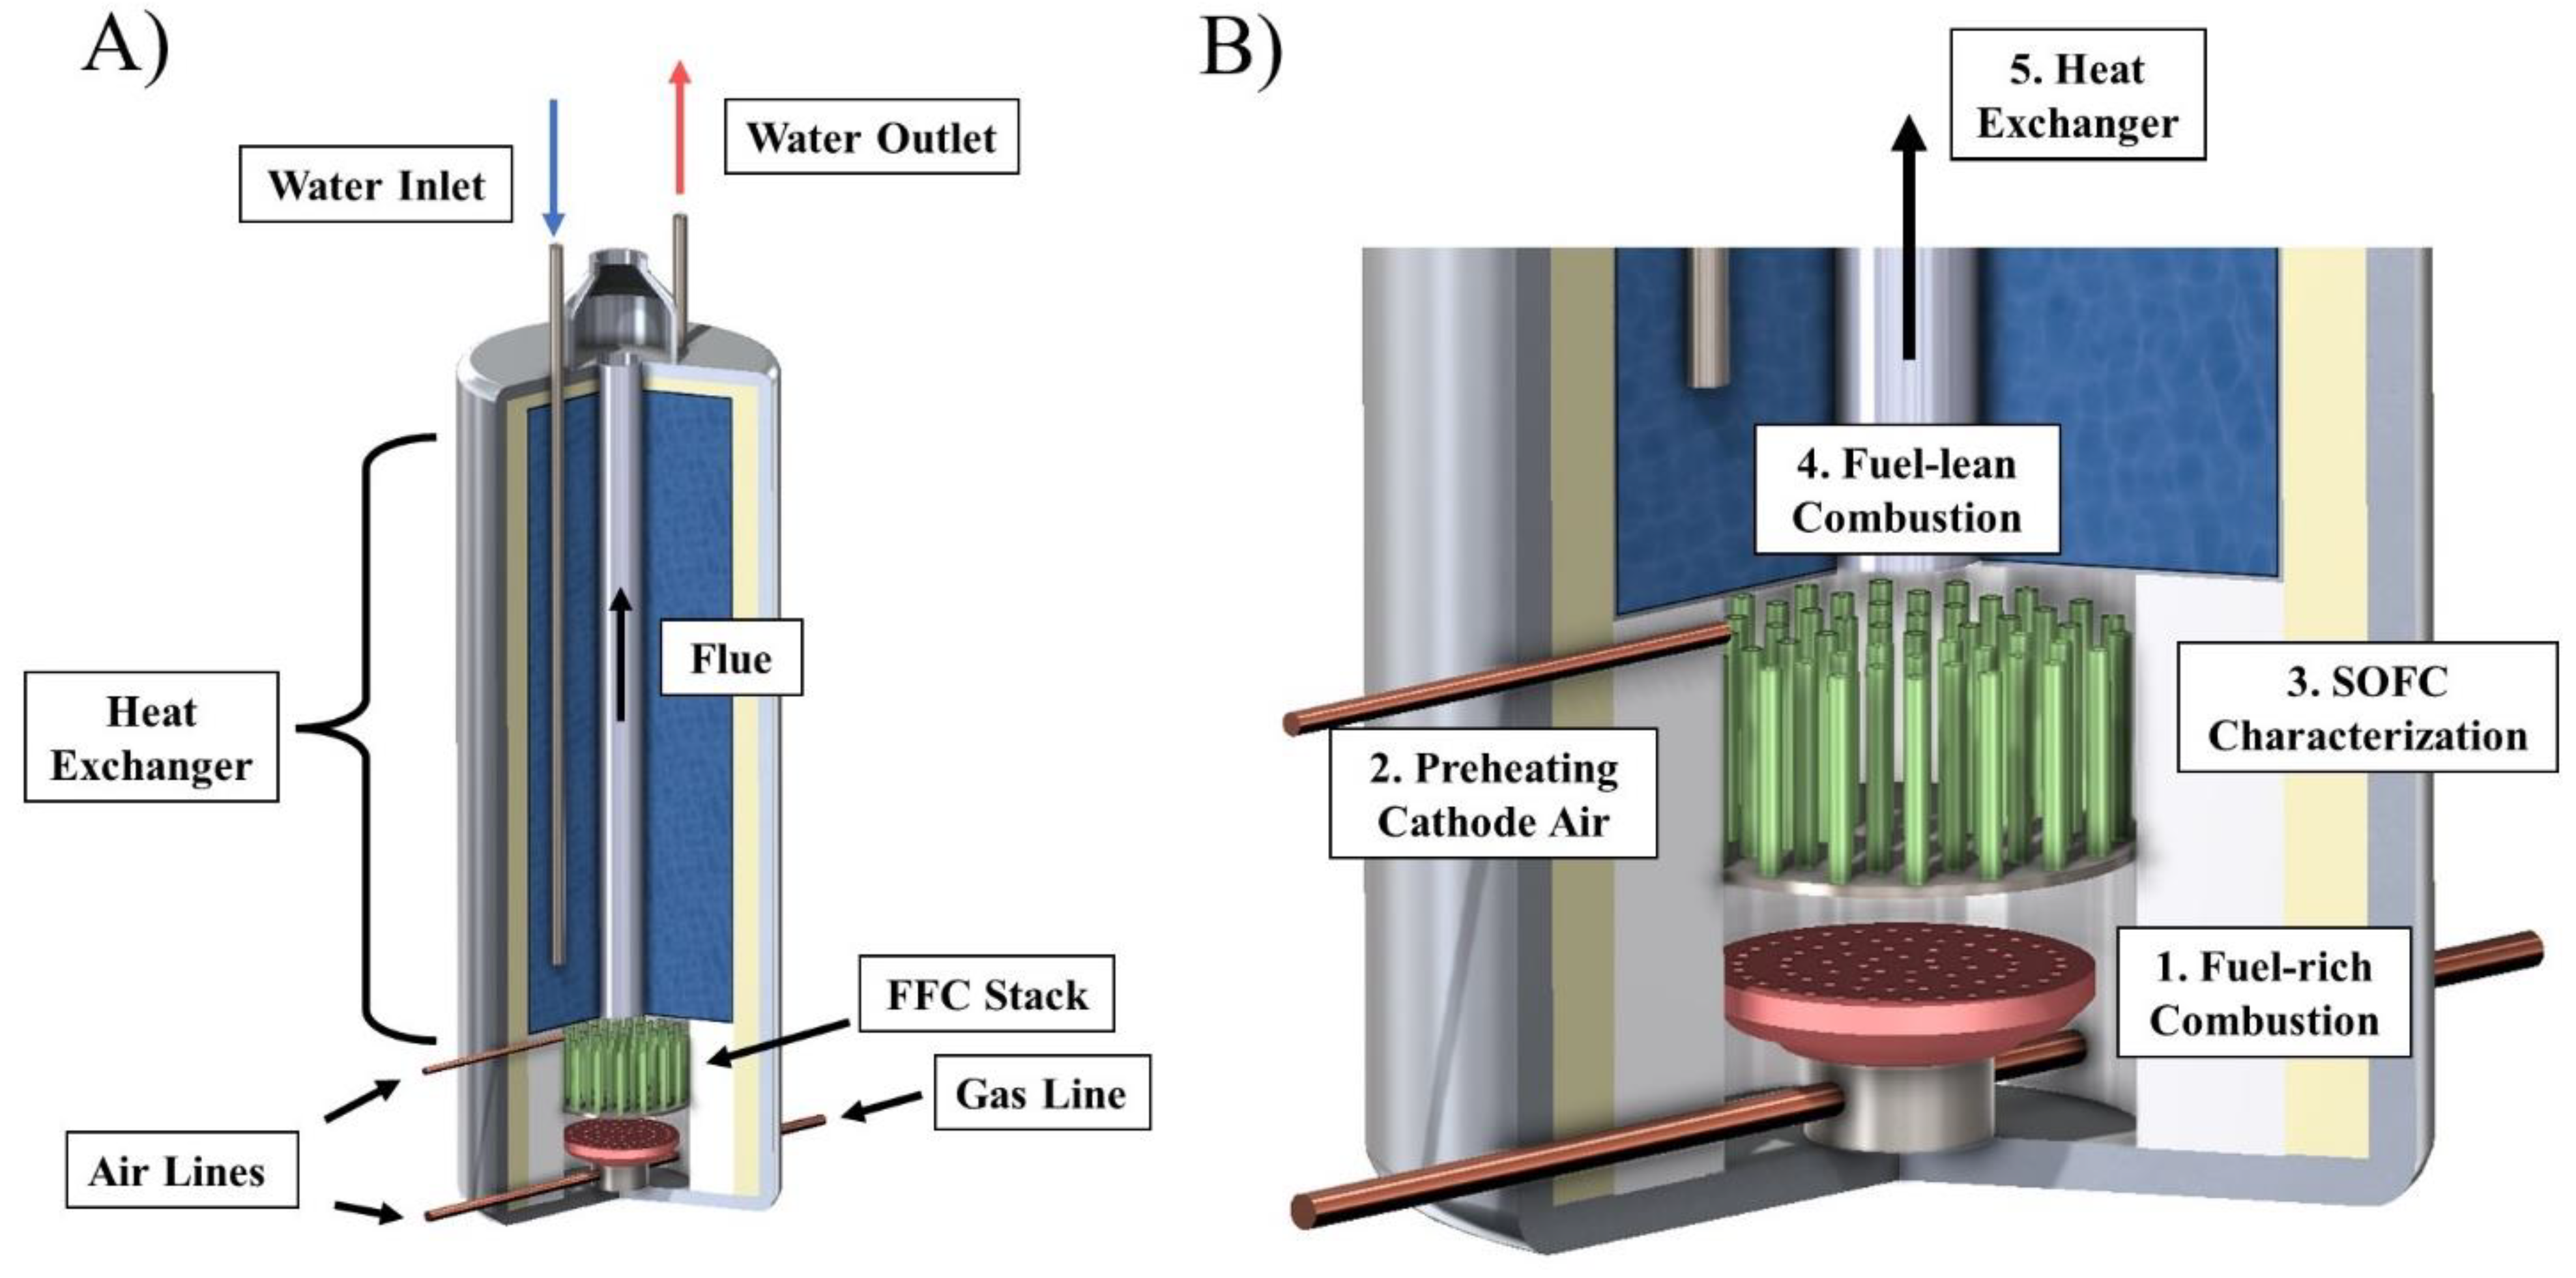
Two technologies that have shown promise for mCHP applications are the direct flame SOFC (DFFCs [17,18,19,20]) and flame-assisted SOFC (FFCs [21,22]). These SOFCs utilize partial oxidation as a method to provide the thermal energy needed for operation while reforming the hydrocarbon fuel into hydrogen and carbon monoxide. By utilizing this method for fuel reformation, virtually any hydrocarbon could be used directly in a DFFC/FFC system without the need of any additional reformer or catalysts [17,19,23]. This drastically simplifies SOFC integration into traditional balance of plant systems and removes the extended volume footprint required with current SOFC-based mCHP setups. Previous work with FFC systems utilizing common hydrocarbons found in natural gas (i.e., methane, ethane, propane, and n-butane) have shown promising results with high power densities and fuel utilizations while maintaining stable performance over time [24,25,26,27].
Although there has been numerous studies and advancements in SOFC-based mCHP systems, research into the integration of FFCs into mCHP systems has been limited. Recent work investigating DFFC and FFC based mCHP systems have primarily utilized fuel cell experiments to investigate the potential of the technology in mCHP applications [28,29,30,31,32,33,34] with only one study modeling the entire system and exploring the techno-economics [29]. In 2020, Milcarek et al. integrated micro-tubular FFCs into a residential furnace and investigated the startup, performance and cycling of the mCHP system [35]. The SOFCs demonstrated the ability to withstand 200 thermal cycles while providing quick response times, stable performance, and high CHP efficiency. However, it was concluded that hot water heaters and boilers would have greater benefit with this technology due to a larger market and longer annual operation, providing greater power generation without startup/cooldown losses. Additionally, with only one economic assessment performed focused in China [29], questions regarding the feasibility of this technology in mCHP systems globally linger. Numerous economic assessments have been conducted with traditional SOFC mCHP systems but have yet to be analyzed for a FFC mCHP system.
In this work, a novel hybrid hot water system with an integrated FFC stack model was developed and a detailed techno-economic assessment was performed for various regions in the United States. Using experimental FFC performance data, the power generation of the model was analyzed at various operating conditions and the resulting effects on hot water generation were investigated. The CHP efficiency was calculated and reported. A thorough techno-economic analysis of the hybrid hot water heater was conducted based on four regions in the United States with varying pricing of natural gas and electricity. An estimated payback period using the net present value (NPV) of the hybrid hot water heater savings is reported for various operating conditions and hot water demands for each region considered. This work serves as the first look into incorporating FFCs into gas tank hot water heaters (creating a mCHP system without increasing the volume footprint of the system) and the first work to investigates the economic viability of a hybrid hot water heater in different geographical regions where natural gas prices, electricity prices, and hot water demands vary.

2. Methods

The mCHP model was separated into 5 sections: (1) fuel-rich combustion, (2) heating air for the cathode, (3) SOFC characterization, (4) fuel-lean combustion and (5) hot water heat exchanger. A model of the hybrid hot water heater is shown in Figure 1. In this section, each stage of the hybrid hot water model is presented in depth and the overall contribution to the model is assessed. Utilizing the results achieved in the model, a detailed techno-economic assessment was performed.

2.1. Fuel-Rich Combustion

In this work, the fuel was modeled with pure methane as natural gas is primarily (>90%) methane. The amount of fuel entering the system was held constant at a gas input of 11.72 kWth aligned with commercially available residential gas tank hot water heaters while adjusting the incoming flow rate of air to various fuel/air equivalence ratios. The fuel-air equivalence ratio, Φ, is defined in Equation (1) below where m ˙ f u e l / m ˙ a i r is the mass fuel/air ratio and m ˙ f u e l S / m ˙ a i r S is the mass fuel/air ratio for the stoichiometric reaction. Using the average heat content of natural gas in the U.S. of 39.98 MJ.m−3 [36], the volumetric flow rate and mass flow rate were calculated. To achieve significant synthesis gas (hydrogen and carbon monoxide) generation for the FFC, fuel-rich equivalence ratios were investigated ranging from 1.1 to 1.6. The mass flow rate of the methane/air mixture at these fuel-rich equivalence ratios are shown in Table 1 below. Equivalence ratios greater than 1.6 were not possible due to the upper flammability limit of methane which is 1.63 at standard temperature and pressure [37]. Ideal gas behavior was assumed throughout the model.
Φ = m ˙ f u e l / m ˙ a i r m ˙ f u e l S / m ˙ a i r S
NASA Chemical Equilibrium with Application software (National Aeronautics and Space Administration (NASA), Cleveland, OH, USA, version: rev3a) was used to model the combustion exhaust products by minimizing the Gibbs free energy [38]. It has been shown in previous works that chemical equilibrium is a good approximation for estimating the exhaust species of fuel-rich combustion for FFC systems [27]. The mass flow rate of each species ( m i ) was calculated using the molecular weight of the mixture ( M W m i x ) , molecular weight of the individual gas species ( M W i ) , molar concentration of each species ( X i ) , and mass fraction of each species in the exhaust ( Y i ) as shown in Equations (2)–(4). The first law of thermodynamics was used to calculate the heat transfer leaving the system, assuming no heat loss and isobaric conditions during the combustion process, as shown below in Equation (5) where hf is the enthalpy of formation, h0 is the enthalpy at standard temperature and pressure for the ith reactant and jth product. The combustion exhaust was modeled at a temperature of 800 °C to prevent damage to the FFC. Any additional thermal energy was transferred to the cathode air or used to heat the water. The thermodynamic properties utilized in this work were from NASA Thermo Build [39,40].
M W m i x = i X i M W i  
Y i = X i M W i M W m i x  
m ˙ i = Y i ( m ˙ f u e l + m ˙ a i r )
Q ˙ o u t = i m ˙ i ( h f , i h i h i 0 ) r j m ˙ j ( h f , j h j h j 0 ) p      

2.2. Heating Air for Cathode

The heat released from the fuel-rich combustion must provide sufficient energy to preheat the incoming air utilized by the cathode. The SOFC was modeled to operate at 800 °C, therefore, the air must be heated to a similar temperature to prevent thermal shock. The amount of air flow rate fed to the SOFC is dependent on the fuel/air equivalence ratio of the entire combustion system. In a typical hot water heater, the operating equivalence ratio is below stoichiometric conditions (Φ = 0.6–0.8) to limit the formation of CO, NOx and hydrocarbons in the exhaust.
The equivalence ratios investigated for the fuel-lean combustion ranged from 0.7 to 0.95 by increments of 0.05, maximizing the amount of heat available to be transferred to the water via the heat exchanger while ensuring the oxidation of the hydrocarbons and carbon monoxide in the exhaust. The mass flow rate of the entire system is the mass flow rate of the fuel/air mixture at these fuel-lean conditions and values at each equivalence ratio are shown in Table 2. To calculate the mass flow rate of air that is needed to be preheated for the cathode side of the FFC, Equation (6) was used where ΦL and ΦR are the fuel-lean combustion and fuel-rich combustion equivalence ratios, respectively. The results of these calculations are shown in Table 3 below. Equation (2) was used to determine the amount of energy transfer required to increase the air temperature to 800 °C. A heat transfer efficiency of 0.90 was used to account for any losses that might occur during the heat transfer process. Any additional heat release was sent to the heat exchanger.
m ˙ a i r = m ˙ f u e l ( m ˙ f u e l S / m ˙ a i r S )   ( 1 Φ L 1 Φ R )

2.3. Flame-Assisted Fuel Cell

The fuel-rich combustion exhaust and the preheated air for the cathode were both fed to the FFC chamber for power generation. H2 and CO in the combustion exhaust are electrochemically oxidized by the FFC while the other exhaust species are inert during the process. Electrochemical reactions of H2 and CO are shown in Equations (7) and (8) below as a reference. Combining the two reactions, the overall fuel cell reaction is shown in Equation (9). The exhaust species that were inert or did not participate in the electrochemical reaction were not included. To make the fuel cell reaction for 1 mole of syngas, the reaction coefficients for stoichiometric conditions were reduced to reach unity as shown in Equation (10) where a is the moles of CO and b is the number of moles of H2 in the exhaust determined from chemical equilibrium. The reaction coefficients of CO and H2 were determined from chemical equilibrium calculations of the fuel-rich combustion.
H 2 + O 2 H 2 O + 2 e
C O + O 2 C O 2 + 2 e  
C O + H 2 + O 2 C O 2 + H 2 O  
a a + b C O + b a + b H 2 + 1 2 O 2 a a + b C O 2 + b a + b H 2 O  
The reversible voltage of the FFC (E0) is calculated in Equation (11) using the Gibbs free energy of the reaction at the operating temperature and one atmosphere ( Δ g r x n 0 ) divided by the number of moles of electrons available to be transferred in syngas (n = 2 e·mol−1) and the Faraday’s constant (F = 96,485 C·mol−1). However, this does not account for the dilution of the syngas by the inert exhaust species that were in the exhaust. To account for this dilution, the Nernst equation is used as shown in Equation (12) where R is the universal gas constant and K is the equilibrium constant. The equilibrium constant (K) is defined in Equation (13) as the products of activities of the reactants and products ( a i ) raised to their stoichiometric coefficient ( v i ) . For an ideal gas, the activity of species   a i equals the unitless partial pressure of the said species, P i ( a i = P i P 0   w h e r e   P 0 = 1   a t m ) . The partial pressures also can be expressed as mole fractions ( X i ) by the same ideal gas assumption. For the overall fuel cell reaction in Equation (10), the equilibrium constant is defined in Equation (14). Combining equation Equations (11), (12), and (14), the reversible potential of the FFC can be modeled using Equation (15).
E 0 = Δ g r x n 0 n F
E = E 0 + R T n F ln ( K )
K =   a r e a c t a n t s v i   a p r o d u c t s v i =   P i v i r e a c t a n t s   P i v i p r o d u c t s =   X i v i r e a c t a n t s   X i v i p r o d u c t s
K = X C O a a + b   X H 2 b a + b   X O 2 1 2   X C O 2 a a + b   X H 2 O b a + b
E = Δ g r x n 0 n F + R T n F ln ( X C O a a + b   X H 2 b a + b   X O 2 1 2   X C O 2 a a + b   X H 2 O b a + b )
The FFC cannot electrochemically convert all the syngas available in the exhaust to electrical energy. Some of the energy is converted into heat while some of the syngas passes through the FFC without being converted. The fuel utilization of the FFC quantifies how well the FFC can convert the energy into current at a given operating voltage as defined in Equation (16). The fuel utilization varies with equivalence ratio, flow rate and operating voltage [24,25]. Therefore, to illustrate the full range of the hybrid systems potential, the fuel utilization was a dependent variable, ranging from 0.4 to 0.9. By using the thermoneutral voltage, defined in Equation (17), operating voltage (V), and current generated (i), the heat generated (Ph) from the FFC can be calculated using Equation (18). Current generated can be related to the molar flow rate of syngas supplied to the FFC ( v ), moles of electrons available to transfer and Faraday’s constant as shown in Equation (19). The thermoneutral voltage (EH) of the FFC is calculated using the change of enthalpy of the fuel cell reaction (in Equation (10)) divided by the number of moles of electrons and the Faraday’s constant.
ε F . U . = H 2   a n d   C O   c o n s u m e d   i n   F F C T o t a l   H 2   a n d   C O   a v a i l a b l e   i n   e x h a u s t
E H = Δ h r x n 0 n F
P h = ( E H V ) i
i = n F ( v ε F . U . )
The molar flow rate of CO2 and H2O generated by the electrochemical process is calculated using the fuel utilization and the molar flow rate of CO and H2 following Equations (7) and (8), respectively. The amount of oxygen consumed is calculated using the definition of current shown in Equation (20) below and the number of moles of electrons equaling 4.
v = i n F

2.4. Fuel-Lean Combustion

The syngas not electrochemically oxidized by the FFC with the air supplied to the cathode is then combusted at fuel-lean conditions to ensure maximum exhaust temperature is achieved for the hot water heat exchanger. The chemical reaction of the oxidation process is shown in Equation (21) where: a and b are the moles of CO and H2 after fuel-combustion and a1 and b1 are the moles of CO and H2 that were consumed by the fuel cell. The temperature of the products of the combustion process in Equation (21) was calculated using Equation (22), assuming isobaric and adiabatic conditions. The reactants were modeled to be at 800 °C, using the assumption that the thermal energy generated by the FFC is transferred to the hot water via the heat exchanger and not to the temperature of the reactants. The products of the fuel-lean combustion are afterwards sent to the heat exchanger where the thermal energy of the flue gas is transferred to the water.
( a a 1 ) C O + ( b b 1 ) H 2 + c O 2 + d N 2 + e A r + f C O 2 + g H 2 O ( a a 1 + f ) C O 2 + ( b b 1 + g ) H 2 O + ( c ( a a 1 ) + ( b b 1 ) + y 2 ) O 2 + d N 2 + e A r
i m ˙ i ( h f , i h i h i 0 ) r = i m ˙ i ( h f , j h j h j 0 ) p    

2.5. Heat Exchanger

A typical residential building with 3 people uses 0.2434 m3 of water a day with a temperature increase of 42.8 °C as defined by the US Department of Energy [41]. Using Equation (23), the daily energy consumption to heat the hot water to temperature at the given flow rate was calculated to be 43.3 MJ. To create a baseline to compare the hybrid hot water against, a commercially available residential model was used. Residential hot water heaters come in a variety of sizes, efficiencies, and burner/heat exchanger technologies. In this study, a typical residential natural gas tank hot water heater with a thermal heat input of 11.72 kWth was chosen. The baseline hot water heater was modeled to operate at a fuel-lean equivalence ratio of 0.7 and have a Uniform Energy Factor (UEF) of 0.63 which is typical in the United States [42,43]. The flue gas temperature exiting the hybrid system and the baseline system was assumed to be 70 °C to prevent any of the water vapor in the exhaust from condensing.
Q ˙ i n = ρ V ˙ C p , a v g ( T h o t T c o l d )
The thermal, electrical, and combined CHP efficiencies were calculated using Equations (25)–(27) for FFC hybrid hot water heater at various operating conditions including variations in operating fuel-rich, fuel-lean, voltage, and fuel utilization conditions. Fuel-rich (partial oxidation) was varied from an equivalence ratio of 1.1 to 1.6, the fuel-lean combustion was varied between an equivalence ratio of 0.7 to 0.95, operating voltage from 0.5 to 0.7, and fuel utilization from 0.4 to 0.9.
ε t h = H e a t   t r a n s f e r r e d   t o   w a t e r T o t a l   c h e m i c a l   e n e r g y   e n t e r i n g   s y s t e m      
ε e = E l e c t r i c a l   p o w e r   g e n e r a t e d T o t a l   c h e m i c a l   e n e r g y   e n t e r i n g   s y s t e m    
ε C H P = ε t h + ε e    

2.6. Techno-Economic Methodology

The techno-economics of the residential mCHP hot water heater are next evaluated for the census regions of the United States, including the West, South, Midwest, and Northeast, divided as described in literature [44]. The average price of electricity [45] and average price of natural gas [46] in 2019 of states in these regions are tabulated in Table 4.
The residential annual increase rate from 2015 to 2019 for electricity usage (ie) [45] and natural gas (ing) [46] between states in these regions are tabulated in Table 5.
Table 6 shows the annual energy usage for water heating based on the census region using the annual energy usage per household in each region [47] and the U.S. average consumption share of water heating (19%).

2.6.1. Baseline Scenario One (Electric Water Heater)

Two baselines are established for comparison in the techno-economic model. The first baseline scenario is of an electric hot water heater without CHP. This system was selected for analysis due to its popularity, although replacement of an electric water heating system with the hybrid system may not be possible (i.e., without additional costs) if there is not natural gas plumbed to the residential area. The 2020 typical electric water heater described in [42] has an average installed capital cost of $850, a uniform energy factor (UEF) of 0.93, and an average lifetime (T) of 13 years.
The net present cost (NPC) of operational costs is found for each region using Equation (27) to determine the total cost of water heating over the water heater’s lifetime in today’s dollars. In this equation, UC denotes the electricity usage cost for each region—dependent on the water heating energy, UEF of the water heater, and bundled usage cost for that region. Recall ie is the annual increase rate in the cost of electricity usage in the respective region and r is the discount rate, or the rate of return of investments with similar risk in financial markets. Since water heating is necessary, this discount rate is simply taken as the inflation rate from 2018 to 2019 of 1.76% [48].
N P C b a s e l i n e , e = t = 0 T U C ( 1 + i e ) t ( 1 + r ) t    

2.6.2. Baseline Scenario Two (Natural Gas Water Heater)

The other baseline scenario considered is of natural gas hot water heater without CHP. This baseline scenario considers the 2020 typical gas-fired water heater described in [42] with an average installed capital cost of $1925, a uniform energy factor (UEF) of 0.63, and an average lifetime (T) of 13 years.
The net present cost (NPC) of natural gas water heating operational costs is found for each region using Equation (28) to determine the total cost of water heating over the water heater’s lifetime in today’s dollars. In this equation, NGC denotes the natural gas usage cost for each region—dependent on the water heating energy, UEF of the water heater, heating value of the natural gas (39.98 MJ·m−3) and bundled natural gas usage cost for that region. Recall ing is the annual increase rate in the cost of natural gas usage in the respective region and r is simply taken as the inflation rate from 2018 to 2019 of 1.76% [48].
N P C b a s e l i n e , n g = t = 0 T N G C ( 1 + i n g ) t ( 1 + r ) t      

2.6.3. mCHP Hybrid Water Heater Cost

Before savings occur, the capital cost of the mCHP hot water heater is paid in full up front. Based on the heating energy supplied to the water shown in Table 6, the natural gas input (NGI) to the mCHP system and resulting electricity generation are calculated and shown in Table 7 for a system with fuel-rich and fuel-lean equivalence ratios of 1.6 and 0.8, respectively. Note that based on a typical residential unit with 3 people using 0.243 m3 of water per day with a temperature increase of 42.8 °C, this equals an average annual mass of water heated of 88,784 kg/year. Since the average number of occupants in a U.S. household in 2020 is 2.53 [49], the values reported in Table 7 are reasonable.
Recall the mCHP water heater operates on natural gas and generates electricity. Therefore, the NPC of operation is described by Equation (29), where NGUC is the natural gas usage cost to heat the same amount of water as the baseline case and UGC is the annual cost of electricity generated by the system while heating the water. The same lifetime (T) of 13 years is considered, however the discount rate for CHP replacements is typically 7% [50]. Throughout the 13-year lifetime, the fuel cell is calculated to only operate for a maximum of 6842 h in the Northeast and Midwest regions. Noticeable degradation for some state-of-the-art SOFC mCHP systems is not observed until 20,000 h [14] so degradation in the fuel cell performance is not considered. The installed capital cost is assumed to be the same as the natural gas baseline scenario with an additional $1253 cost of the fuel cell and installation.
N P C m C H P = t = 0 T N G U C ( 1 + i n g ) t U G C ( 1 + i e ) t ( 1 + r ) t
The total savings (TSe) associated with replacing a typical electric water heater with the proposed mCHP water heater is described by Equation (30). This formulation is simply the new cost of water heating subtracted from the original cost.
T S e = t = 0 T U C ( 1 + i e ) t ( 1 + r ) t N G U C ( 1 + i n g ) t U G C ( 1 + i e ) t ( 1 + r ) t
Similarly, the total savings (TSng) associated with replacing a typical natural gas water heater with the proposed mCHP water heater is described by Equation (31).
T S n g = t = 0 T N G C ( 1 + i n g ) t ( 1 + r ) t N G U C ( 1 + i n g ) t U G C ( 1 + i e ) t ( 1 + r ) t

3. Results

3.1. Fuel-Rich Reforming Characterization

The adiabatic flame temperature and exhaust gas composition of the fuel-rich combustion were calculated using NASA CEA and results are shown in Figure 2. As suspected, the flame temperature decreases as the equivalence ratio increases as shown in Figure 2A. This occurs because the chemical energy in the excess fuel is not converted to thermal energy. Instead, the excess fuel requires energy to increase the temperature from ambient to the adiabatic temperature. Notwithstanding this decrease in available thermal energy as equivalence ratio increases, there was sufficient thermal energy available in the exhaust to preheat the incoming air for the cathode at heat exchanger efficiency of 90% while maintaining the temperature of the exhaust species above 800 °C. The amount of energy available after preheating the cathode air is shown in Table 8 below. This excess heat is directed to the fuel-lean combustion products to increase the temperature prior to entering the heat exchanger.
With the decrease in complete combustion, which occurs at or above stoichiometry, the formation of H2 and CO becomes more favorable as the equivalence ratio increases, as shown in Figure 2B. As a result, the CO2 and H2O concentration decreases as the equivalence ratio increases. The maximum synthesis gas production occurred at an equivalence ratio of 1.6 with an H2 molar concentration of 10.1% and CO molar concentration of 9.3%. As a result, the power generation from the FFCs is expected to be the highest at an equivalence ratio of 1.6. Although higher H2 and CO concentrations can be achieved at equivalence ratios greater than 1.6 according to NASA CEA, the risk of soot formation is significant as the equivalence ratio increases above 1.7 for methane [51]. In addition, the mixture needs to be pre-heated in order to have sufficient thermal energy to prevent flame quenching (i.e., above the upper flammability limit) observed in conventional burners at equivalence ratios greater than 1.64 [37].

3.2. FFC Performance

The fuel cell performance at various fuel utilizations for an operating voltage of 0.5, 0.6 and 0.7 are shown in Table 9, Table 10 and Table 11, respectively. For a given fuel-rich equivalence ratio, the electrical power generated is constant for all fuel-lean equivalence ratios. This is due to the fact that the fuel-lean combustion process occurs after the FFC and does not influence the FFC in any manner. As the fuel utilization increased for a given operating voltage, the power generated increased as expected. In comparing the power generated between operating voltages at the same fuel utilization, the higher operating voltage results in a higher power output. However, in physical applications of FFCs, as the operating voltage increases, the fuel utilization of the FFC decreases [24]. Nevertheless, results from the hybrid model illustrates the potential power generation if the operating condition and fuel utilization are optimized for the given system.

3.3. Fuel-Lean Combustion Characterization

After the fuel containing exhaust mixture exits the FFC, it is modeled to undergo complete oxidization at fuel-lean conditions to ensure no H2 or CO are present in the exhaust. The fuel-lean combustion equivalence ratio was varied from 0.7 to 0.95. The temperature of the fuel-lean exhaust is dependent on four variables: operating voltage of the FFCs, the fuel utilization of the FFCs, operating fuel-rich equivalence ratio and fuel-lean equivalence ratio. Therefore, to prevent data saturation in this work, only two conditions are shown for reference. The exhaust temperature of the fuel-lean combustion process as a function of fuel-rich and fuel-lean equivalence ratios at an operating voltage of 0.6 and fuel utilization of 0.5 and 0.7 are shown in Table 12 and Table 13 below, respectively. As the fuel-rich equivalence ratio increases, the temperature of the exhaust decreases for a given fuel-lean equivalence ratio. This is a result of more fuel being electrochemically converted to electrical power rather than thermal energy. For a given fuel-rich equivalence ratio however, the temperature increases as the fuel-lean equivalence ratio increases closer to stoichiometry. The excess air at extreme fuel-lean conditions acts such as a heat sink in the combustion exhaust due to the significant amount of excess O2 and N2 that is heated to the same final temperature. The increase in mass of O2 and N2 is demonstrated in Table 2 where a change from ΦL = 0.95 to ΦL = 0.70 increased the air mass flow rate by 35.7%. In the same manner, the change from ΦL = 0.95 to ΦL = 0.70 decreased the exhaust temperature by 20% as demonstrated in Table 12 and Table 13. Similar to the increase in fuel-rich equivalence ratio, the increase in fuel utilization has an adverse effect on the exhaust temperature as shown by comparing and Table 13 below. As shown in Equation (16), the fuel utilization of the FFC is the percentage of fuel converted to electrical power divided by the total amount of energy available to be converted in the fuel. By increasing the fuel utilization, the amount of fuel available to be combusted decreases, thus decreasing the exhaust temperature.

3.4. Hybrid Hot Water Heater Performance Characterization

As discussed previously, the temperature of the exhaust is dependent on the fuel utilization, operating voltage, fuel-rich equivalence ratio and fuel-lean equivalence ratio. This, as a result, affects the amount of heat that can be transferred to the water. As stated in the Section 2, to perform a comparison between the baseline hot water heater and the hybrid hot water heater for all variables, the final exhaust temperature was held constant at 70 °C. For an operating voltage of 0.6 and fuel utilization of 0.7, the amount of heat transferred to the water as a function of fuel-rich/fuel-lean equivalence ratios is shown in Table 14 below as a reference.
One key finding in this work is that for a given fuel-rich equivalence ratio, fuel utilization, and operating voltage, the heat transferred as function of fuel-lean equivalence ratio is nearly constant. This occurs notwithstanding the temperature decrease at lower fuel-lean equivalence ratios. With the heat transfer relatively constant at different fuel-lean equivalence ratios, the calculated thermal efficiency is relatively constant by extension. Additionally, as stated in Section 3.2, the power generation (and by addendum, electrical efficiency) is only a function of fuel-rich equivalence ratios, operating voltage, and fuel utilization. Therefore, the combined heat and power efficiency is constant for all fuel-lean conditions for the given operating conditions. This is shown in Figure 3A below. The cause of the near constant heat transfer for each fuel-lean equivalence ratio is due to the increasing mass flow rate as the temperature of the exhaust decreases, as demonstrated in Figure 3B. The increase in mass flow rate counteracts the decrease in temperature to provide similar total heat transfer to the water via the heat exchanger using Equation (5). While this thermodynamic model indicates that fuel-lean equivalence ratio will have limited impact on the efficiency, it is well known that a higher temperature gradient across the heat exchanger improves the rate of heat transfer. As a result, practical applications may observe slight differences and the size of the heat exchanger may be impacted.
In holding the fuel-lean equivalence ratio constant and varying the fuel-rich equivalence ratio at a fuel utilization of 0.7 and operating voltage of 0.6, the thermal, electrical and CHP efficiencies were calculated, and results are shown in Figure 4 below. As the fuel-rich equivalence ratio increased, the electrical efficiency increased. This is to be expected due to the increase in synthesis gas concentration in the exhaust as seen in Figure 2B. With the increased amount of fuel in the exhaust, the FFC was able to convert a greater amount of chemical energy to electrical power even though the fuel utilization was held constant. In a similar manner, the thermal efficiency decreased as the fuel-rich equivalence ratio increased due to the same principle. However, the increase in electrical efficiency is greater than the decrease in thermal efficiency as a function of fuel-rich equivalence ratio, resulting in an increase in CHP efficiency. The maximum CHP efficiency calculated for these operating conditions is 91.0% at a fuel-rich equivalence ratio of 1.6 with thermal and electrical efficiencies of 78.2% and 12.8%, respectively.
In addition to fuel-lean/rich equivalence ratios, the effects that fuel utilization and operating voltage have on the hybrid hot water system were investigated. Both operating conditions affect the performance of the FFC which in turn affects the thermal and electrical efficiency of the system. The fuel utilization was varied from 0.4 to 0.9 at a constant operating voltage, fuel-rich equivalence ratio and fuel-lean equivalence ratio of 0.6, 1.6, and 0.8, respectively. The thermal and electrical efficiencies of the hybrid system at these conditions are shown in Figure 5A,B. As the fuel utilization increases, the thermal efficiency decreases while the electrical efficiency increases. The difference between the electrical and thermal efficiency increased as the fuel-rich equivalence ratio increased at different fuel utilizations. At an equivalence ratio of 1.6, thermal efficiencies decreased by ~1% with a 10% increase in fuel utilization. In contrast, electrical efficiencies increased by ~1.8% with a 10% increase in fuel utilization. The highest electrical efficiency and lowest thermal efficiency occurred at the highest fuel utilization for the given fuel-rich equivalence ratio. However, high fuel utilization (>70%) can be difficult to achieve in actual systems. Further research is warranted to optimize the active surface area necessary to achieve these higher efficiencies for FFCs.
After investigating fuel utilization effects, the effects of operating voltage of the FFC on the efficiencies of the hybrid system were explored. The operating voltage of an FFC typically ranges from 0.5 V to 0.7 V. At lower operating voltages, more current density can be achieved, resulting in greater fuel utilization and power generation. This can be demonstrated in a polarization curve of a fuel cell. However, operating at lower voltages for an extended period of time can damage the fuel cell. In contrast, at higher operating voltages, the current density achieved is much lower, but the fuel cell is at less risk of irreversible damage and operates more efficiently. Therefore, in this analysis, the operating voltage was investigated from 0.5 to 0.7 V at two fuel utilizations, 50% and 80% to provide a broad characterization of how the operating voltage affects the performance of the system. The thermal and electrical efficiencies as a function of fuel-rich equivalence ratio at a fixed fuel-lean equivalence ratio of 0.8 are shown in Figure 5C,D. As the operating voltage increases, the power generation increases which results in a greater electrical efficiency. The increase in electrical efficiency adversely affects the thermal efficiency. As shown in Equation (18), increasing the operating voltage decreases the heat released by the FFC. This lack of heat generation affects the exhaust temperature of the combustion process which directly affects the thermal efficiency. While operating voltage and fuel utilization are dependent on each other as shown in fuel cell polarization curves, additional work is warranted to develop FFCs that operate at higher operating voltages while producing significant current to achieve high fuel utilization.

3.5. Techno-Economic Analysis

The cost of water heating for the electric water heater baseline scenario is first analyzed with consideration of the $850 capital investment cost paid up front using Equation (27). The NPC of the operational costs throughout the water heater’s lifetime and the total cost of the system for each region is tabulated in Table 15.
The cost of water heating for the natural gas water heater baseline scenario is next analyzed with consideration of the $1925 electric water heater’s capital investment cost paid up front using Equation (28). The NPC of the lifetime electric water heater operation is tabulated in Table 16.
Next, the cost of water heating for the mCHP hybrid water heater is analyzed using Equation (29). The results shown in Table 17 are intriguing, as the cost of water heating with mCHP is very close in the West and Midwest even though these region’s demands are significantly different. The reason for this is the difference in utility costs, where the Midwest is the lowest price for both electricity and natural gas usage. All of these regions see a reduced annual cost of water heating from either baseline tested.
Figure 6 shows the total savings from using a mCHP water heater compared to the electric water heater (TSe) for each year t and for each region, deduced from Equation (30). It is observed that all regions experience negative savings in the first year (year 0) due to higher capital costs, but all regions have positive savings within the first 6 years of operation (i.e., additional capital costs are recovered within six years of operation). The payback period is the fastest in the Northeast between 1–2 years, then the Midwest between 2–3 years, the West between 4–5 years, and the South between 5–6 years.
Figure 7 shows the total savings from using an mCHP water heater compared to a natural gas water heater (TSng) for each year t and for each region, deduced from Equation (31). Similar to the electric water heater case, all regions experience negative savings in the first year (year 0) due to higher capital costs for the mCHP system. However, since the capital cost of the natural gas water heater is greater than the electric water heater, the difference in capital investment is not as large. Although the difference in capital investment is less, the payback period is longer for each region. For example, the Northeast has a payback period of approximately 4 years, the Midwest of approximately 7 years, the South between 7–8 years, and the West between 9–10 years.
Replacement of a natural gas water heater with the mCHP water heater is not as attractive as replacement of an electric water heater. Resulting from lower utility costs, the annual cost of natural gas input is much less than the annual cost of electricity input to achieve the same water heating even though the UEF of the electric water heater is greater than the natural gas water heater. In addition, it is important to remember that replacement of an electric system with the hybrid system may not be feasible depending on natural gas plumbing.
Due to the Northeast having one of the largest hot water demands, highest electricity usage cost, highest natural gas usage cost, and highest annual increase rate in both of these utility costs, the hybrid hot water heater is most attractive in this region when compared to both baseline scenarios. The Midwest, having a hot water demand equal to the Northeast, has the second fastest payback period when replacing either baseline water heater with the hybrid system. However, the payback period is longer when replacing a natural gas water heater since this region has the lowest natural gas usage costs and they are considered to be decreasing based on annual trends. The South has the next highest hot water demand and the lowest electrical usage cost, so it has the longest payback when replacing an electric water heater. The West, having the lowest hot water demand and a decreasing natural gas usage cost, has the longest payback period when replacing a natural gas water heater.

4. Conclusions

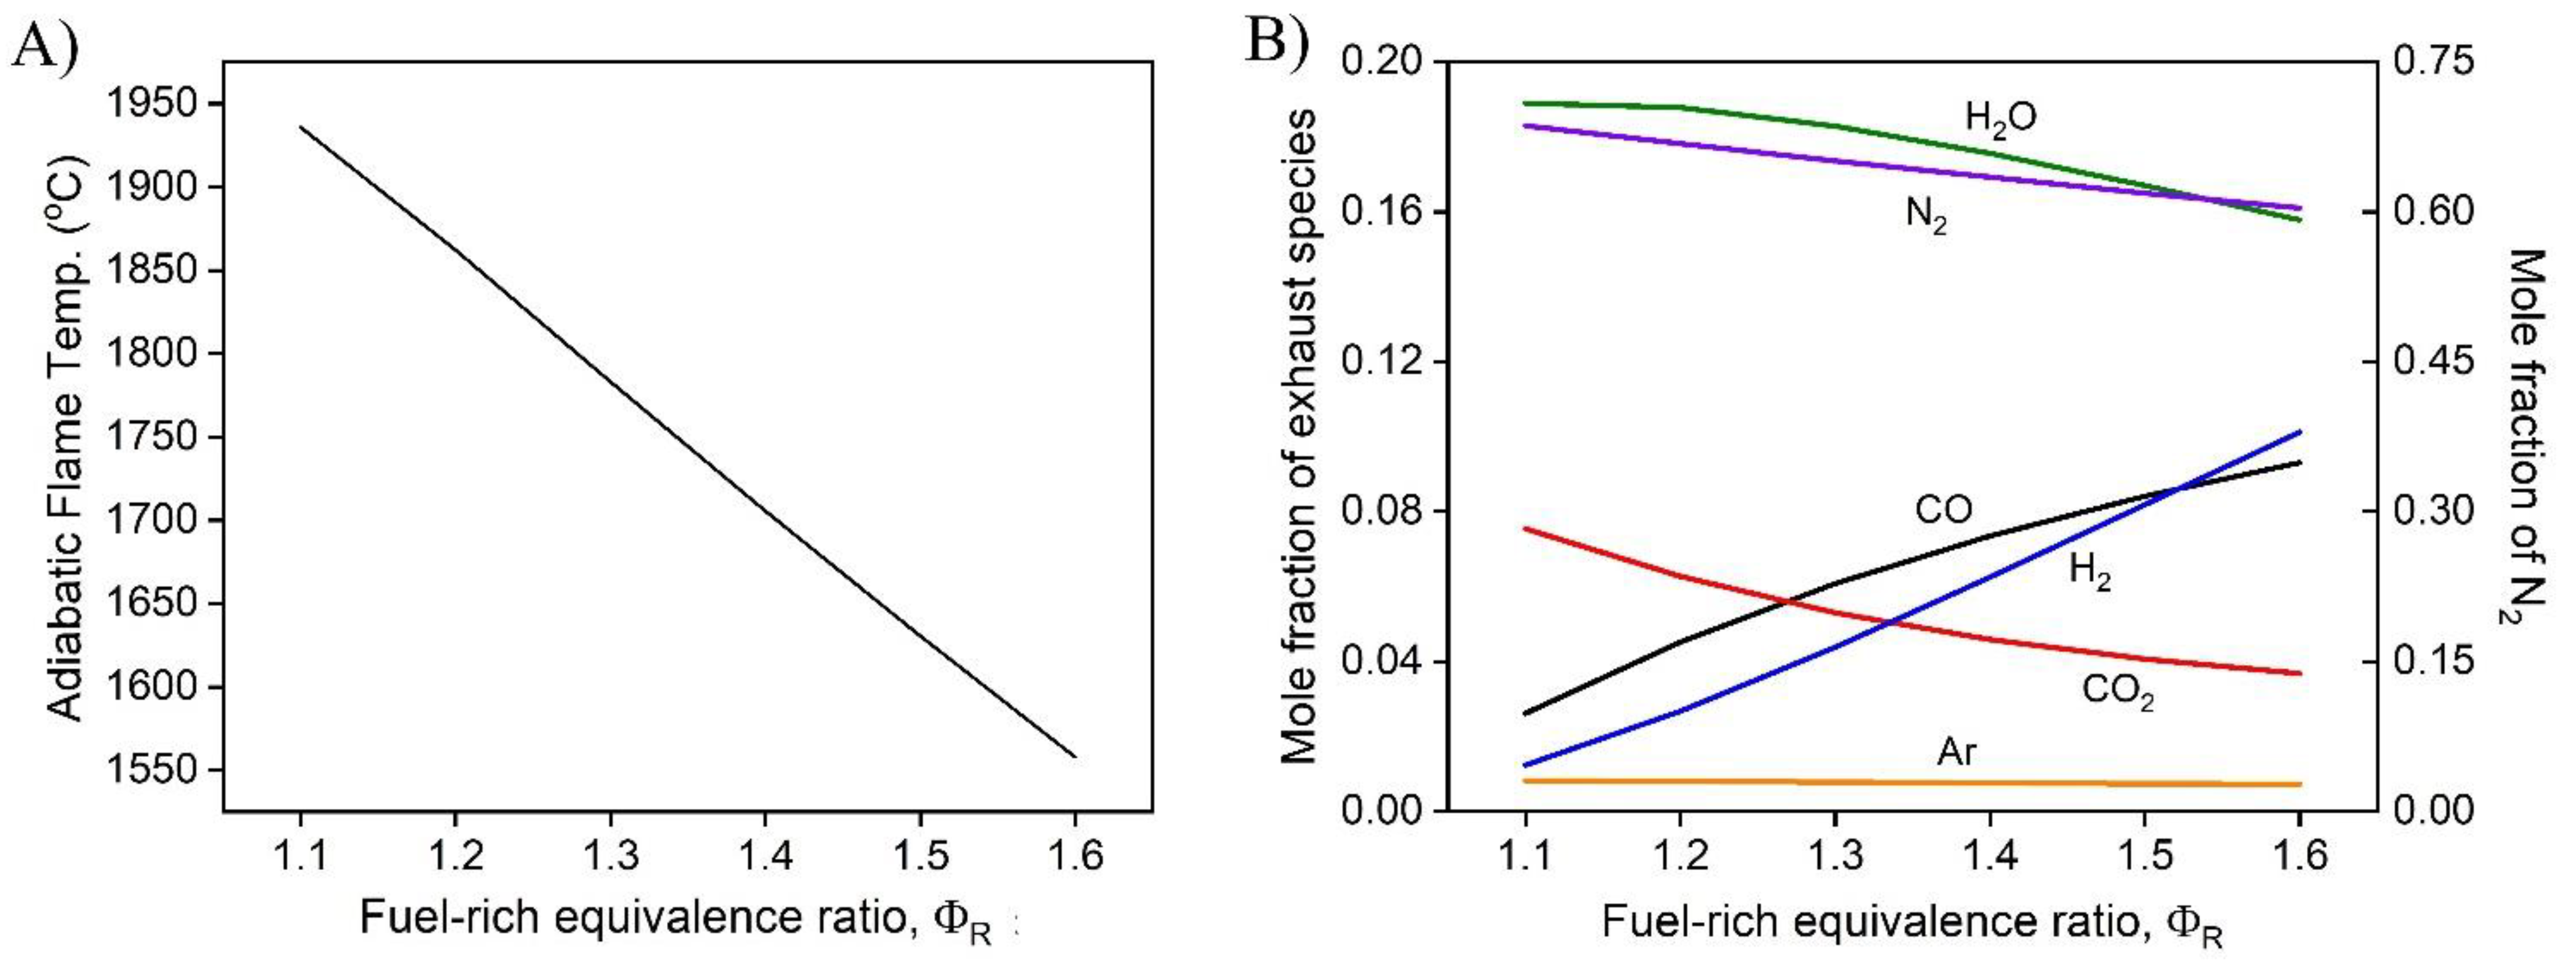
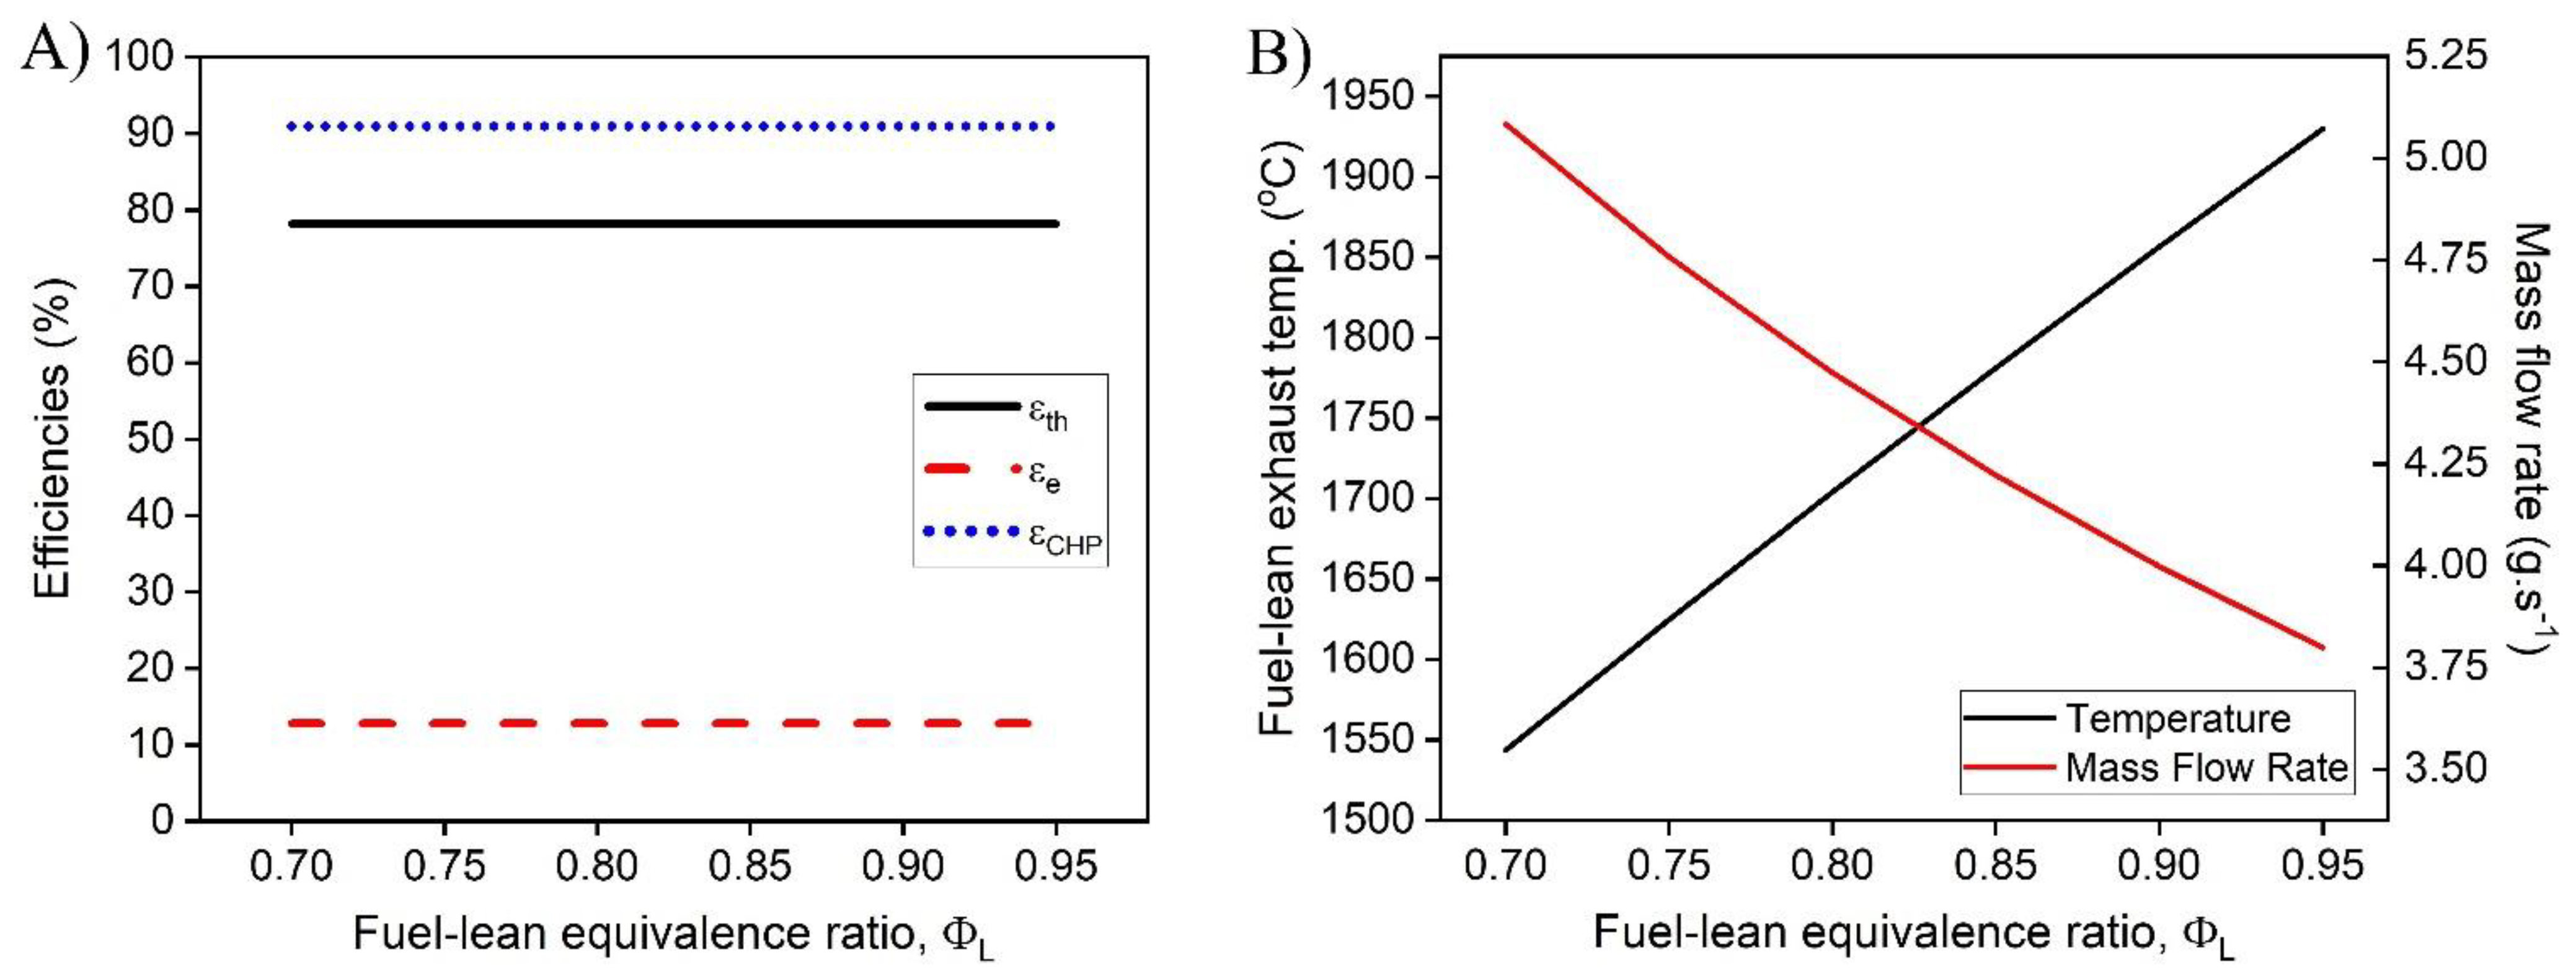
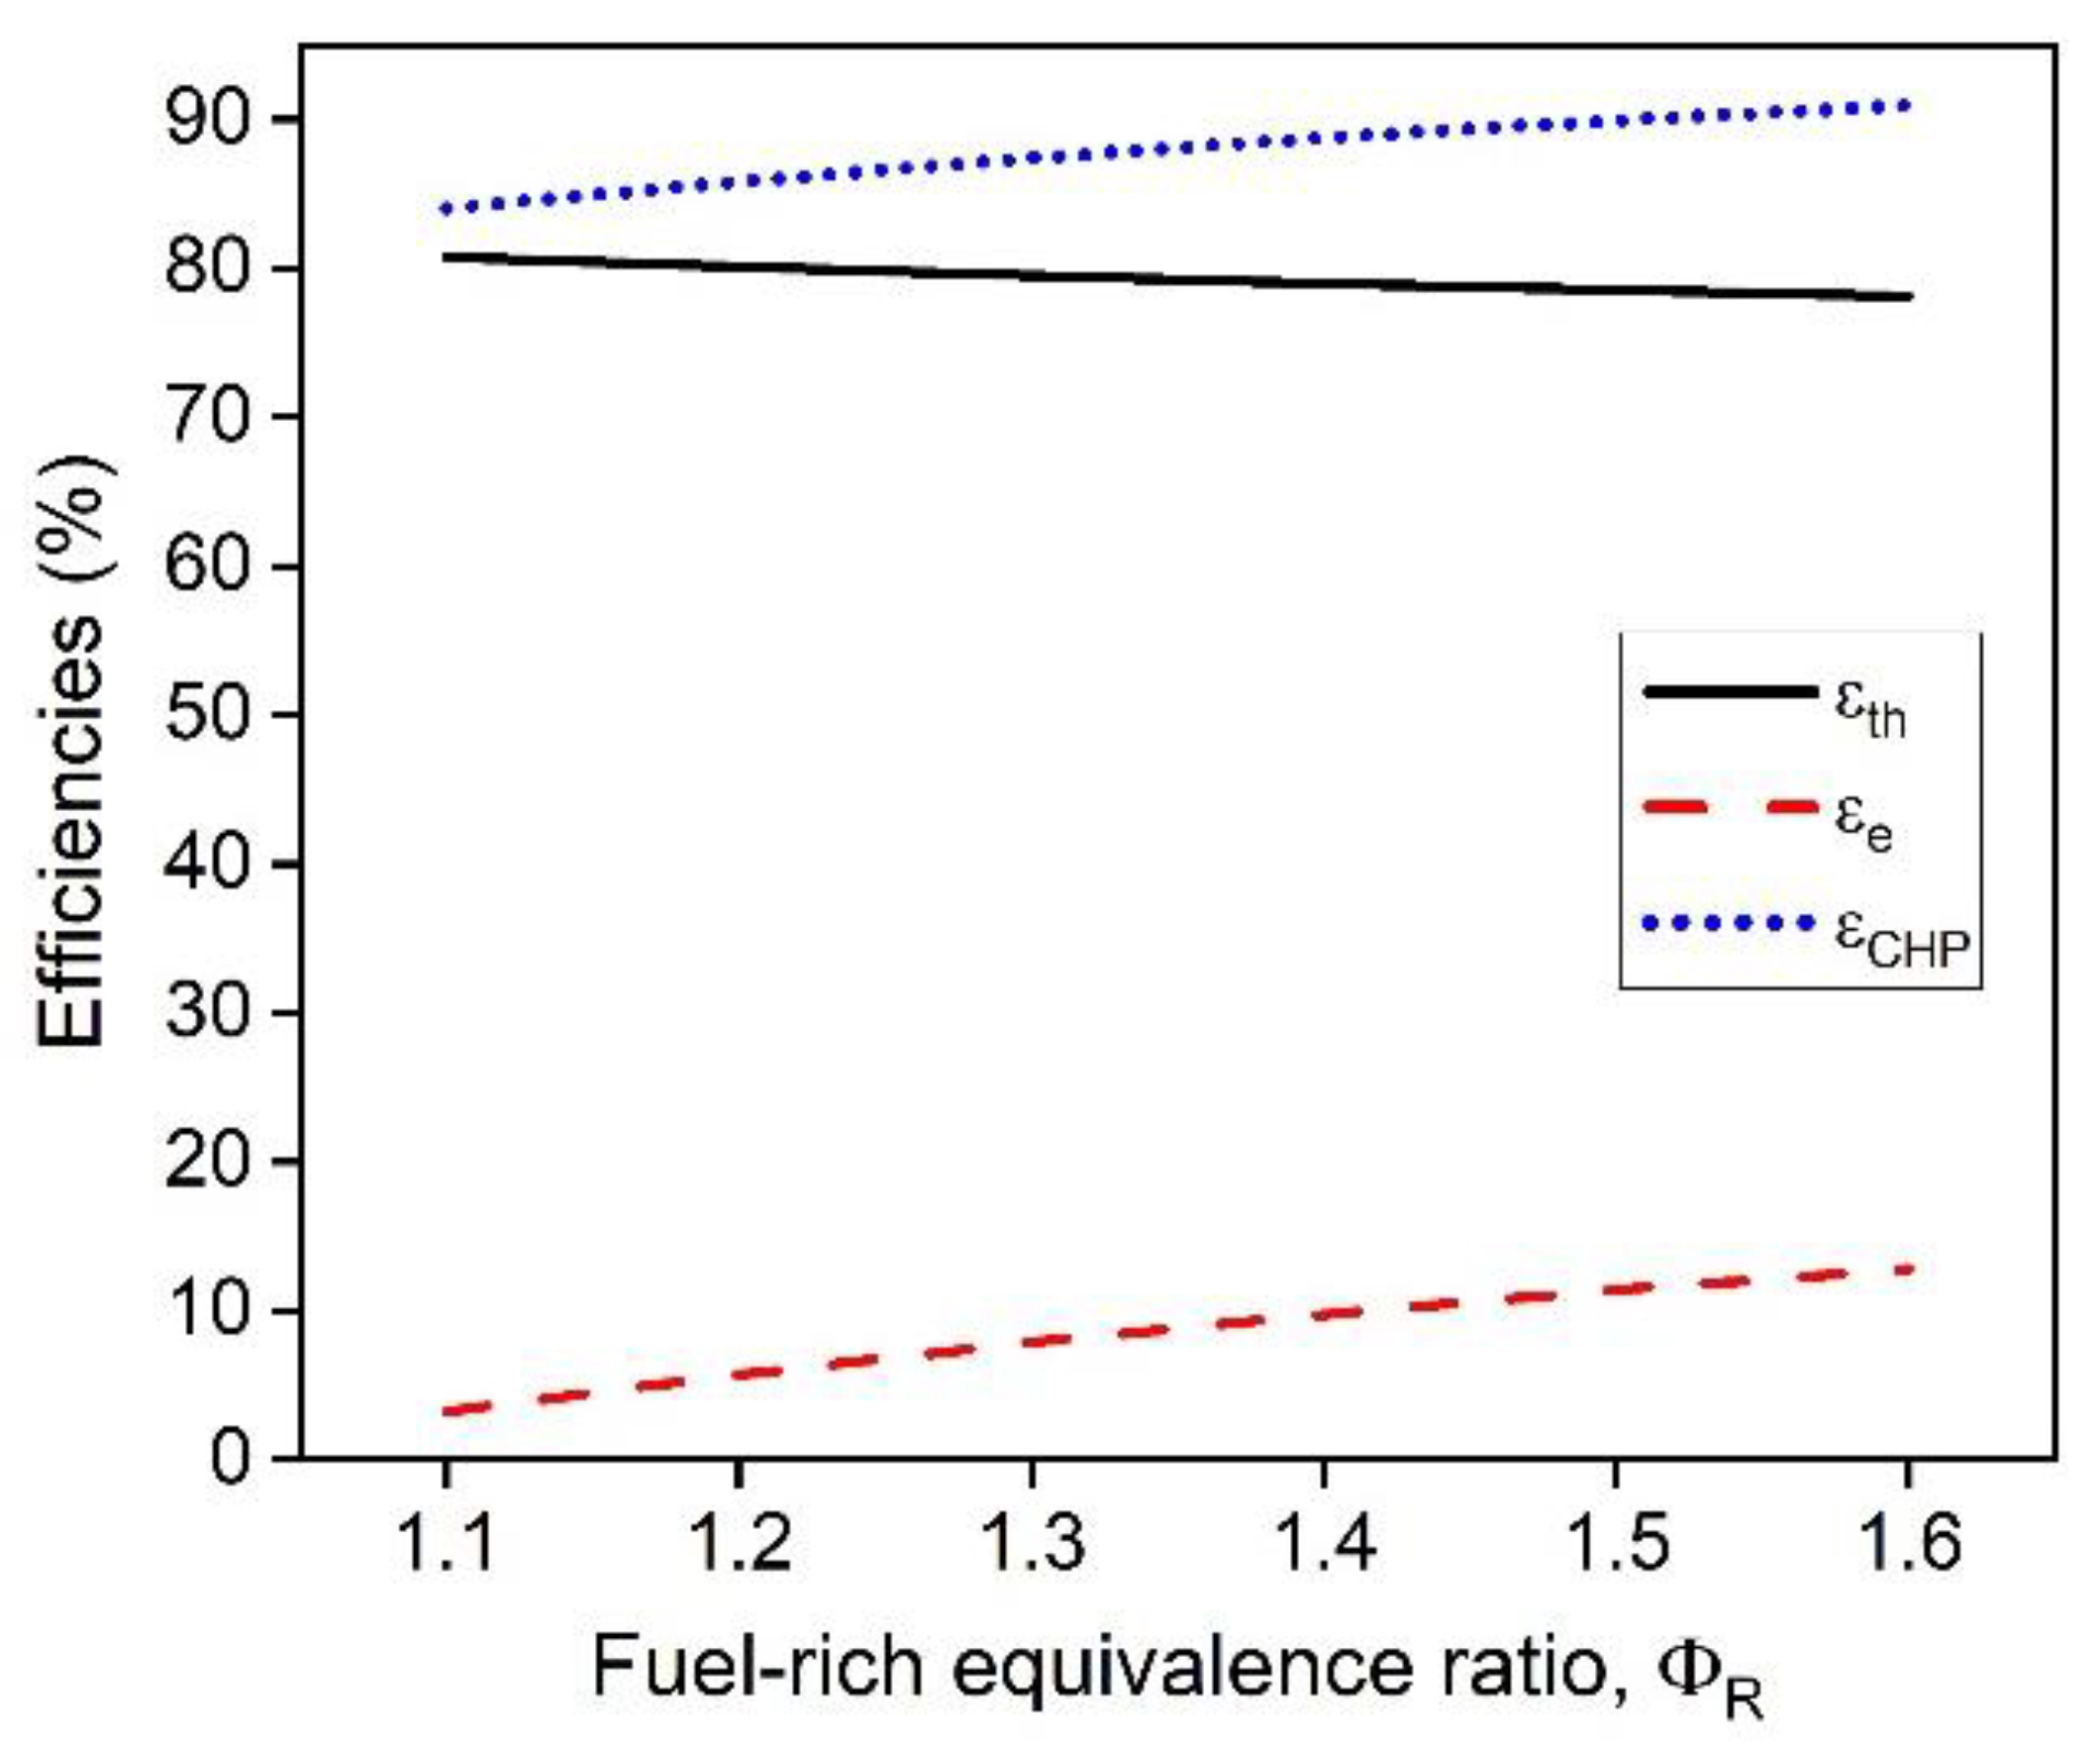
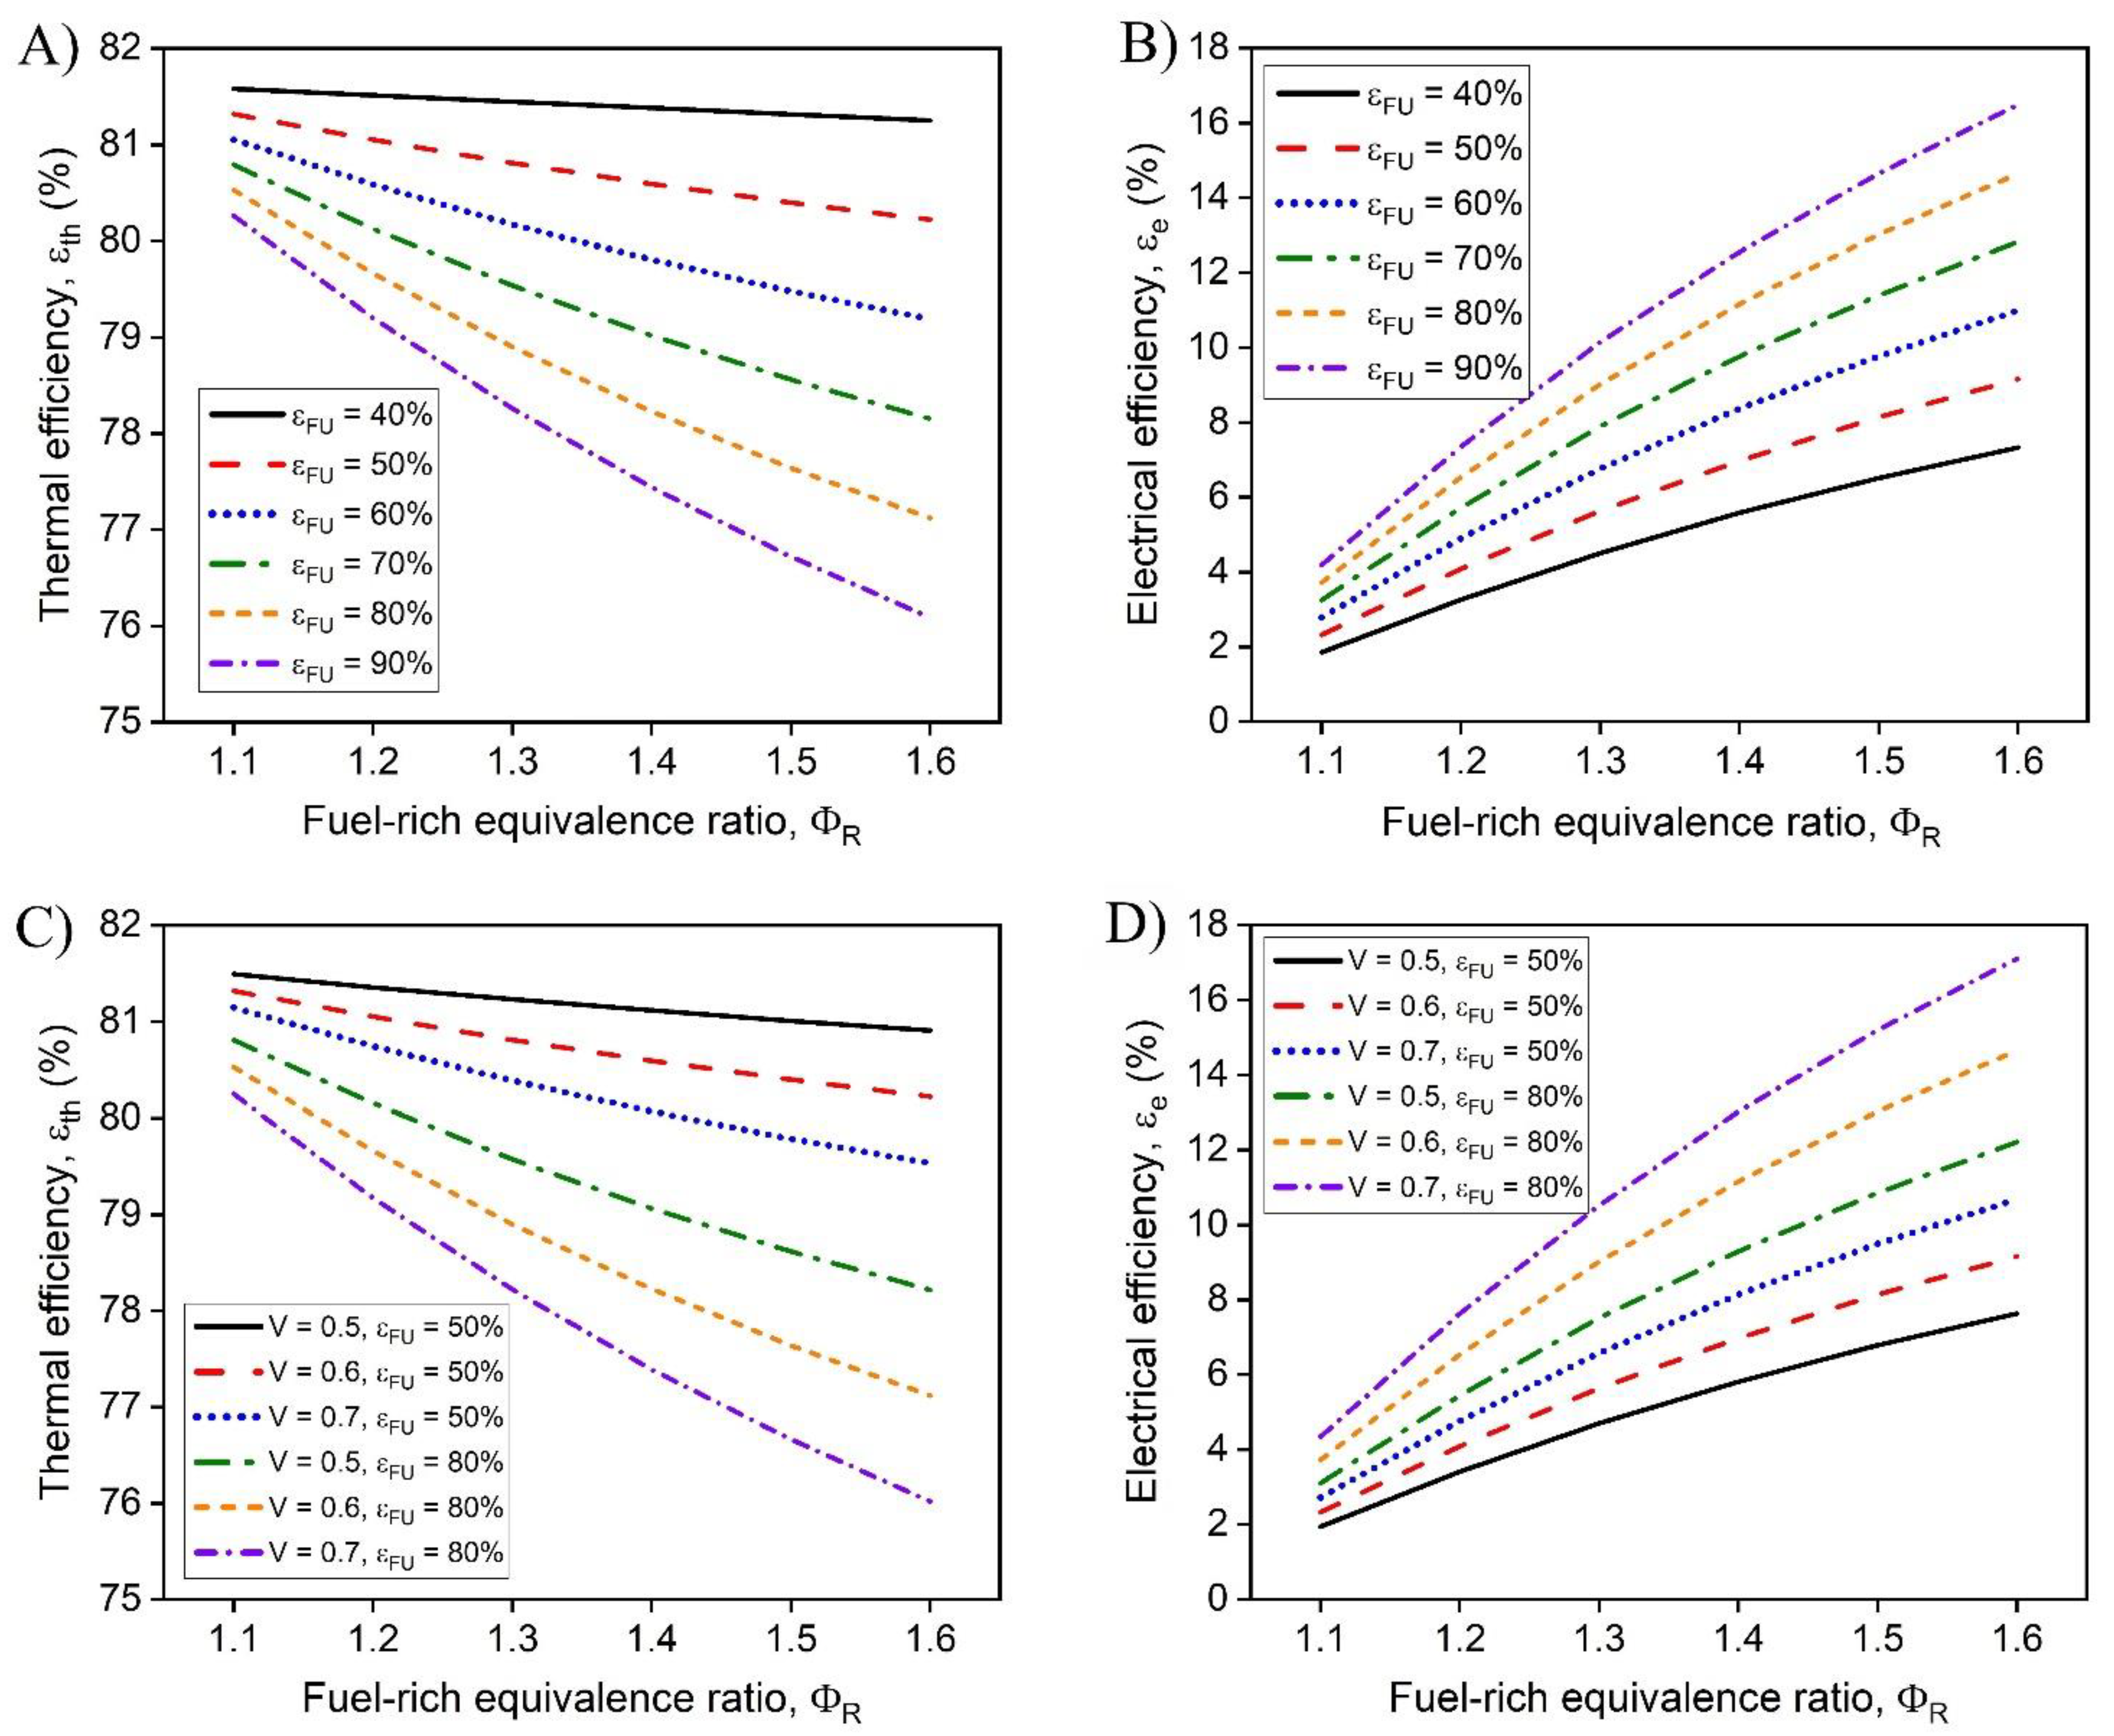
In this work, a hybrid hot water heater with an integrated FFC model was developed and a techno-economic analysis was performed. The performance of the hot water heater was dependent on the operating conditions including the fuel-rich combustion equivalence ratio, the operating voltage of the FFC, and the fuel utilization of the FFC. The dependence of the fuel-lean combustion equivalence ratio after the FFC was investigated and was determined to provide minimal effect on the overall performance of the system. The temperature of the exhaust leaving the hybrid combustion system was determined to be dependent on the mass flow rate of the system while operating at a set fuel-rich equivalence ratio, operating voltage, and fuel utilization. The hybrid hot water heater model demonstrated that CHP efficiencies greater than >90% with electrical efficiencies as high as 16% are possible. As the fuel-rich equivalence increases, the electrical and thermal efficiencies vary more at different fuel utilizations, providing greater performance increase for each increase in fuel-rich equivalence ratio. To obtain optimal performance, high fuel utilization coupled with higher operating voltages are desirable. With practical FFC operating conditions, ( ε F U = 70% and V = 0.6 V) the CHP efficiency was 91.0% with an electrical efficiency of 12.8%.
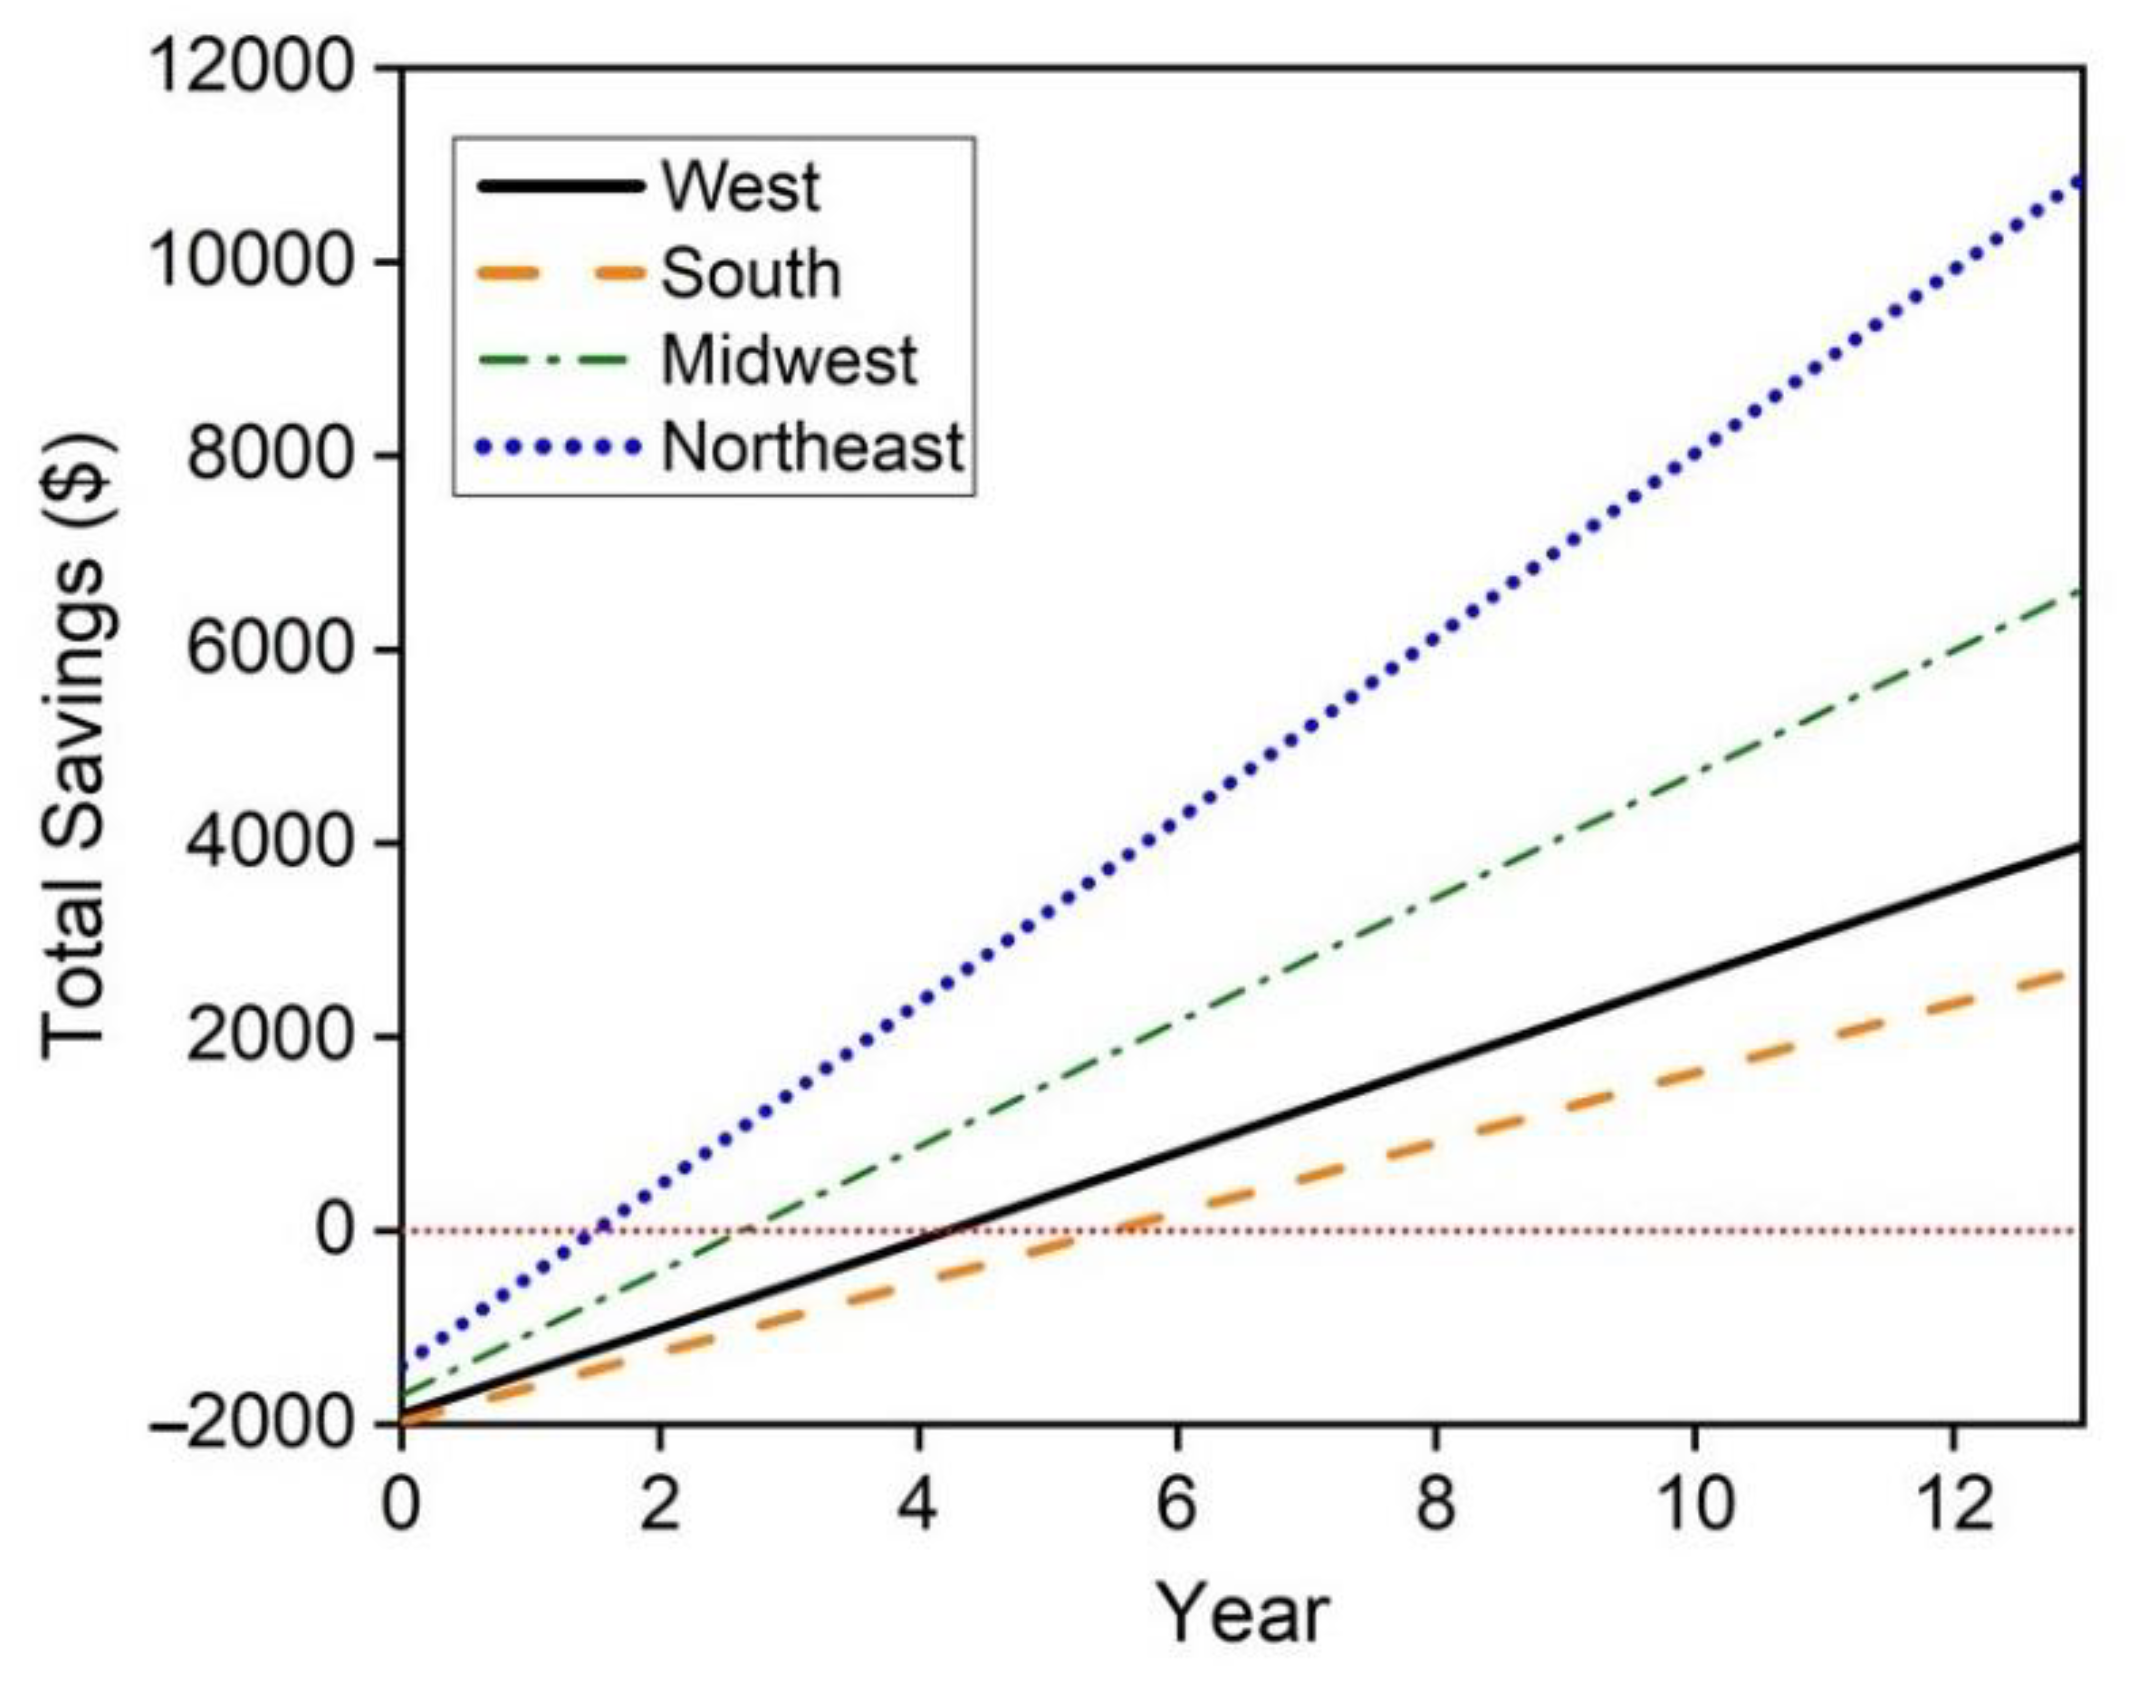
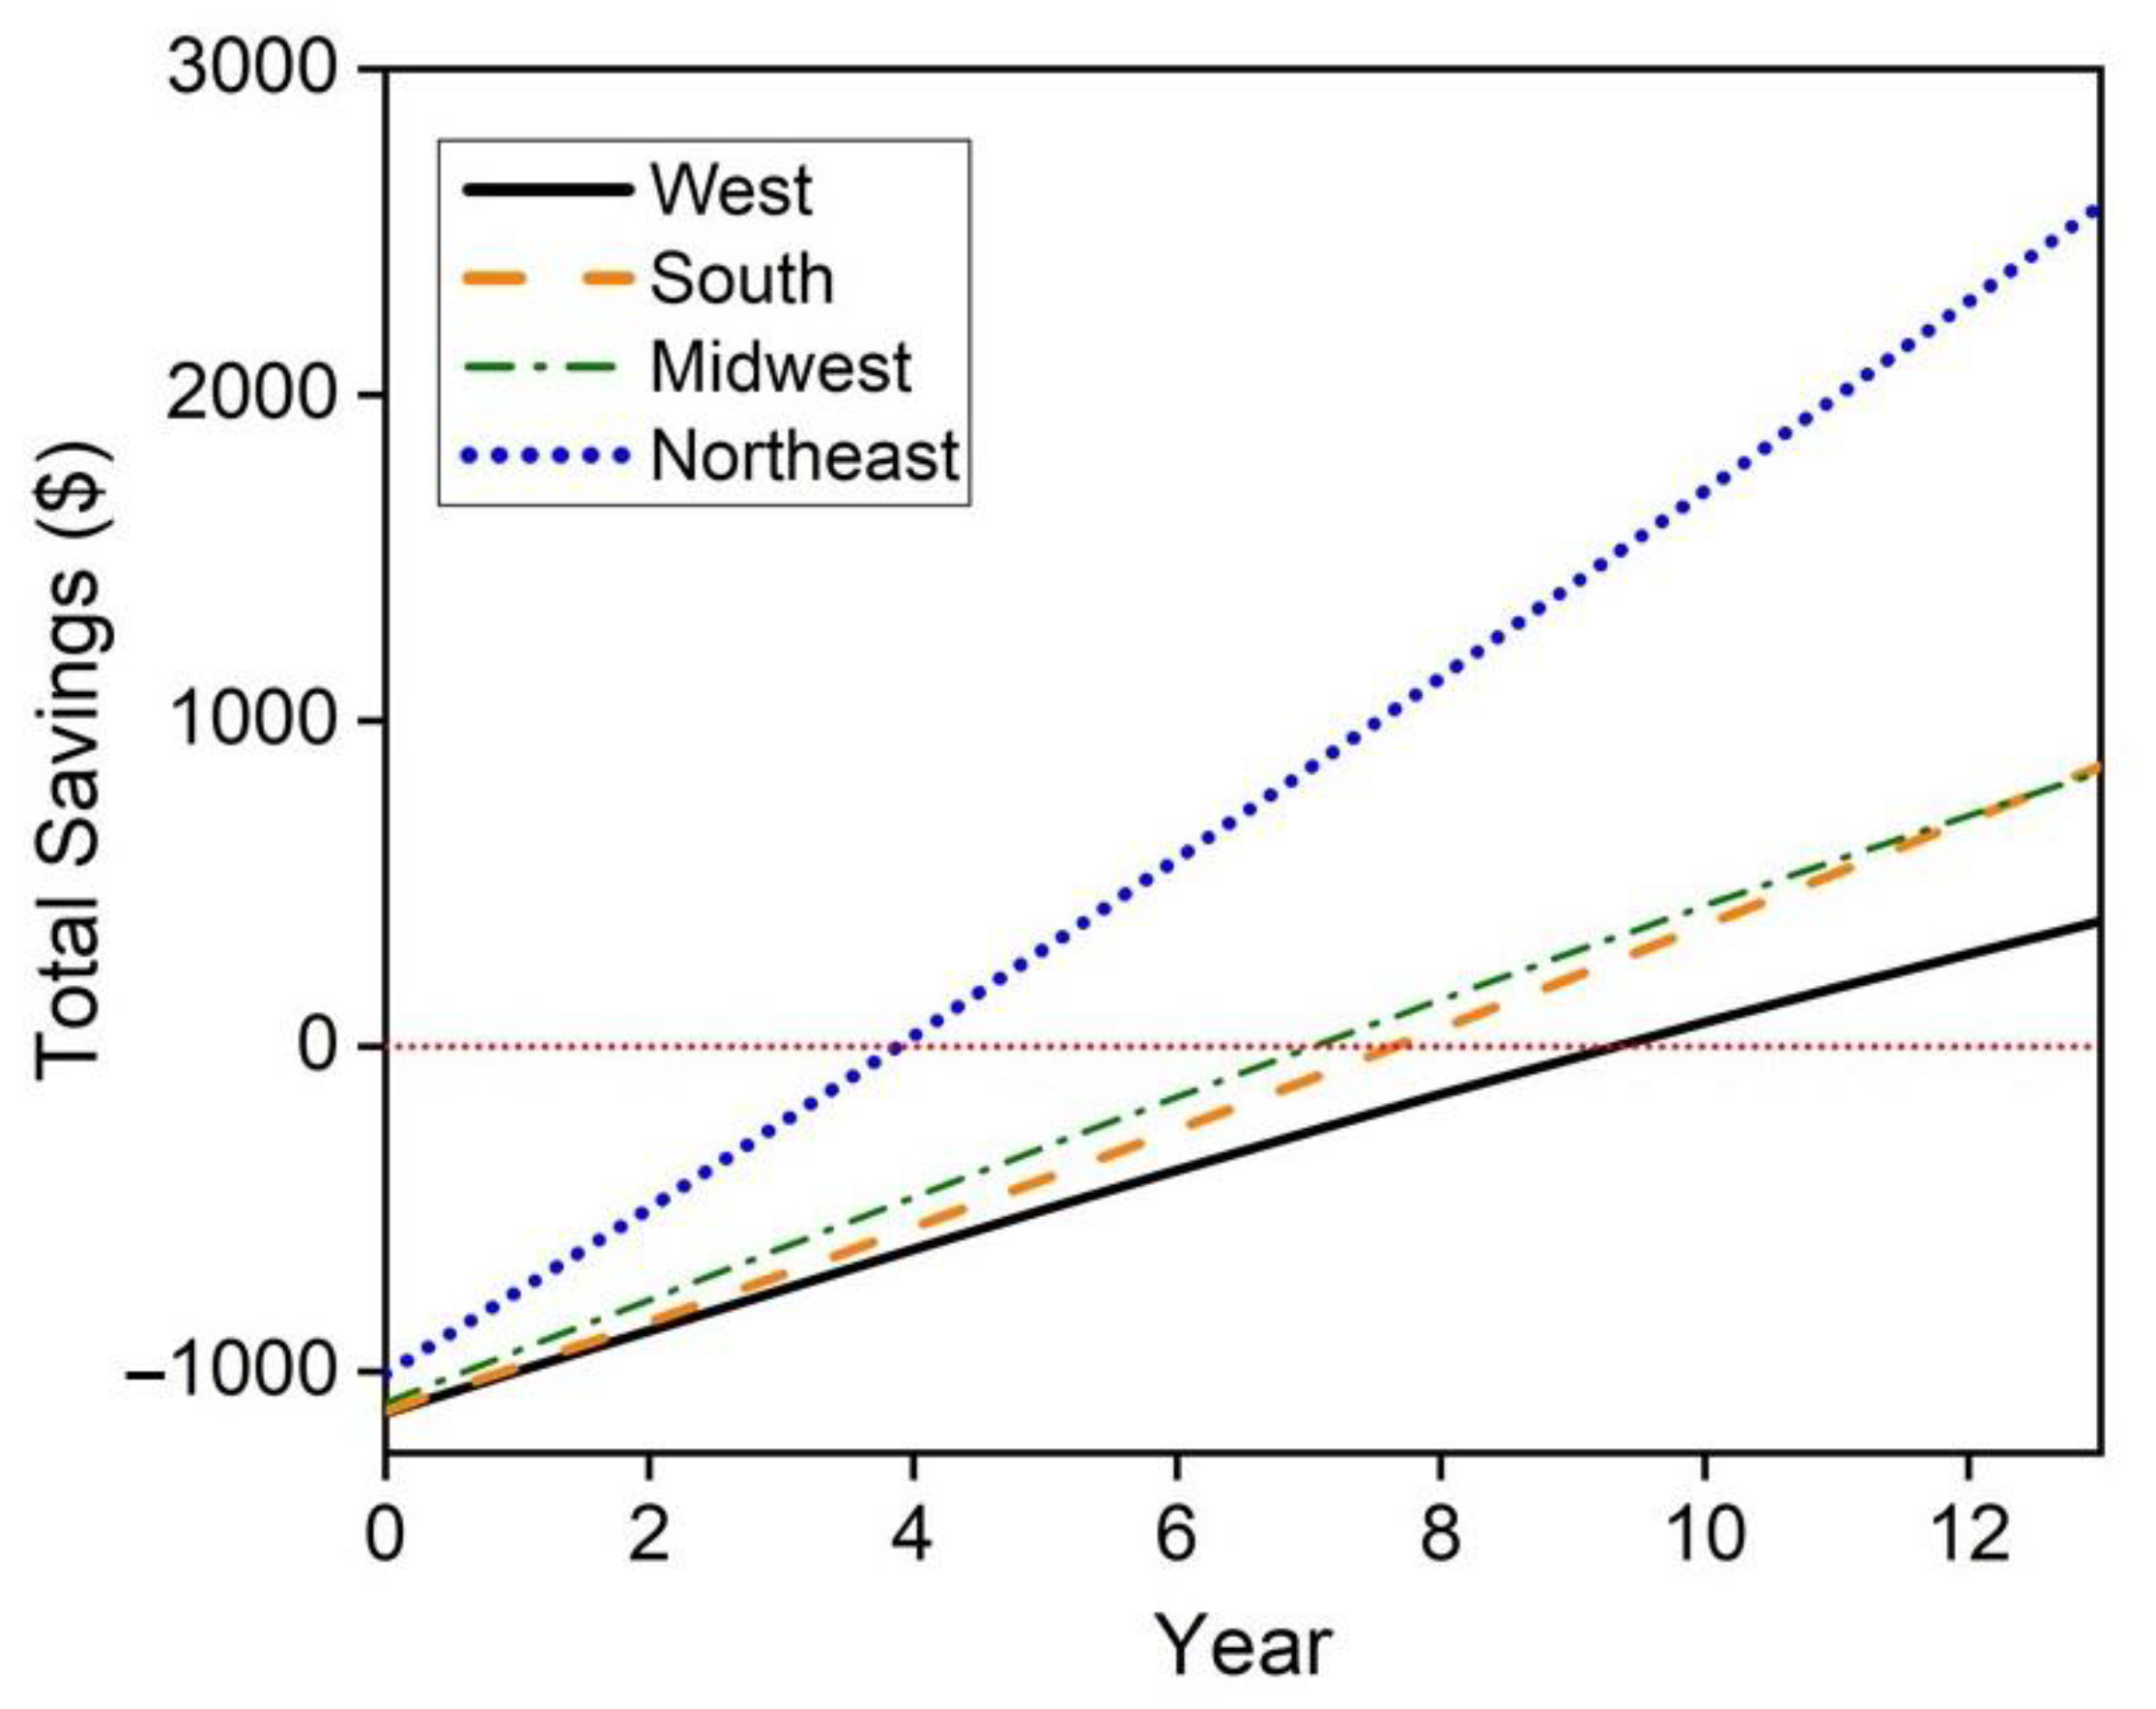
The hybrid hot water heater replacement of electric hot water heaters proves to be economically feasible in all regions of the United States with the longest payback period being less than 6 years in the South region. However, this may not be feasible depending on natural gas availability. A maximum cost savings of $10,868 in the Northeast region of the United States is achieved and a minimum cost savings of $2696 is achieved in the South. Replacement of natural gas hot water heaters with the hybrid system is less economically viable with payback periods spanning from approximately 4 years in the Northeast to between 9–10 years in the west. These savings only consider a 13 year lifetime, however the mCHP system may also achieve replacement cost savings if the FFC does not see noticeable degradation within this 13 year time period. Future work in this techno-economic analysis will consider these replacement savings and the degradation of the FFC throughout its lifetime.

Author Contributions

Conceptualization, R.J.M.; methodology, B.B.S. and R.J.M.; software, B.B.S. and J.E.; validation, R.J.M., B.B.S. and J.E.; formal analysis, B.B.S. and J.E.; investigation, B.B.S. and J.E.; resources, B.B.S. and J.E.; data curation, B.B.S. and J.E.; writing—original draft preparation, B.B.S. and J.E.; writing—review and editing, R.J.M., B.B.S. and J.E.; visualization, B.B.S. and J.E.; supervision, R.J.M.; project administration, R.J.M.; funding acquisition, R.J.M. All authors have read and agreed to the published version of the manuscript.

Funding

This research received no external funding.

Informed Consent Statement

Not appclicable.

Data Availability Statement

The data presented in this study are available in the article.

Conflicts of Interest

The authors declare no conflict of interest.

References

  1. Global Data. Combined Heat and Power Market, Update 2019—Global Market Size, Segmentation, Regulations, and Key Country Analysis to 2025. 2019. Available online: https://store.globaldata.com/report/gdpe1105mar--combined-heat-and-power-market-update-2019-global-market-size-segmentation-regulations-and-key-country-analysis-to-2025/ (accessed on 10 June 2021).
  2. U.S. Department of Energy. Combined Heat and Power and Microgrid Installation Databases. Available online: https://doe.icfwebservices.com/chp (accessed on 10 June 2021).
  3. U.S. Department of Energy. Office of Energy Efficiency & Renewable Energy Overview of CHP technologies (DOE CHP Technology Fact Sheet Series)—Fact Sheet. 2017. Available online: https://www.energy.gov/eere/amo/combined-heat-and-power-basics (accessed on 10 June 2021).
  4. Giarola, S.; Forte, O.; Lanzini, A.; Gandiglio, M.; Santarelli, M.; Hawkes, A. Techno-economic assessment of biogas-fed solid oxide fuel cell combined heat and power system at industrial scale. Appl. Energy 2018, 211, 689–704. [Google Scholar] [CrossRef] [Green Version]
  5. Riley, D.M.; Tian, J.; Güngör-Demirci, G.; Phelan, P.; Rene Villalobos, J.; Milcarek, R.J. Techno-economic assessment of chp systems in wastewater treatment plants. Environments 2020, 7, 74. [Google Scholar] [CrossRef]
  6. Maghanki, M.M.; Ghobadian, B.; Najafi, G.; Galogah, R.J. Micro combined heat and power (MCHP) technologies and applications. Renew. Sustain. Energy Rev. 2013, 28, 510–524. [Google Scholar] [CrossRef]
  7. Dentice d’Accadia, M.; Sasso, M.; Sibilio, S.; Vanoli, L. Micro-combined heat and power in residential and light commercial applications. Appl. Therm. Eng. 2003, 23, 1247–1259. [Google Scholar] [CrossRef]
  8. Ellamla, H.R.; Staffell, I.; Bujlo, P.; Pollet, B.G.; Pasupathi, S. Current status of fuel cell based combined heat and power systems for residential sector. J. Power Sources 2015, 293, 312–328. [Google Scholar] [CrossRef]
  9. De Paepe, M.; D’Herdt, P.; Mertens, D. Micro-CHP systems for residential applications. Energy Convers. Manag. 2006, 47, 3435–3446. [Google Scholar] [CrossRef]
  10. Pehnt, M.; Cames, M.; Fischer, C.; Praetorius, B.; Schneider, L.; Schumacher, K.; Jan-Peter, V. Micro Cogeneration: Towards Decentralized Energy Systems, 1st ed.; Springer: Berlin/Heidelberg, Germany, 2006; ISBN 9783540255826. [Google Scholar]
  11. Dong, L.; Liu, H.; Riffat, S. Development of small-scale and micro-scale biomass-fuelled CHP systems—A literature review. Appl. Therm. Eng. 2009, 29, 2119–2126. [Google Scholar] [CrossRef] [Green Version]
  12. Milcarek, R.J.; Ahn, J.; Zhang, J. Review and analysis of fuel cell-based, micro-cogeneration for residential applications: Current state and future opportunities. Sci. Technol. Built Environ. 2017, 23, 1224–1243. [Google Scholar] [CrossRef]
  13. Yoda, M.; Inoue, S.; Takuwa, Y.; Yasuhara, K.; Suzuki, M. Development and commercialization of new residential SOFC CHP system. ECS Trans. 2017, 78, 125–132. [Google Scholar] [CrossRef]
  14. Nakao, T.; Inoue, S.; Uenoyama, S.; Takuwa, Y.; Suzuki, M. Progress of SOFC residential CHP system: Over 50,000 units market experience of Osaka Gas. ECS Trans. 2019, 91, 43–49. [Google Scholar] [CrossRef]
  15. O’Hayre, R.; Cha, S.; Colella, W.; Prinz, F.B. Fuel Cell Fundamentals, 3rd ed.; Wiley: Hoboken, NJ, USA, 2016. [Google Scholar]
  16. Matsuzaki, Y.; Yasuda, I. Electrochemical oxidation of H2 and CO in a H2-HO-CO-CO system at the interface of a Ni-YSZ cermet electrode and YSZ electrolyte. J. Electrochem. Soc. 2000, 147, 1630. [Google Scholar] [CrossRef]
  17. Horiuchi, M.; Suganuma, S.; Watanabe, M. Electrochemical power generation directly from combustion flame of gases, liquids, and solids. J. Electrochem. Soc. 2004, 151, A1402. [Google Scholar] [CrossRef]
  18. Vogler, M.; Barzan, D.; Kronemayer, H.; Schulz, C.; Horiuchi, M.; Suganuma, S.; Tokutake, Y.; Warnatz, J.; Bessler, W.G.W.G. Direct-flame solid-oxide fuel cell (DFFC): A thermally self-sustained, air self-breathing, hydrocarbon-operated SOFC system in a simple, no-chamber setup. ECS Trans. 2007, 7, 555–564. [Google Scholar] [CrossRef]
  19. Kronemayer, H.; Barzan, D.; Horiuchi, M.; Suganuma, S.; Tokutake, Y.; Schulz, C.; Bessler, W.G. A direct-flame solid oxide fuel cell (DFFC) operated on methane, propane, and butane. J. Power Sources 2007, 166, 120–126. [Google Scholar] [CrossRef]
  20. Tucker, M.C.; Ying, A.S. Metal-supported solid oxide fuel cells operated in direct-flame configuration. Int. J. Hydrogen Energy 2017, 42, 24426–24434. [Google Scholar] [CrossRef] [Green Version]
  21. Milcarek, R.J.; Wang, K.; Falkenstein-Smith, R.L.; Ahn, J. Micro-tubular flame-assisted fuel cells for micro-combined heat and power systems. J. Power Sources 2016, 306, 148–151. [Google Scholar] [CrossRef] [Green Version]
  22. Milcarek, R.J.; Garrett, M.J.; Ahn, J. Micro-tubular flame-assisted fuel cell stacks. Int. J. Hydrogen Energy 2016, 41, 21489–21496. [Google Scholar] [CrossRef] [Green Version]
  23. Sun, L.; Hao, Y.; Zhang, C.; Ran, R.; Shao, Z. Coking-free direct-methanol-flame fuel cell with traditional nickel-cermet anode. Int. J. Hydrogen Energy 2010, 35, 7971–7981. [Google Scholar] [CrossRef]
  24. Skabelund, B.B.; Nakamura, H.; Tezuka, T.; Maruta, K.; Ahn, J.; Milcarek, R.J. Impact of low concentration hydrocarbons in natural gas on thermal partial oxidation in a micro-flow reactor for solid oxide fuel cell applications. J. Power Sources 2020, 477, 229007. [Google Scholar] [CrossRef]
  25. Milcarek, R.J.; Nakamura, H.; Tezuka, T.; Maruta, K.; Ahn, J. Investigation of microcombustion reforming of ethane/air and micro-tubular solid oxide fuel cells. J. Power Sources 2020, 450, 227606. [Google Scholar] [CrossRef]
  26. Milcarek, R.J.; Nakamura, H.; Tezuka, T.; Maruta, K.; Ahn, J. Microcombustion for micro-tubular flame-assisted fuel cell power and heat cogeneration. J. Power Sources 2019, 413, 191–197. [Google Scholar] [CrossRef]
  27. Milcarek, R.J.; Ahn, J. Micro-tubular flame-assisted fuel cells running methane, propane and butane: On soot, efficiency and power density. Energy 2019, 169, 776–782. [Google Scholar] [CrossRef]
  28. Alston, T.; Kendall, K.; Palin, M.; Prica, M.; Windibank, P. A 1000-cell SOFC reactor for domestic cogeneration. J. Power Sources 1998, 71, 271–274. [Google Scholar] [CrossRef]
  29. Wang, Y.; Shi, Y.; Ni, M.; Cai, N. A micro tri-generation system based on direct flame fuel cells for residential applications. Int. J. Hydrogen Energy 2014, 39, 5996–6005. [Google Scholar] [CrossRef]
  30. Zhu, X.; Wei, B.; Lü, Z.; Yang, L.; Huang, X.; Zhang, Y.; Liu, M. A direct flame solid oxide fuel cell for potential combined heat and power generation. Int. J. Hydrogen Energy 2012, 37, 8621–8629. [Google Scholar] [CrossRef]
  31. Zeng, H.; Wang, Y.; Shi, Y.; Cai, N. Biogas-fueled flame fuel cell for micro-combined heat and power system. Energy Convers. Manag. 2017, 148, 701–707. [Google Scholar] [CrossRef]
  32. Wang, Y.Y.; Shi, Y.; Luo, Y.; Cai, N.; Wang, Y.Y. Dynamic analysis of a micro CHP system based on flame fuel cells. Energy Convers. Manag. 2018, 163, 268–277. [Google Scholar] [CrossRef]
  33. Wang, Y.; Shi, Y.; Cao, T.; Zeng, H.; Cai, N.; Ye, X.; Wang, S. A flame fuel cell stack powered by a porous media combustor. Int. J. Hydrogen Energy 2018, 43, 22595–22603. [Google Scholar] [CrossRef]
  34. Wang, Y.; Zeng, H.; Cao, T.; Shi, Y.; Cai, N.; Ye, X.; Wang, S. Start-up and operation characteristics of a flame fuel cell unit. Appl. Energy 2016, 178, 415–421. [Google Scholar] [CrossRef]
  35. Milcarek, R.J.; DeBiase, V.P.; Ahn, J. Investigation of startup, performance and cycling of a residential furnace integrated with micro-tubular flame-assisted fuel cells for micro-combined heat and power. Energy 2020, 196, 117148. [Google Scholar] [CrossRef]
  36. U.S. Energy Information Administration (EIA). Natural Gas—Heat Content of Natural Gas Consumed. Available online: https://www.eia.gov/dnav/ng/ng_cons_heat_a_EPG0_VGTH_btucf_a.htm (accessed on 5 August 2021).
  37. Turns, S.R. An Introduction to Combustion: Concepts and Applications, 3rd ed.; McGraw-Hill: New York, NY, USA, 2012; ISBN 9780073380193. [Google Scholar]
  38. Gordon, S.; McBride, B.J. Computer Program for Calculation of Complex Chemical Equilibrium Compositions and Applications: Part 1: Analysis; National Aeronautics and Space Administration: Cleveland, OH, USA, 1994.
  39. McBride, B.J.; Zehe, M.J.; Gordon, S. NASA Glenn Coefficients for Calculating Thermodynamic Properties of Individual Species; National Aeronautics and Space Administration: Cleveland, OH, USA, 2002.
  40. Zehe, M.J.; Gordon, S.; McBride, B.J. CAP: A Computer Code for Generating Tabular Thermodynamic Functions from NASA Lewis Coefficients; National Aeronautics and Space Administration: Cleveland, OH, USA, 2002.
  41. U.S. Department of Energy; Office of Energy Efficiency & Renewable Energy. Estimating Costs and Efficiency of Storage, Demand, and Heat Pump Water Heaters. Available online: https://www.energy.gov/energysaver/estimating-costs-and-efficiency-storage-demand-and-heat-pump-water-heaters (accessed on 25 August 2021).
  42. U.S. Energy Information Administration (EIA). Updated Buildings Sector Appliance and Equipment costs and Efficiencies; U.S. Department of Energy: Washington, DC, USA, 2018.
  43. U.S. Department of Energy; Office of Energy Efficiency & Renewable Energy. Energy Conservation Program for Consumer Products and Certain Commercial and Industrial Equipment: Test Procedures for Residential and Commercial Water Heaters; U.S. Department of Energy: Washington, DC, USA, 2014.
  44. U.S. Energy Information Administration (EIA). Residential Demand Module; U.S. Department of Energy: Washington, DC, USA, 2021.
  45. U.S. Energy Information Administration (EIA). Electric Sales, Revenue, and Average Price. Available online: https://www.eia.gov/electricity/sales_revenue_price/ (accessed on 2 September 2021).
  46. U.S. Energy Information Administration (EIA). Natural Gas Prices. Available online: https://www.eia.gov/dnav/ng/ng_pri_sum_a_EPG0_PRS_DMcf_a.htm (accessed on 2 September 2021).
  47. U.S. Energy Information Administration (EIA). Use of Energy Explained: Energy Use in Homes. Available online: https://www.eia.gov/energyexplained/use-of-energy/homes.php (accessed on 2 September 2021).
  48. CPI Inflation Calculator. Available online: https://www.in2013dollars.com/inflation-rate-in-2019 (accessed on 2 September 2021).
  49. Statista. Average Number of People per Household in the United States from 1960 to 2020. Available online: https://www.statista.com/statistics/183648/average-size-of-households-in-the-us/ (accessed on 27 October 2021).
  50. McNeil, G. Fact Sheet: CHP as a Boiler Replacement Opportunity; U.S. Environmental Protection Agency: Washington, DC, USA, 2013. Available online: https://www.epa.gov/chp/fact-sheet-chp-boiler-replacement-opportunity (accessed on 27 October 2021).
  51. Dubey, A.K.; Tezuka, T.; Hasegawa, S.; Nakamura, H.; Maruta, K. Study on sooting behavior of premixed C1-C4 n-alkanes/air flames using a micro flow reactor with a controlled temperature profile. Combust. Flame 2016, 174, 100–110. [Google Scholar] [CrossRef] [Green Version]
Figure 1. (A) The proposed model of the hybrid hot water heater with the FFCs integrated into the combustion chamber and (B) the 5 sections of the mCHP model.
Sustainability 13 13040 g001
Figure 2. The (A) adiabatic flame temperature and (B) the exhaust composition of the fuel-rich methane/air combustion as a function of fuel-rich equivalence ratio.
Sustainability 13 13040 g002
Figure 3. (A) The thermal, electrical, and combined heat and power (CHP) efficiencies of the hybrid hot water heater as a function of fuel-lean equivalence ratio with an operating voltage of 0.6, fuel-rich equivalence ratio of 0.8, and fuel utilization of 0.7 and (B) the temperature and mass flow rate as a function of fuel-lean equivalence ratio.
Sustainability 13 13040 g003
Figure 4. The thermal, electrical, and combined heat and power (CHP) efficiencies of the hybrid hot water heater as a function of fuel-rich equivalence ratio with an operating voltage of 0.6, fuel-lean equivalence ratio of 0.8, and fuel utilization of 0.7.
Sustainability 13 13040 g004
Figure 5. Thermal and electrical efficiencies of the hybrid hot water heater as a function of fuel-rich equivalence ratio at various fuel utilizations and operating voltages at fuel-lean equivalence ratio of 0.8., (A) ε t h when ε F U = 40–90%, operating voltage 0.6 V, (B) ε e when ε F U = 40–90%, operating voltage 0.6 V, (C) ε t h at 0.5–0.7 V, ε F U = 50%/80% and (D) ε e at 0.5–0.7 V, ε F U = 50%/80%.
Sustainability 13 13040 g005
Figure 6. Total Savings vs. Year of Operation for mCHP Water Heater replacement of electric water heater.
Sustainability 13 13040 g006
Figure 7. Total Savings vs. Year of Operation for mCHP Water Heater replacement of natural gas water heater.
Sustainability 13 13040 g007
Table 1. Mass flow rates of CH4 and air at various fuel-rich equivalence ratios.
Equivalence Ratio
(Fuel-Rich)
CH4
(g/s)
Air
(g/s)
CH4/Air Flow Rate
(g/s)
ΦR = 1.10.1993.1093.308
ΦR = 1.20.1992.8503.049
ΦR = 1.30.1992.6302.829
ΦR = 1.40.1992.4432.642
ΦR = 1.50.1992.2802.479
ΦR = 1.60.1992.1372.336
Table 2. Mass flow rates of CH4 and air at various fuel-lean equivalence ratios.
Equivalence Ratio
(Fuel-Lean)
CH4
(g/s)
Air
(g/s)
Total Flow Rate
(g/s)
ΦL = 0.700.1994.8855.084
ΦL = 0.750.1994.5594.758
ΦL = 0.800.1994.2754.474
ΦL = 0.850.1994.0234.222
ΦL = 0.900.1993.8003.999
ΦL = 0.950.1993.6003.799
Table 3. Mass flow rate of air that is sent to the cathode at various fuel-rich/fuel-lean conditions.
Equivalence RatioΦR = 1.1
(g/s)
ΦR = 1.2 (g/s)ΦR = 1.3 (g/s)ΦR = 1.4 (g/s)ΦR = 1.5 (g/s)ΦR = 1.6 (g/s)
ΦL = 0.701.7762.0352.2552.4432.6052.748
ΦL = 0.751.4511.7101.9292.1172.2802.422
ΦL = 0.801.1661.4251.6441.8321.9952.137
ΦL = 0.850.9141.1731.3931.5801.7431.886
ΦL = 0.900.6910.9501.1691.3571.5201.662
ΦL = 0.950.4910.7500.9691.1571.3201.462
Table 4. Electricity usage (calculated from [45]) and natural gas usage (calculated from [46]) 2019 average pricing based on census regions in the United States.
Electricity Usage Cost (USD/kWh)Natural Gas Usage Cost (USD/m3)
West0.1440.420
South0.1150.439
Midwest0.1250.295
Northeast0.1880.485
Table 5. Annual residential electricity usage (calculated from [45]) and natural gas usage (calculated from [46]) average increase rates from 2015 to 2019 for different regions in the United States.
Electricity Usage Cost Increase (%)Natural Gas Usage Cost Increase (%)
West0.8−3.2
South0.60.7
Midwest1.0−1.9
Northeast1.41.4
Table 6. Annual residential hot water usage for U.S. regions.
Water Heating Energy (kWh)
West3341.0
South3839.2
Midwest5246.0
Northeast5246.0
Table 7. Annual mass of water heated, mCHP natural gas consumption and electricity generation for different regions in the United States.
RegionWater Heated (kg)NGI (m3)EUG (kWh)
West61,783366.1504
South70,996420.7579
Midwest97,010574.8791
Northeast97,010574.8791
Table 8. The amount of heat that is left over to be sent to the water from the fuel-rich combustion.
Equivalence RatioΦR = 1.1 (Wth)ΦR = 1.2 (Wth)ΦR = 1.3 (Wth)ΦR = 1.4 (Wth)ΦR = 1.5 (Wth)ΦR = 1.6 (Wth)
ΦL = 0.703461.42586.61826.01175.4614.6126.4
ΦL = 0.753732.32857.52096.91446.3885.5397.3
ΦL = 0.803969.33094.52334.01683.41122.6634.4
ΦL = 0.854178.53303.72543.21892.61331.7843.5
ΦL = 0.904364.43489.62729.12078.51517.71029.5
ΦL = 0.954530.83656.02895.42244.81684.01195.8
Table 9. Power generated (W) by the FFCs as a function of fuel utilization at an operating voltage of 0.5 V.
Equivalence Ratio ε F . U . =   0.4   ( W ) ε F . U . =   0.5   ( W ) ε F . U . =   0.6   ( W ) ε F . U . =   0.7   ( W ) ε F . U . =   0.8   ( W ) ε F . U . =   0.9   ( W )
ΦR = 1.1181.7227.2272.6318.0363.4408.9
ΦR = 1.2319.2399.0478.8558.6638.4718.1
ΦR = 1.3440.4550.5660.6770.7880.8990.9
ΦR = 1.4545.1681.4817.7954.01090.31226.6
ΦR = 1.5636.1795.2954.21113.21272.31431.3
ΦR = 1.6715.8894.81073.71252.71431.61610.6
Table 10. Power generated (W) by the FFCs as a function of fuel utilization at an operating voltage of 0.6 V.
Equivalence Ratio ε F . U . =   0.4   ( W ) ε F . U . =   0.5   ( W ) ε F . U . =   0.6   ( W ) ε F . U . =   0.7   ( W ) ε F . U . =   0.8   ( W ) ε F . U . =   0.9   ( W )
ΦR = 1.1218.1272.6327.1381.6436.1490.7
ΦR = 1.2383.0478.8574.5670.3766.0861.8
ΦR = 1.3528.5660.6792.7924.81056.91189.0
ΦR = 1.4654.2817.7981.21144.81308.31471.9
ΦR = 1.5763.4954.21145.01335.91526.71717.6
ΦR = 1.6859.01073.71288.41503.21717.91932.7
Table 11. Power generated (W) by the FFCs as a function of fuel utilization at an operating voltage of 0.7 V.
Equivalence Ratio ε F . U . =   0.4   ( W ) ε F . U . =   0.5   ( W ) ε F . U . =   0.6   ( W ) ε F . U . =   0.7   ( W ) ε F . U . =   0.8   ( W ) ε F . U . =   0.9   ( W )
ΦR = 1.1254.4318.0381.6445.2508.8572.4
ΦR = 1.2446.8558.6670.3782.0893.71005.4
ΦR = 1.3616.5770.7924.81078.91233.11387.2
ΦR = 1.4763.2954.01144.81335.61526.41717.2
ΦR = 1.5890.61113.21335.91558.51781.22003.8
ΦR = 1.61002.11252.71503.21753.72004.22254.8
Table 12. Exhaust temperature after the fuel-lean combustor as a function of fuel-rich and fuel-lean equivalence ratios at an operating voltage of 0.6 V and fuel utilization of 0.5.
Equivalence RatioΦR = 1.1 (°C)ΦR = 1.2 (°C)ΦR = 1.3 (°C)ΦR = 1.4 (°C)ΦR = 1.5 (°C)ΦR = 1.6 (°C)
ΦL = 0.701554.01549.41545.41541.71538.41535.5
ΦL = 0.751636.01631.21626.91623.11619.61616.5
ΦL = 0.801715.81710.81706.31702.21698.61695.3
ΦL = 0.851793.61788.31783.51779.31775.51772.1
ΦL = 0.901869.41863.81858.91854.51850.51846.9
ΦL = 0.951943.21937.41932.31927.71923.61919.9
Table 13. Exhaust temperature after the fuel-lean combustor as a function of fuel-rich and fuel-lean equivalence ratios at an operating voltage of 0.6 V and fuel utilization of 0.7.
Equivalence RatioΦR = 1.1 (°C)ΦR = 1.2 (°C)ΦR = 1.3 (°C)ΦR = 1.4 (°C)ΦR = 1.5 (°C)ΦR = 1.6 (°C)
ΦL = 0.701545.31534.21524.31515.71508.11501.3
ΦL = 0.751626.81615.11604.71595.61587.61580.5
ΦL = 0.801706.21693.91683.01673.41665.01657.6
ΦL = 0.851783.51770.61759.21749.21740.41732.6
ΦL = 0.901858.91845.41833.51823.01813.91805.7
ΦL = 0.951932.31918.31905.91895.01885.51877.0
Table 14. Heat transferred to the hot water via a heat exchanger as a function of fuel-rich and fuel-lean equivalence ratios at an operating voltage of 0.6 V and fuel utilization of 0.7.
Equivalence RatioΦR = 1.1 (Wth)ΦR = 1.2 (Wth)ΦR = 1.3 (Wth)ΦR = 1.4 (Wth)ΦR = 1.5 (Wth)ΦR = 1.6 (Wth)
ΦL = 0.709532.29500.89472.69447.19424.29403.5
ΦL = 0.759532.69501.29472.99447.59424.69403.8
ΦL = 0.809532.99501.49473.29447.89424.89404.1
ΦL = 0.859533.19501.79473.59448.09425.19404.4
ΦL = 0.909533.49501.99473.79448.39425.49404.6
ΦL = 0.959533.69502.19473.99448.59425.69404.8
Table 15. Net present cost of water heating over 13 years (electric).
RegionLifetime Costs ($)
West7665
South7026
Midwest10,256
Northeast15,360
Table 16. Net present cost of water heating over 13 years (natural gas).
RegionLifetime Costs ($)
West4067
South5188
Midwest4478
Northeast7074
Table 17. Net present cost of mCHP water heater over 13 years.
RegionCosts ($)
West3684
South4330
Midwest3635
Northeast4492
Publisher’s Note: MDPI stays neutral with regard to jurisdictional claims in published maps and institutional affiliations.

