
Evaluating Green Technology Strategies for the Sustainable Development of Solar Power Projects: Evidence from Pakistan

 ,
, 
 , ,
, ,  and
and
Abstract
1. Introduction
2. Literature Review
3. Research Methodology
3.1. Formulation of Hypotheses
3.1.1. NPV Techniques and Financial Performance
3.1.2. Internal Rate of Return and Financial Performance
3.1.3. Payback Period and Financial Performance
3.1.4. Profitability Index and Financial Performance
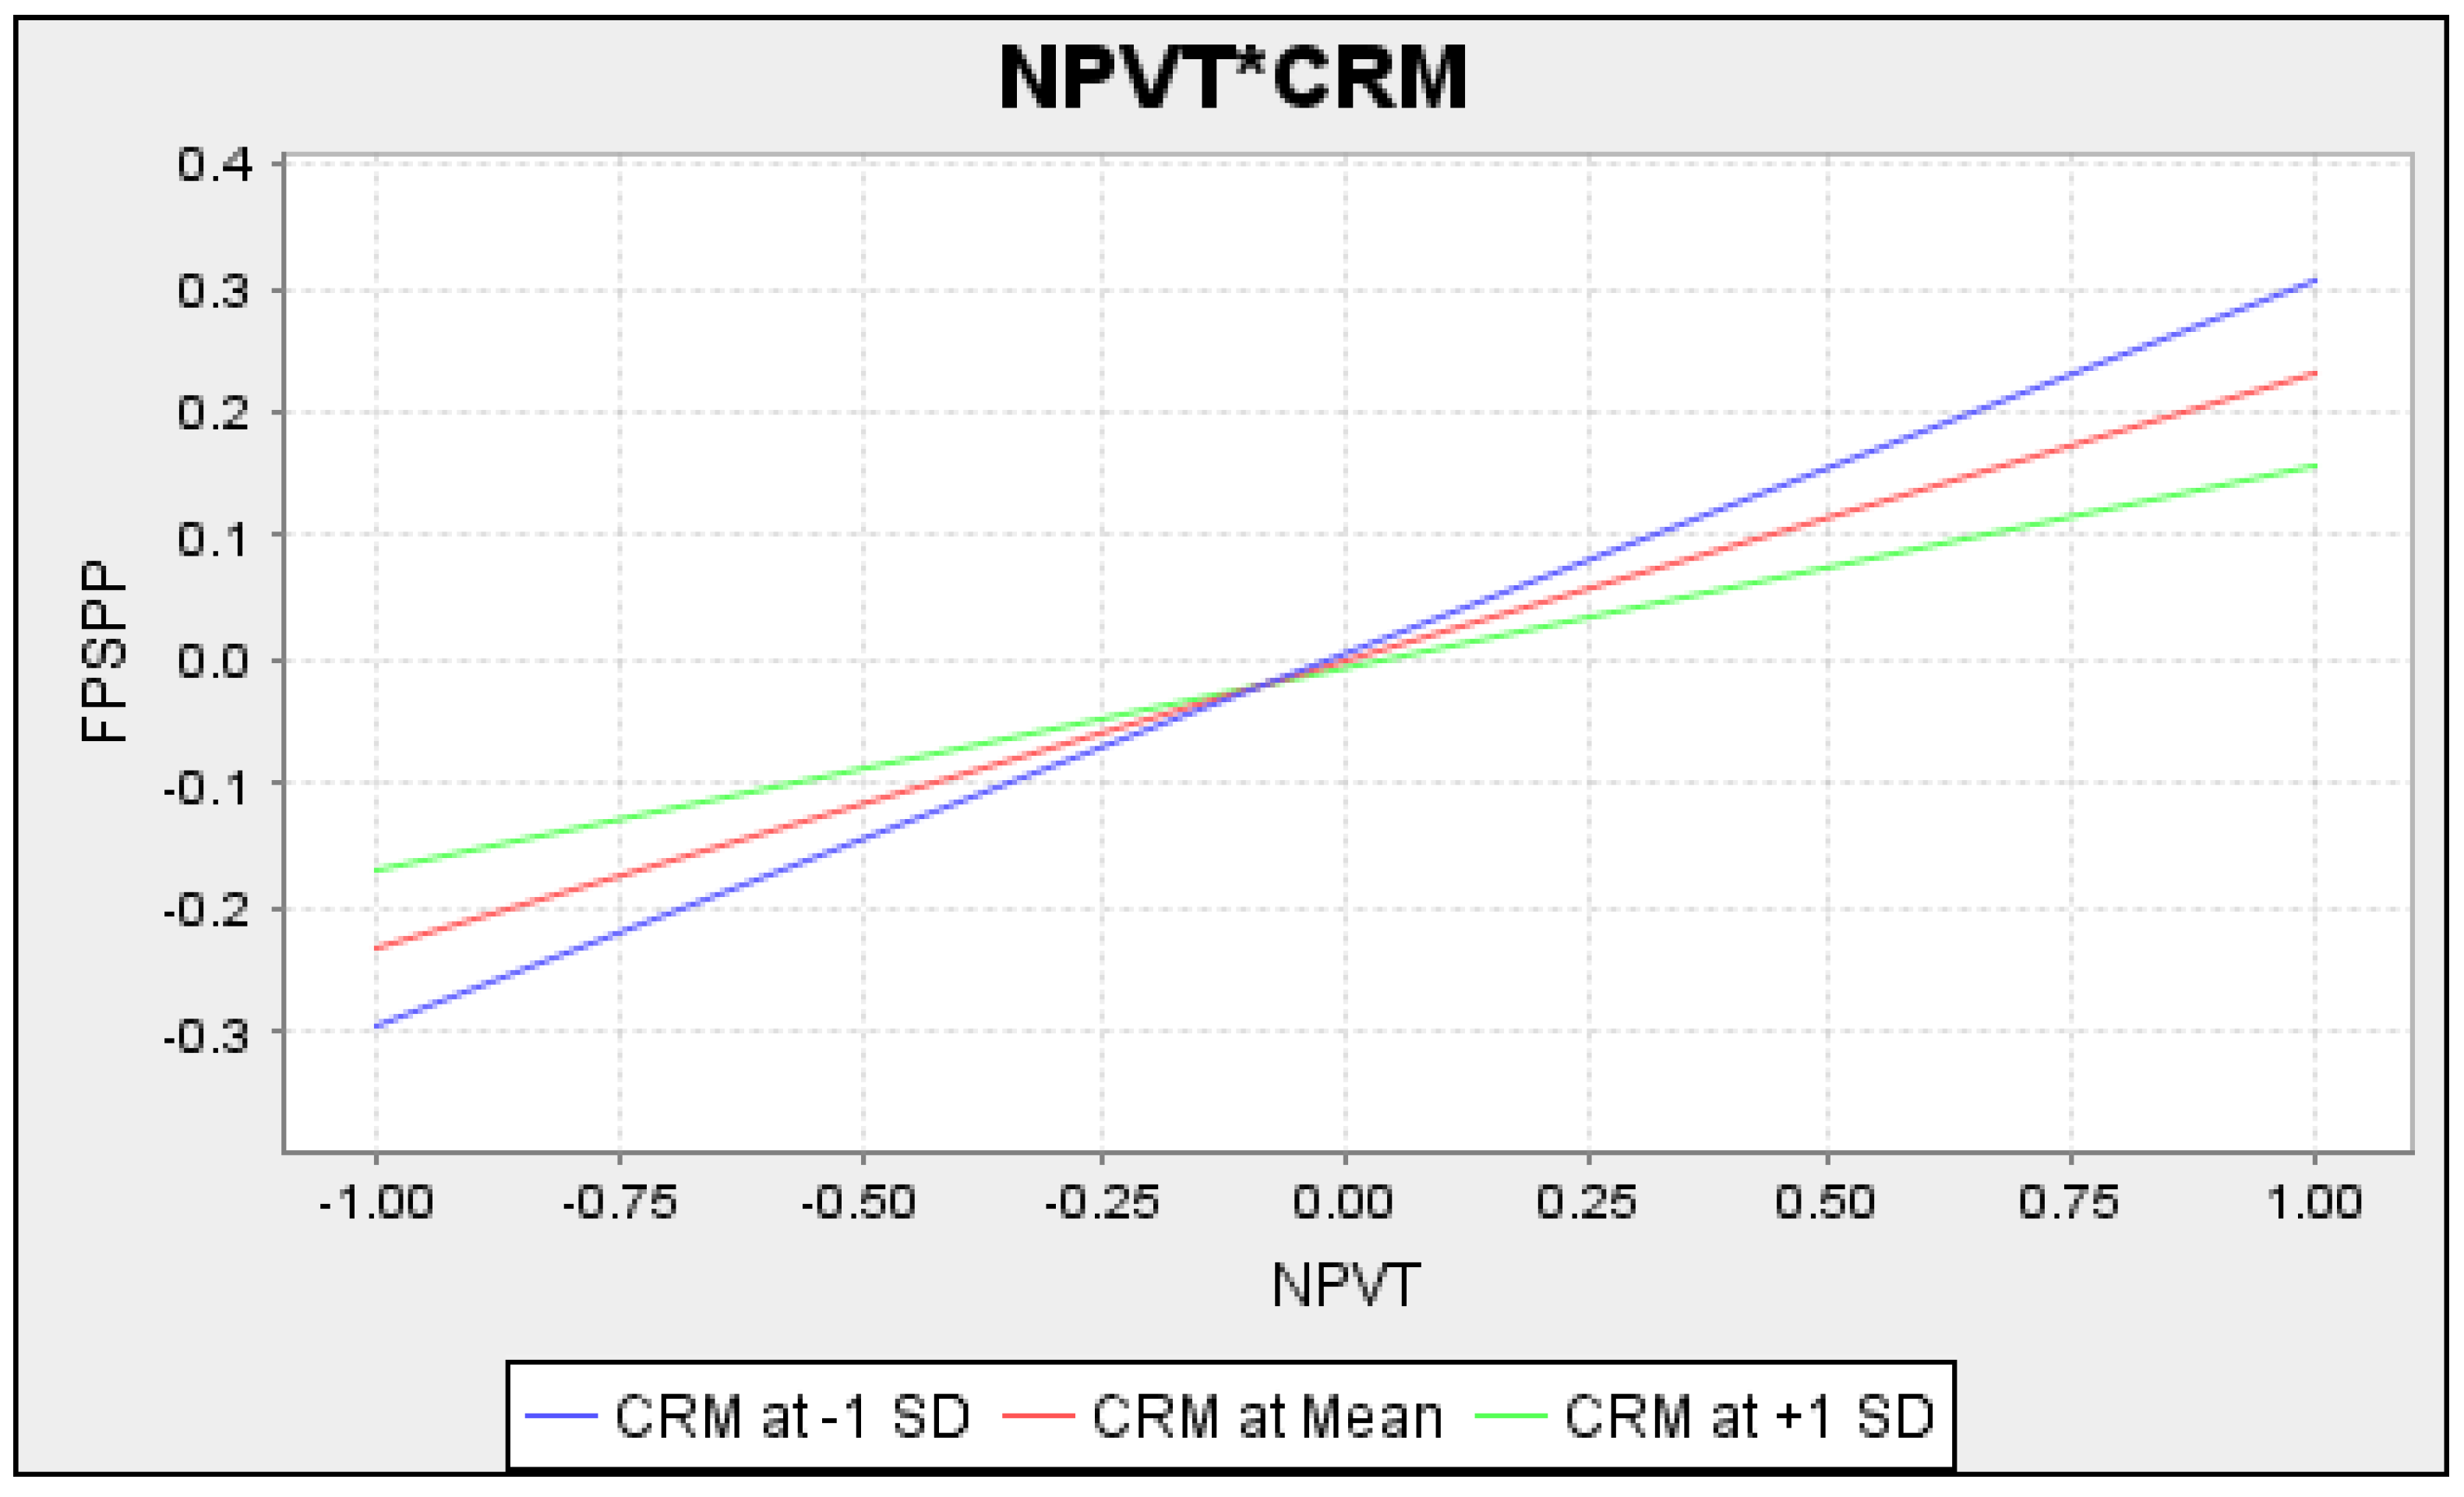
3.1.5. Moderating Role of Cost and Riskiness of the Solar Project between NPV and Financial Performance
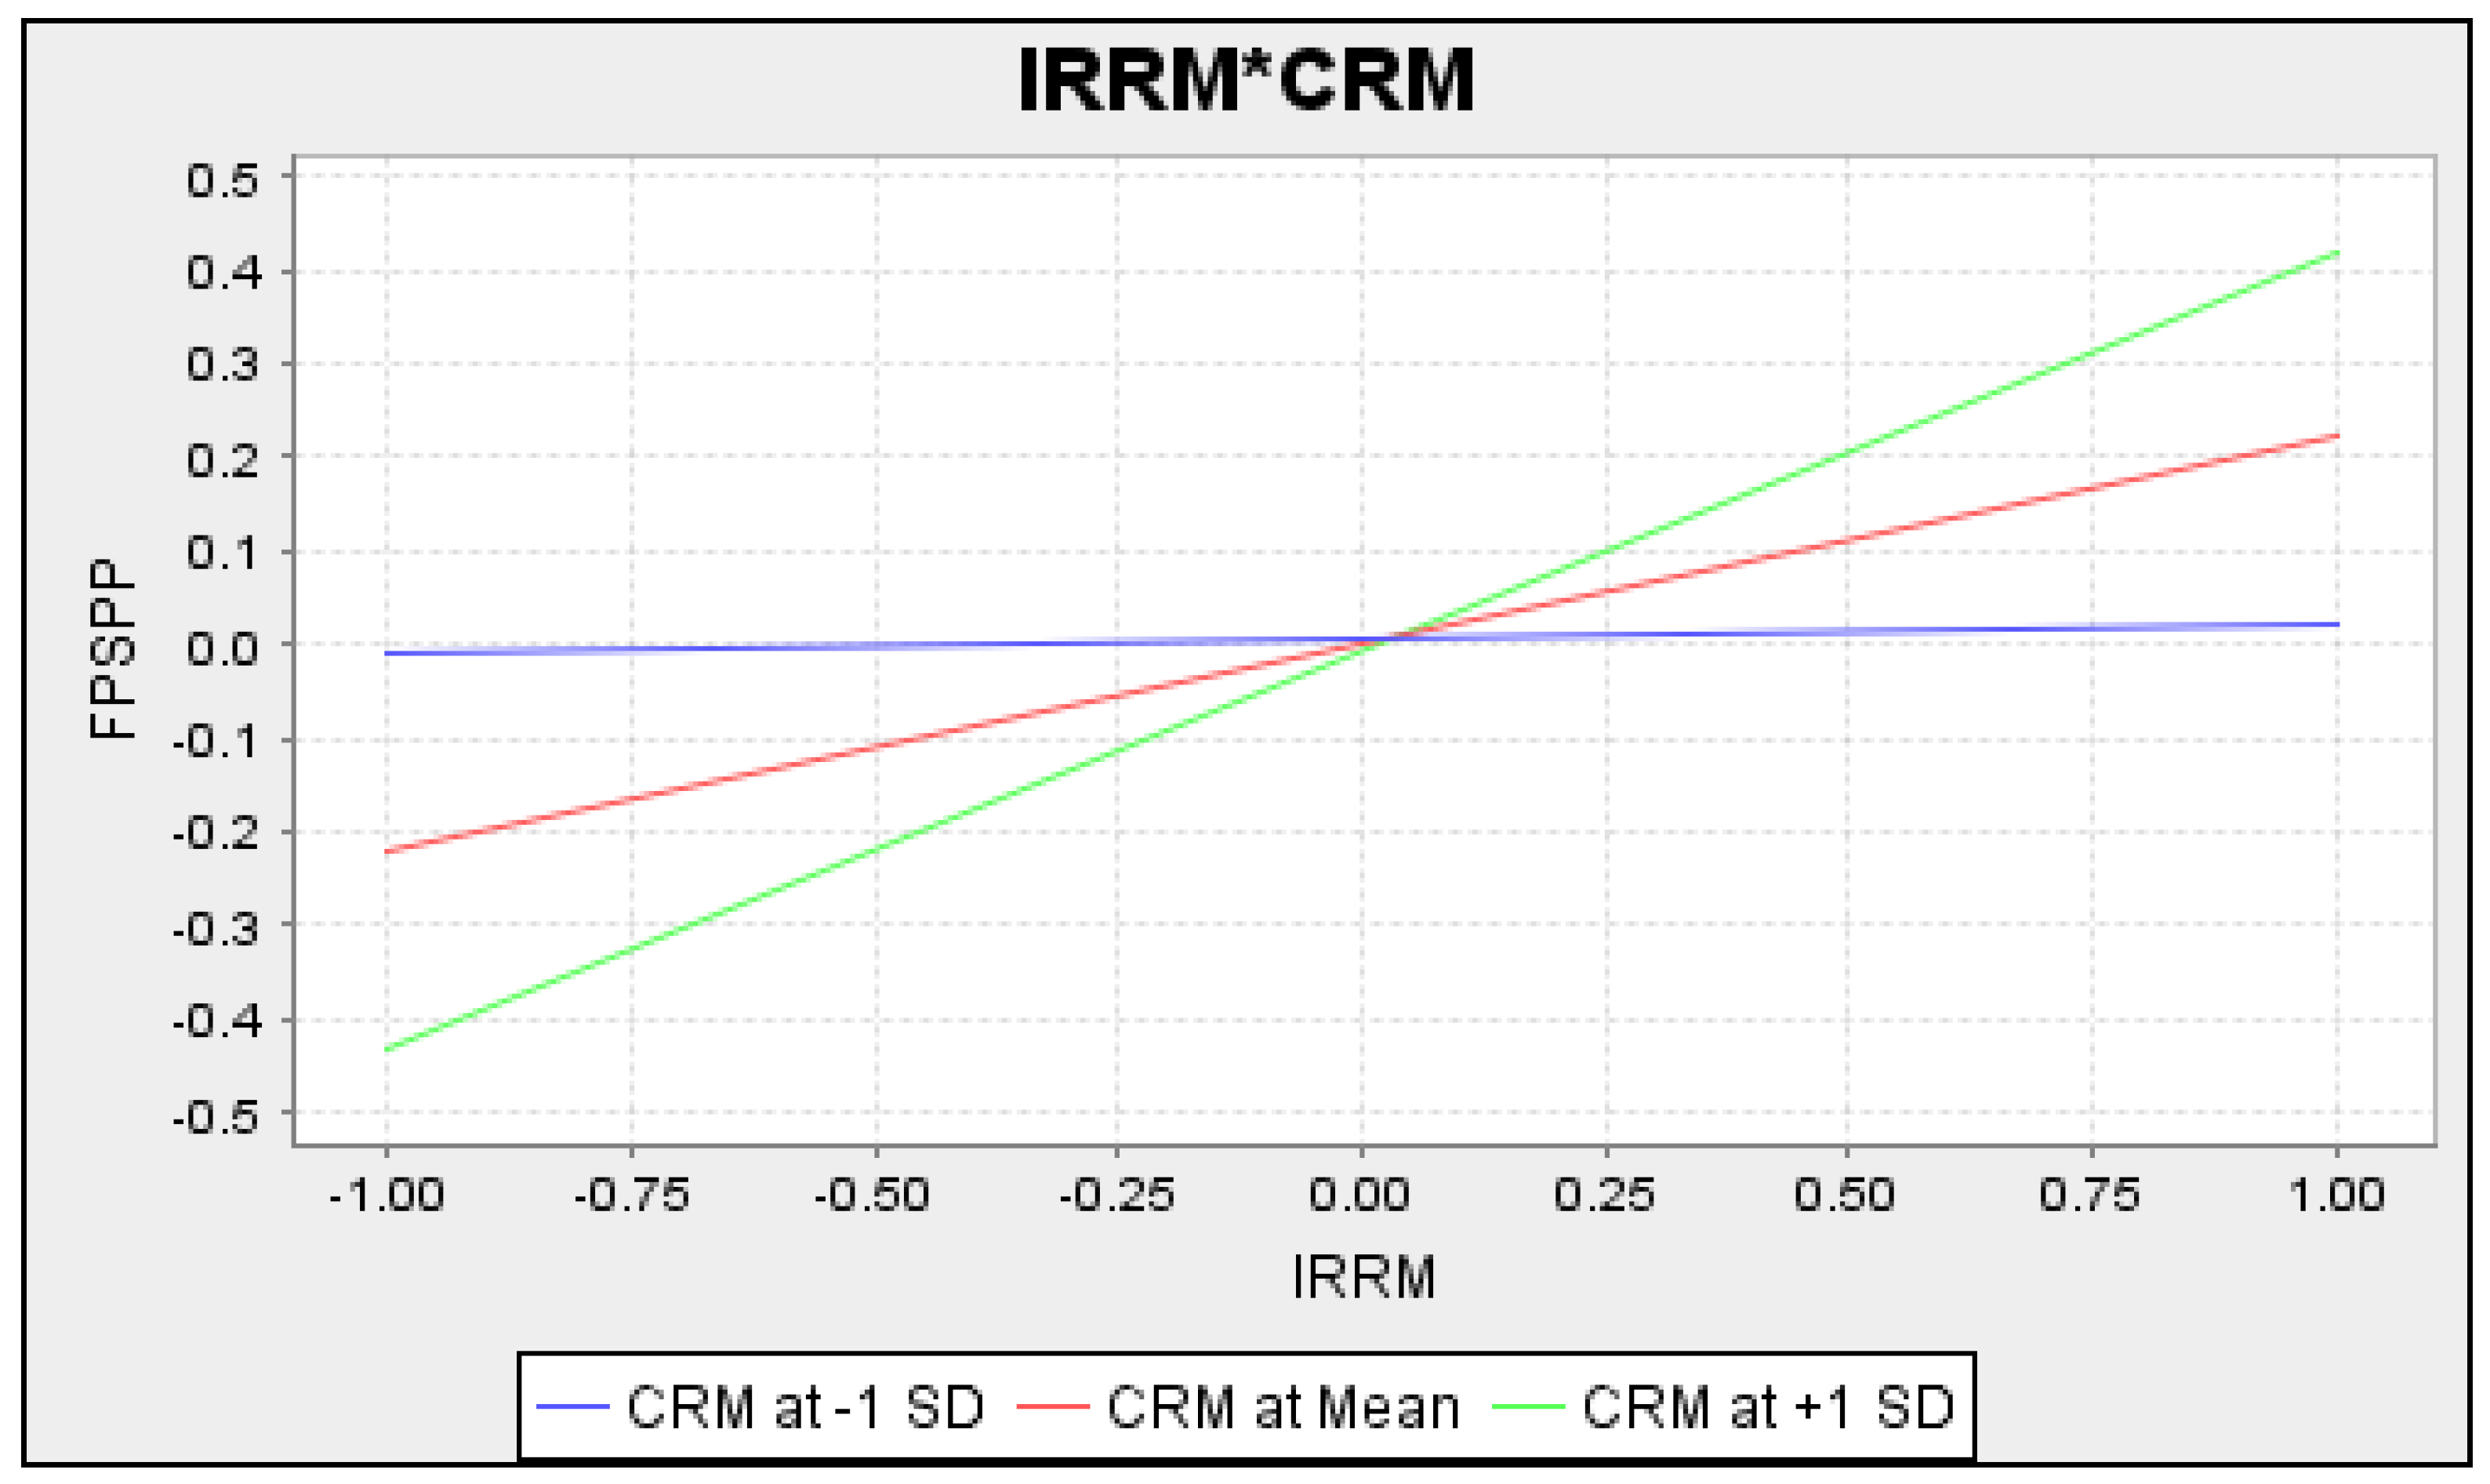
3.1.6. Moderating Role of Cost and Riskiness of the Solar Project between IRR and Financial Performance
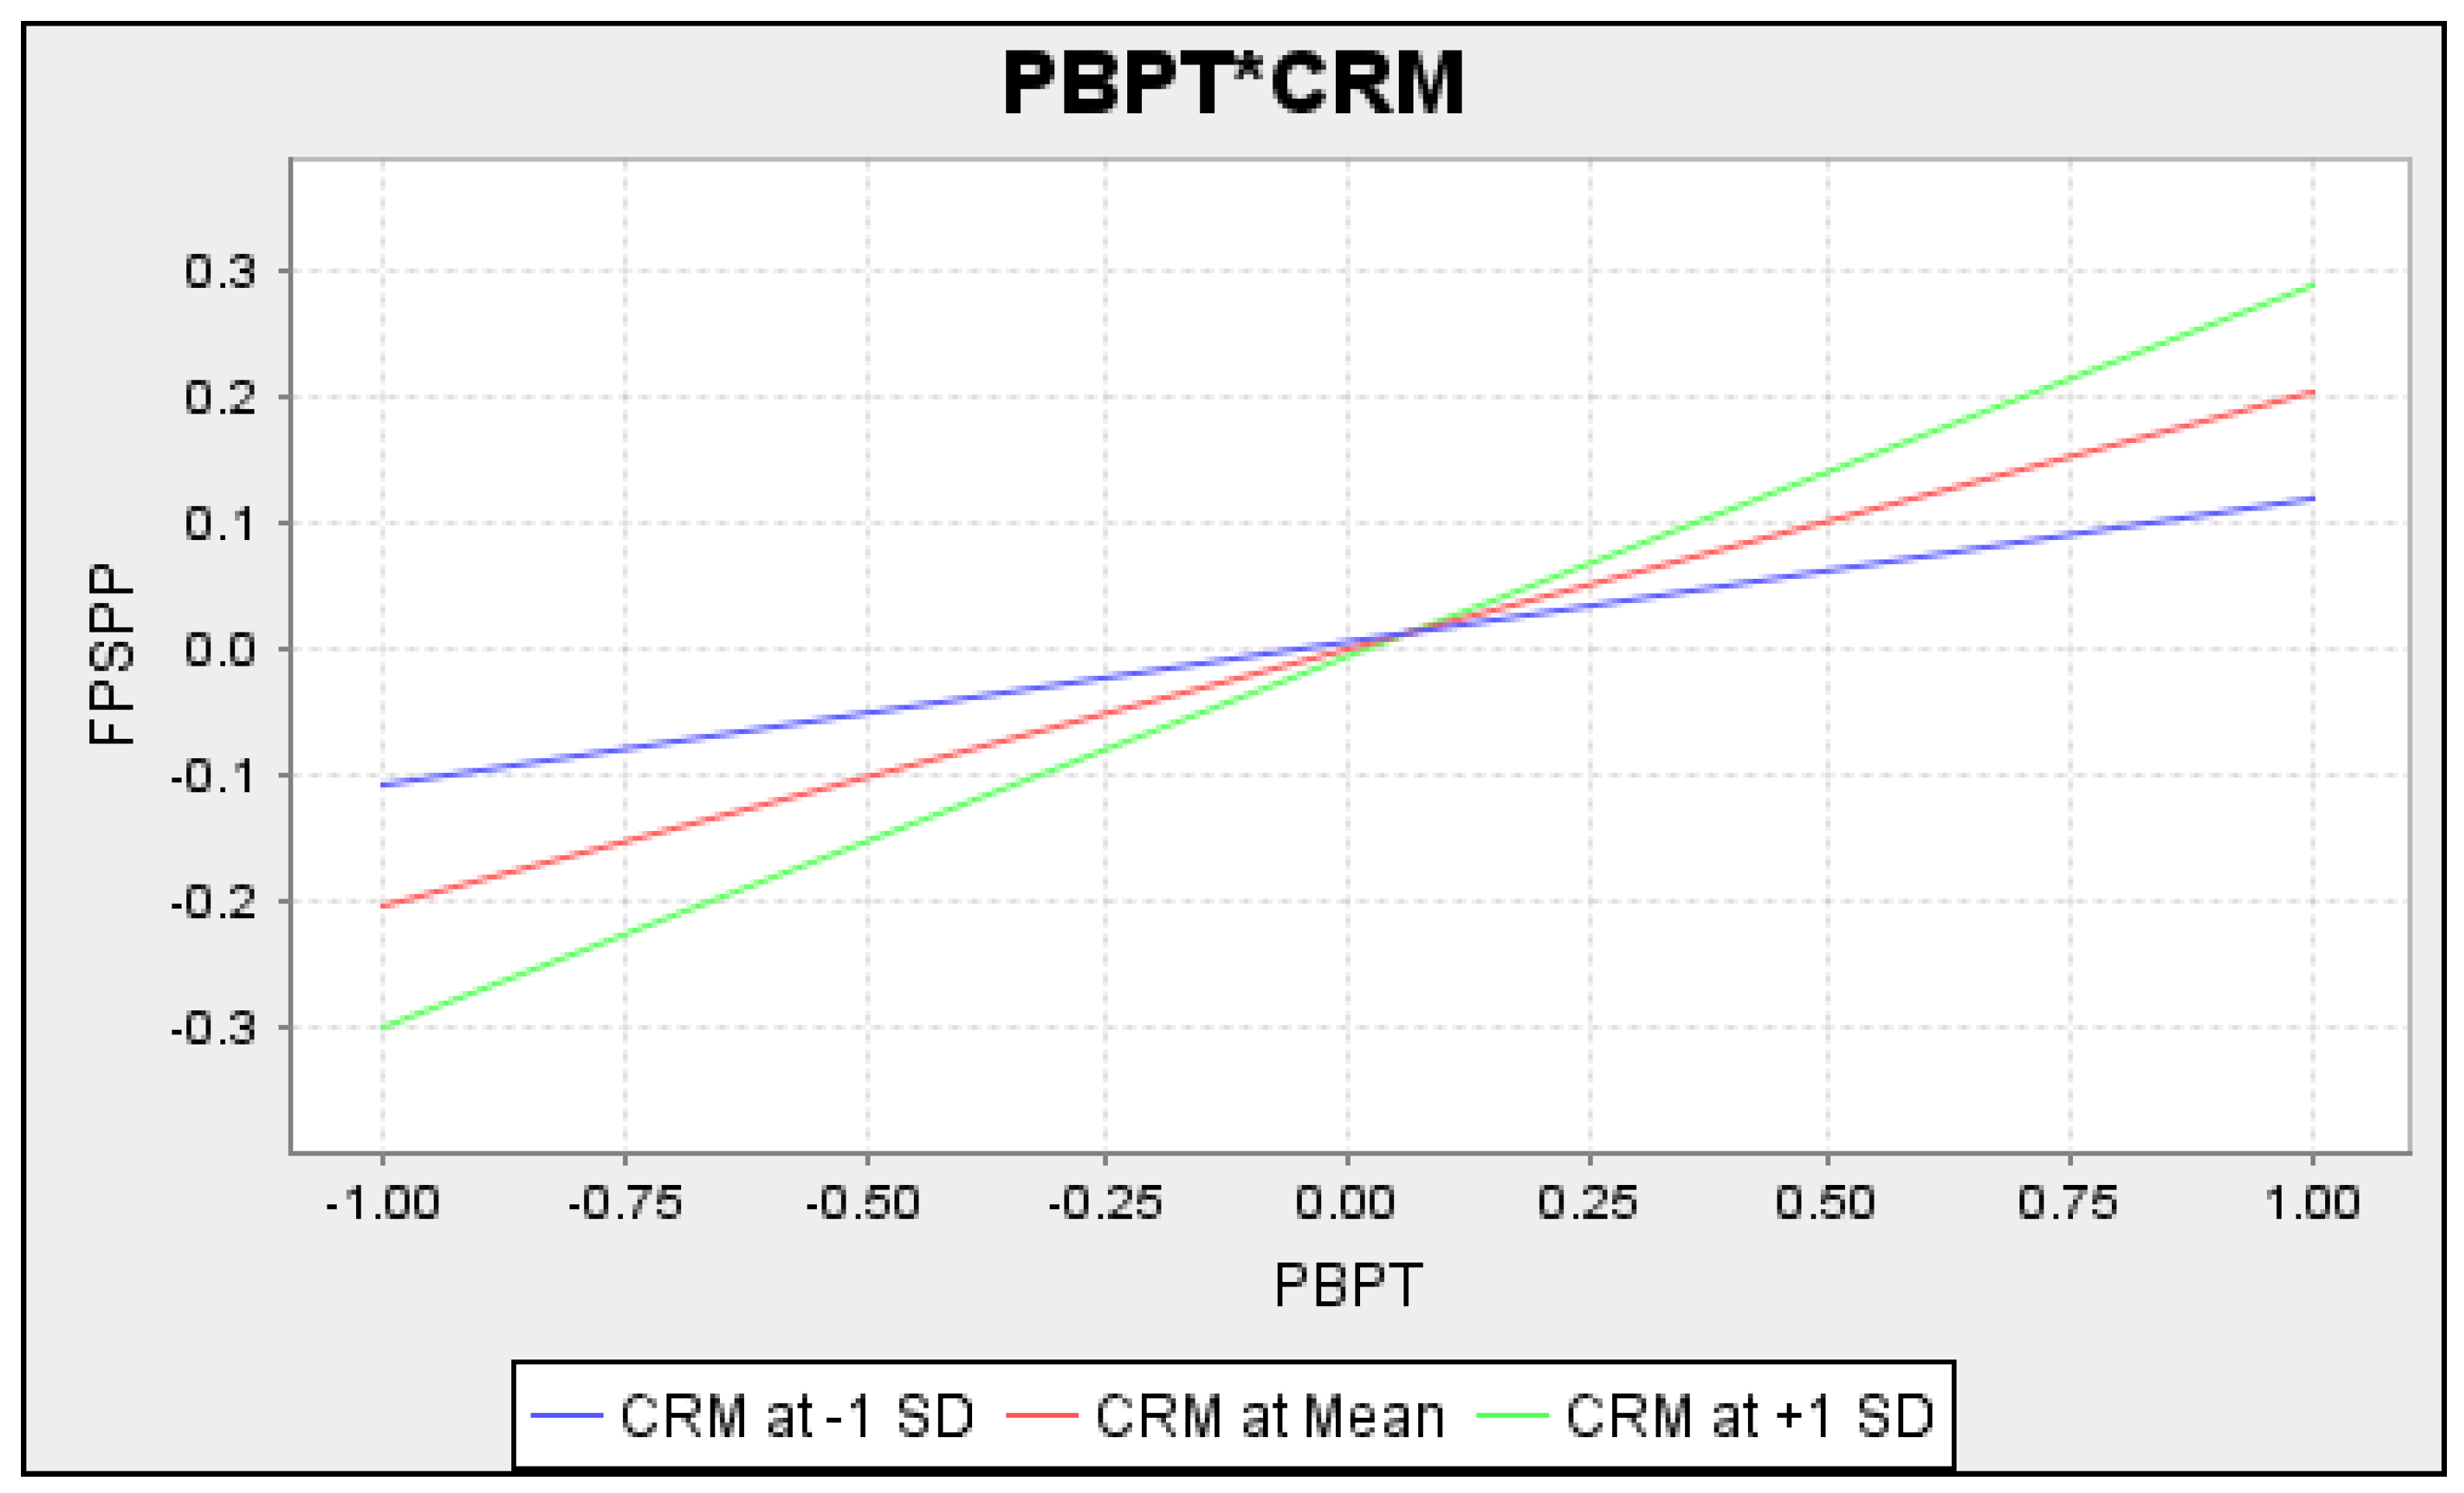
3.1.7. Moderating Role of Cost and Riskiness of the Solar Project between PBP and Financial Performance
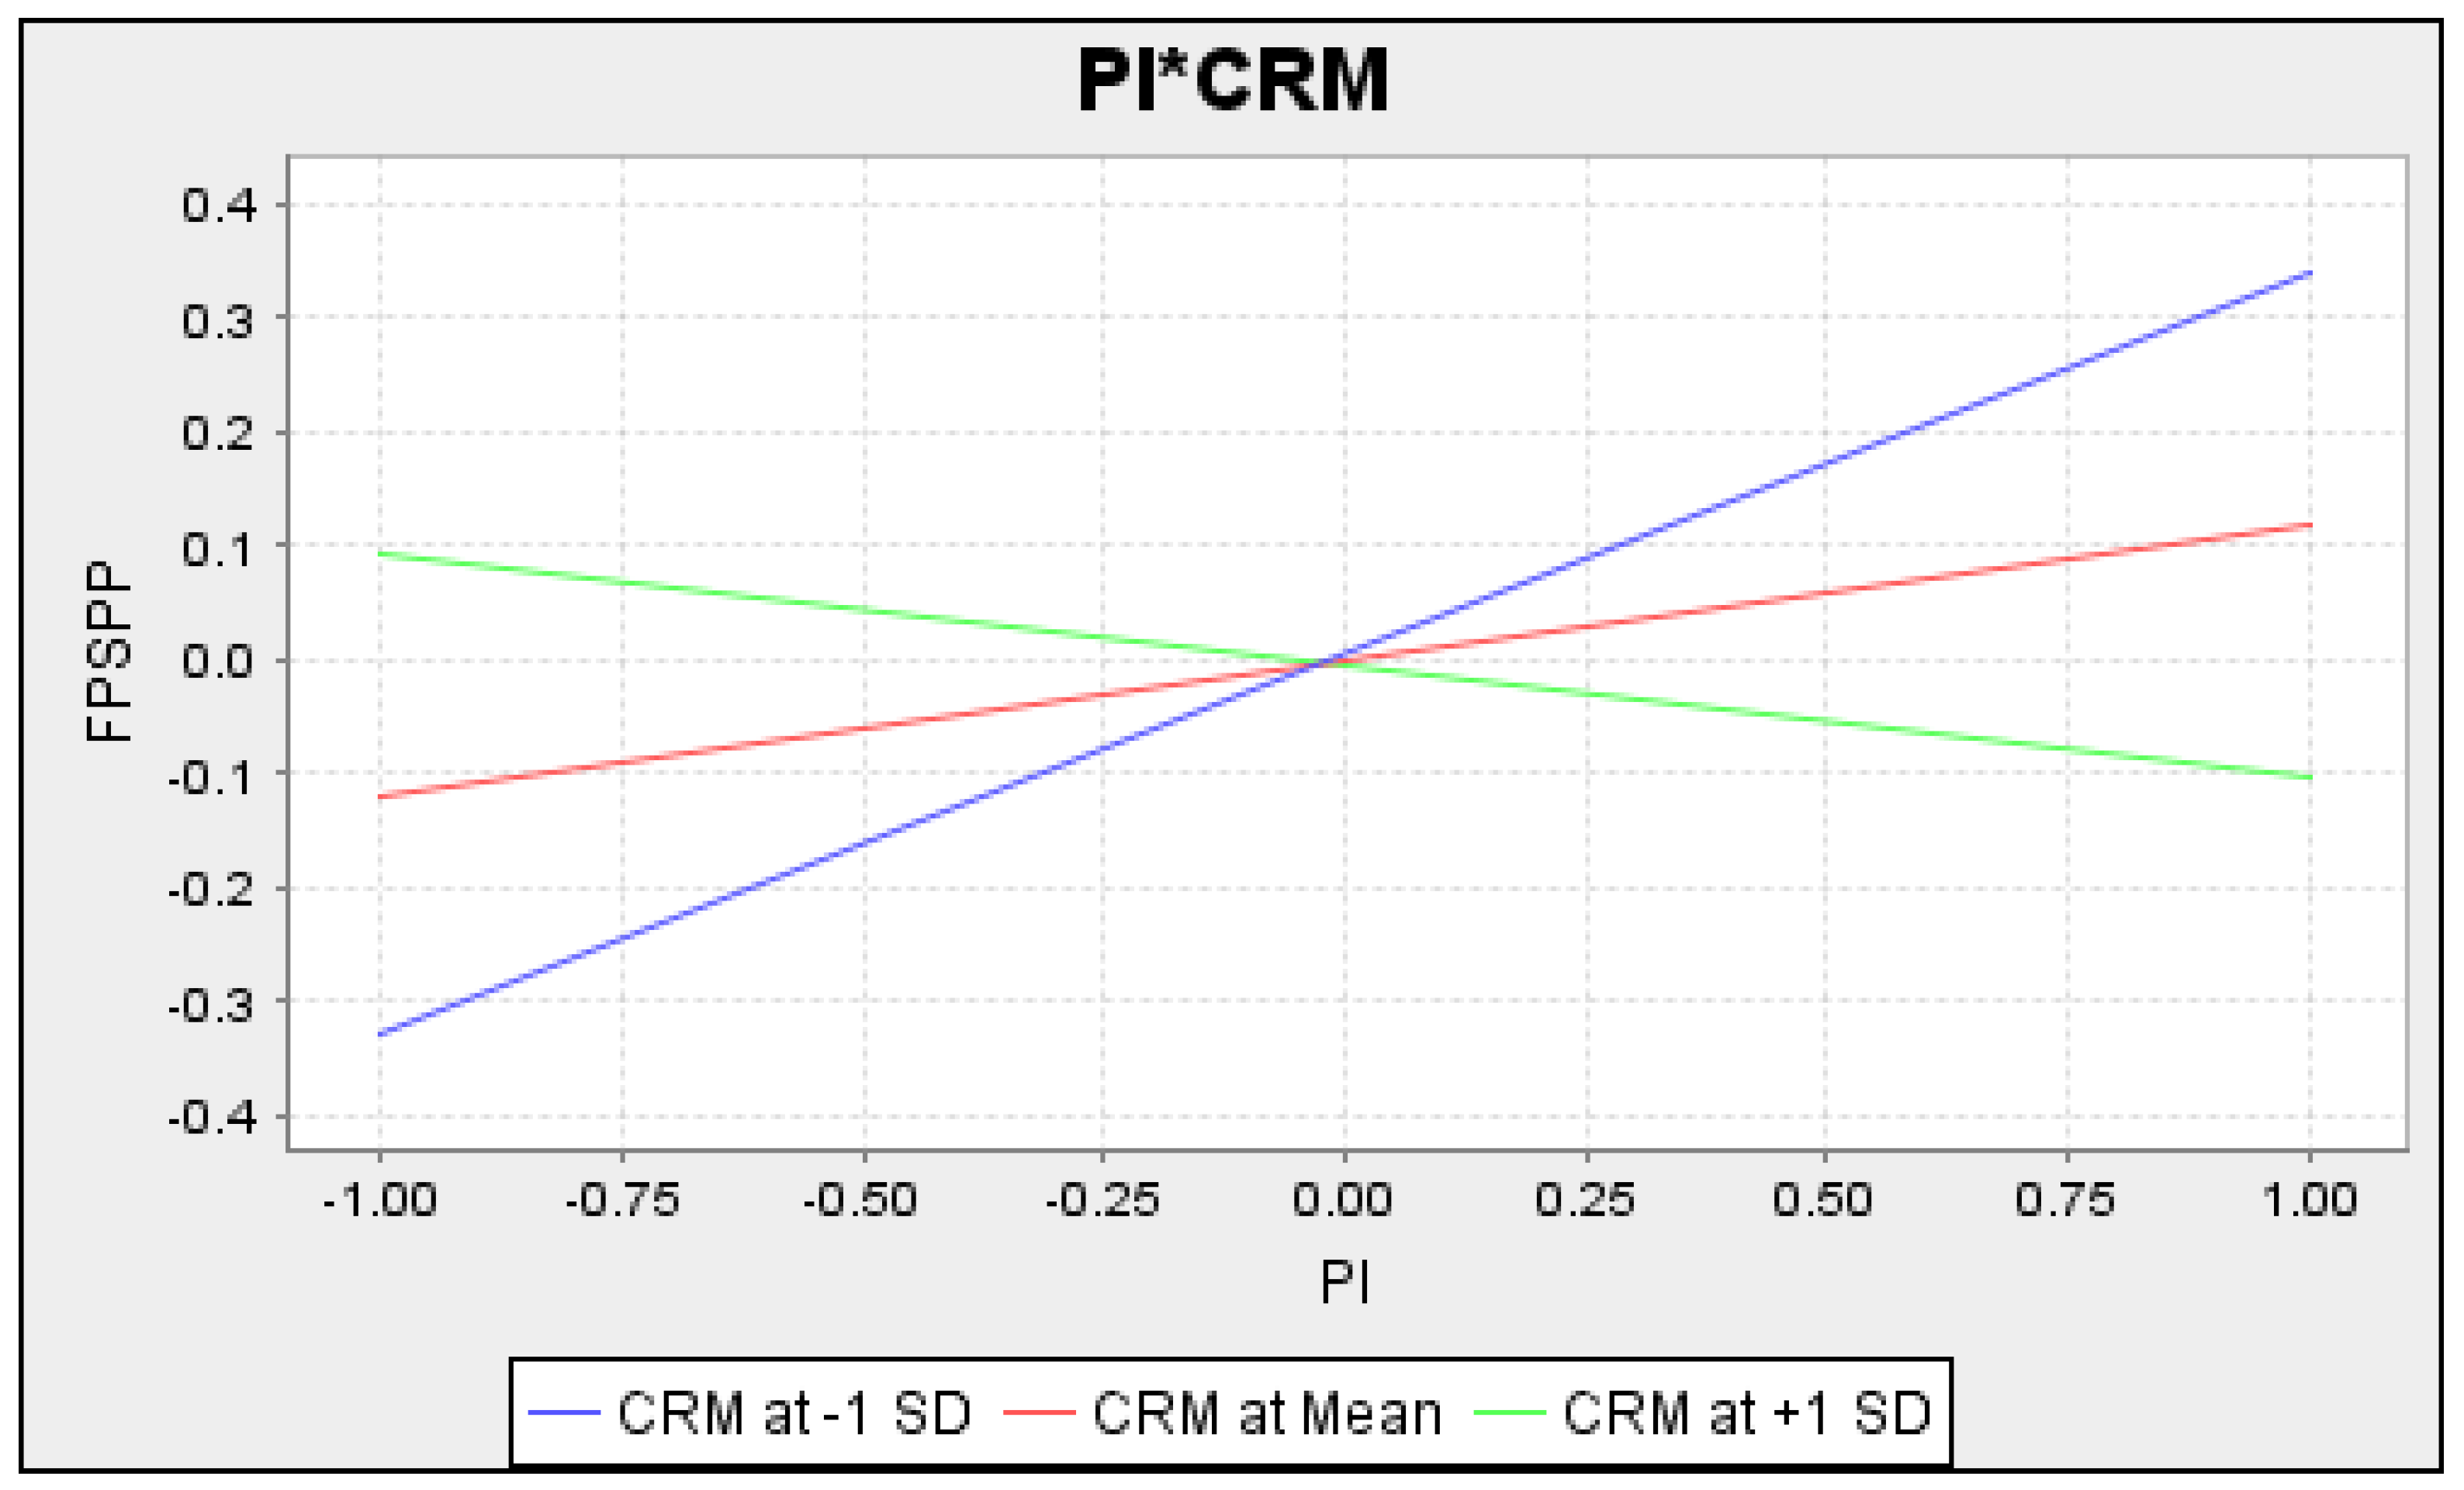
3.1.8. Moderating Role of Cost and Riskiness of the Solar Project between PI and Financial Performance
3.2. Sample and Procedure
3.3. Instrument and Variables for Measurement
4. Data Analysis and Results
4.1. Measurement Assessment Model
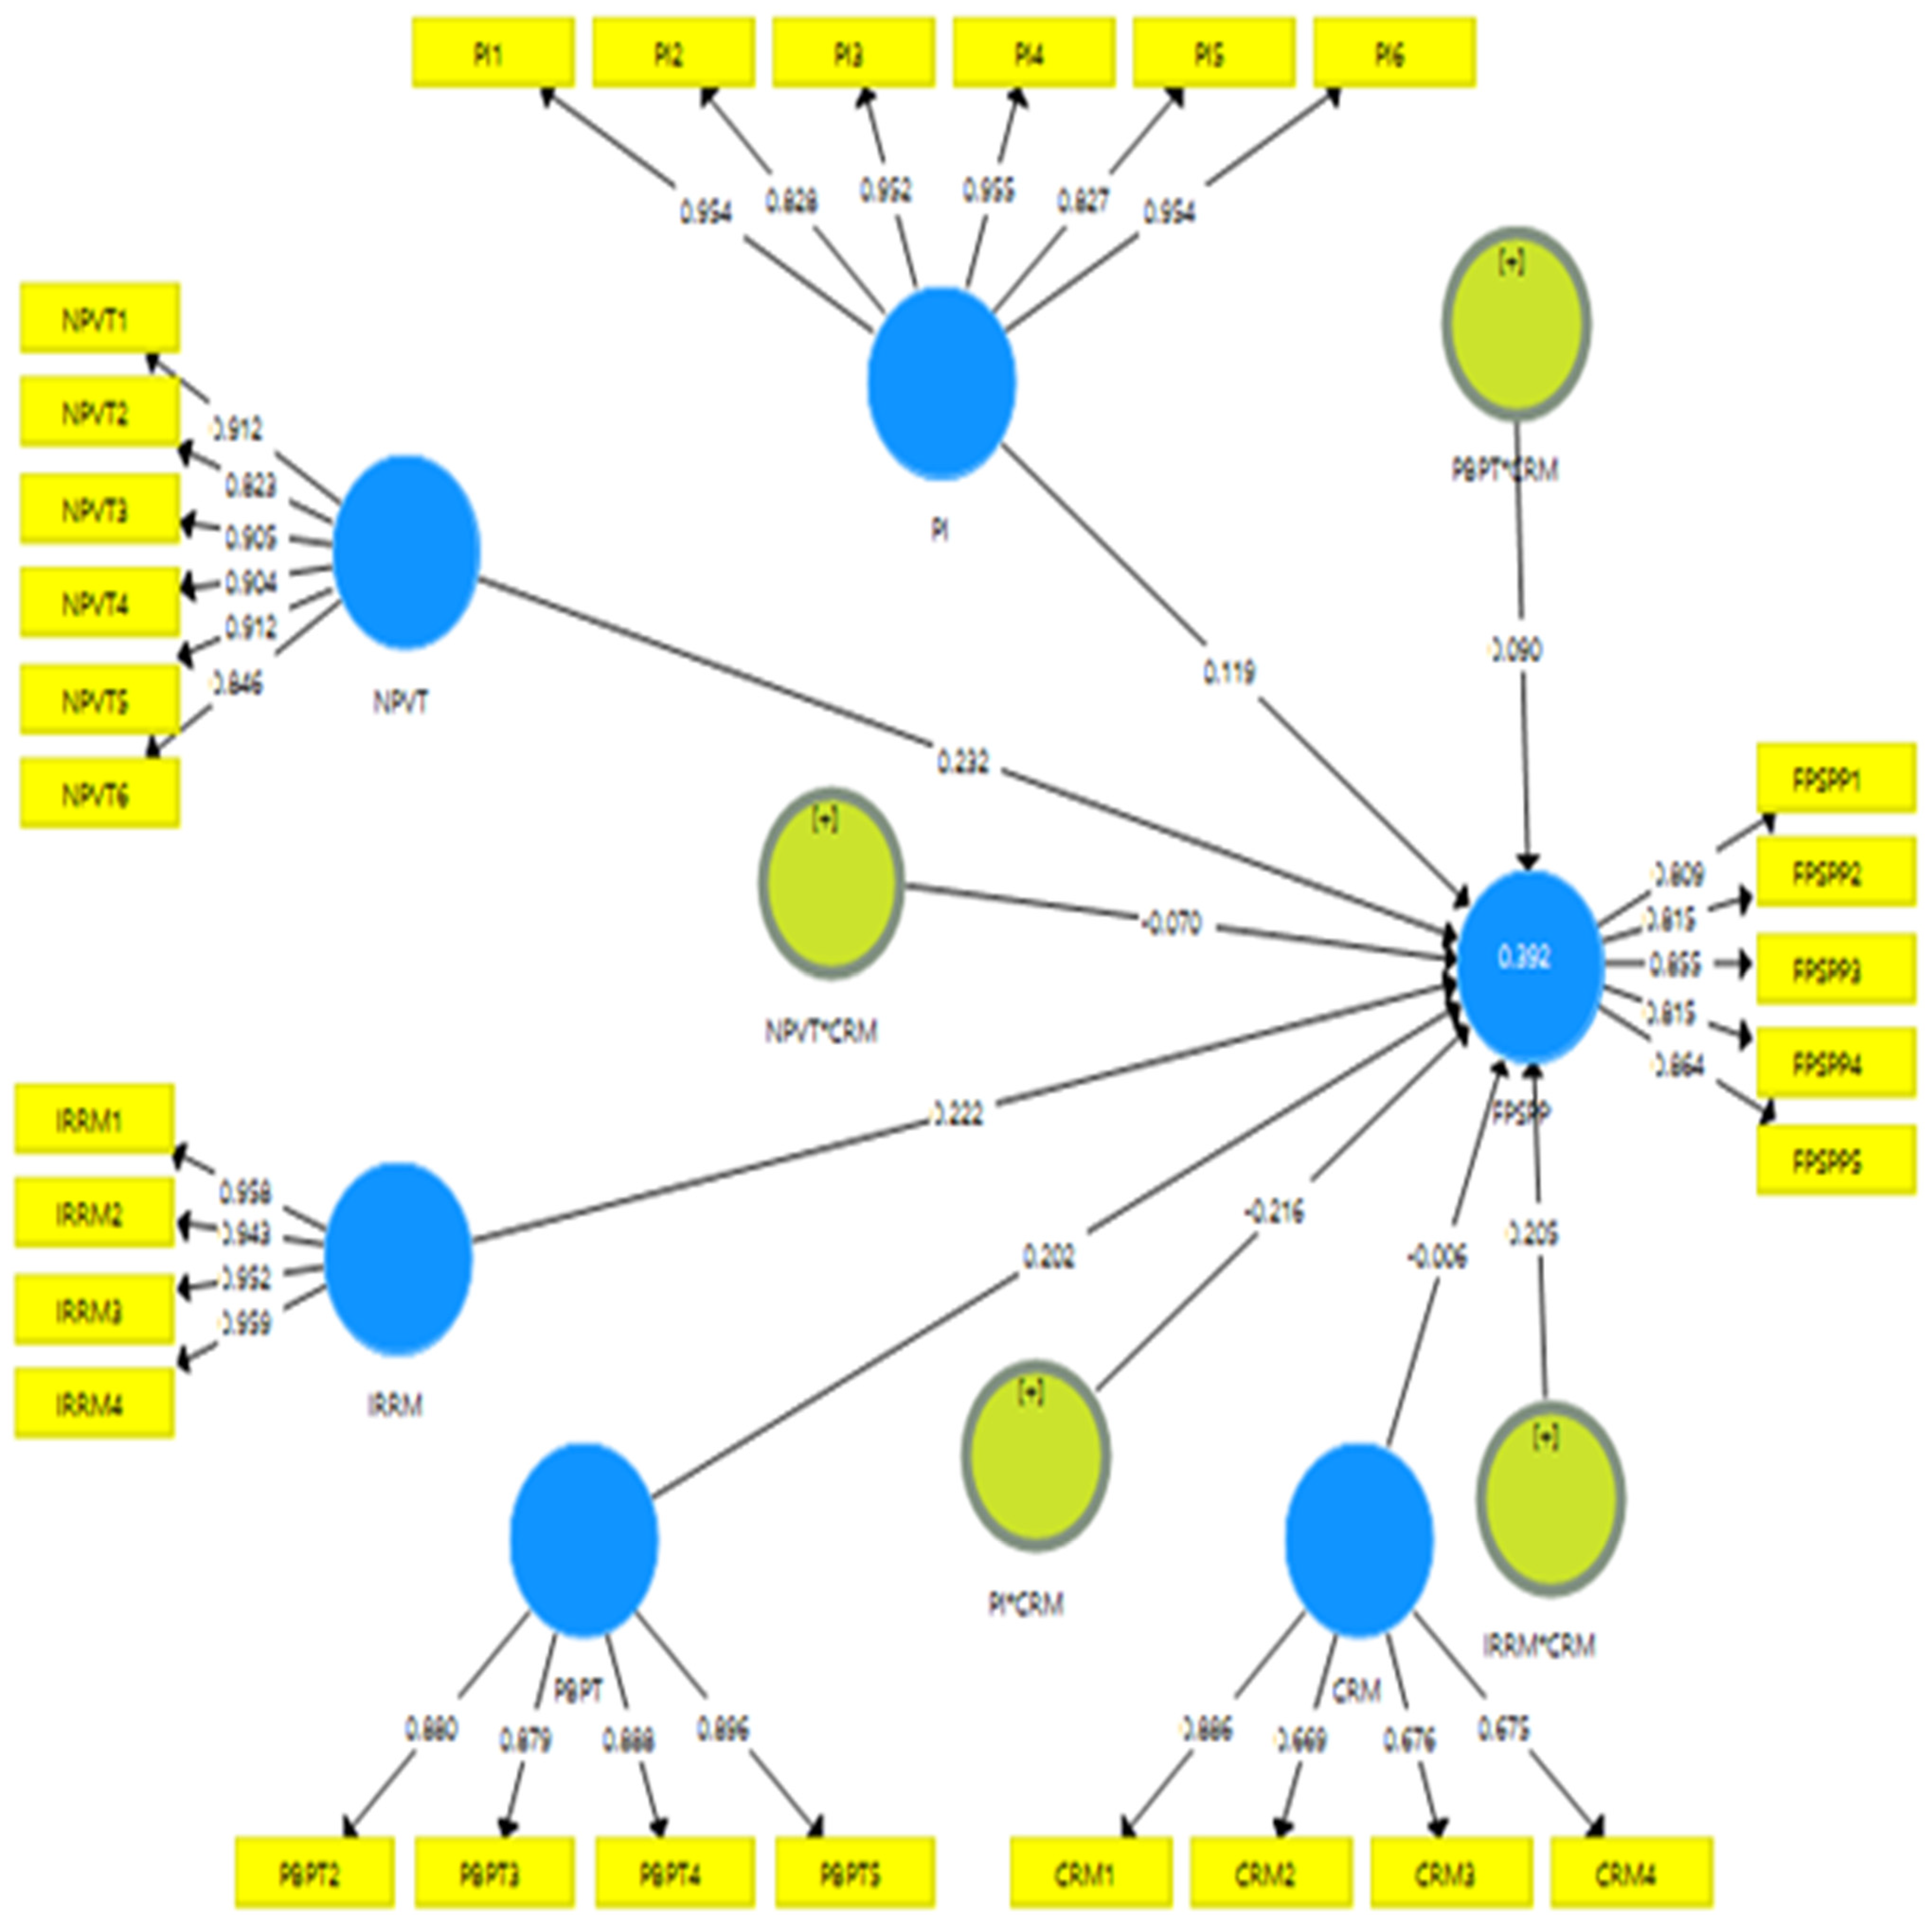
4.2. Structural Assessment Model
5. Discussion and Implications
6. Conclusions and Limitations
Author Contributions
Funding
Institutional Review Board Statement
Informed Consent Statement
Data Availability Statement
Conflicts of Interest
Appendix A

| Part A: Demographic Characteristics of the Respondents | |||
| Characteristics | Options | Frequency | Percentage |
| Gender | Male | 41 | 93.18 |
| Female | 3 | 6.81 | |
| Age | 26–30 years | 3 | 6.81 |
| 31–40 | 11 | 25 | |
| 41–55 | 13 | 29.54 | |
| 56–65 | 12 | 27.27 | |
| 65 and above | 5 | 11.36 | |
| Education of respondents | Bachelor | 20.45 | |
| Master | 52.27 | ||
| MS/MPhil | 27.27 | ||
| Selected industry | Surgical sector | 9 | 20.45 |
| Cotton weaving | 13 | 29.54 | |
| Cosmetic industry | 12 | 27.27 | |
| Sports goods industry | 10 | 22.72 | |
| Solar panel brand name adopted by the owners | Jinko Eagle 72 H.M. G2 | 13 | 29.54 |
| Trina solar TSM | 10 | 22.72 | |
| Sun power x22 | 9 | 20.45 | |
| Ja solar MR series | 7 | 15.9 | |
| Hanwha Q cell Speak Duo | 5 | 11.36 | |
| Job experience | 1–5 years | 7 | 15.9 |
| 6–10 years | 11 | 25 | |
| 11–15 years | 9 | 20.45 | |
| More than 15 years | 17 | 38.63 | |
| Part B: Influencing Factors of Sustainable Development of Solar Power Projects | |||
| Variables | Items | Questions | Percentage |
| Net present value technique | NPVT1 | Solar energy projects are demanding capital budgeting planning | 26.3 |
| NPVT2 | The net present value approach can assess the profitable project of solar energy | 24.4 | |
| NPVT3 | Capital budgeting techniques can support the development of solar energy | 13.2 | |
| NPVT4 | The net present value technique can determine the long-term investment and differences in cash flows for solar energy projects | 11.5 | |
| NPVT5 | Long-term business and financial planning are necessary for solar energy projects by using net present value | 12.9 | |
| NPVT6 | There is a need to use net present value technique to attract investors and foreign direct investment in a solar energy project | 11.7 | |
| Internal rate of return method | IRRM1 | The internal rate of return approach can assess the profitable project of solar energy | 29.1 |
| IRRM2 | A firm can decide investment in a solar energy project with an internal rate of return | 32.2 | |
| IRRM3 | There is a need to adopt an internal rate of return to assess return on capital for a solar energy project | 24.4 | |
| IRRM4 | Solar energy projects require innovative and rational financial decisions by using an internal rate of return | 14.3 | |
| Payback period technique | PBPT1 | The payback period approach can assess the profitable project of solar energy | 23.7 |
| PBPT2 | There is a need to assess the duration of capital return for solar energy systems | 25.9 | |
| PBPT3 | The payback period technique can assess the initial investment cost. | 24.3 | |
| PBPT4 | There is a need to boost up the solar energy project by using the payback period technique | 13.3 | |
| PBPT5 | The payback period approach is suitable for analyzing the solar energy project performance | 12.8 | |
| Profitability index | PI1 | The profitability index technique shows the relationship between payout and investment of the solar energy project | 22.6 |
| PI2 | The profitability index provides the best estimation of the financial performance of the solar power projects | 14.3 | |
| PI3 | Solar energy projects need to calculate their performance using the profitability index | 16.3 | |
| PI4 | There is a need to indicate the relationship between investment of the project and payout of the project using the profitability index. | 17.7 | |
| PI5 | The profitability index is a suitable technique to assess solar energy projects | 17.2 | |
| PI6 | There is a need to know the suitable solar power project for investment using the profitability index | 11.7 | |
| Cost and riskiness method | CRM1 | The cost of capital budgeting technique influences the performance of solar energy projects | 29.7 |
| CRM2 | The cost of the techniques influences its selection and rejection. | 26.3 | |
| CRM3 | There is a need to assess the risk and cost of the capital budgeting technique to minimize it | 22.6 | |
| CRM4 | The riskiness of the techniques influences its selection and rejection. | 21.4 | |
| Financial performance of solar power project | FPSPP1 | Financial performance is a subjective measure in which a solar firm can maintain the standards to use assets and generate revenue | 29.1 |
| FPSPP2 | Financial planning for solar energy projects is necessary to assess financial performance | 27.2 | |
| FPSPP3 | There is a need to compare the same solar projects for their financial health through capital budgeting techniques | 13.1 | |
| FPSPP4 | The financial performance of the solar power project can be assessed through capital budgeting techniques | 19.4 | |
| FPSPP5 | There is a need to analyze the financial performance of the solar power project | 11.2 | |
References
- Ahmad, F.; Draz, M.U.; Chandio, A.A.; Su, L.; Ahmad, M.; Irfan, M. Investigating the myth of smokeless industry: Environmental sustainability in the ASEAN countries and the role of service sector and renewable energy. Environ. Sci. Pollut. Res. 2021, 28, 55344–55361. [Google Scholar] [CrossRef]
- Tanveer, A.; Zeng, S.; Irfan, M. Do Perceived Risk, Perception of Self-Efficacy, and Openness to Technology Matter for Solar PV Adoption? An Application of the Extended Theory of Planned Behavior. Energies 2021, 14, 5008. [Google Scholar] [CrossRef]
- Jan, A.; Xin-gang, Z.; Ahmad, M.; Irfan, M.; Ali, S. Do economic openness and electricity consumption matter for environmental deterioration: Silver bullet or a stake? Environ. Sci. Pollut. Res. 2021, 28, 54069–54084. [Google Scholar] [CrossRef] [PubMed]
- Akram, R.; Chen, F.; Khalid, F.; Huang, G.; Irfan, M. Heterogeneous effects of energy efficiency and renewable energy on economic growth of BRICS countries: A fixed effect panel Quantile Regression Analysis. Energy 2020, 215, 119019. [Google Scholar] [CrossRef]
- Hussain, A.; Oad, A.; Ahmad, M.; Irfan, M. Do financial development and economic openness matter for economic progress in an emerging country ? Seeking a sustainable development path. J. Risk Financ. Manag. 2021, 14, 237. [Google Scholar] [CrossRef]
- Mukeshimana, M.C.; Zhao, Z.Y.; Ahmad, M.; Irfan, M. Analysis on barriers to biogas dissemination in Rwanda: AHP approach. Renew. Energy 2020, 163, 1127–1137. [Google Scholar] [CrossRef]
- Irfan, M.; Ahmad, M. Relating consumers’ information and willingness to buy electric vehicles: Does personality matter? Transp. Res. Part D Transp. Environ. 2021, 100, 103049. [Google Scholar] [CrossRef]
- Panji Galih Kusumo Adie Capital Budgeting Analysis to Assess the Karaoke Business Feasibility Panji. Pinisi Discret. Rev. 2019, 3, 47–52. [CrossRef]
- Dagar, V.; Khan, M.K.; Alvarado, R.; Rehman, A.; Irfan, M.; Adekoya, O.B.; Fahad, S. Impact of renewable energy consumption, financial development and natural resources on environmental degradation in OECD countries with dynamic panel data. Environ. Sci. Pollut. Res. 2021, 1–11. [Google Scholar] [CrossRef]
- Abdelhady, S. Performance and cost evaluation of solar dish power plant: Sensitivity analysis of levelized cost of electricity (LCOE) and net present value (NPV). Renew. Energy 2021, 168, 332–342. [Google Scholar] [CrossRef]
- Wu, H.; Ba, N.; Ren, S.; Xu, L.; Chai, J.; Irfan, M. The impact of internet development on the health of Chinese residents: Transmission mechanisms and empirical tests. Socioecon. Plann. Sci. 2021, 101178. [Google Scholar] [CrossRef]
- Elavarasan, R.M.; Leoponraj, S.; Dheeraj, A.; Irfan, M.; Gangaram Sundar, G.; Mahesh, G.K. PV-Diesel-Hydrogen fuel cell based grid connected configurations for an institutional building using BWM framework and cost optimization algorithm. Sustain. Energy Technol. Assess. 2021, 43, 100934. [Google Scholar] [CrossRef]
- Irfan, M.; Hao, Y.; Ikram, M.; Wu, H.; Akram, R.; Rauf, A. Assessment of the public acceptance and utilization of renewable energy in Pakistan. Sustain. Prod. Consum. 2021, 27, 312–324. [Google Scholar] [CrossRef]
- Irfan, M.; Zhao, Z.-Y.; Ahmad, M.; Mukeshimana, M. Solar energy development in Pakistan: Barriers and policy recommendations. Sustainability 2019, 11, 1206. [Google Scholar] [CrossRef]
- Fahd Amjad, L.A.S. Identification and assessment of sites for solar farms development using GIS and density based clustering technique—A case of Pakistan. Renew. Energy 2020, 155, 761–769. [Google Scholar] [CrossRef]
- Awan, U.; Knight, I. Domestic sector energy demand and prediction models for Punjab Pakistan. J. Build. Eng. 2020, 32, 101790. [Google Scholar] [CrossRef]
- Rafique, M.M.; Rehman, S. National energy scenario of Pakistan—Current status, future alternatives, and institutional infrastructure: An overview. Renew. Sustain. Energy Rev. 2017, 69, 156–167. [Google Scholar] [CrossRef]
- Irfan, M.; Zhao, Z.Y.; Rehman, A.; Ozturk, I.; Li, H. Consumers’ intention-based influence factors of renewable energy adoption in Pakistan: A structural equation modeling approach. Environ. Sci. Pollut. Res. 2021, 28, 432–445. [Google Scholar] [CrossRef] [PubMed]
- Irfan, M.; Zhao, Z.Y.; Li, H.; Rehman, A. The influence of consumers’ intention factors on willingness to pay for renewable energy: A structural equation modeling approach. Environ. Sci. Pollut. Res. 2020, 27, 21747–21761. [Google Scholar] [CrossRef] [PubMed]
- Irfan, M.; Zhao, Z.Y.; Mukeshimana, M.C.; Ahmad, M. Wind energy development in South Asia: Status, potential and policies. In Proceedings of the 2019 2nd International Conference on Computing, Mathematics and Engineering Technologies, iCoMET, Sindh, Pakistan, 30–31 January 2019; pp. 1–6. [Google Scholar]
- Irfan, M.; Zhao, Z.Y.; Panjwani, M.K.; Mangi, F.H.; Li, H.; Jan, A.; Ahmad, M.; Rehman, A. Assessing the energy dynamics of Pakistan: Prospects of biomass energy. Energy Rep. 2020, 6, 80–93. [Google Scholar] [CrossRef]
- Irfan, M.; Zhao, Z.Y.; Ahmad, M.; Rehman, A. A techno-economic analysis of off-grid solar PV system: A case study for Punjab Province in Pakistan. Processes 2019, 7, 708. [Google Scholar] [CrossRef]
- Irfan, M.; Zhao, Z.Y.; Ikram, M.; Gilal, N.G.; Li, H.; Rehman, A. Assessment of India’s energy dynamics: Prospects of solar energy. J. Renew. Sustain. Energy 2020, 12, 053701. [Google Scholar] [CrossRef]
- IEA International Energy Agency (IEA). World Energy Statistics Report 2020. Available online: https://www.iea.org/ (accessed on 11 June 2021).
- Rafique, M.M.; Rehman, S.; Alhems, L.M. Assessment of solar energy potential and its deployment for cleaner production in Pakistan. J. Mech. Sci. Technol. 2020, 34, 3437–3443. [Google Scholar] [CrossRef]
- Azam, M.; Khan, A.Q.; Ozturk, I. The effects of energy on investment, human health, environment and economic growth: Empirical evidence from China. Environ. Sci. Pollut. Res. 2019, 26, 10816–10825. [Google Scholar] [CrossRef]
- Batra, R.; Verma, S. Capital budgeting practices in Indian companies. IIMB Manag. Rev. 2017, 29, 29–44. [Google Scholar] [CrossRef]
- Battisti, F.; Campo, O. A Methodology for Determining the Profitability Index of Real Estate Initiatives Involving Public—Private Partnerships. A Case Study: The Integrated Intervention Programs in Rome. Sustainability 2019, 11, 1371. [Google Scholar] [CrossRef]
- Alternative Energy Development Board (AEDB). Current Status of Solar PV Power Projects. Available online: https://www.aedb.org/ae-technologies/solar-power/solar-current-status (accessed on 18 July 2021).
- Chandio, A.A.; Jiang, Y.; Akram, W.; Adeel, S.; Irfan, M.; Jan, I. Addressing the effect of climate change in the framework of financial and technological development on cereal production in Pakistan. J. Clean. Prod. 2021, 288, 125637. [Google Scholar] [CrossRef]
- Khan, I.; Hou, F.; Irfan, M.; Zakari, A.; Phong, H. Does energy trilemma a driver of economic growth ? The roles of energy use, population growth, and financial development. Renew. Sustain. Energy Rev. 2021, 146, 111157. [Google Scholar] [CrossRef]
- Li, Y.; Yang, X.; Ran, Q.; Wu, H.; Irfan, M.; Ahmad, M. Energy structure, digital economy, and carbon emissions: Evidence from China. Environ. Sci. Pollut. Res. 2021, 1–24. [Google Scholar] [CrossRef]
- Razzaq, A.; Ajaz, T.; Li, J.C.; Irfan, M.; Suksatan, W. Investigating the asymmetric linkages between infrastructure development, green innovation, and consumption-based material footprint: Novel empirical estimations from highly resource-consuming economies. Resour. Policy 2021, 74, 102302. [Google Scholar] [CrossRef]
- Rehman, A.; Ma, H.; Chishti, M.Z.; Ozturk, I.; Irfan, M.; Ahmad, M. Asymmetric investigation to track the effect of urbanization, energy utilization, fossil fuel energy and CO2 emission on economic efficiency in China: Another outlook. Environ. Sci. Pollut. Res. 2021, 28, 17319–17330. [Google Scholar] [CrossRef] [PubMed]
- Rehman, A.; Ma, H.; Ozturk, I.; Ahmad, M.; Rauf, A.; Irfan, M. Another outlook to sector-level energy consumption in Pakistan from dominant energy sources and correlation with economic growth. Environ. Sci. Pollut. Res. 2021, 28, 33735–33750. [Google Scholar] [CrossRef]
- Wang, J.; Wang, W.; Ran, Q.; Irfan, M.; Ren, S.; Yang, X.; Wu, H.; Ahmad, M. Analysis of the mechanism of the impact of internet development on green economic growth: Evidence from 269 prefecture cities in China. Environ. Sci. Pollut. Res. 2021, 1–15. [Google Scholar] [CrossRef] [PubMed]
- Yang, C.; Hao, Y.; Muhammad, I. Energy consumption structural adjustment and carbon neutrality in the post-COVID-19 era. Struct. Chang. Econ. Dyn. 2021, 59, 442–453. [Google Scholar] [CrossRef]
- Qiu, W.; Zhang, J.; Wu, H.; Irfan, M.; Ahmad, M. The role of innovation investment and institutional quality on green total factor productivity: Evidence from 46 countries along the “Belt and Road”. Environ. Sci. Pollut. Res. 2021. ahead of print. [Google Scholar] [CrossRef] [PubMed]
- Işık, C.; Ongan, S.; Bulut, U.; Karakaya, S.; Irfan, M.; Alvarado, R.; Ahmad, M.; Rehman, A. Reinvestigating the Environmental Kuznets Curve (EKC) hypothesis by a composite model constructed on the Armey curve hypothesis with government spending for the US States. Environ. Sci. Pollut. Res. 2021. ahead of print. [Google Scholar] [CrossRef]
- Perpiña, C.; Batista, F.; Lavalle, C. An assessment of the regional potential for solar power generation in EU-28. Energy Policy 2020, 88, 86–99. [Google Scholar] [CrossRef]
- Kamran, M. Current status and future success of renewable energy in Pakistan. Renew. Sustain. Energy Rev. 2018, 82, 609–617. [Google Scholar] [CrossRef]
- Kamran, M.; Mudassar, M.; Abid, I.; Fazal, M.R.; Rukh, S. Reconsidering the Power Structure of Pakistan. Int. J. Renew. Energy Res. 2019, 9, 480–492. [Google Scholar]
- Karenlampi, P.P. Net present value of multiannual growth in the absence of periodic boundary conditions. Agric. Financ. Rev. 2020, 81, 39–50. [Google Scholar] [CrossRef]
- Kassem, Y.; Çamur, H.; Alhuoti, S.M.A. Solar energy technology for northern cyprus: Assessment, statistical analysis, and feasibility study. Energies 2020, 13, 940. [Google Scholar] [CrossRef]
- Kawabataa, Y.; Kato, E.; Yokota, H.; Lwanami, M. Net present value as an effective indicator leading to preventive maintenance of port mooring facilities. Struct. Infrastruct. Eng. 2019, 16, 714–725. [Google Scholar] [CrossRef]
- Khalil, H.B.; Zaidi, S.J.H. Energy crisis and potential of solar energy in Pakistan. Renew. Sustain. Energy Rev. 2014, 31, 194–201. [Google Scholar] [CrossRef]
- Kozlovskyi, A.; Bilenko, D.; Kozlovskyi, S.; Lavrov, R.; Skydan, O.; Ivanyuta, N. Determination of the risk-free rate of return on an investment efficiency based on the fractal markets hypothesis. Pap. Present. Forum Sci. Oecon. 2020, 8, 61–72. [Google Scholar] [CrossRef]
- Shakhovska, N.; Medykovskyy, M.O. Advances in Intelligent Systems and Computing IV; Springer: New Delhi, India, 2019; ISBN 9783030336943. [Google Scholar]
- Mahapatra, M.S.; Raveendran, J.; De, A. Building a model on influence of behavioural and cognitive factors on personal financial planning: A study among indian households. Glob. Bus. Rev. 2019, 20, 996–1009. [Google Scholar] [CrossRef]
- Saurabh Chadha, S.K.S. Capital budgeting practices: A survey in the selected Indian manufacturing firms. Int. J. Ind. Cult. Bus Manag. 2019, 18, 381–390. [Google Scholar] [CrossRef]
- Christensen, P.H. A post-global financial crisis (GFC) framework for strategic planning, assessment and management decision making for U.S. sustainable commercial real estate. J. Prop. Investig. Financ. 2017, 35, 589–618. [Google Scholar] [CrossRef]
- Chacon, M.C.; Diaz, J.A.R.; Morillo, J.G.; McNabola, A. Pump-as-turbine selection methodology for energy recovery in irrigation networks: Minimising the payback period. Water 2019, 11, 149. [Google Scholar] [CrossRef]
- Crosby, N.; Devaney, S.; Wyatt, P. The implied internal rate of return in conventional residual valuations of development sites valuations of development sites. J. Prop. Res. 2018, 35, 234–251. [Google Scholar] [CrossRef]
- Martinek, J.; Jorgenson, J.; Mehos, M.; Denholm, P. A comparison of price-taker and production cost models for determining system value, revenue, and scheduling of concentrating solar power plants. Appl. Energy 2018, 231, 854–865. [Google Scholar] [CrossRef]
- Mirjat, N.H.; Uqaili, M.A.; Harijan, K.; Valasai, G.D.; Shaikh, F.; Waris, M. A review of energy and power planning and policies of Pakistan. Renew. Sustain. Energy Rev. 2017, 79, 110–127. [Google Scholar] [CrossRef]
- Zore, Ž.; Čuček, L.; Širovnik, D.; Kravanja, Z. Maximizing the sustainability net present value of renewable energy supply networks. Chem. Eng. Res. Des. 2018, 131, 245–265. [Google Scholar] [CrossRef]
- Fleten, S.; Linnerud, K.; Molnár, P.; Nygaard, M.T. Green electricity investment timing in practice: Real options or net present value? Energy 2016, 116, 498–506. [Google Scholar] [CrossRef]
- Mubashar, A.; Tariq, B.T. Capital budgeting decision-making practices: Evidence from Pakistan. J. Adv. Manag. Res. 2018, 12, 55–82. [Google Scholar] [CrossRef]
- Nekhaychuk, D.V.; Nogas, I.L.; Vernadsky, V.I.; Nekhaychuk, E.V.; Vernadsky, V.I. The Financial Planning and Its Tasks in Modern Models of Enterprise Management; Atlantis Press: Amsterdam, The Netherlands, 2019; Volume 83, pp. 38–41. [Google Scholar]
- Kameni, M.; Christophe, J.; Noelson, V.; Saadi, I.; Kenfack, H.; Andrianaharinjaka, A.F.R.; Foumouo, D.; Barahimo, J.; Reiter, S. Application of phase change materials, thermal insulation, and external shading for thermal comfort improvement and cooling energy demand reduction in an o ffi ce building under di ff erent coastal tropical climates. Sol. Energy 2020, 207, 458–470. [Google Scholar] [CrossRef]
- Ozcan, O.; Ersoz, F. Engineering Science and Technology, an International Journal Project and cost-based evaluation of solar energy performance in three different geographical regions of Turkey: Investment analysis application. Eng. Sci. Technol. Int. J. 2019, 22, 1098–1106. [Google Scholar] [CrossRef]
- López Prol, J.; Steininger, K.W. Photovoltaic self-consumption is now profitable in Spain: Effects of the new regulation on prosumers’ internal rate of return. Energy Policy 2020, 146, 11793. [Google Scholar] [CrossRef]
- Castro-Santos, L.; Filgueira-Vizoso, A.; Piegari, L. Calculation of the Levelized Cost of Energy and the Internal Rate of Return using GIS: The case study of a floating wave energy farm. In Proceedings of the 2019 International Conference on Clean Electrical Power (ICCEP), Otranto, Italy, 2–4 July 2019; pp. 674–679. [Google Scholar]
- Powell, J.W.; Welsh, J.M.; Farquharson, R. Investment analysis of solar energy in a hybrid diesel irrigation pumping system in New South Wales, Australia. J. Cleaner Prod. 2019, 224, 444–454. [Google Scholar] [CrossRef]
- Park, K.; Lee, G.; Lee, B. Study on theoretical research to reduce fire risk of solar power system. J. Korean Soc. Ind. Converg. 2020, 23, 219–224. [Google Scholar] [CrossRef]
- Pellerin, R.; Perrier, N. A review of methods, techniques and tools for project planning and control. Int. J. Prod. Res. 2019, 57, 2160–2178. [Google Scholar] [CrossRef]
- Wijesuriya, D.T.P.; Wickramathilaka, K.D.S.H.; Wijesinghe, L.S.; Vithana, D.M.; Perera, H.Y.R. Reduction of solar PV payback period using optimally placed reflectors. Energy Procedia 2017, 134, 480–489. [Google Scholar] [CrossRef]
- Sotnyk, I.; Sotnyk, I.; Momotiuk, L. Yulija Chortok Management of renewable energy innovative development in Ukrainian households: Problems of financial support. Mark. Manag. Innov. 2018, 6718, 150–160. [Google Scholar] [CrossRef]
- Rai, K.; Tyagi, A.; Sahni, S. Modelling the factors of financial planning for retirement among individuals using ISM. J. Crit. Rev. 2020, 7, 1547–1558. [Google Scholar]
- Raj, A.N. Identifying appropriate Project Required Return. Psychol. Educ. J. 2020, 57, 4027–4036. [Google Scholar]
- Rich, S.P.; Rose, J.T.; Delaney, C.J. Net present value analysis in finance and real estate: A clash of methodologies. J. Real Estate Portf. Manag. 2018, 24, 83–94. [Google Scholar] [CrossRef]
- Mohanty, S.; Rout, A.; Patra, P.K.; Sahoo, S.S. ANFIS based solar radiation data forecasting for energy & economic study of solar water heaters in Eastern India. Int. J. Control Theory Appl. 2017, 10, 179–190. [Google Scholar]
- Ruggiero, S.; Lehkonen, H. Renewable energy growth and the fi nancial performance of electric utilities: A panel data study. J. Clean. Prod. 2017, 142, 3676–3688. [Google Scholar] [CrossRef]
- Yoomak, S.; Patcharoen, T.; Ngaopitakkul, A. Performance and economic evaluation of solar rooftop systems in different regions of Thailand. Sustainability 2019, 11, 6647. [Google Scholar] [CrossRef]
- Ullah, H.; Kamal, I.; Ali, A.; Arshad, N. Investor Focused Placement and Sizing of Photovoltaic Grid-Connected Systems in Pakistan; Elsevier Ltd.: Amsterdam, The Netherlands, 2018; Volume 121, ISBN 9242358983. [Google Scholar]
- Salvi, A.; Petruzzella, F.; Giakoumelou, A. Does sustainability foster the cost of equity reduction? The relationship between corporate social responsibility (CSR) and riskiness worldwide. Afr. J. Bus. Manag. 2018, 12, 381–397. [Google Scholar] [CrossRef][Green Version]
- Sarper, H.; Chacon, P.; Demirtaş, M.; Melnykov, I.; Palak, G.; Fraser, J.M. Distribution of the Internal and External Rates of Return in a Partially Stochastic.Oil Pump Problem. Eng. Econ. 2018, 2701, 343–362. [Google Scholar] [CrossRef]
- Sarwary, Z. Strategy and capital budgeting techniques: The moderating role of entrepreneurial structure. Int. J. Manag. Financ. Account. 2020, 12, 48–70. [Google Scholar] [CrossRef]
- Schlegel, D.; Frank, F.; Britzelmaier, B. Investment decisions and capital budgeting practices in German manufacturing companies. Int. J. Bus. Glob. 2016, 16, 66–78. [Google Scholar] [CrossRef]
- Shin, H.; Kim, E. Meta-analysis of rate of return on road projects. Transp. Lett. 2017, 11, 190–199. [Google Scholar] [CrossRef]
- Siziba, S.; Hall, J.H. The evolution of the application of capital budgeting techniques in enterprises. Glob. Financ. J. 2019, 47, 100504. [Google Scholar] [CrossRef]
- Martínez-Ruiz, Y.; Manotas-Duque, D.F.; Ramírez-Malule, H. Evaluation of investment projects in photovoltaic solar energy using the dnpv methodology. Int. J. Energy Econ. Policy 2020, 11, 180–185. [Google Scholar] [CrossRef]
- Guindon, A.; Wright, D.J. Analytical approach to quantitative risk assessment for solar power projects. Renew. Sustain. Energy Rev. 2020, 133, 110262. [Google Scholar] [CrossRef]
- Suphahitanukool, C.; Hunsacharoonroj, I.; Usapein, P.; Khedari, J. An evaluation of economic potentialsolar photovoltaic farm in Thailand: Case study of polycrystalline silicon and amorphous silicon thin film. Int. J. Energy Econ. Policy 2018, 8, 33–41. [Google Scholar] [CrossRef]
- Jadidi, H.; Firouzi, A.; Rastegar, M.A.; Zandi, M. Bayesian updating of solar resource data for risk mitigation in project finance. Sol. Energy 2020, 207, 1390–1403. [Google Scholar] [CrossRef]
- Jae, K.; Lee, H.; Koo, Y. Research on local acceptance cost of renewable energy in South Korea: A case study of photovoltaic and wind power projects. Energy Policy 2020, 144, 111684. [Google Scholar] [CrossRef]
- Tsalikis, G.; Martinopoulos, G. ScienceDirect Solar energy systems potential for nearly net zero energy residential buildings. Sol. Energy 2015, 115, 743–756. [Google Scholar] [CrossRef]
- Chang, B.; Starcher, K. Evaluation of wind and solar energy investments in Texas. Renew. Energy 2019, 132, 1348–1359. [Google Scholar] [CrossRef]
- Zhang, M.M.; Zhou, P.; Zhou, D.Q. A real options model for renewable energy investment with application to solar photovoltaic power generation in China. Energy Econ. 2016, 26, 17–21. [Google Scholar] [CrossRef]
- Nojavan, S.; Pashaei-Didani, H.; Saberi, K.; Zare, K. Risk assessment in a central concentrating solar power plant. Sol. Energy 2019, 180, 293–300. [Google Scholar] [CrossRef]
- Fernández Peruchena, C.M.; Ramírez, L.; Silva-Pérez, M.A.; Lara, V.; Bermejo, D.; Gastón, M.; Moreno-Tejera, S.; Pulgar, J.; Liria, J.; Macías, S.; et al. A statistical characterization of the long-term solar resource: Towards risk assessment for solar power projects. Sol. Energy 2016, 123, 29–39. [Google Scholar] [CrossRef]
- Wiesinger, F.; Sutter, F.; Wolfertstetter, F.; Hanrieder, N.; Fernández-García, A.; Pitz-Paal, R.; Schmücker, M. Assessment of the erosion risk of sandstorms on solar energy technology at two sites in Morocco. Sol. Energy 2018, 162, 217–228. [Google Scholar] [CrossRef]
- Ahmad, M.; Jabeen, G.; Irfan, M.; Işık, C.; Rehman, A. Do inward foreign direct investment and economic development improve local environmental quality: Aggregation bias puzzle. Environ. Sci. Pollut. Res. 2021, 34676–34696. [Google Scholar] [CrossRef]
- Işık, C.; Ahmad, M.; Ongan, S.; Ozdemir, D.; Irfan, M.; Alvarado, R. Convergence analysis of the ecological footprint: Theory and empirical evidence from the USMCA countries. Environ. Sci. Pollut. Res. 2021, 28, 32648–32659. [Google Scholar] [CrossRef] [PubMed]
- Isik, C.; Ongan, S.; Ozdemir, D.; Ahmad, M.; Irfan, M.; Alvarado, R.; Ongan, A. The increases and decreases of the environment Kuznets curve (EKC) for 8 OECD countries. Environ. Sci. Pollut. Res. 2021, 28, 28535–28543. [Google Scholar] [CrossRef]
- Irfan, M.; Zhao, Z.Y.; Ahmad, M.; Batool, K.; Jan, A.; Mukeshimana, M.C. Competitive assessment of Indian wind power industry: A five forces model. J. Renew. Sustain. Energy 2019, 11, 063301. [Google Scholar] [CrossRef]
- Irfan, M.; Hao, Y.; Panjwani, M.K.; Khan, D.; Chandio, A.A.; Li, H. Competitive assessment of South Asia’s wind power industry: SWOT analysis and value chain combined model. Energy Strateg. Rev. 2020, 32, 100540. [Google Scholar] [CrossRef]
- Mukherji, R.; Mathur, V.; Bhati, A.; Mukherji, M. Assessment of 50 kWp rooftop solar photovoltaic plant at The ICFAI University, Jaipur: A case study. Environ. Prog. Sustain. Energy 2020, 39, 1–14. [Google Scholar] [CrossRef]
- Zeraatpisheh, M.; Arababadi, R.; Pour, M.S. Economic analysis for residential solar PV systems based on different demand charge tariffs. Energies 2018, 11, 3271. [Google Scholar] [CrossRef]
- Murshed, M.; Abbass, K.; Rashid, S. Modelling renewable energy adoption across south Asian economies: Empirical evidence from Bangladesh, India, Pakistan and Sri Lanka. Int. J. Financ. Econ. 2020, 26, 5425–5450. [Google Scholar] [CrossRef]
- Moncecchi, M.; Meneghello, S.; Merlo, M. A Game Theoretic Approach for Energy Sharing in the Italian Renewable Energy Communities. Appl. Sci. 2020, 10, 8166. [Google Scholar] [CrossRef]
- Shahid, M.; Firoz, N.M.S.; Dadu, M. Risk analysis in implementation of solar energy projects in kerala risk analysis in implementation of solar energy projects in Kerala. In Proceedings of the International Conference on Aerospace and Mechanical Engineering, ICAME’18, Kollam, India, 17–19 December 2019. [Google Scholar]
- Irfan, M.; Shahid, A.L.; Ahmad, M.; Iqbal, W.; Elavarasan, R.M.; Ren, S.; Hussain, A. Assessment of public intention to get vaccination against COVID-19: Evidence from a developing country. J. Eval. Clin. Pract. 2021, 1–11. [Google Scholar] [CrossRef] [PubMed]
- Irfan, M.; Akhtar, N.; Ahmad, M.; Shahzad, F.; Elavarasan, R.M.; Wu, H.; Yang, C. Assessing public willingness to wear face masks during the COVID-19 pandemic: Fresh insights from the theory of planned behavior. Int. J. Environ. Res. Public Health 2021, 18, 4577. [Google Scholar] [CrossRef] [PubMed]
- Irfan, M.; Ikram, M.; Ahmad, M.; Wu, H.; Hao, Y. Does temperature matter for COVID-19 transmissibility? Evidence across Pakistani provinces. Environ. Sci. Pollut. Res. 2021, 28, 59705–59719. [Google Scholar] [CrossRef]
- Ahmad, M.; Akhtar, N.; Jabeen, G.; Irfan, M.; Anser, M.K.; Wu, H.; Isek, C. Intention-based critical factors affecting willingness to adopt Novel Coronavirus prevention in Pakistan: Implications for future pandemics. Int. J. Environ. Res. Public Health 2021, 18, 6167. [Google Scholar] [CrossRef]
- Calder, B.J.; Phillips, L.W.; Tybout, A.M. Designing Research for Application. J. Consum. Res. 1981, 8, 197. [Google Scholar] [CrossRef]
- Ozawa, A.; Kudoh, Y.; Yoshida, Y. A new method for household energy use modeling: A questionnaire-based approach. Energy Build. 2018, 162, 32–41. [Google Scholar] [CrossRef]
- Bennouna, K.; Meredith, G.G.; Marchant, T. Improved capital budgeting decision making: Evidence from Canada. Manag. Decis. 2010, 48, 225–247. [Google Scholar] [CrossRef]
- Lu, Y.; Chang, R.; Shabunko, V.; Lay Yee, A.T. The implementation of building-integrated photovoltaics in Singapore: Drivers versus barriers. Energy 2019, 168, 400–408. [Google Scholar] [CrossRef]
- Zhang, X.; Shen, L.; Chan, S.Y. The diffusion of solar energy use in HK: What are the barriers? Energy Policy 2012, 41, 241–249. [Google Scholar] [CrossRef]
- Braunholtz-Speight, T.; Sharmina, M.; Manderson, E.; McLachlan, C.; Hannon, M.; Hardy, J.; Mander, S. Business models and financial characteristics of community energy in the UK. Nat. Energy 2020, 5, 169–177. [Google Scholar] [CrossRef]
- Irfan, M.; Elavarasan, R.M.; Hao, Y.; Feng, M.; Sailan, D. An assessment of consumers’ willingness to utilize solar energy in China: End-users’ perspective. J. Clean. Prod. 2021, 292, 126008. [Google Scholar] [CrossRef]
- Urbach, N.; Ahlemann, F. Structural Equation Modeling in Information Systems Research Using Partial Least Squares. J. Inf. Technol. Theory Appl. 2010, 11, 5–40. [Google Scholar]
- Hair, J.F.; Sarstedt, M.; Ringle, C.M. Rethinking some of the rethinking of partial least squares. Eur. J. Mark. 2019, 53, 566–584. [Google Scholar] [CrossRef]
- Ying, M.; Faraz, N.A.; Ahmed, F.; Raza, A. How does servant leadership foster employees’ voluntary green behavior? A sequential mediation model. Int. J. Environ. Res. Public Health 2020, 17, 1792. [Google Scholar] [CrossRef]
- Henseler, J.; Ringle, C.M.; Sarstedt, M. A new criterion for assessing discriminant validity in variance-based structural equation modeling. J. Acad. Mark. Sci. 2015, 43, 115–135. [Google Scholar] [CrossRef]
- Franziska, R.N.; Carrion, G.C.; Roldán, J.L.; Ringle, C.M. European management research using partial least squares structural equation modeling (PLS-SEM). Eur. Manag. J. 2016, 34, 589–597. [Google Scholar]
- Chin, W.; Newsted, P.R. Structural equation modeling analysis with small samples using partial least squares. Stat. Strateg. Small Sample Res. 1999, 1, 307–341. [Google Scholar]
- Ramayah, T.; Ahmad, N.H.; Halim, H.A.; Rohaida, S.; Zainal, M.; Lo, M. Discriminant analysis: An illustrated example. African J. Bus. Manag. 2010, 4, 1654–1667. [Google Scholar] [CrossRef]
- Osborne, J.W. Improving your data transformations: Applying the Box-Cox transformation. Pract. Assess. Res. Eval. 2010, 15, 12. [Google Scholar] [CrossRef]
- Solangi, Y.A.; Shah, S.A.A.; Zameer, H.; Ikram, M.; Saracoglu, B.O. Assessing the solar PV power project site selection in Pakistan: Based on AHP-fuzzy vikor approach. Environ. Sci. Pollut. Res. 2019, 26, 30286–30302. [Google Scholar] [CrossRef] [PubMed]
- Hair, J.F.; Risher, J.J.; Sarstedt, M.; Ringle, C.M. When to use and how to report the results of PLS-SEM. Eur. Bus. Rev. 2019, 31, 2–24. [Google Scholar] [CrossRef]
- Hair, J.F.; Ringle, C.M.; Sarstedt, M. PLS-SEM: Indeed a silver bullet. J. Mark. Theory Pract. 2011, 19, 139–152. [Google Scholar] [CrossRef]
- Hair, J.F.; Sarstedt, M.; Hopkins, L.; Kuppelwieser, V.G. Partial least squares structural equation modeling (PLS-SEM): An emerging tool in business research. Eur. Bus. Rev. 2014, 26, 106–121. [Google Scholar] [CrossRef]
- Arbuckle, J.L. IBM SPSS Amos 20 User’s Guide; Amos Development Corporation, SPSS Inc.: Chicago, IL, USA, 2011. [Google Scholar]
- Anderson, J.C.; Gerbing, D.W. Structural Equation Modeling in Practice: A Review and Recommended Two-Step Approach. Psychol. Bull. 1988, 103, 411–423. [Google Scholar] [CrossRef]
- Akbar, A.; Ali, S.; Ahmad, M.A.; Akbar, M.; Danish, M. Understanding the antecedents of organic food consumption in pakistan: Moderating role of food neophobia. Int. J. Environ. Res. Public Health 2019, 16, 4043. [Google Scholar] [CrossRef]
- Cohen, J. Statistical Power Analysis for the Behavioral Sciences New York; Academic Press: Cambridge, MA, USA, 1988. [Google Scholar]
- Hair, J.F., Jr.; Hult, G.T.M.; Ringle, C.M.; Sarstedt, M. A primer on partial least squares structural equation modeling (PLS-SEM). Sage publications. Eur. J. Tour. Res. 2021, 6, 211–213. [Google Scholar]
- Tu, Q.; Betz, R.; Mo, J.; Fan, Y. The profitability of onshore wind and solar PV power projects in China—A comparative study. Energy Policy 2020, 132, 404–417. [Google Scholar] [CrossRef]
- Urbański, M.; Haque, A.U.; Oino, I. The moderating role of risk management in project planning and project success: Evidence from construction businesses of Pakistan and the UK. Eng. Manag. Prod. Serv. 2019, 11, 23–35. [Google Scholar] [CrossRef]
- Wang, M.; Wang, G.; Sun, Z.; Zhang, Y.; Xu, D. Review of renewable energy-based hydrogen production processes for sustainable energy innovation. Glob. Energy Interconnect. 2020, 2, 436–443. [Google Scholar] [CrossRef]
- Warren, L.; Jack, L. The capital budgeting process and the energy trilemma—A strategic conduct analysis. Br. Account. Rev. 2018, 50, 481–496. [Google Scholar] [CrossRef]
- Yuan, J.; Zhang, Y.; Zhou, L.; Zhang, C.; Lau, T.; Zhang, G.; Lu, X.; Yip, H.; So, S.K.; Beaupré, S.; et al. Fused Benzothiadiazole: A Building Block for n-Type Organic Acceptor to Achieve High-Performance Organic Solar Cells. Adv. Mater. 2019, 1807577, 1–8. [Google Scholar] [CrossRef] [PubMed]
- Zafar, U.; Rashid, T.U.; Khosa, A.A.; Khalil, M.S.; Rashid, M. An overview of implemented renewable energy policy of Pakistan. Renew. Sustain. Energy Rev. 2018, 82, 654–665. [Google Scholar] [CrossRef]


| Sr. No | Company | Project Capacity (MW) | Location |
|---|---|---|---|
| 1 | IPS Solar Park- IPS 22 Pvt. Ltd. | 50 | Nooriabad, Sindh |
| 2 | IPS Solar Park-JA 23 Pvt. Ltd. | 50 | Nooriabad, Sindh |
| 3 | IPS Solar Park-SB 24 Pvt. Ltd. | 50 | Nooriabad, Sindh |
| 4 | Siddiqsons Solar Ltd. | 50 | Kalar Kahar, Chakwal |
| 5 | ET Solar (Pvt.) Ltd. | 50 | Fateh Jang, Attock |
| 6 | ET Solar (Pvt.) Ltd. | 50 | Bahalwalnager, Punjab |
| 7 | ACT Solar Pvt. Ltd. | 50 | Thatta, Sindh |
| 8 | ET Solar Pvt. Ltd. | 25 | Dadu, Sindh |
| 9 | R.E Solar Pvt. Ltd. | 20 | Dadu, Sindh |
| 10 | R.E Solar Pvt. Ltd. | 20 | Dadu, Sindh |
| 11 | Janpur Energy Ltd. | 12 | Sultanabad Rahim Yar Khan |
| 12 | Lalpir Solar Ltd. | 12 | Mehmood Kot, Muzafar garh |
| Constructs | Items | Loadings | Alpha | CR | AVE |
|---|---|---|---|---|---|
| Cost and riskiness of methods | CRM1 | 0.886 | 0.845 | 0.820 | 0.536 |
| CRM2 | 0.669 | ||||
| CRM3 | 0.676 | ||||
| CRM4 | 0.675 | ||||
| Financial performance of solar power project | FPSPP1 | 0.809 | 0.889 | 0.918 | 0.692 |
| FPSPP2 | 0.815 | ||||
| FPSPP3 | 0.855 | ||||
| FPSPP4 | 0.815 | ||||
| FPSPP5 | 0.864 | ||||
| Internal rate of return method | IRRM1 | 0.958 | 0.966 | 0.975 | 0.908 |
| IRRM2 | 0.943 | ||||
| IRRM3 | 0.952 | ||||
| IRRM4 | 0.959 | ||||
| Net present value technique | NPVT1 | 0.912 | 0.944 | 0.956 | 0.782 |
| NPVT2 | 0.823 | ||||
| NPVT3 | 0.905 | ||||
| NPVT4 | 0.904 | ||||
| NPVT5 | 0.912 | ||||
| NPVT6 | 0.846 | ||||
| Payback period technique | PBPT1 | 0.880 | 0.909 | 0.936 | 0.785 |
| PBPT2 | 0.879 | ||||
| PBPT3 | 0.888 | ||||
| PBPT4 | 0.896 | ||||
| Profitability index | PI1 | 0.954 | 0.959 | 0.968 | 0.834 |
| PI2 | 0.828 | ||||
| PI3 | 0.952 | ||||
| PI4 | 0.955 | ||||
| PI5 | 0.827 | ||||
| PI6 | 0.954 |
| Factors | CRM | FPSPP | IRRM | NPVT | PBPT | PI |
|---|---|---|---|---|---|---|
| CRM | 0.732 | |||||
| FPSPP | 0.325 | 0.832 | ||||
| IRRM | 0.346 | 0.407 | 0.953 | |||
| NPVT | 0.394 | 0.506 | 0.470 | 0.884 | ||
| PBPT | 0.335 | 0.371 | 0.384 | 0.385 | 0.886 | |
| PI | 0.400 | 0.498 | 0.486 | 0.348 | 0.362 | 0.913 |
| Items | CRM | FPSPP | IRRM | NPVT | PBPT | PI |
|---|---|---|---|---|---|---|
| CRM1 | 0.886 | 0.378 | 0.428 | 0.458 | 0.372 | 0.469 |
| CRM2 | 0.669 | 0.090 | 0.267 | 0.134 | 0.120 | 0.105 |
| CRM3 | 0.676 | 0.099 | 0.264 | 0.081 | 0.109 | 0.102 |
| CRM4 | 0.675 | 0.071 | 0.243 | 0.113 | 0.118 | 0.096 |
| FPSPP1 | 0.334 | 0.809 | 0.378 | 0.473 | 0.295 | 0.493 |
| FPSPP2 | 0.288 | 0.815 | 0.350 | 0.455 | 0.306 | 0.403 |
| FPSPP3 | 0.242 | 0.855 | 0.296 | 0.369 | 0.285 | 0.398 |
| FPSPP4 | 0.214 | 0.815 | 0.330 | 0.392 | 0.335 | 0.359 |
| FPSPP5 | 0.261 | 0.864 | 0.330 | 0.402 | 0.321 | 0.403 |
| IRRM1 | 0.713 | 0.399 | 0.958 | 0.448 | 0.338 | 0.468 |
| IRRM2 | 0.705 | 0.360 | 0.943 | 0.444 | 0.400 | 0.450 |
| IRRM3 | 0.718 | 0.391 | 0.952 | 0.448 | 0.386 | 0.462 |
| IRRM4 | 0.709 | 0.401 | 0.959 | 0.453 | 0.342 | 0.471 |
| NPVT1 | 0.331 | 0.447 | 0.391 | 0.912 | 0.340 | 0.736 |
| NPVT2 | 0.362 | 0.465 | 0.434 | 0.823 | 0.328 | 0.776 |
| NPVT3 | 0.356 | 0.446 | 0.445 | 0.905 | 0.345 | 0.723 |
| NPVT4 | 0.352 | 0.452 | 0.440 | 0.904 | 0.339 | 0.731 |
| NPVT5 | 0.327 | 0.434 | 0.381 | 0.912 | 0.336 | 0.735 |
| NPVT6 | 0.361 | 0.438 | 0.400 | 0.846 | 0.351 | 0.794 |
| PBPT2 | 0.314 | 0.340 | 0.322 | 0.307 | 0.880 | 0.292 |
| PBPT3 | 0.276 | 0.339 | 0.350 | 0.351 | 0.879 | 0.342 |
| PBPT4 | 0.290 | 0.327 | 0.330 | 0.340 | 0.888 | 0.306 |
| PBPT5 | 0.308 | 0.305 | 0.359 | 0.369 | 0.896 | 0.345 |
| PI1 | 0.367 | 0.450 | 0.450 | 0.770 | 0.315 | 0.954 |
| PI2 | 0.353 | 0.463 | 0.429 | 0.775 | 0.359 | 0.828 |
| PI3 | 0.368 | 0.456 | 0.452 | 0.769 | 0.317 | 0.952 |
| PI4 | 0.375 | 0.444 | 0.449 | 0.774 | 0.315 | 0.955 |
| PI5 | 0.352 | 0.459 | 0.430 | 0.775 | 0.360 | 0.827 |
| PI6 | 0.368 | 0.449 | 0.446 | 0.772 | 0.312 | 0.954 |
| Variables | CRM | FPSPP | IRRM | NPVT | PBPT | PI |
|---|---|---|---|---|---|---|
| CRM | ||||||
| FPSPP | 0.220 | |||||
| IRRM | 0.537 | 0.436 | ||||
| NPVT | 0.266 | 0.548 | 0.492 | |||
| PBPT | 0.249 | 0.411 | 0.411 | 0.416 | ||
| PI | 0.259 | 0.535 | 0.504 | 0.389 | 0.388 |
| Hypotheses | Relationships | β | S. D | T-Statistics | p-Value | Supported | R2 | Q2 | F2 |
|---|---|---|---|---|---|---|---|---|---|
| H1 | NPVT → FPSPP | 0.222 | 0.207 | 2.331 | 0.011 | Yes | 0.458 | 0.245 | 0.096 |
| H2 | IRRM → FPSPP | 0.205 | 0.201 | 2.552 | 0.006 | Yes | 0.241 | 0.043 | |
| H3 | PBPT → FPSPP | 0.232 | 0.237 | 2.303 | 0.012 | Yes | 0.111 | ||
| H4 | PI → FPSPP | 0.070 | 0.073 | 0.639 | 0.062 | Yes | 0.021 | ||
| H5 | NPVT * CRM → FPSPP | 0.202 | 0.197 | 3.441 | 0.000 | Yes | 0.041 | ||
| H6 | IRRM * CRM → FPSPP | 0.090 | 0.088 | 1.660 | 0.074 | Yes | 0.015 | ||
| H7 | PBPT * CRM → FPSPP | 0.119 | 0.131 | 1.408 | 0.081 | No | 0.031 | ||
| H8 | PI * CRM → FPSPP | 0.216 | −0.209 | 1.917 | 0.029 | Yes | 0.481 | 0.026 |
Publisher’s Note: MDPI stays neutral with regard to jurisdictional claims in published maps and institutional affiliations. |
© 2021 by the authors. Licensee MDPI, Basel, Switzerland. This article is an open access article distributed under the terms and conditions of the Creative Commons Attribution (CC BY) license (https://creativecommons.org/licenses/by/4.0/).
Share and Cite
Ali, S.; Yan, Q.; Sajjad Hussain, M.; Irfan, M.; Ahmad, M.; Razzaq, A.; Dagar, V.; Işık, C. Evaluating Green Technology Strategies for the Sustainable Development of Solar Power Projects: Evidence from Pakistan. Sustainability 2021, 13, 12997. https://doi.org/10.3390/su132312997
Ali S, Yan Q, Sajjad Hussain M, Irfan M, Ahmad M, Razzaq A, Dagar V, Işık C. Evaluating Green Technology Strategies for the Sustainable Development of Solar Power Projects: Evidence from Pakistan. Sustainability. 2021; 13(23):12997. https://doi.org/10.3390/su132312997
Chicago/Turabian StyleAli, Shahid, Qingyou Yan, Muhammad Sajjad Hussain, Muhammad Irfan, Munir Ahmad, Asif Razzaq, Vishal Dagar, and Cem Işık. 2021. "Evaluating Green Technology Strategies for the Sustainable Development of Solar Power Projects: Evidence from Pakistan" Sustainability 13, no. 23: 12997. https://doi.org/10.3390/su132312997
APA StyleAli, S., Yan, Q., Sajjad Hussain, M., Irfan, M., Ahmad, M., Razzaq, A., Dagar, V., & Işık, C. (2021). Evaluating Green Technology Strategies for the Sustainable Development of Solar Power Projects: Evidence from Pakistan. Sustainability, 13(23), 12997. https://doi.org/10.3390/su132312997