Article

Carbon Impact and Cost of Mass Timber Beam–Column Gravity Systems

1
Independent Researcher, 1717 Washington Avenue, Golden, CO 80401, USA
2
Department of Civil and Environmental Engineering, Colorado School of Mines, Golden, CO 80401, USA
*
Author to whom correspondence should be addressed.
Sustainability 2021, 13(23), 12966; https://doi.org/10.3390/su132312966
Submission received: 12 October 2021 / Revised: 9 November 2021 / Accepted: 12 November 2021 / Published: 23 November 2021
(This article belongs to the Special Issue Mass Timber and Sustainable Building Construction)

Abstract

:
The need to lower the embodied carbon impact of the built environment and sequester carbon over the life of buildings has spurred the growth of mass timber building construction, leading to the introduction of new building types (Types IV-A, B, and C) in the 2021 International Building Code (IBC). The achievement of sustainability goals has been hindered by the perceived first cost assessment of mass timber systems. Optimizing cost is an urgent prerequisite to embodied carbon reduction. Due to a high level of prefabrication and reduction in field labor, the mass timber material volume constitutes a larger portion of total project cost when compared to buildings with traditional materials. In this study, the dollar cost, carbon emitted, and carbon sequestered of mass timber beam–column gravity system solutions with different design configurations was studied. Design parameters studied in this sensitivity analysis included viable building types, column grid dimension, and building height. A scenario study was conducted to estimate the economic viability of tall wood buildings with respect to land costs. It is concluded that, while Type III building designations are the most economical for lower building heights, the newly introduced Type IV subcategories remain competitive for taller structures while providing a potentially significant embodied carbon benefit.

1. Introduction

The need to lower the embodied carbon impact of the built environment, and even sequestering carbon over the life of buildings, has spurred the growth of mass timber building construction, leading to the rapid introduction of new building types into practice. In 2017, the buildings and construction industry accounted for 36% of global energy use and 39% of carbon dioxide emissions from energy use [1]. The buildings and construction sector impacts the environment in both the operational use of the building and the construction of the building. The construction of the building includes the materials selected and contributes to the “embodied carbon” of a building. Mass timber buildings can be thought of as a “carbon sink,” as wood naturally sequesters carbon [2]. Timber emits less carbon dioxide when manufactured and stores more carbon compared to steel and cement [2]. However, the achievement of sustainability goals has been hindered by the perceived first cost assessment of mass timber systems. Optimizing cost is thus an urgent prerequisite to embodied carbon reduction. This study focused on the cost optimization of mass timber beam–columns systems for this purpose.
Invented in Europe in the 1990’s, cross laminated timber (CLT) has been among the fastest growing and most versatile mass timber products. CLT panels can serve as both wall and floor planar elements in a building, which makes it possible to construct an open floorplan completely out of mass timber products (i.e., glulam beams and columns with CLT diaphragm). Beginning in 2010, APA—The Engineered Wood Association and FPInnovations created the first performance-based standard for CLT [3]. First published in 2012, the ANSI/APA PRG320 provides seven stress classes for CLT. The fire performance of CLT has also been studied in recent years. Unprotected CLT floor assemblies were tested for fire performance in an effort to provide more evidence for the approval of taller mass timber building in the U.S. [4]. Following advancements in mass timber fire engineering analysis and testing, three new building types, namely Type IV-A, IV-B, and IV-C, were introduced to the 2021 International Building Code (IBC). These new code provisions allow for mass timber buildings to be built up to 18 stories with a range of fire protection requirements [5]. While these new tall wood building types will be allowed by IBC once the new provisions go into effect, the cost implications of these added construction types have not been extensively examined and compared to existing building types. The cost of mass timber construction has its unique characteristics when compared to steel and concrete construction. Some general cost trends were understood through limited experience. For example, mass timber construction has a faster speed of construction due to a high level of prefabrication, and wood material cost consists of a larger portion of building cost when compared to steel and concrete material. Mallo and Espinoza have also reported this consensus among CLT experts of the speed of mass timber construction and the economic benefits that derive from it [6]. A detailed and systematic understanding of the effect of design decisions (such as gravity column grid sizes and IBC building type designation) on cost is available to the design community. Specifically, the beam–column grid sizes will affect member and floor panel sizing (which affects total wood volume), and IBC building type will dictate fire-protection requirements. Both factors are known to affect cost greatly.
There have been comparative case studies of the cost of mass timber buildings and steel and/or concrete equivalents. A fine arts theater in California was analyzed as a mass timber framed building and as a steel/concrete framed building, and it was found that the mass timber option resulted in shorter construction times and less overall building cost [7]. The Political, Economic, Social, Technological, Environmental, and Legal (PESTEL) model was used to evaluate mass timber construction, resulting in savings in cost and environmental impacts of mass timber construction [8]. However, there is a need to understand general trends of the cost of mass timber construction with respect to design choices. In this study, a systematic cost sensitivity analysis was conducted for mass timber beam–column gravity systems with different geometrical configurations and IBC building types. Through the help of an automatic design and cost-estimation tool developed in an earlier study [9], this study seeks to investigate unit square-foot costs for common and viable (i.e., practical) ranges of beam–column grid sizes at various building heights, and with different CLT floor thicknesses. The earlier study found that the costliest component in the mass timber gravity system is the wood material, the thickness of CLT being the most sensitive parameter [9]. Additional wood and/or gypsum board for fire protection can also be a source of major cost [9]. The most economical building type for a six-story mass timber building was found to be Type III-A [9]. There is currently no systemic study on mass timber gravity system cost effectiveness as a function of design parameters and building types. The same tool was used to make estimates of the impact of different configurations on embodied carbon and biogenic carbon content.
Thousands of mass timber beam–column gravity systems were designed and priced using the automated design algorithm based on allowable stress design criteria in the American Wood Council National Design Specification for Wood Construction (NDS) [10]. Serviceability requirements (deflection and stiffness) and the fire-resistance rating (FRR) for the different building types were also included based on the IBC (fire design was conducted per NDS) [11]. The cost estimation includes the cost of materials (timber, connection hardware, non-combustible protection) and an approximation of installation costs (included in the unit cost parameter).

2. Materials and Methods

The mass timber gravity system investigated in this study is represented by a typical bay of glulam beam–column grids with CLT panels as the floor or roof, as shown in Figure 1. In a real project, this archetype grid will be replicated throughout most of the building floor. The bay dimensions (b and d shown in Figure 1) are typically determined in architectural design to accommodate interior space applications. When needed, intermediate beams can be used, since the spanning capacity of CLT panels is limited due to their strength and serviceability limits. When the column grid size is small, those intermediate beams will not be necessary. Aside from mass timber components, a large cost component for the mass timber gravity system includes steel fasteners and hardware for column splices, beam–column connections, and beam-girder connections. These connections are typically custom-designed, and their costs depend on their load capacity and fire protection requirements.
Only gravity loading was considered in this study, which includes live and dead loads (detailed loading values are described in later sections). The serviceability check includes a deflection limit of L/360 for the live loads and L/240 for the total load, as per IBC Table 1604.3 [11].
Even with the same loading conditions and grid geometry, mass timber gravity system design can be different depending on the IBC building types implemented. Depending on the intended building height and usage, it is possible to design mass timber buildings with the following IBC Types: III-A, III-B, IV-A, IV-B, IV-C, and IV-HT. A brief summary of the height and fire resistance rating (FRR) requirements for these types is listed in Table 1. FRR requirements and the need for non-combustible protection (Type IV-A and Type IV-B) can influence the cost of the system significantly. For example, although additional gypsum board layers required by Type IV-A construction could increase construction cost, the ability to reduce the floor CLT panel from 5-ply to 3-ply may make some floor geometries cost-competitive when compared to the Type IV-B case with exposed CLT ceiling. These trade-off conditions, combined with different panel and beam spanning capacities, makes mass timber cost estimation complicated. It is hypothesized in this study that there should exist optimal solutions for different building heights, IBC building types, and column grid geometry.

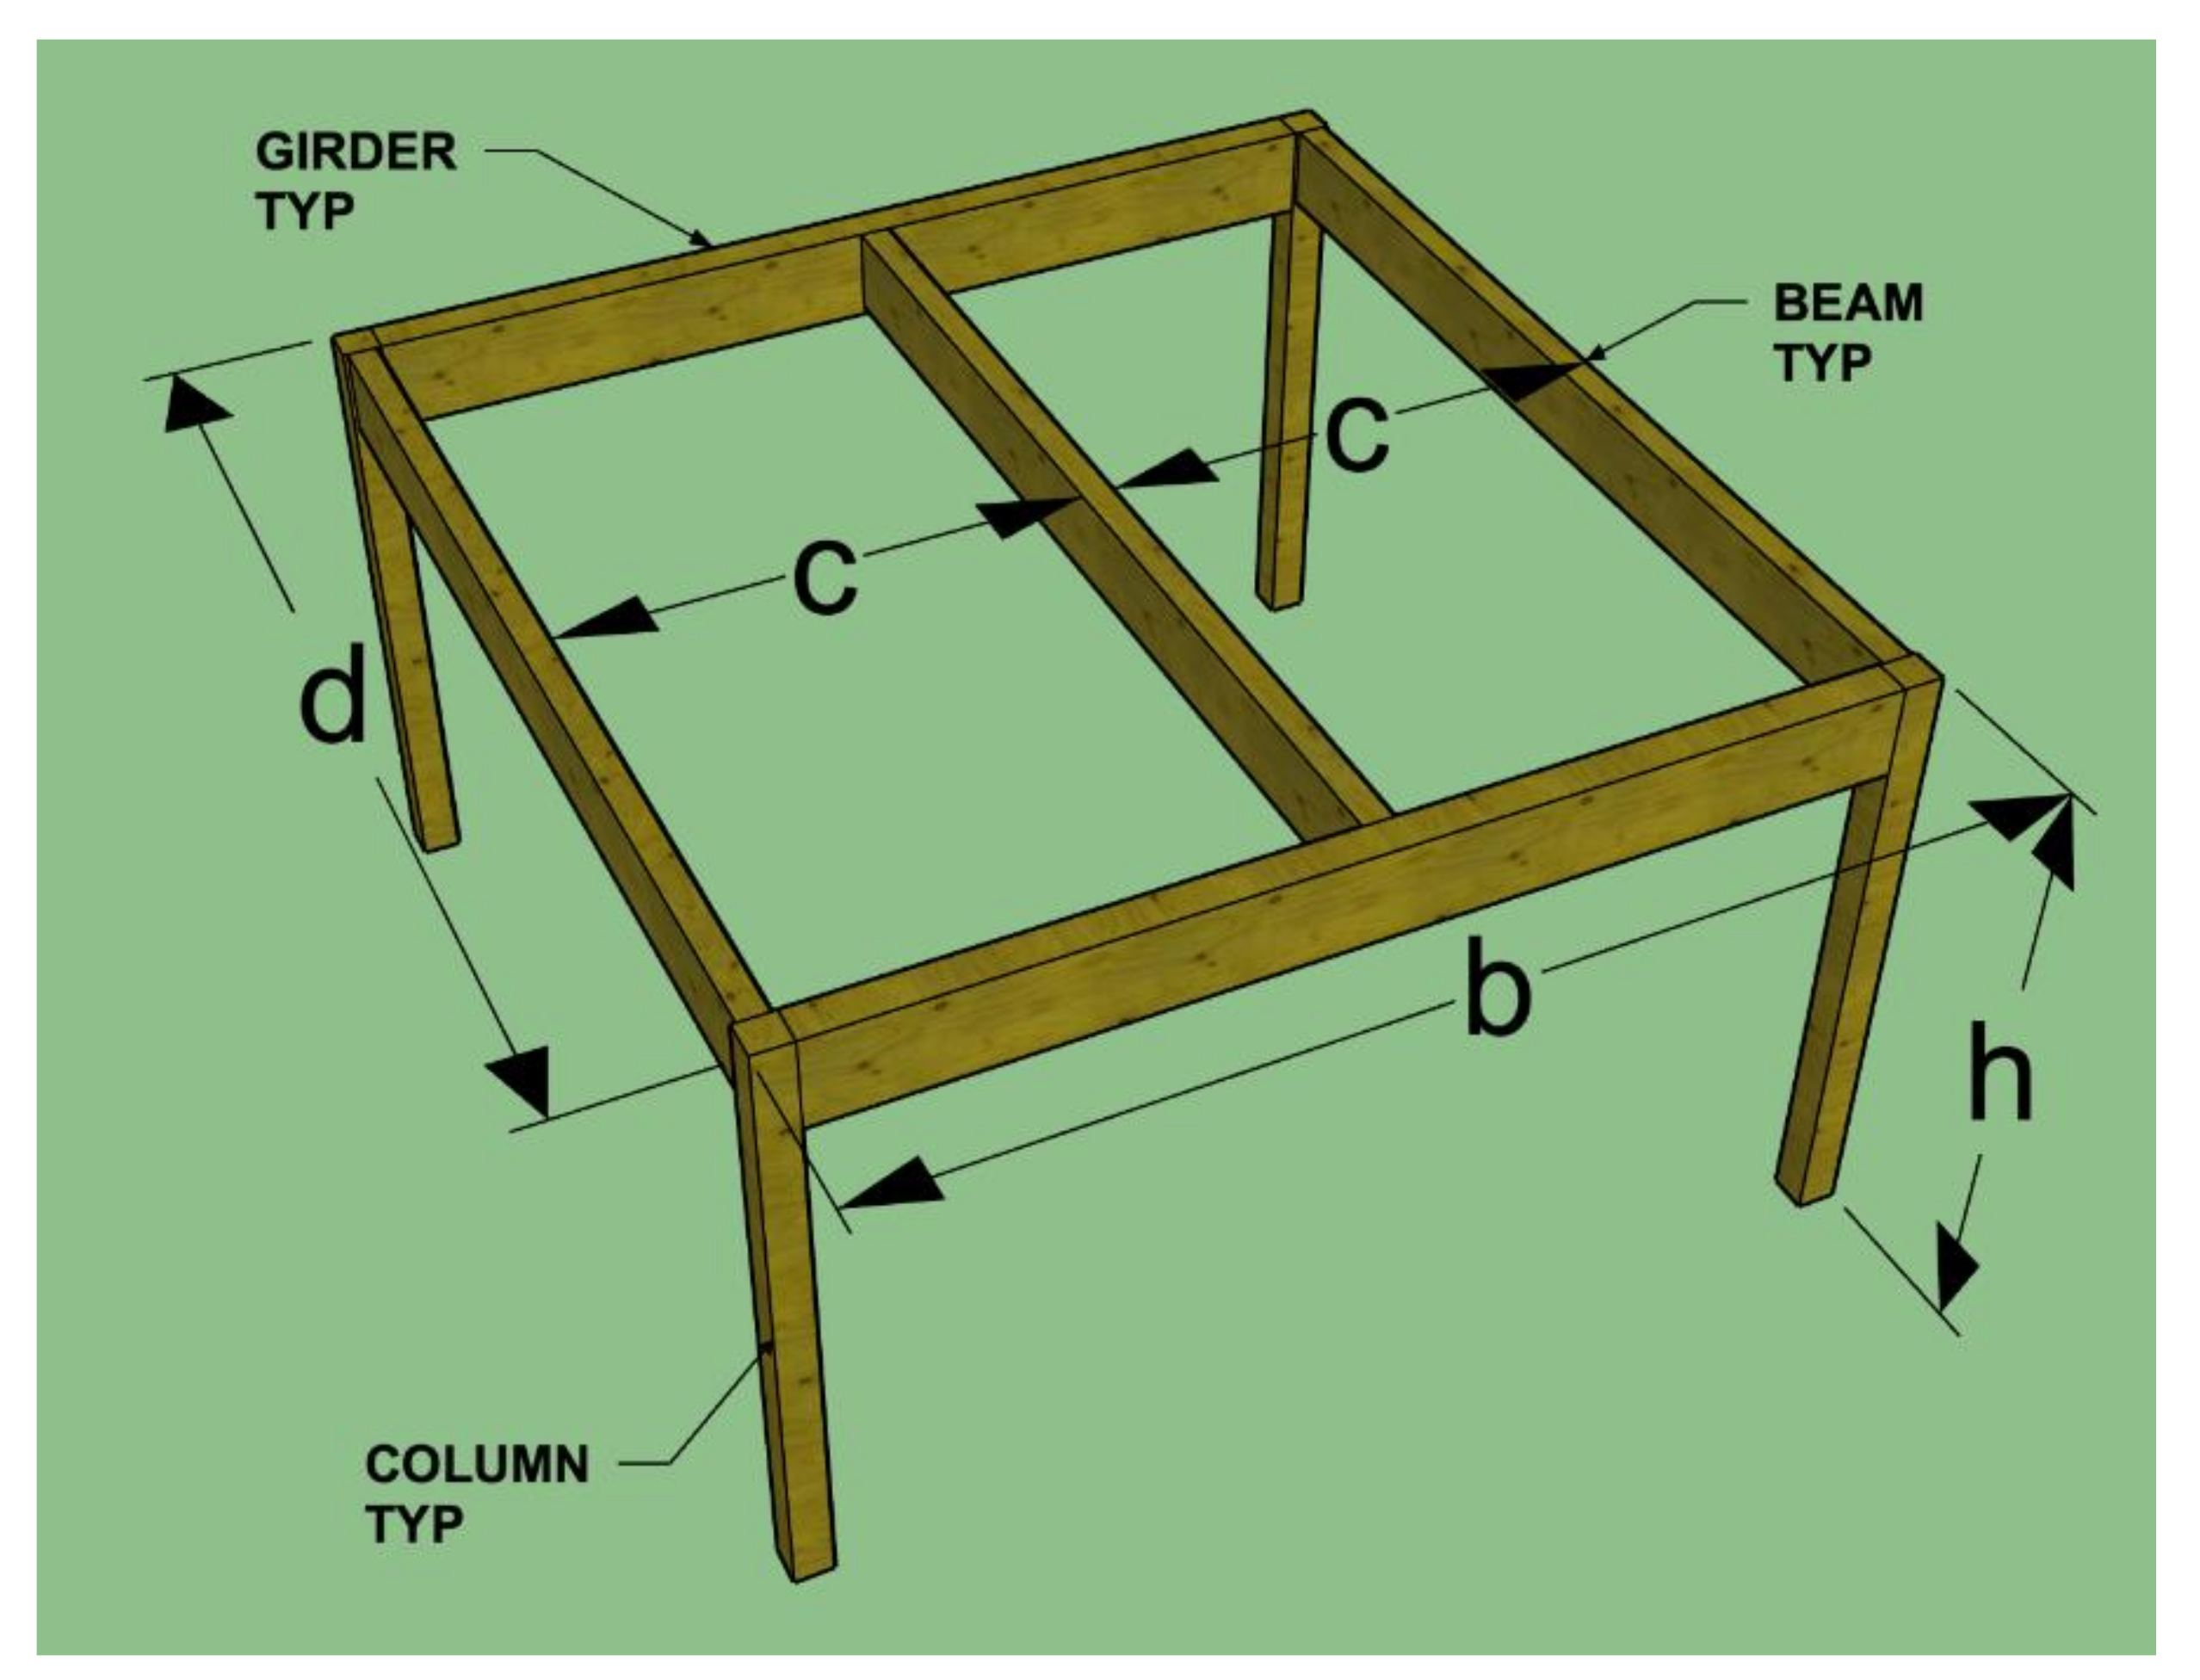
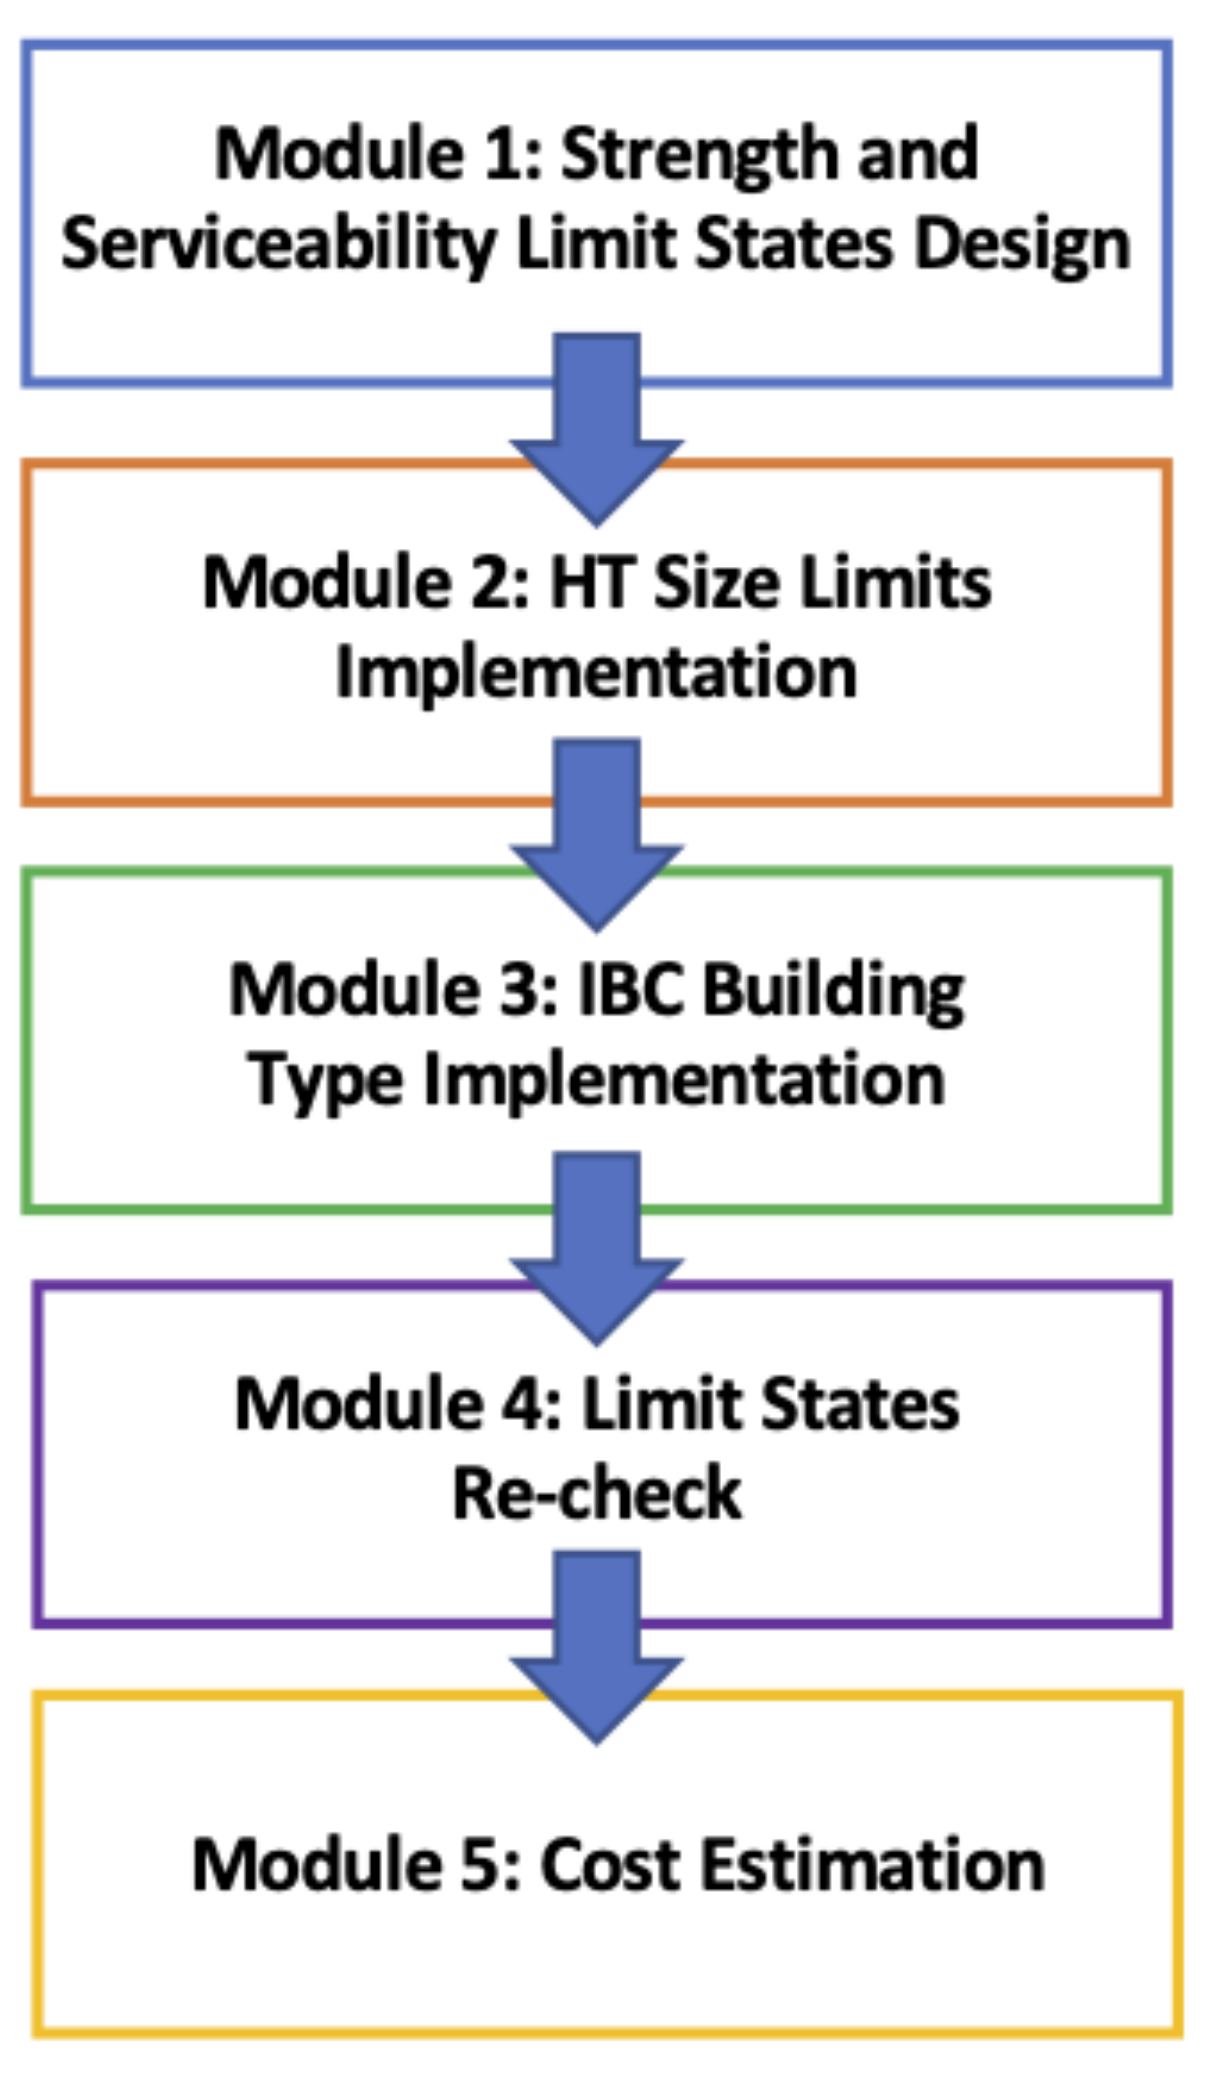
Automated Design and Cost Estimation Process

As mentioned in previous sections, the automated design and cost estimation approach used in this study was developed by the authors in an earlier study. Detailed description of the approach and process can be found in [9] for interested readers. A brief summary of this process and representative cost data used for this study is provided in this section.
The automated design process of the typical bay includes five major modules, shown in Figure 2. The process starts with Module 1, which generates designs of all viable building types for a given column grid geometry (i.e., different exposure and FRR requirements). The height of the bay (h), the length of the bay (b), and the width of the bay (d) are inputs for the program by the user (or are generated with an automatic loop in this sensitivity study). When needed, a secondary beam is added (with maximum spacing c) automatically depending on the span capacity of the selected CLT panel. Three commonly used CLT floor panel thickness options (3-ply, 5-ply, and 7-ply) were considered in this module. Based on building type, fire design was implemented on exposed mass timber members to include sacrificial wood layers. In Module 2, all of the generated design configurations were checked against the mandatory HT size requirements (IBC Table 2304.11). If the member size is less than the required minimum size, it is increased to meet the requirement. Module 3 verifies that the building height and stories satisfy IBC building type limits (an error message will be produced if the input violates IBC). Module 4 updates the dead load from the actual self-weight of the members and fire proofing boards, then the process will loop back to repeat strength and serviceability limit state checks implemented in Module 1 and refines the member sizes if need be. This step is needed because the dead load used in Module 1 is approximate and may be changed in Module 2. Finally, the cost of each viable design option is calculated using unit-price (including approximate installation cost) and quantity in Module 5. The final costs are normalized using the area of the building.
The cost estimation module relies on accurate estimation of unit material costs to generate total building costs. In this study, only the cost of structural components (wood components and connection hardware) and fire-proofing gypsum boards were considered. All the unit costs used also include a rough estimation of the installation cost.
The unit cost of the CLT and glulam depends on how close the manufacturer’s equipment set up can be matched with the required size of CLT on a project. Because CLT is cut from a master panel, which varies by manufacturer depending on the press lengths adopted for production, some of the cut lengths will result in more waste and thus higher unit cost. This relationship of cost to pre-set master panel press lengths can be seen in Figure 3 (an example for press lengths of 5.6 m (18.5 ft), 6.58 m (21.6 ft), 7.53 m (24.7 ft), and 9.39 m (30.8 ft) is used). To calculate the cost of the CLT, the unit cost in Figure 3 is multiplied by the square footage of CLT. The unit cost of glulam beams and columns generally increases with the width of the member, as shown in Figure 4. This unit cost also includes an estimation of installation costs. To calculate the cost of the glulam, the unit costs shown in Figure 4 are multiplied by the volume of glulam. Currently, mass timber beam–column connections have not been standardized for the U.S. market. Thus, the unit cost for the connections used in this study is assumed to be a function of connection capacity. Based on design experience, the unit connection cost was assumed to follow a price curve shown in Figure 5 and Figure 6 for beam–column and column–column connections. There are three different classes used in the automated design program. These classes mainly differ from each other in the detailing style. The unit cost of these connections within each class differs based on their capacity and size. The total cost of the connections is found by multiplying the unit cost by the number of connections needed. To calculate the cost of Type X 1.6 cm (5/8 in) gypsum board, a rate of $3.9/sf was used. A more detailed description of these adopted unit prices and connection classes can be found in [9].
It should be noted that the unit costs used here were approximated based on the North American market at the time of this study and will only serve the purpose of the sensitivity study. Since the sensitivity study was focused on relative cost comparison between different design configurations, the findings from this comparison will remain relevant if the same set of unit costs was used for all analysis cases. Because the mass timber market in North America is still experiencing rapid evolution, the actual unit cost of these materials will be constantly changing in the future due to market supply and demand fluctuations.
To quantify the Global Warming Potential (GWP) of each system, a very simple volumetric relationship was used to apply data from industry Environmental Product Declarations (EPDs) to the three building products included in the analyses in this study (Table 2). GWP is a unit of measurement that represents all greenhouse gas emission impacts resulting from building components and materials, also known as embodied carbon, represented as kgCO2e. Because the goal was to establish approximate relative values between systems, without comparison to other structural material systems, it was only necessary that the assumed values be consistent relative to one another. The EPDs used consider the GWP of Stages A1–A3, as well as resource extraction through product manufacturing.
Biogenic carbon was also considered in this comparative study, to understand the relationship of fire rating to GWP. Trees continuously uptake carbon from the atmosphere through photosynthesis and release carbon through decomposition or burning. This is known as the biogenic carbon cycle. The sequestered carbon within trees, which is temporally stored within the manufactured wood products, is known as biogenic carbon and is represented by a negative GWP impact (uptake). To quantify the biogenic carbon for the thousands of design alternates studied, the simple, physics-based equation defined in ISO 14067 was adopted [12]:
k g C O 2 e b i o = 0.5 × m × 1 M C 100 44 12
where (kgCO2e)bio is the total kgCO2e of biogenic carbon physically stored in the wood product, m is the total mass of wood (kg), and MC is the moisture content of the wood product in whole-number percent. Typically, wood products are seasoned to 12% moisture content, and therefore MC = 12 is assumed. The ratio of 44/12 is included to convert elemental carbon stored in the wood to the carbon dioxide equivalent.
Per ISO 21930, impacts of biogenic carbon cannot be counted unless all product stages (A–D, cradle-to-grave) are considered in addressing the release of the sequestered carbon at end-of-life. Within this study, biogenic carbon is presented separately from the GWP impacts of Stages A1–A3.

3. Results

3.1. Sensitivity Analysis Cases

In order to understand how the bay dimensions, building height, and IBC building type designation impact the overall cost of mass timber gravity systems, the unit cost per square foot of useable area is found for a series of building configurations using the automated tool. This study investigated a total of 16 building configurations as shown in Table 3. The maximum floor to floor (FTF) height listed in the table was calculated based on the total building height limit imposed by IBC. For each building height, all viable IBC building type designations were considered. All these building configurations were designed using the same glulam grade (2.4F-1.8E) for beams and columns. The CLT panel grade was assumed to be V2, as in APA-PRG 320. The bay dimensions for each configuration were varied from 20 to 30 ft with 0.5 ft increments (a total of 21 design cases for each configuration). The design loads used for all cases were the same and are listed in Table 4.

3.2. Sensitivity Analysis Results

The relationship between design decisions and the cost of mass timber buildings is dynamic and complicated. A total of 17 analyses were conducted in this study, including all possible building types in representative building heights, with commonly adopted grid dimensions. In the following sections, the results from these analyses were organized to illustrate general trends in mass timber building costs, cost competitiveness of different building types at different story heights, the overall most economical options, the cost-effectiveness of tall wood buildings within the context of land price, and, finally, the embodied and biogenic carbon impact of each wood system.

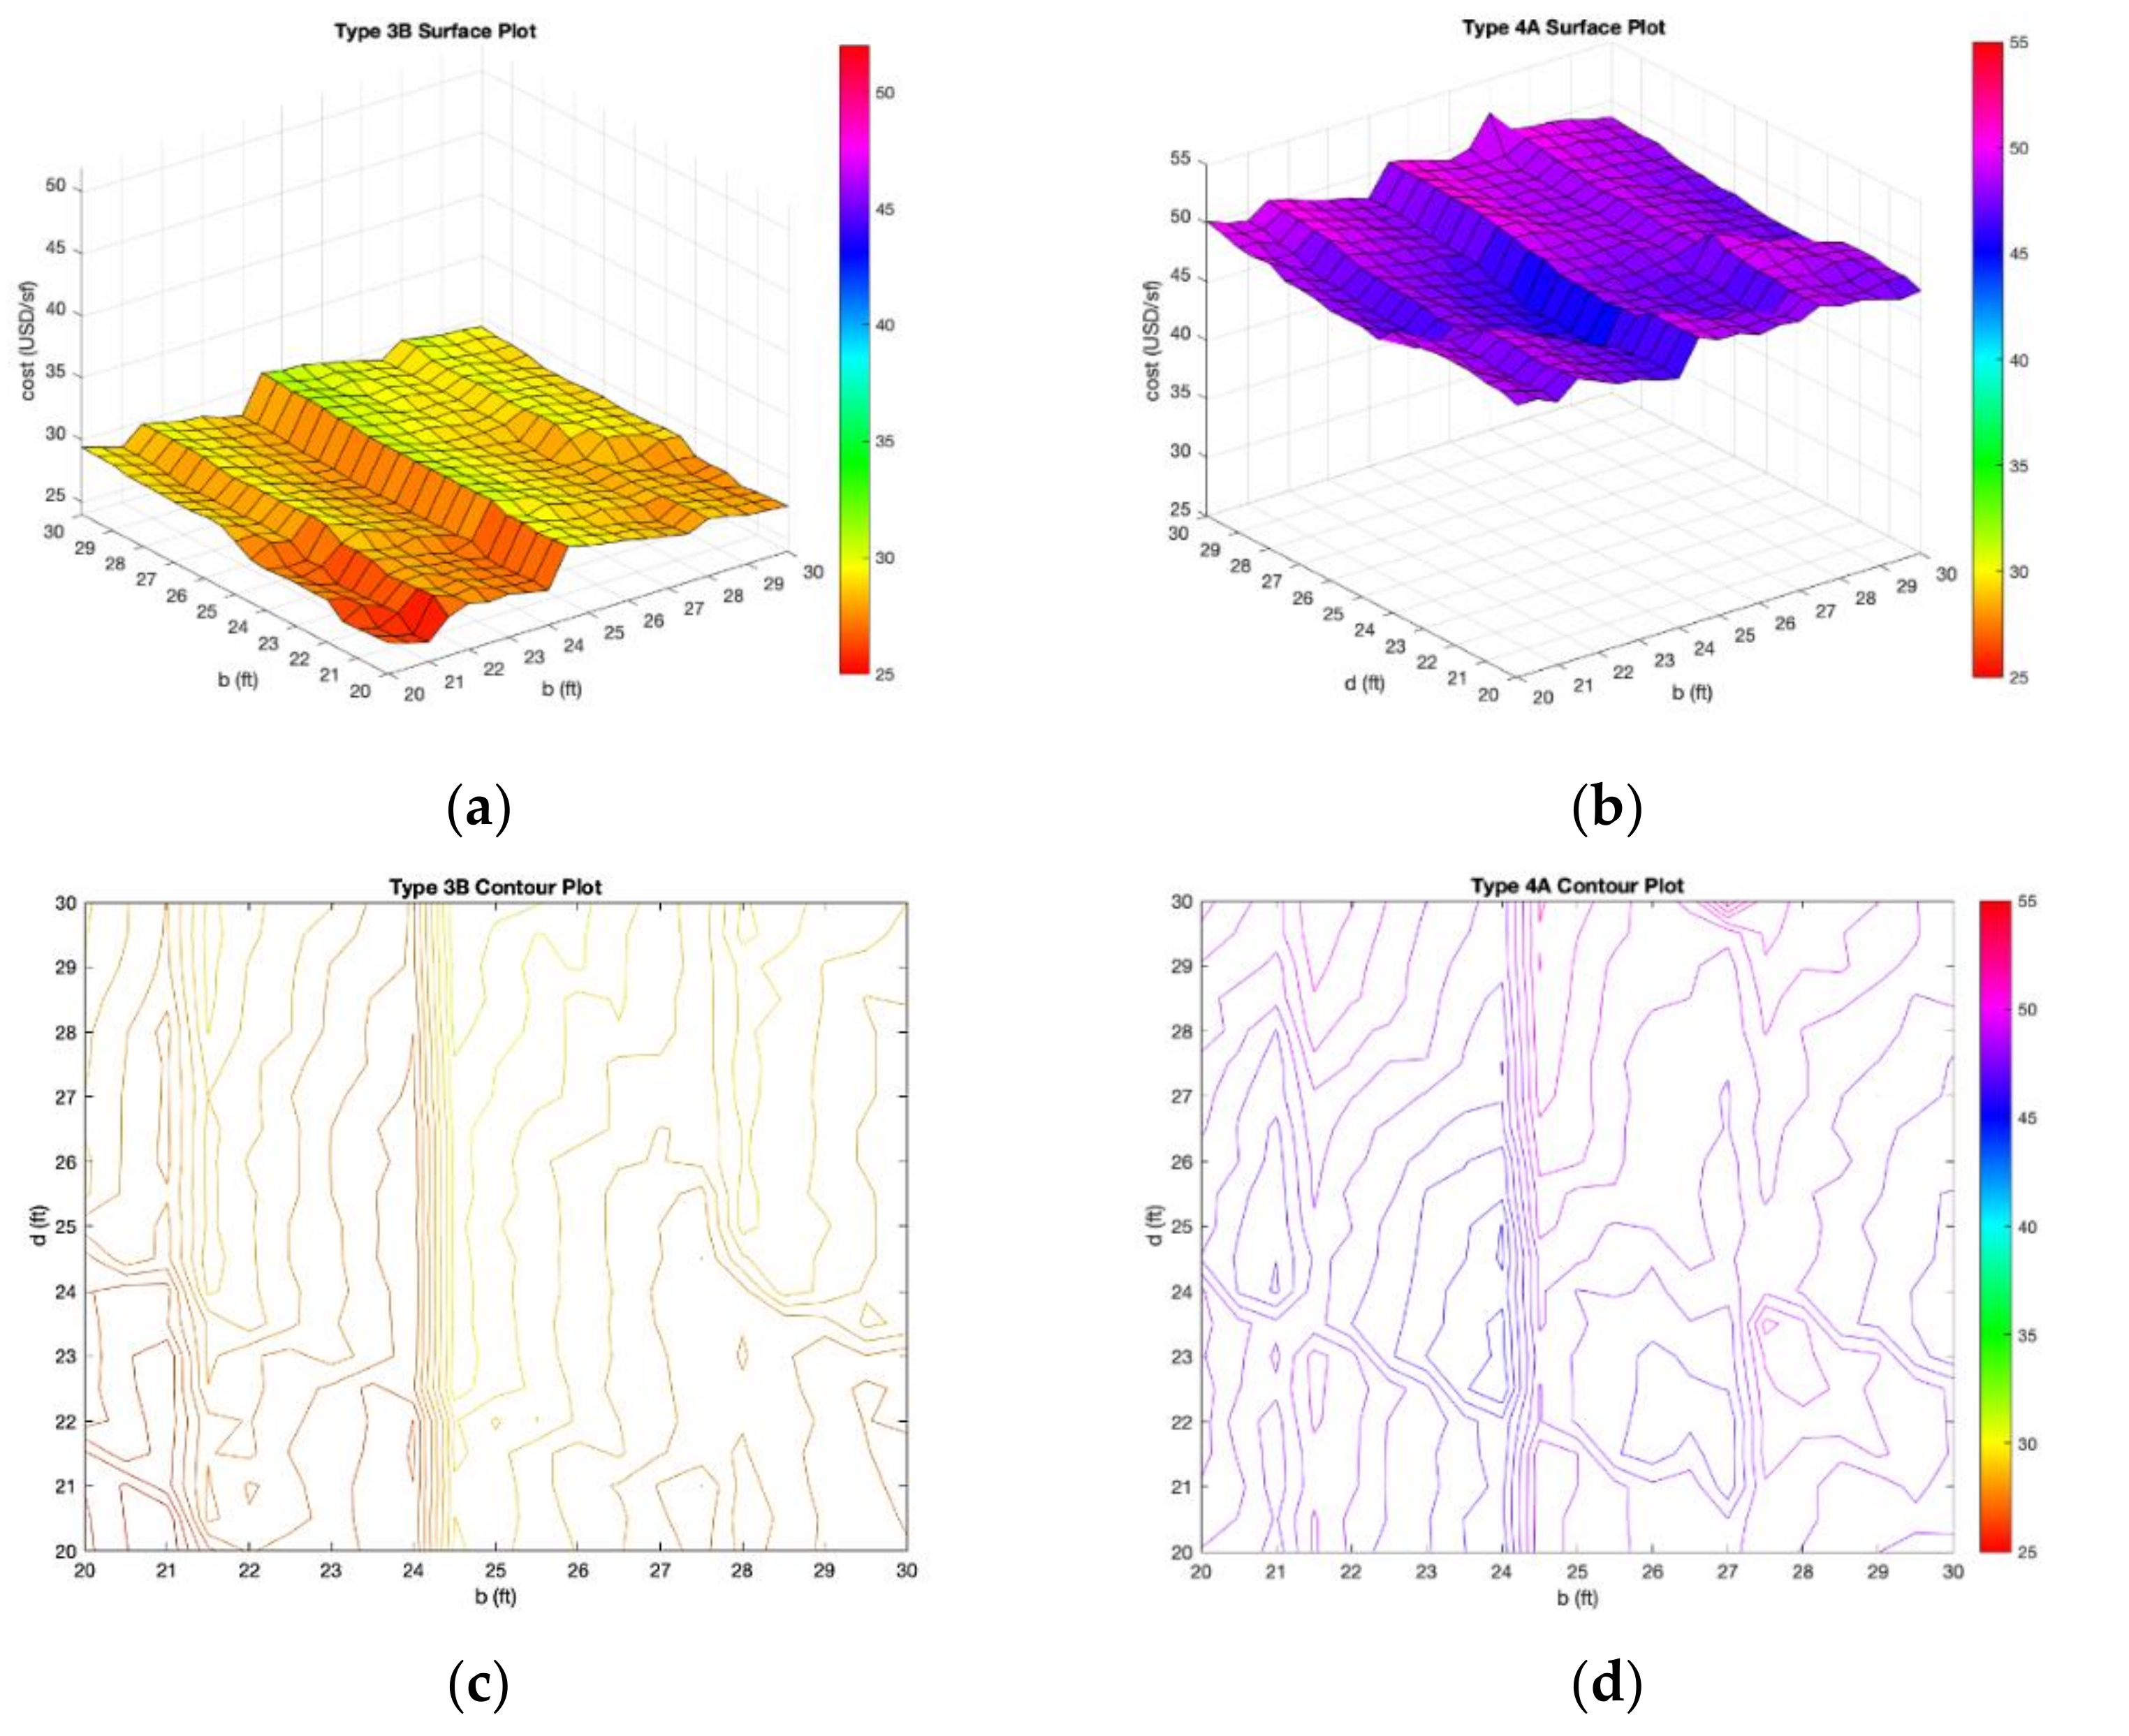
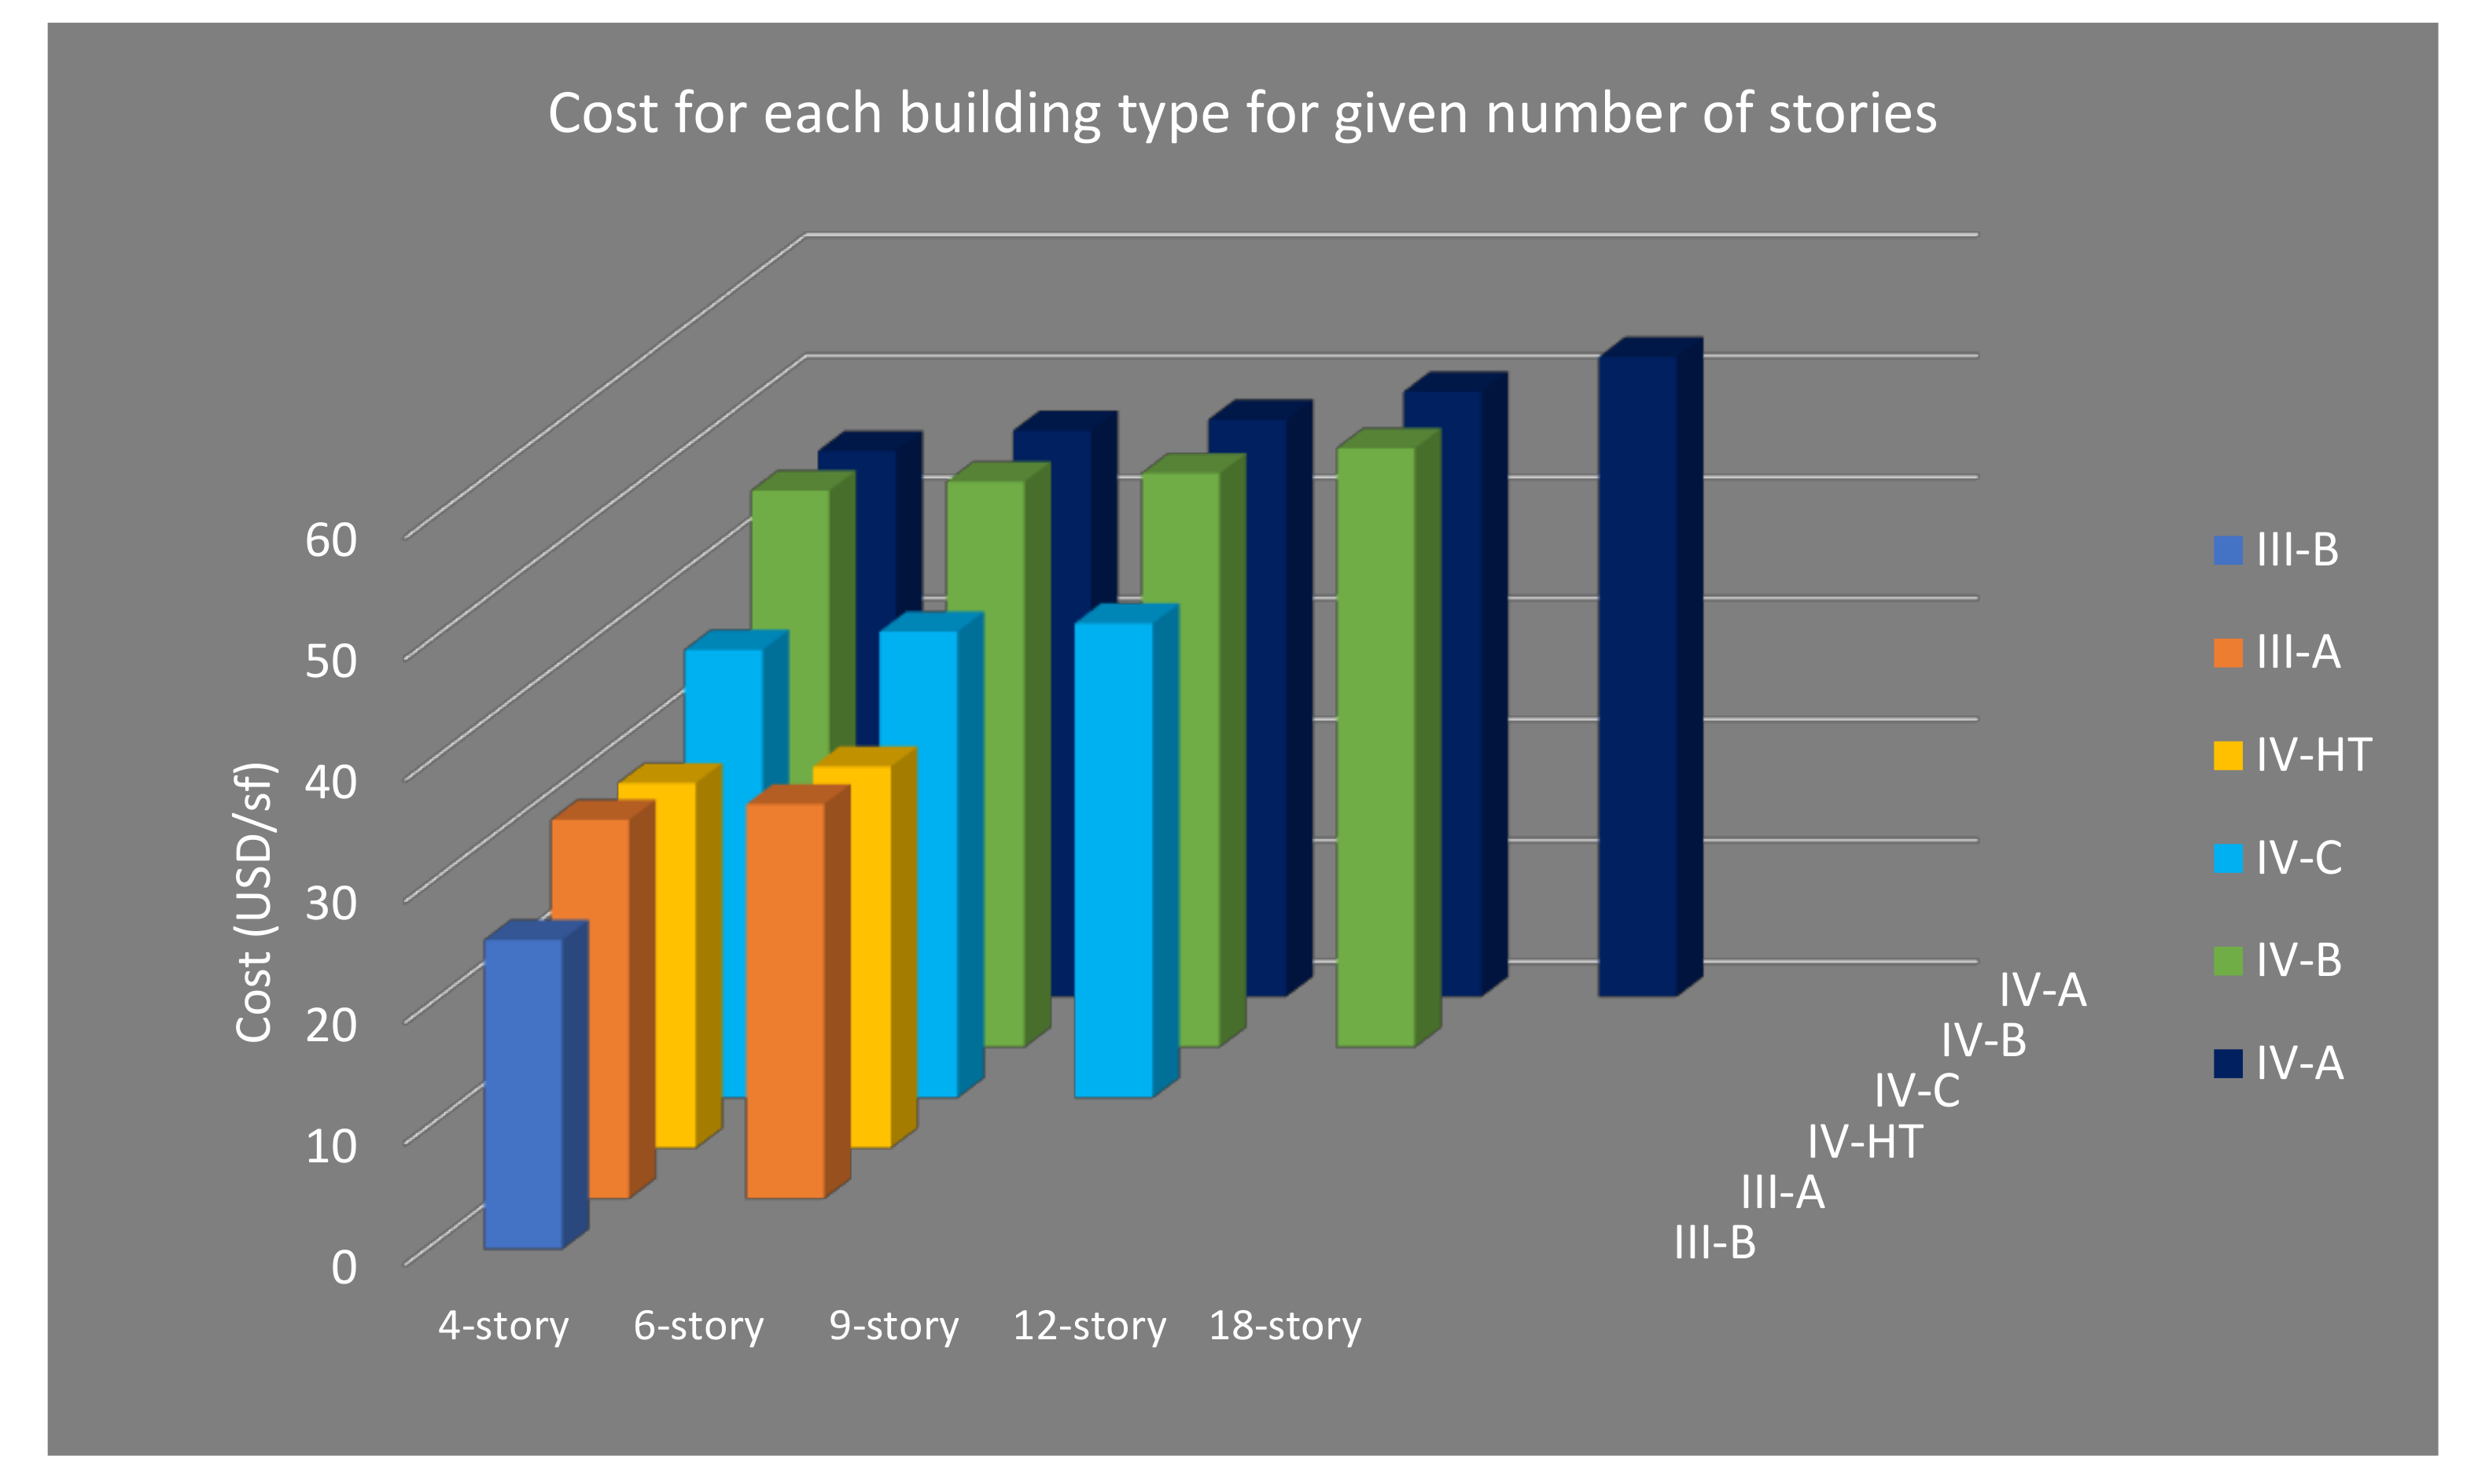
3.2.1. Cost Comparison: General Trends

The automated design program sized beams and columns for different CLT types based on gravity loading demands and FRR (beam size will be the same for all floors except for the roof, while column size varies along the height). An overall unit cost-per-square footage of building useable area was calculated, while the cost contribution from individual materials/products was also recorded. Regardless of building type, height, and grid dimensions, there are some key characteristics that are common regarding cost composition and the change in cost due to geometry. These common mass timber building cost characteristics are illustrated below using a four-story building as an example.
Firstly, as presented in Figure 7, the cost of a mass timber beam–column system is dominated by the CLT cost. For lower floor heights (such as 4-story in this case), it is beneficial to adopt the Type III-B building type because there is no FRR requirement for the floor system, which allows the use of a thinner floor and no gypsum board. If Type IV-C construction is selected, to achieve the required 2-h FRR with an exposed wood ceiling, a 5-ply CLT will usually be selected, which increases wood volume and cost. It is worth noting that, based on fire design requirements of NDS, it is possible to achieve 2-h FRR with an exposed 3-ply CLT floor when the floor span is small (one lamination layer is enough to pass the fire check). However, in this study, the authors imposed a simplified rule of using 5-ply CLT at minimum for exposed floors in order to avoid the situation where only one lamination is left to effectively resist floor loads in case of a fire. The use of non-combustible fire protection can reduce CLT thickness (Type IV-A case shown in Figure 6 uses 3-ply CLT); however, the gypsum board installation itself will add significant cost to mass timber construction. Overall, at lower heights (under 6 stories), it will be most cost effective to adopt existing Type III-A or III-B construction types.
Regarding unit cost sensitivity to changes in column grid dimensions, a common pattern can be observed in most of the analysis cases. As can be seen through the two examples shown in Figure 8, the unit cost generally increases with larger column spacing, and there are some distinctive “plateau” regions within the grid dimension space where the cost remains mostly constant. There are notable increases in cost as the CLT span dimension (b) increases over specific span values. The location of these sudden jumps in cost was found to be correlated to the press lengths designated by the manufacturer, and will be specific to each CLT manufacturer. As shown in the figure, there is a significant increase in cost when b goes from 21 to 22 feet and from 24 to 25 feet. There are also visible but minor price jump patterns that run diagonally, which can be attributed to the demand increase in beam/column design. Because, within the diagonal pattern, the bay area is under a certain limit, the tributary area of the beams and columns are also similar. For example, through further inspection into pricing data, it was found that the diagonal price jump pattern in the middle (which runs from b = 20, d = 25 to b = 28, d = 21) was caused by an increase in the beam connection cost. At these points, the beam reaction surpasses 111 kN (25 kips) and, therefore, the connection cost increases accordingly. Also, the diagonal pattern near the top right corner of the contour graph (from b = 28, d = 30 to b = 30, d = 28) was caused by a decrease in cost for beams. At these bay dimensions, the tributary area of the beams exceeds 400 square feet which triggers live load reduction. If a designer is trying to achieve an optimal pricing point for mass timber buildings, these are the common factors to consider in the schematic design stage.

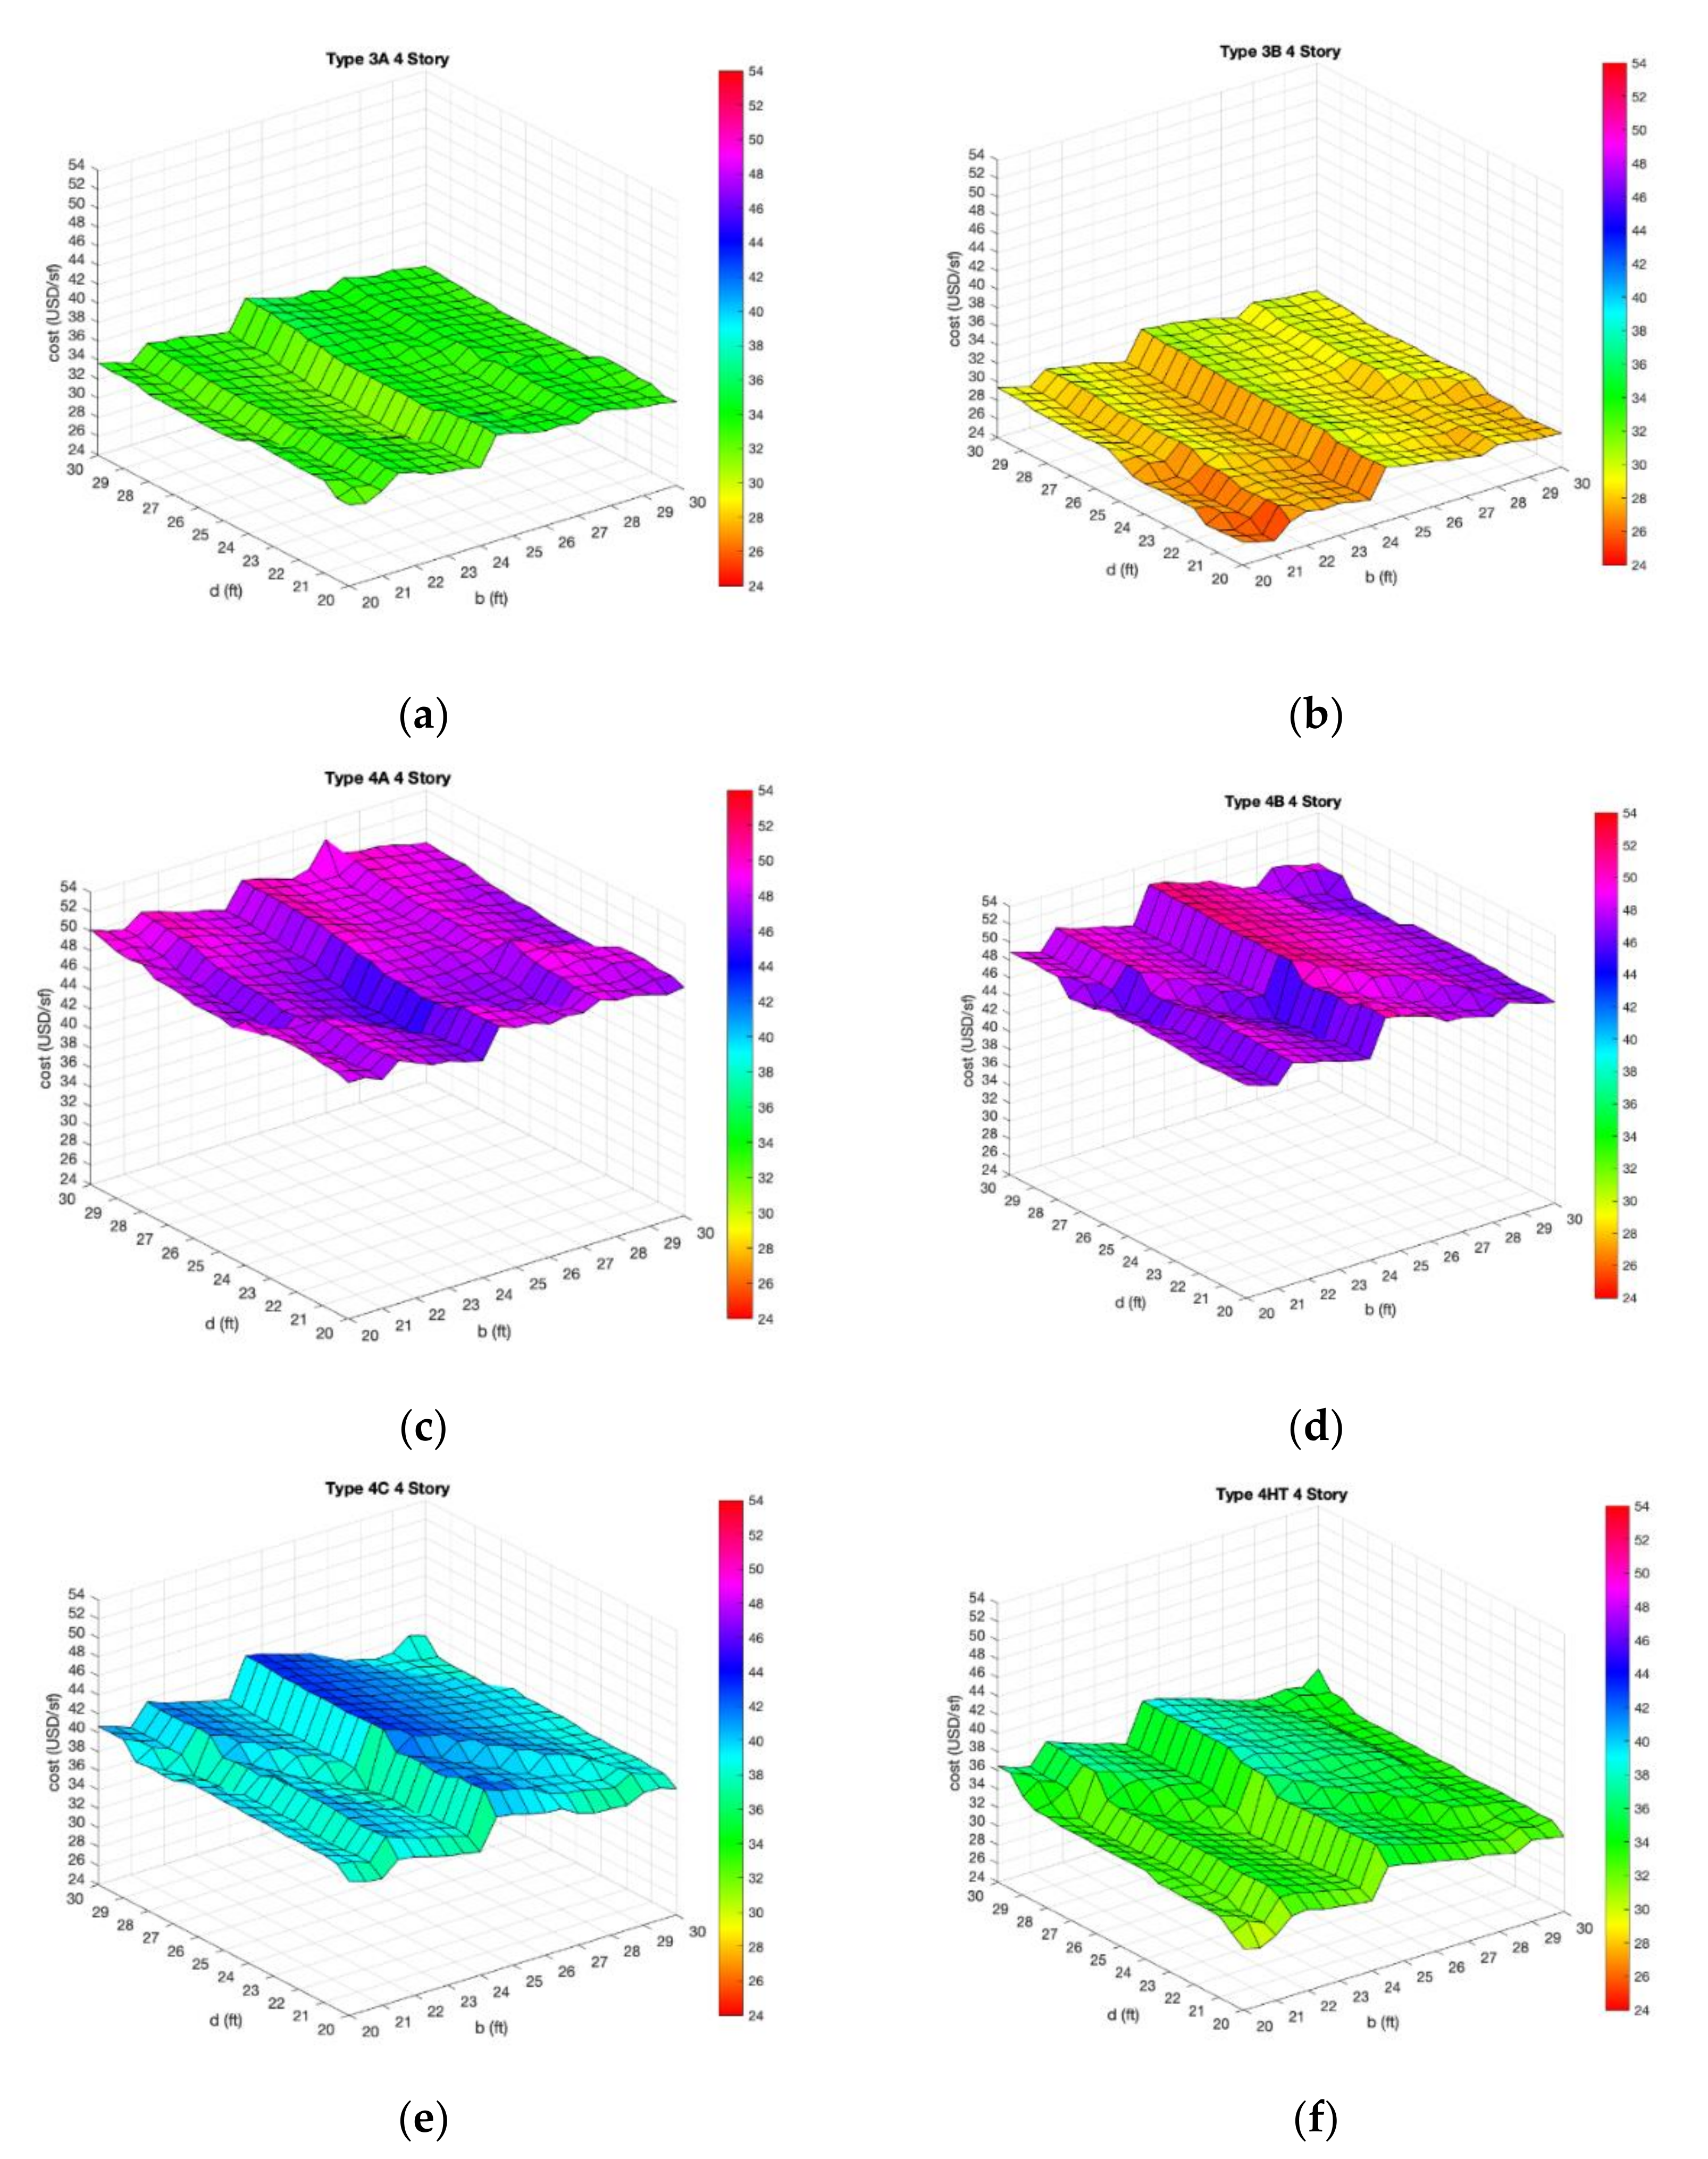
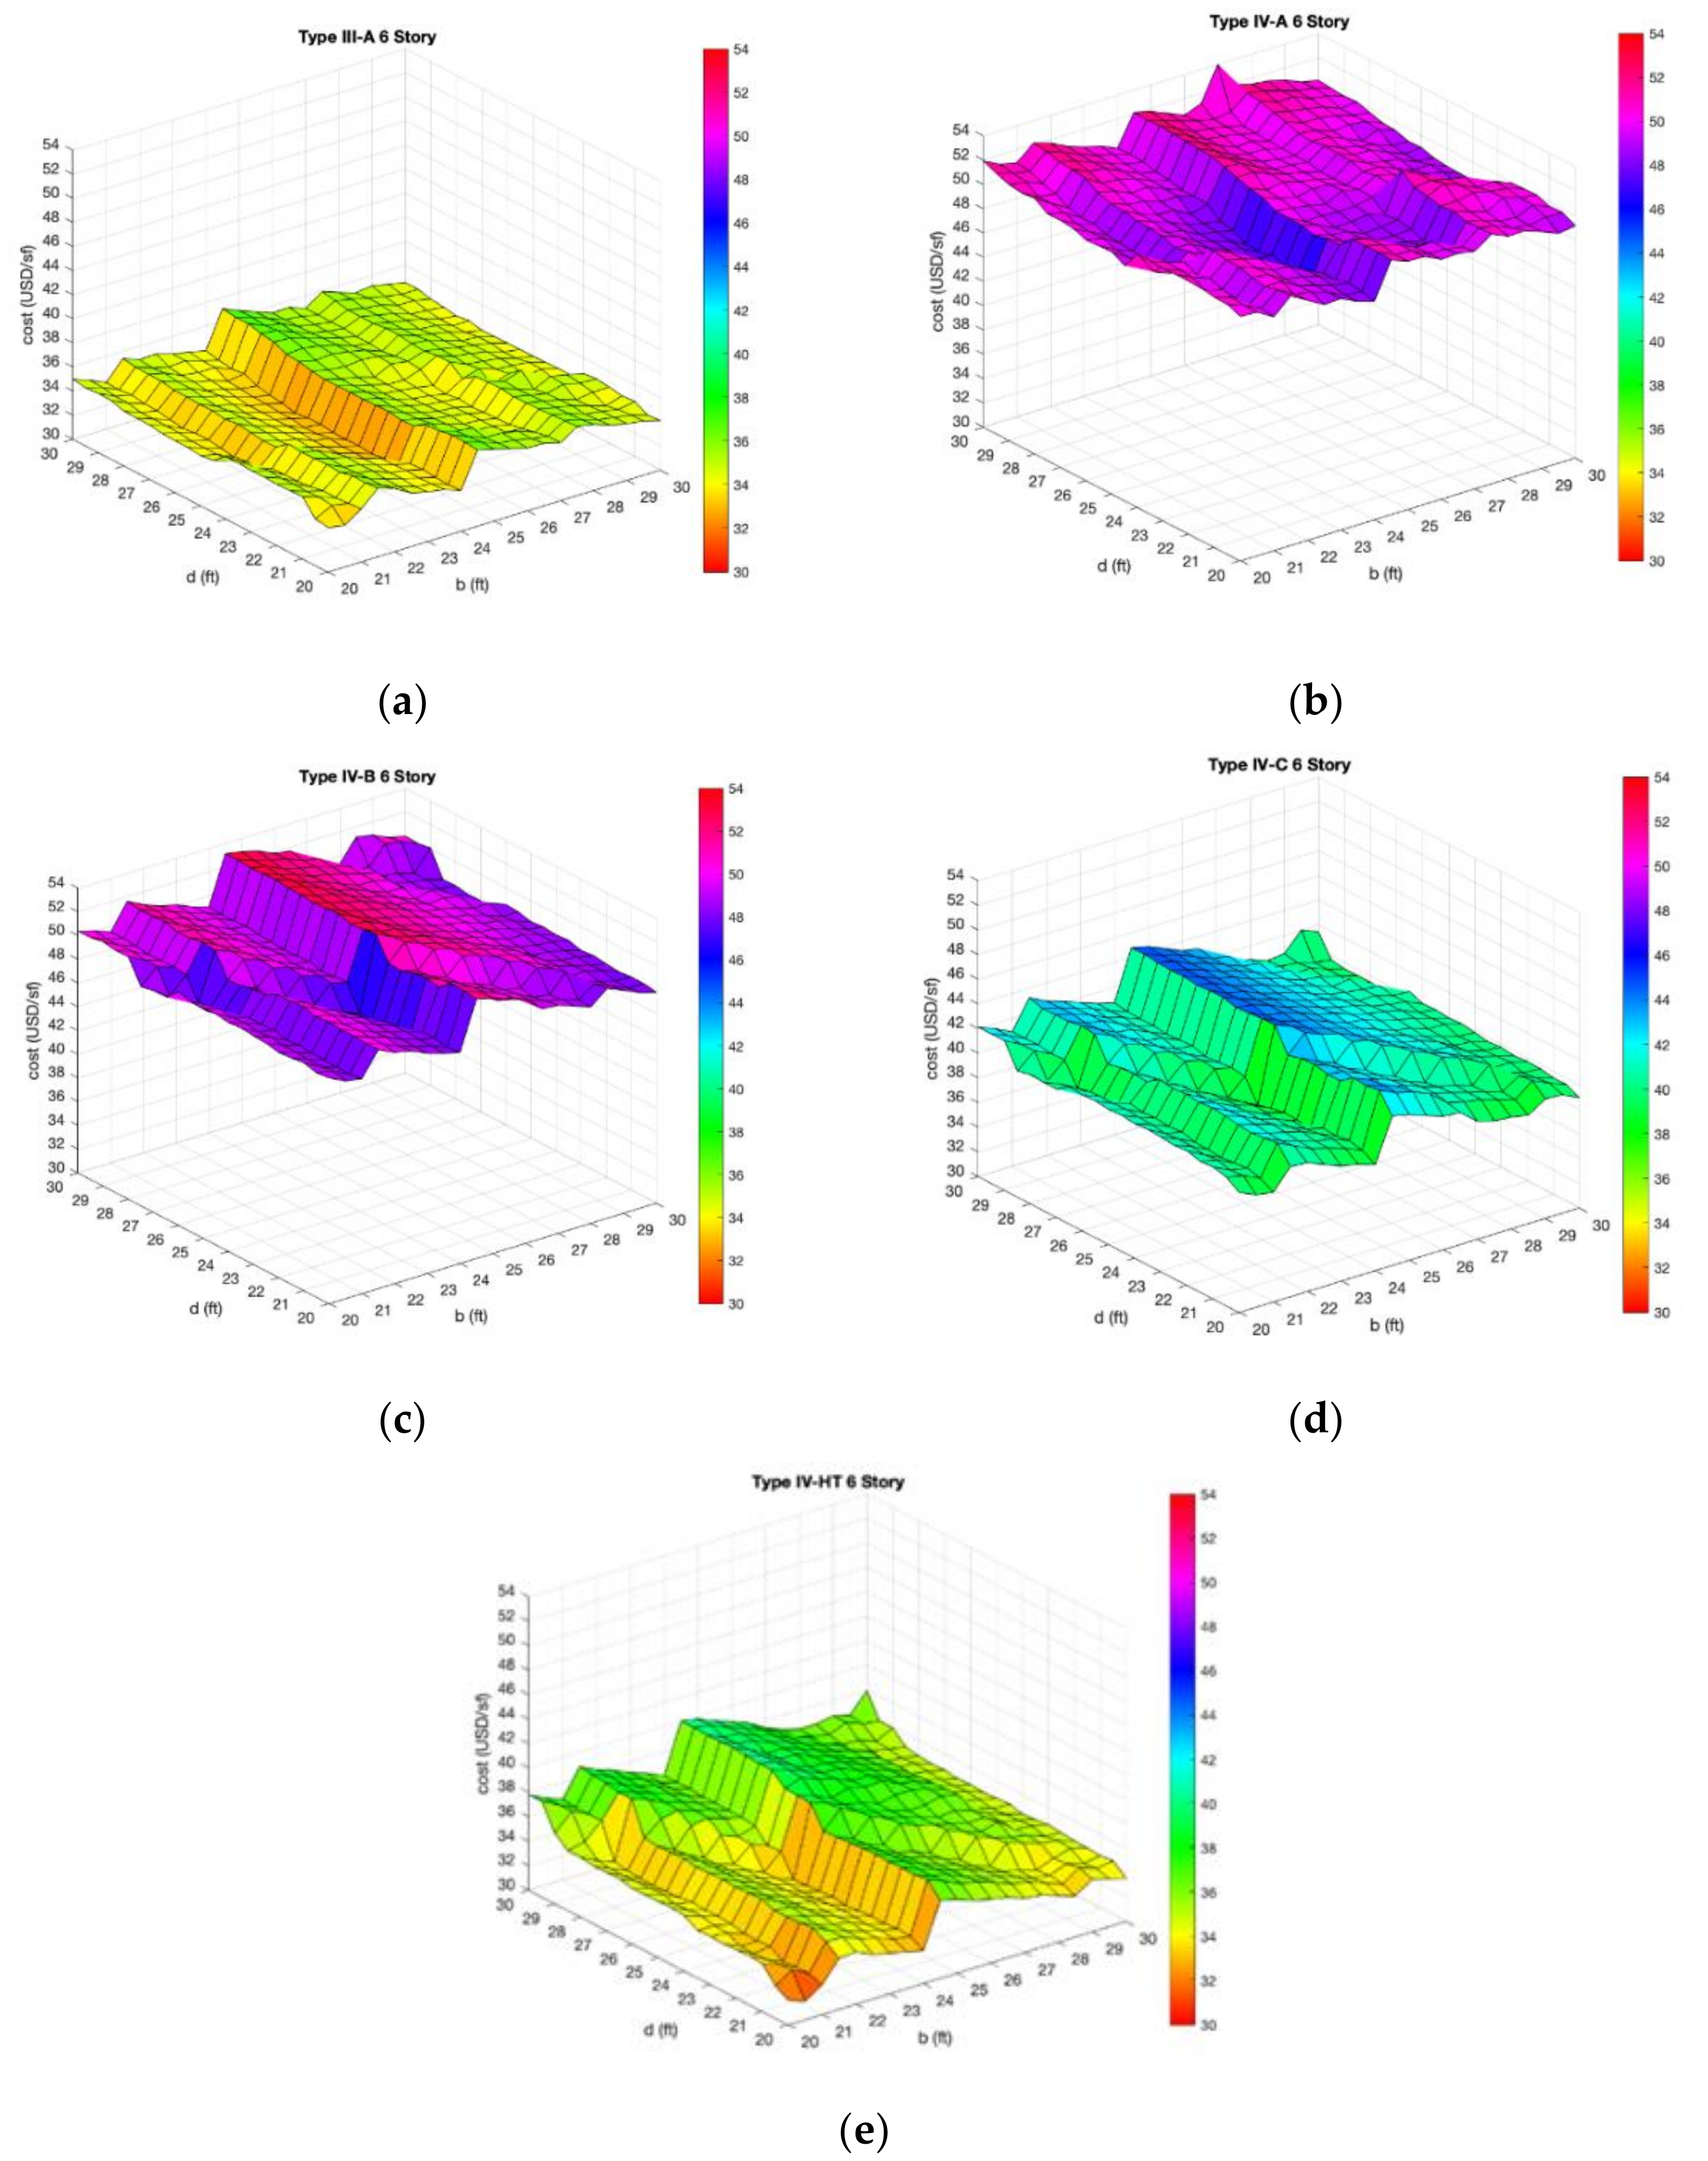
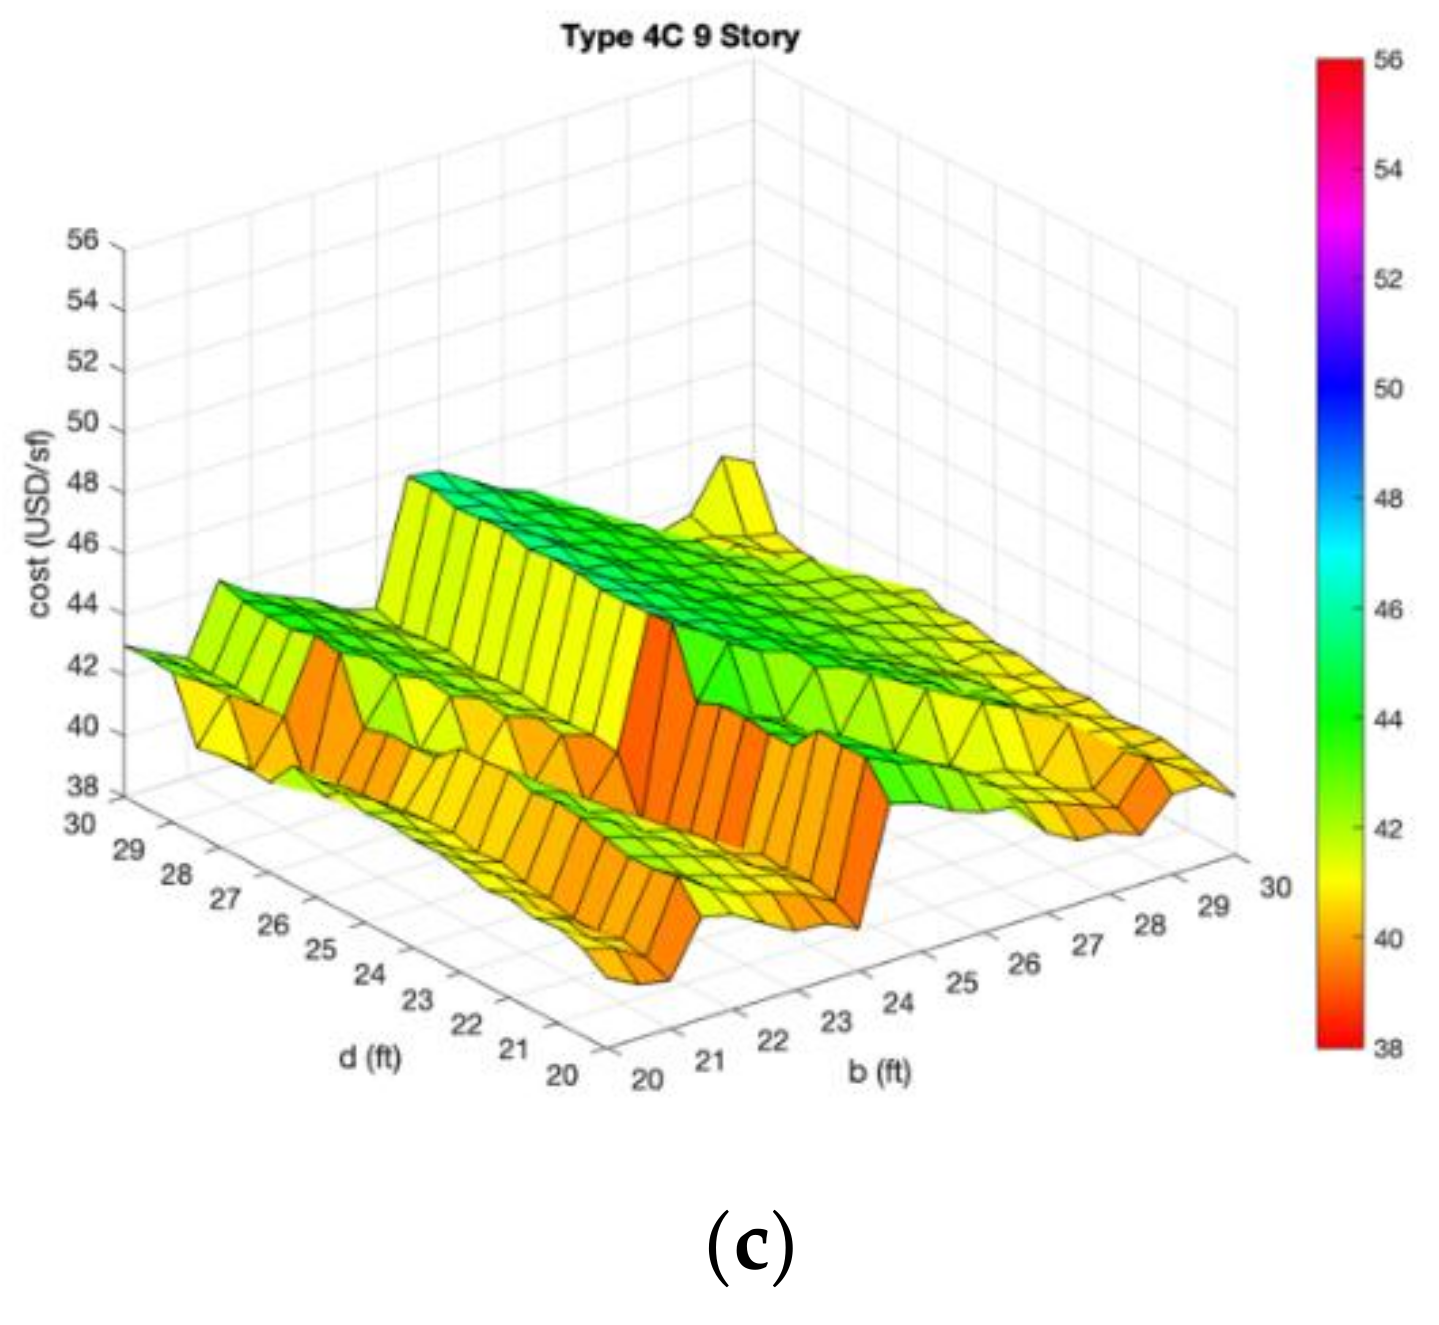
3.2.2. Cost Comparison: IBC Type Cost Performance at Different Building Heights

Each building type has different limits on story height and number of stories. For example, Type III-B is restricted to four stories and is the smallest number of stories allowed out of the building types in this study. Although it is unlikely that a four-story mass timber building will be designated as Type IV-A, it is theoretically possible to consider all building types at this height. Surface plots of the unit building cost for different bay sizes were presented in Figure 9 for all building types. In every building type, the general trends of price jump described in the previous section can be observed. When it comes to total cost, building Type III-B is the least expensive type for all bay dimensions for a four-story building. This is expected because there is no FRR requirement for Type III-B, resulting in savings from gypsum board and sacrificial wood layers when compared to other types.
The next level of story height restriction is six stories, which includes all building types except Type III-B. Figure 10 presents the surface plots of building cost for these types. It is interesting to see that, although the Type III-A building was shown to be the most economical, there are some regions in the grid dimension space where Type IV-HT yields the lowest cost. Type IV-HT is cheaper at these bay dimensions because the cost from the gypsum board for Type III-A surpasses the cost of the five-ply CLT used for Type IV-HT. Figure 11 shows the surface plot of the lowest cost among all building types for six-story buildings, together with a map of controlling building types.
The least expensive building type is usually Type III-A for 6 stories, as seen in Figure 11. For some bay sizes, the least expensive building type is Type IV-HT. This occurs largely when d is between 20 and 22. The main design differences, and thereby cost differences, for Types III-A and IV-HT is the thickness of the CLT and the non-combustible protection. Type III-A uses 3-ply CLT and has the added cost of gypsum board due to the 1-h FRR for the floor, while Type IV-HT uses 5-ply CLT and has no gypsum cost or FRR. It should be noted that Type III-A does not require non-combustible protection. Due to the self-imposed constraint of CLT being at least 5-ply when exposed, a single layer of gypsum board is used for Type III-A in this study to allow for a 3-ply CLT floor and roof rather than 5-ply CLT. The peak unit cost of CLT is when b equals 24~26 (as seen in Figure 10) and, at that time, Type III-A is the least expensive, as this type’s design uses the cheaper 3-ply CLT. When d is between 22~20, Type IV-HT is cheaper. This is because, at these bay sizes, the added gypsum cost for Type III-A surpasses the cost difference between the 3-ply CLT and the 5-ply CLT. It should be noted that, at the bay sizes where the cheaper cost transitions from Type IV-HT to III-A, and vice versa, the cost differences of the two types are very minimal and come down to rounding. At the bay sizes further away from the line between Type IV-HT and III-A, the cost difference becomes larger.
Only three building types, namely Type IV-A, IV-B, and IV-C, can be built to 9 stories. Based on the cost calculation results for these building types presented in Figure 12, the most cost-effective type for a nine-story buidling is Type IV-C. This is because Type IV-C does not require any noncombustible protection and, therefore, there is no cost for gypsum board. Type IV-A requires full non-combustible coverage on all wood surfaces, which could enable the use of thinner CLT panels; however, the added cost of the gypsum board makes Type IV-A more expensive. Although Type IV- B only needs partial coverage, exposed floor panels need to be at least 5-ply CLT because of the self-imposed rule discussed earlier, which increases wood volume significantly. However, because the Type IV-C building has a height limit of 85 ft, it is not likely to provide much flexibility to floor-to-floor height if it is to be applied to a nine-story construction. While a Type IV-C nine-story building is allowed by the code and its cost is significantly lower than other options, architectural design challenges on very limited head space may make this design undesirable in practice.
Above nine stories, the only options for wood building are Types IV-A and IV-B. The unit cost for these two building types for a 12-story building design are presented in Figure 13. The main design differences between Type IV-A and IV-B designs are the type of CLT panel used and the amount of gypsum board required. The Type IV-A design can use 3-ply CLT throughout the building because all FRR can be achieved with gypsum cover. Due to the self-imposed rule, Type IV-B design must adopt 5-ply CLT because part of the floor will be exposed. When 3-ply CLT is used, Type IV-A design requires more gypsum board than Type IV-B because of its higher FRR requirements. Figure 14 showed the most economical design option and cost for 12-story building design. Specifically, Type IV-A is the cheaper option when dimension b is between 24.5 feet and 27 feet, mainly due to the increase in the CLT unit in this range. At almost all other bay dimensions, the cost of gypsum board for Type IV-A supersedes the increased CLT costs from Type IV-B design, making Type IV-B a better solution. The diagonal section where Type IV-A is cheaper than Type IV-B coincides with the increase in cost due to beam connection cost for Type IV-B. While these cost ranges are related to the CLT and connection curve data used for this specific study, it is clear that the CLT cost for a project can heavily influence gravity system cost and the most effective building type designation. It should also be noted that, due to owner and investor preference on wood exposure, it is possible for a realistic project to adopt a slightly more expensive building type (Type IV-B in some cases) in order to have exposed wood surfaces.

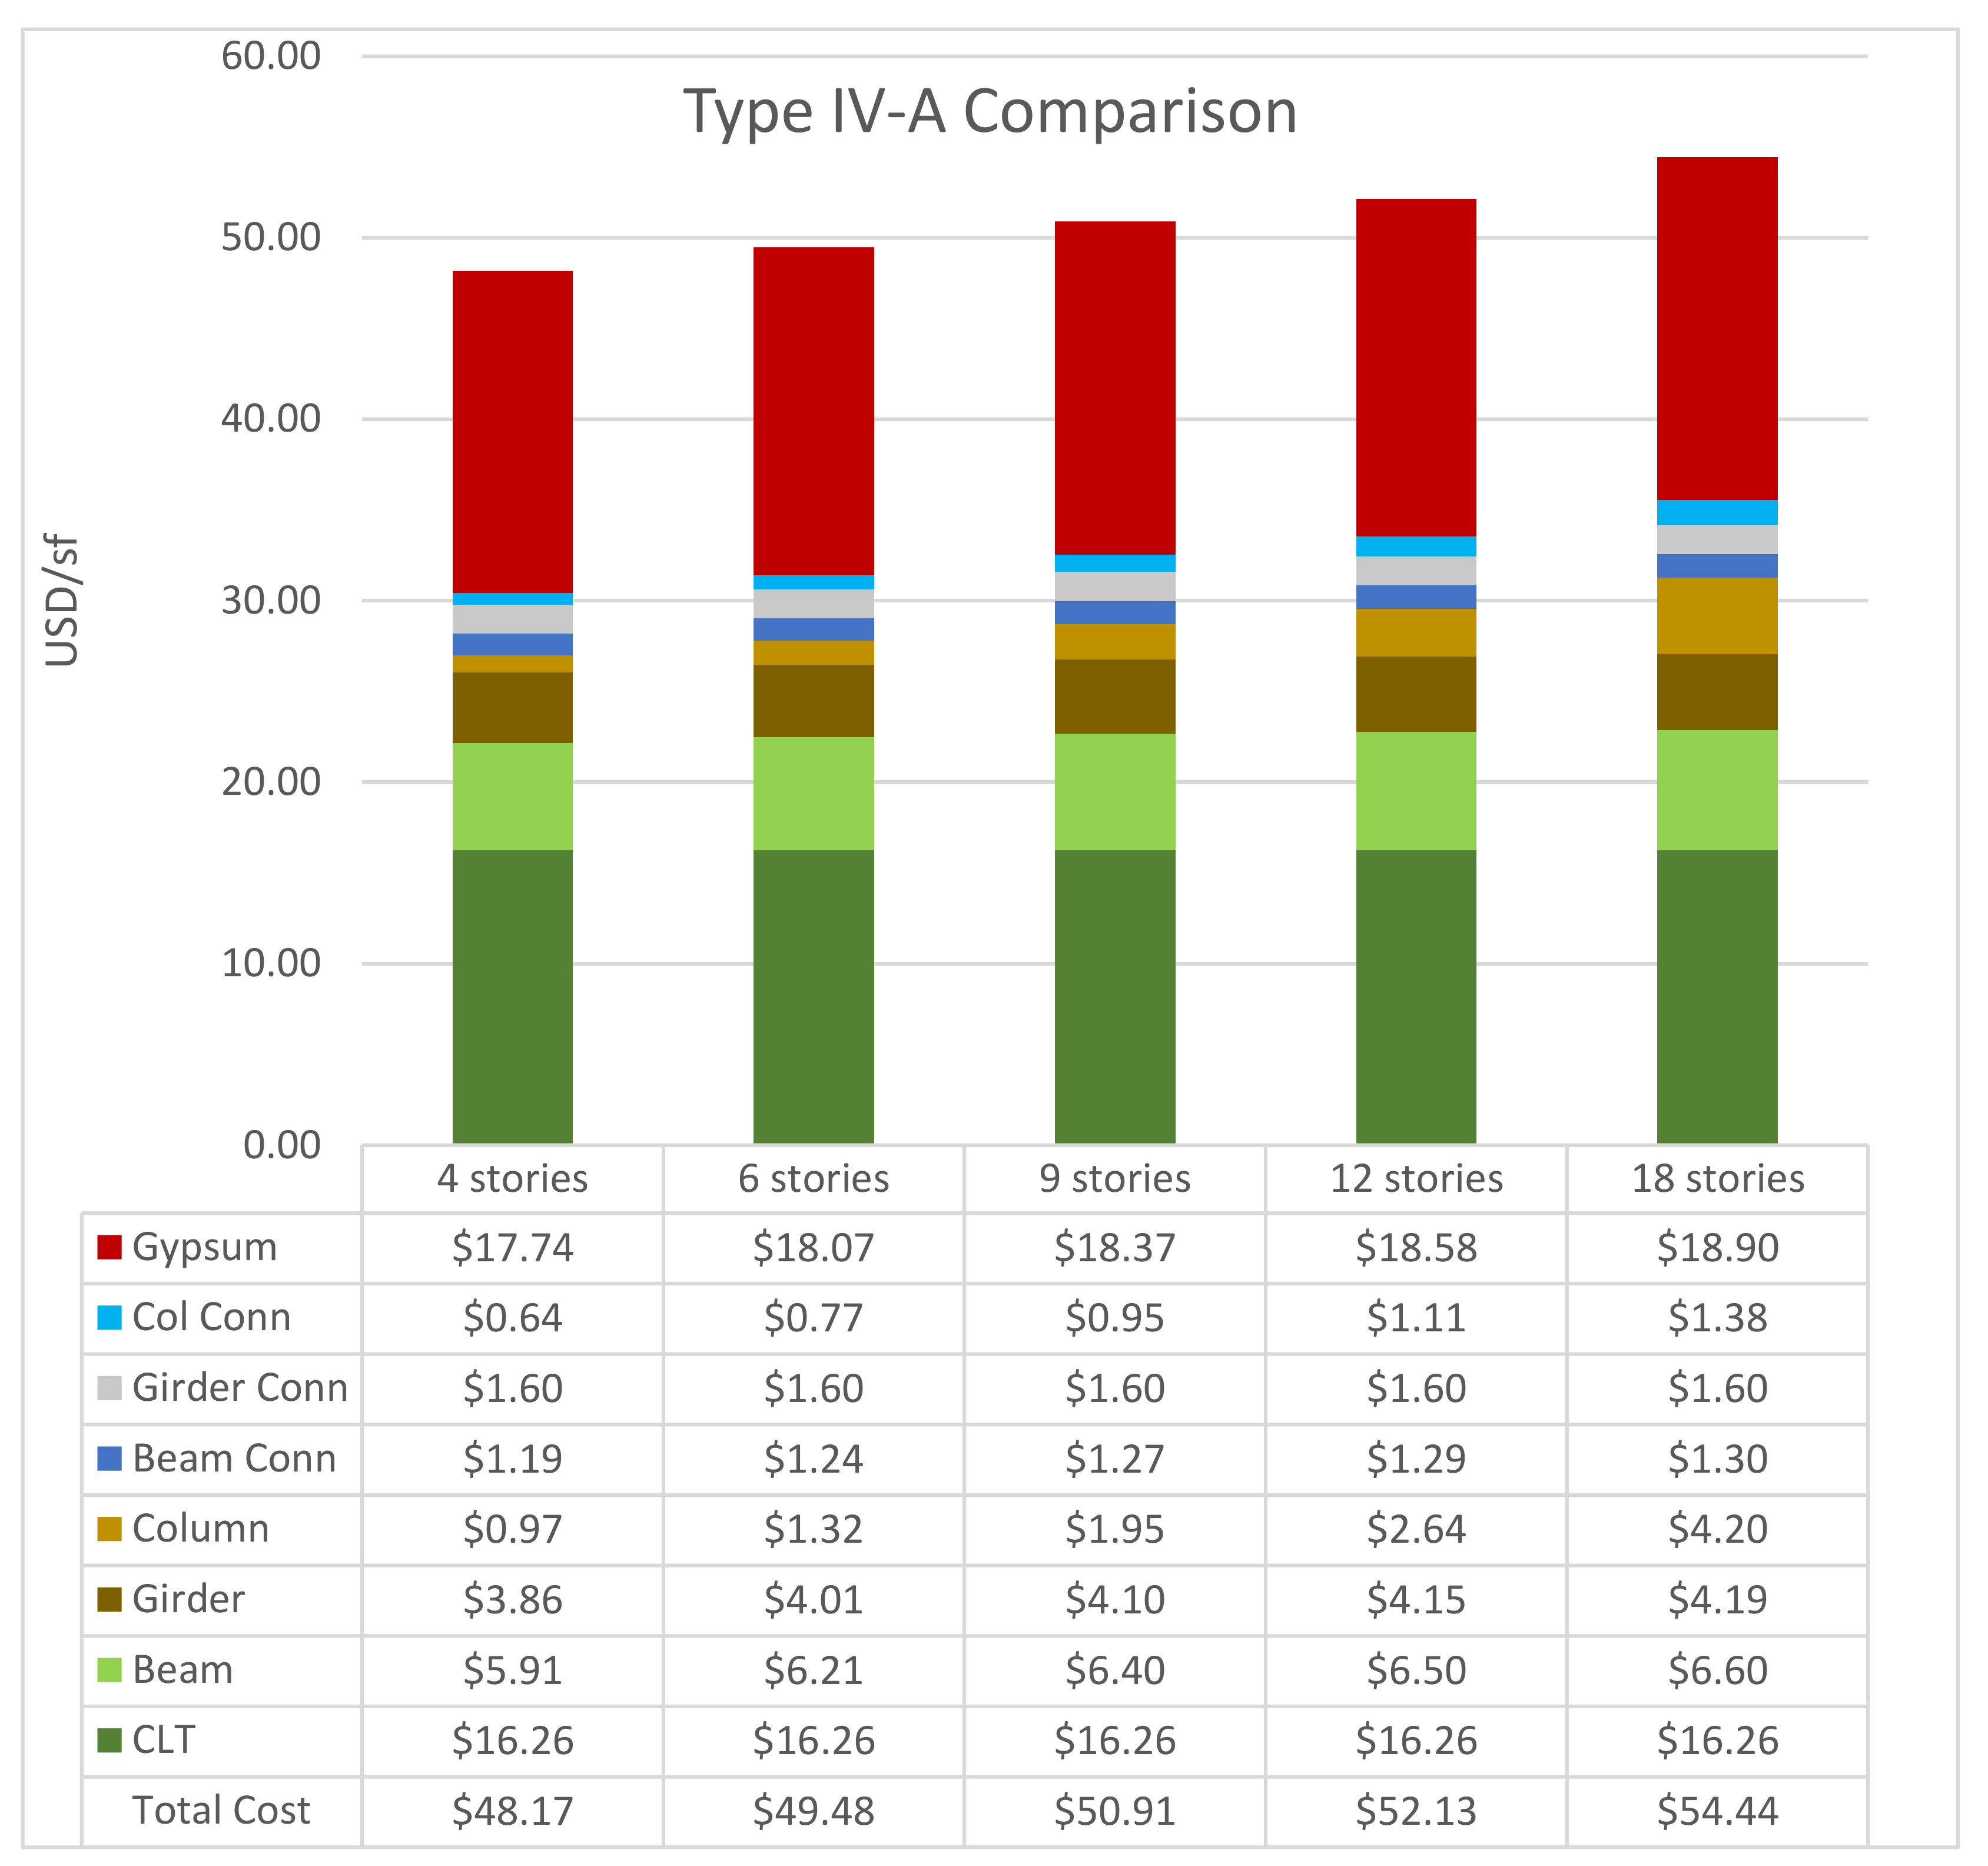
3.2.3. Cost Comparison: Type IV-A with Increasing Building Heights

Because only the Type IV-A building is allowed to be built up to 18 stories, this comparison is focused on the cost composition of Type IV-A buildings designed for different heights for a fixed 25 × 25 feet column grid (see Figure 15). As the number of stories increases, every major component system increases except for the CLT. The largest increase is seen with in column and column connections cost. This is expected because the columns will become larger as the stories increase. The gypsum board cost increases modestly correspondingly because there is more surface area to cover from the increase in column size. These trends shown in Figure 15 are consistent with the other bay sizes. There is no dramatic cost difference for different story heights when the same building type (in this case Type IV-A) is used. Thus, it is unlikely that Type IV-A will be adopted for lower building heights when other types are viable.

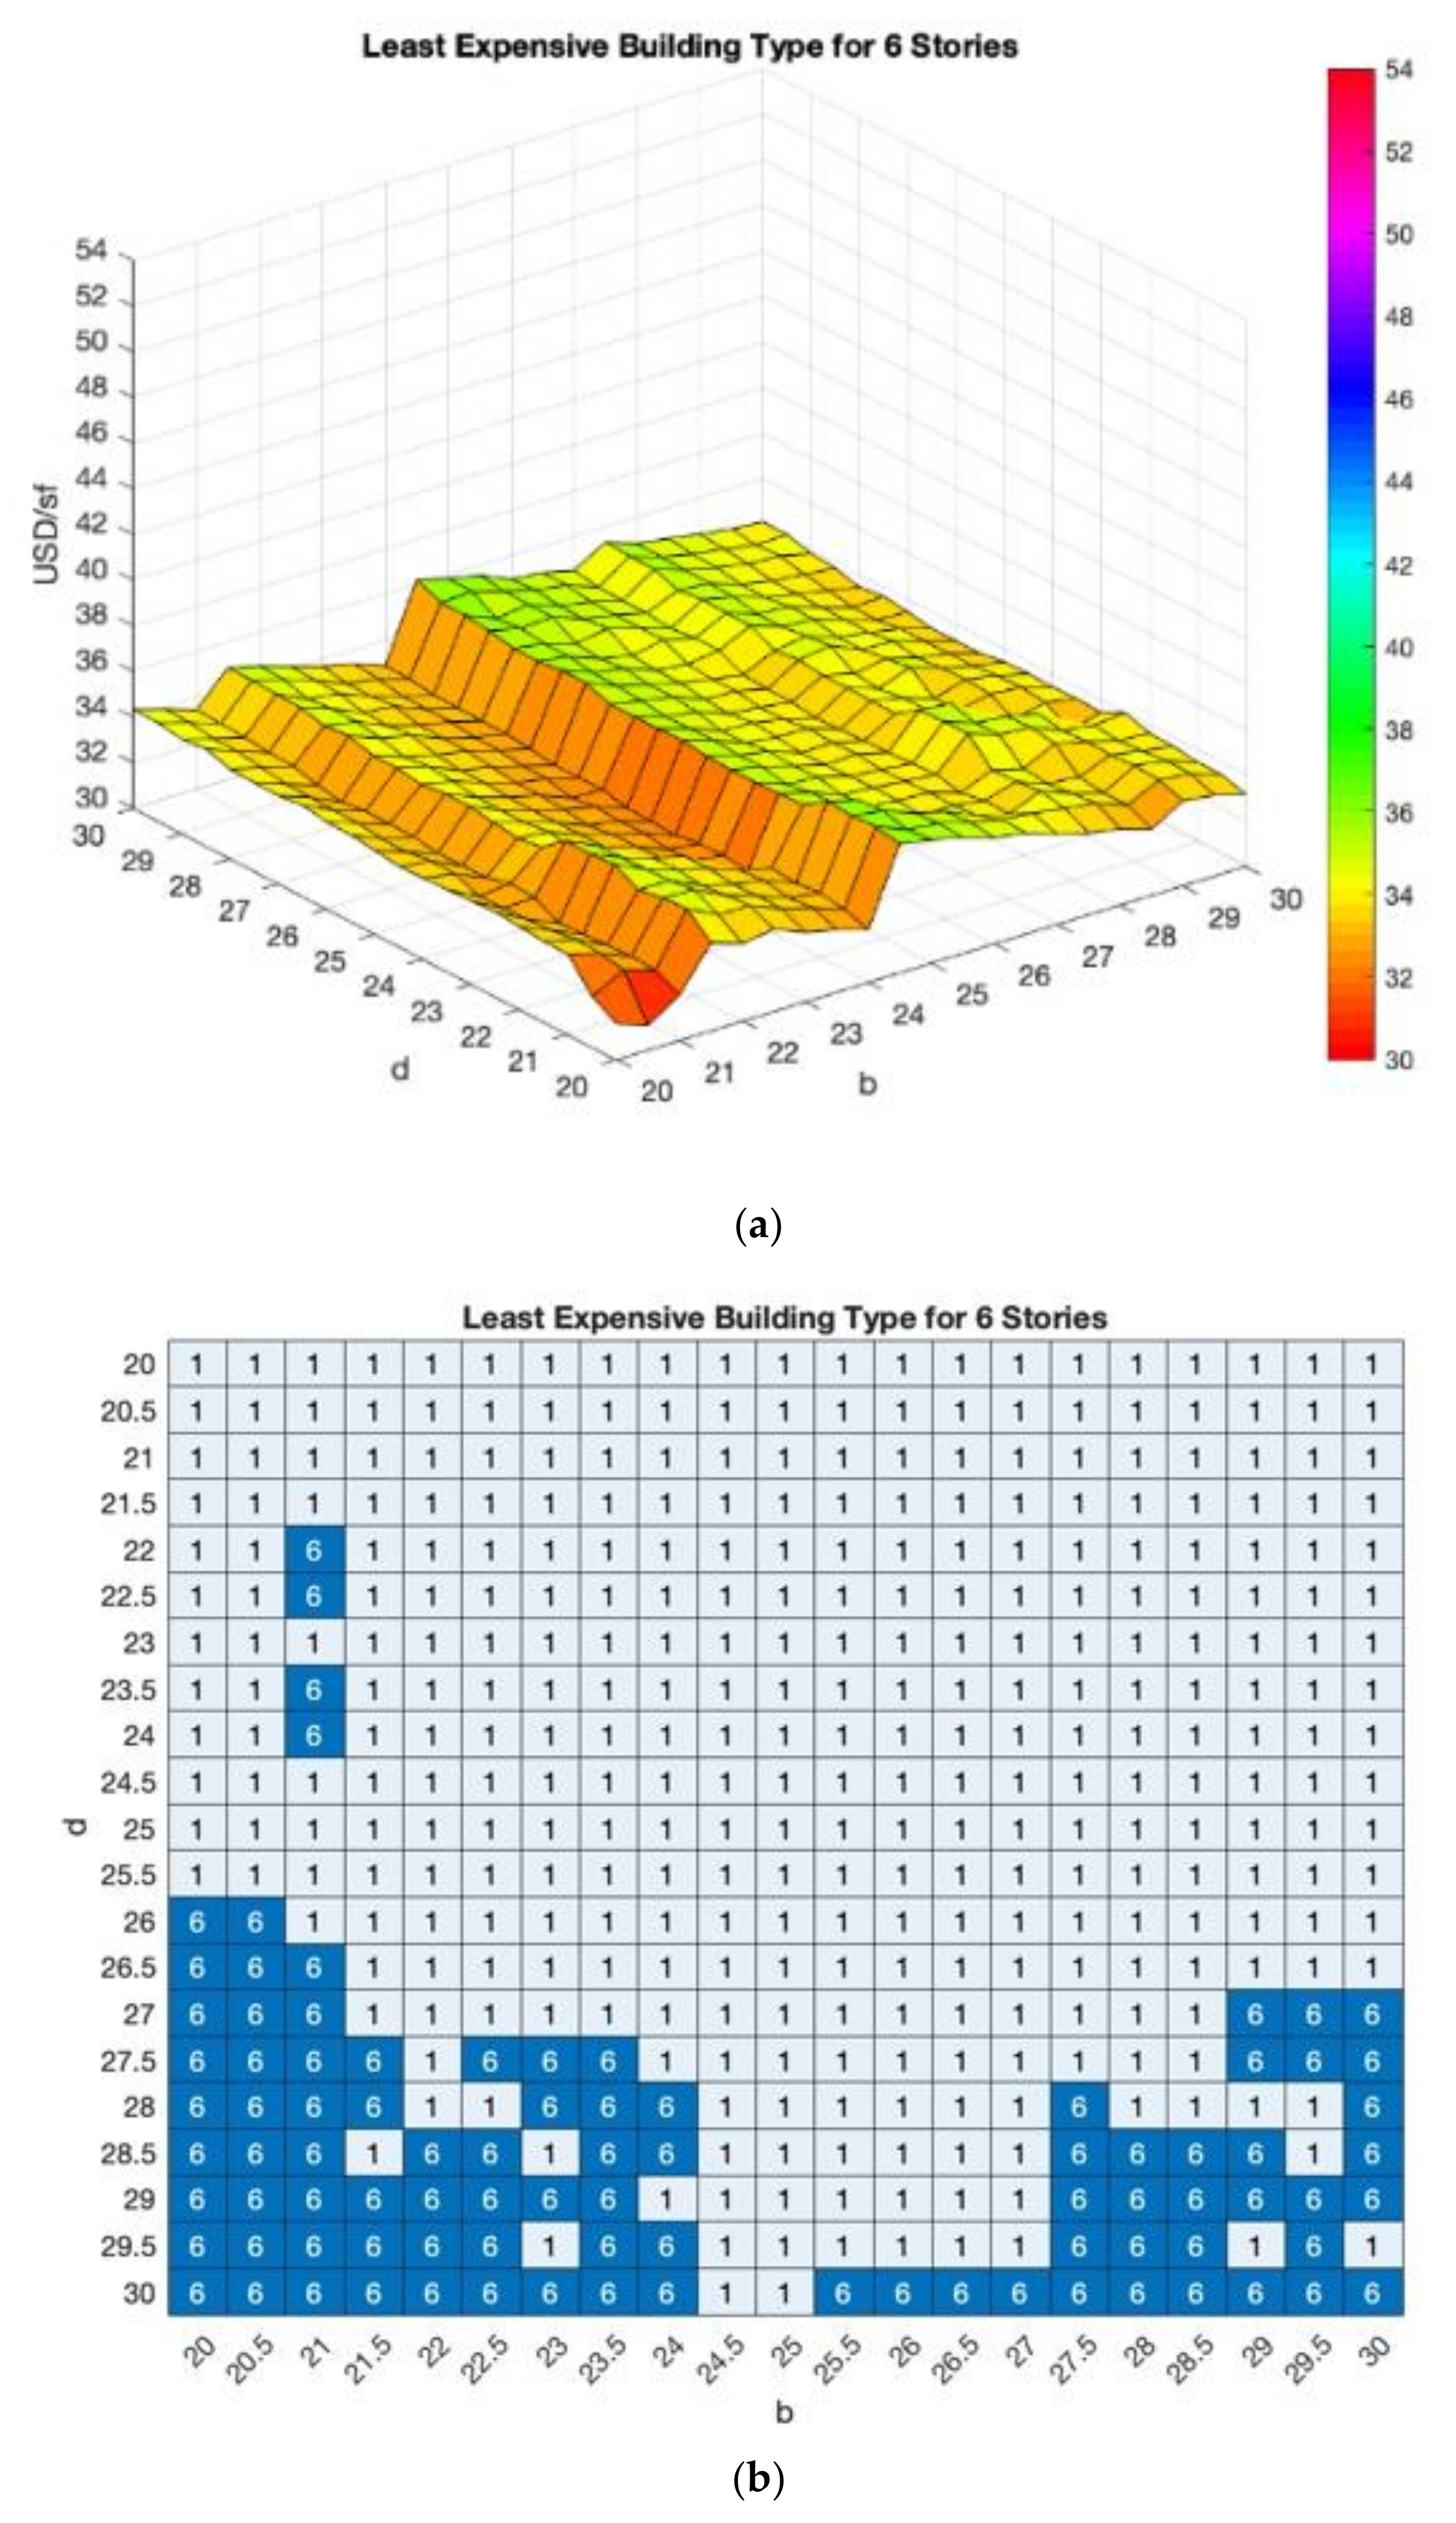
3.2.4. Cost Comparison: Overall Most Economical Design

The most cost economical column grid dimensions for each story height and the corresponding IBC building type are listed in Table 5. It can be seen that reducing the bay size (smaller column spacing) will generally result in the lowest cost; however, the smallest bay size (20 × 20 ft in this study) was not the cheapest due to CLT unit price. The most economical options are mostly on the diagonal line in Table 3, indicating that it is reasonable to use the IBC building type which has the height limit that matches the target building height. A visualization of the lowest cost for different height and building type combinations is presented in Figure 16.

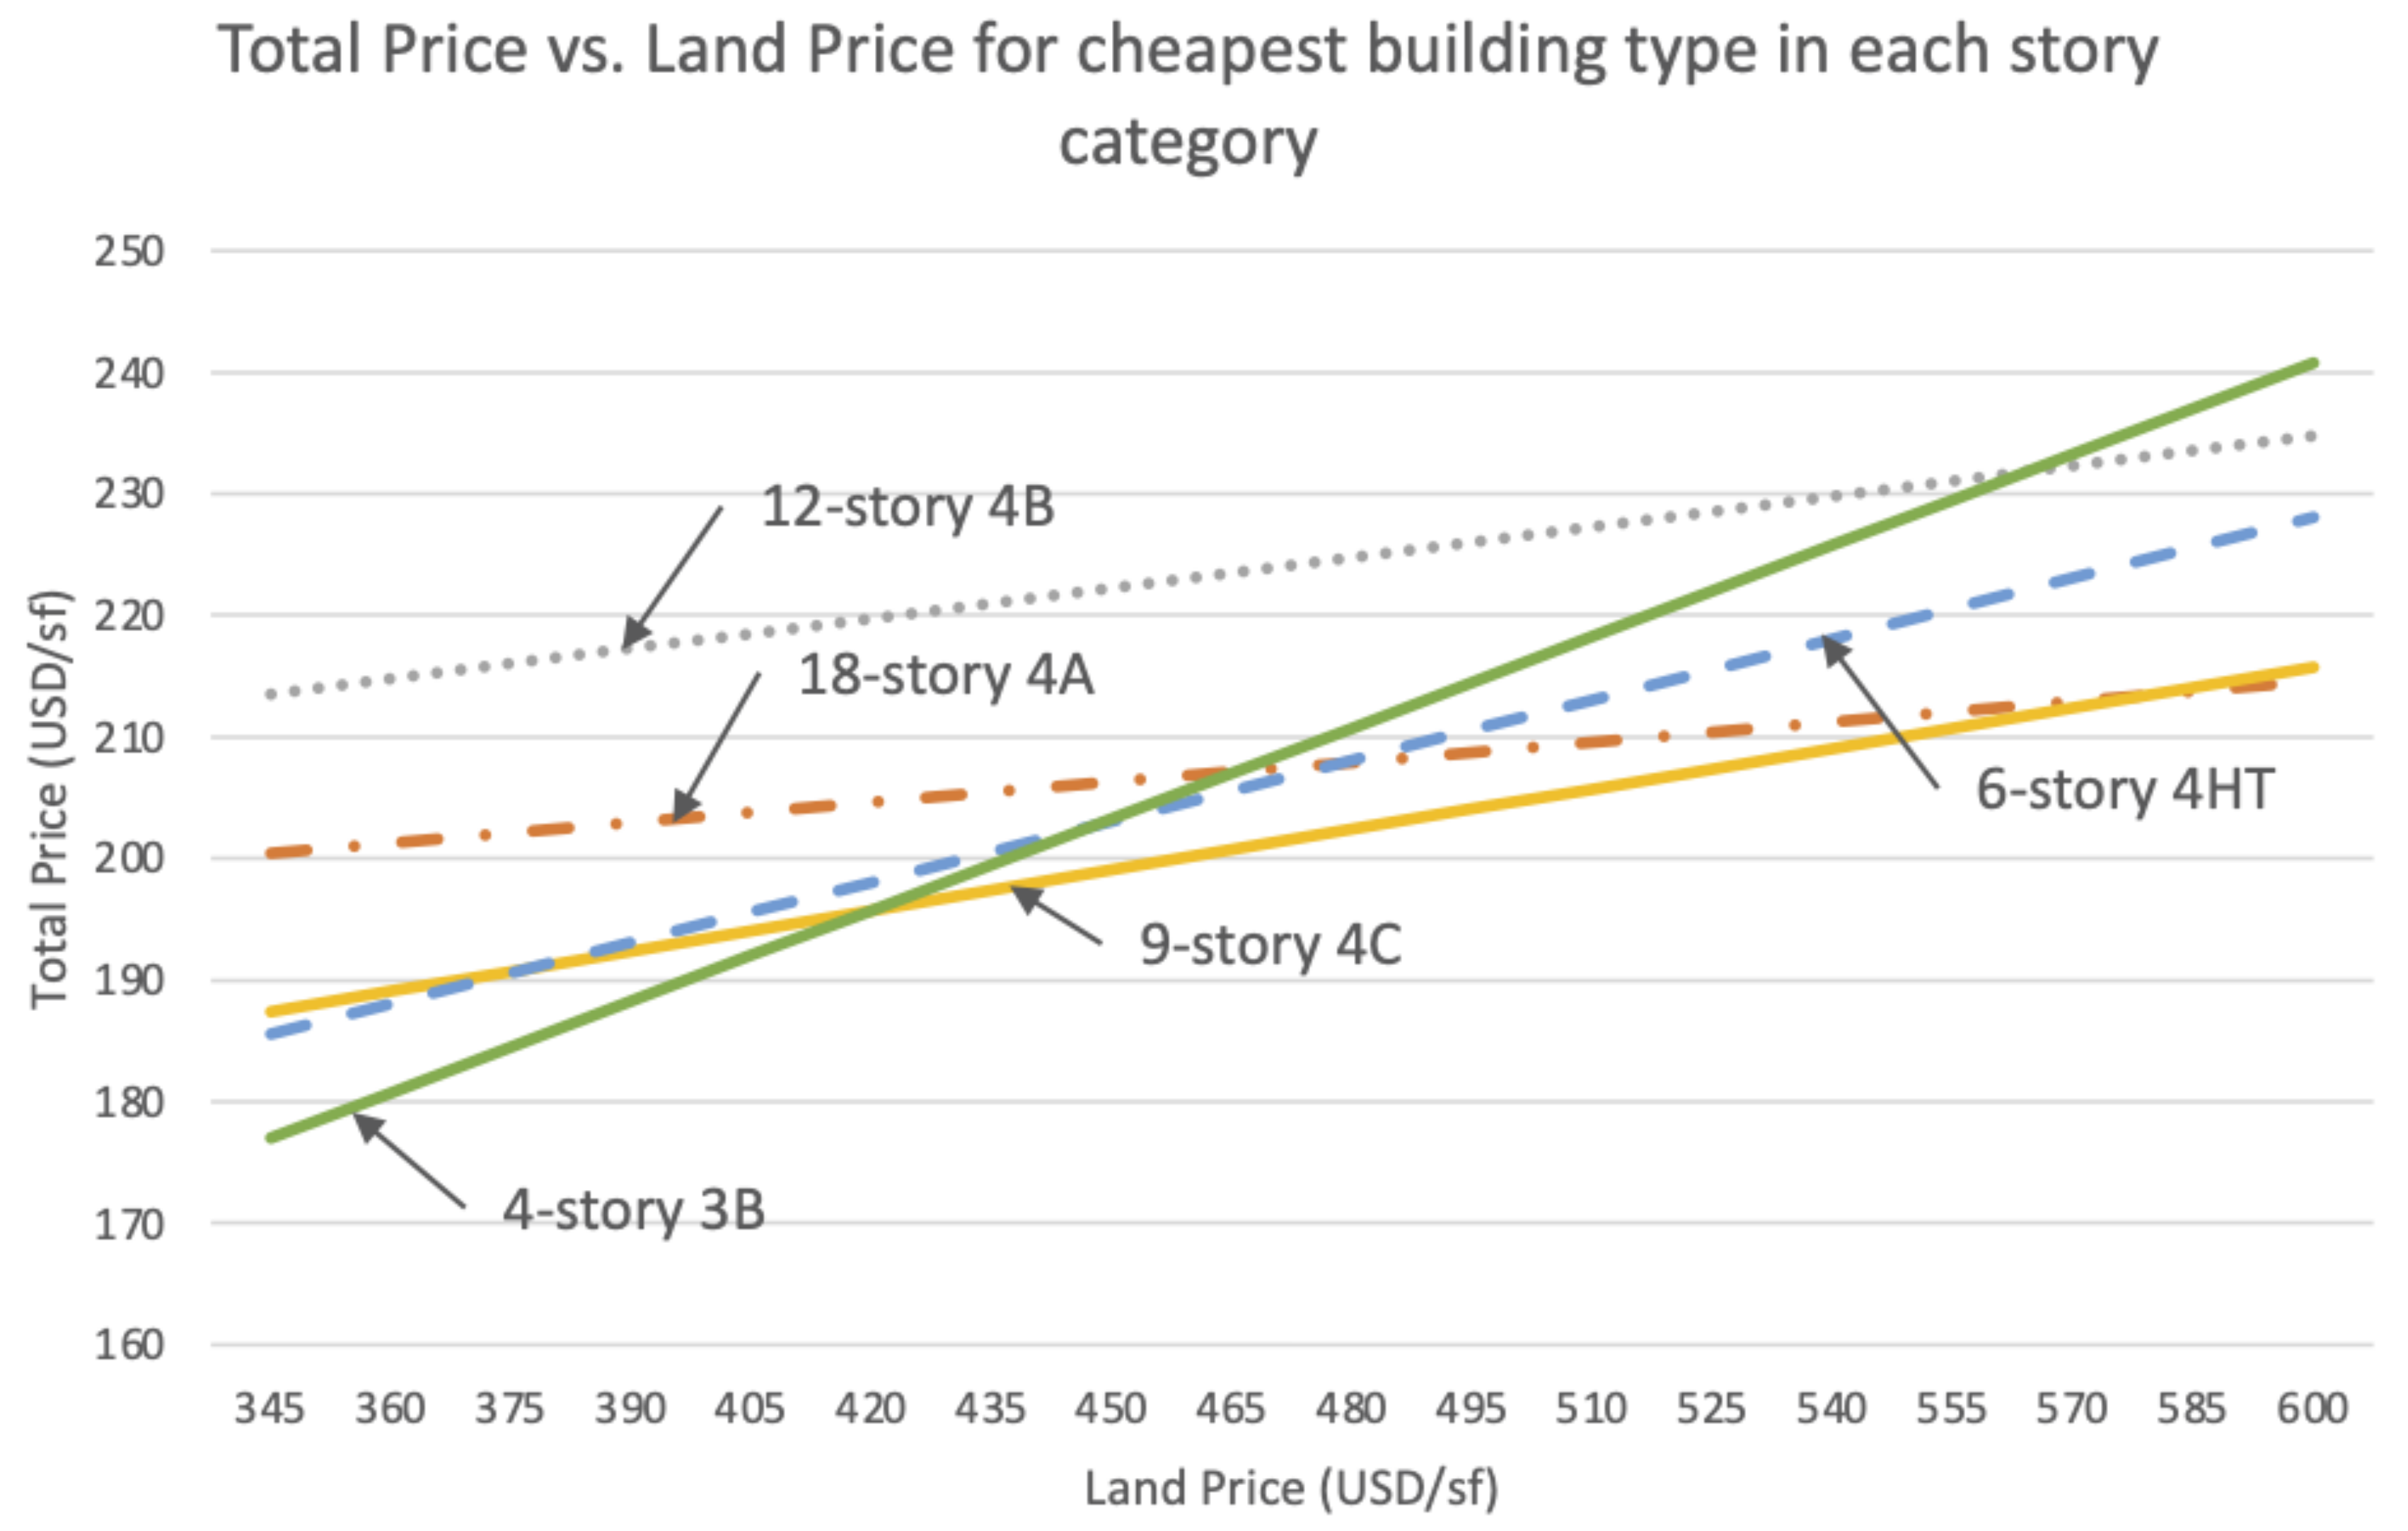
3.2.5. Sensitivity Study: Tall Wood Competitiveness against Land Price

Thus far, all of the comparisons conducted in this study were focused only on mass timber gravity system costs. In realistic decision making, the building owner and the design team are required to consider also the overall building costs, including other building systems and factors (foundation, mechanical, envelope, land price, etc.) when selecting building height and type. As a result, it may become more economical to have an 18-story Type IV-A building with more stories than a 4-story Type III-B building when the cost of the land and other building components are factored in.
In this section, by assuming that the gravity system cost calculated in this study is only 30% of the overall construction cost (excluding the land cost), a study on the cost competitiveness of different building types and height options against land price was conducted. The metric used to compare different design options is the final project unit cost, which is simply the total building cost plus land cost, and is then normalized by the total useable area in the building:
F i n a l   p r o j e c t   u n i t   c o s t = u n i t   c o s t   f r o m   T a b l e   3 0.3 + l a n d   c o s t t o t a l   a r e a
Using a 160 ft × 80 ft floor plan and a 25 × 25 foot bay system (which is very close to the optimal cost design as indicated in the previous section) for all building types, a few representative total cost curves (actually a straight line because of the simplified assumption used here) were developed and presented in Figure 17.
As expected, the most economical option for locations with a cheap land price will be low-rise multi-story construction projects such as a four-story Type III-B building. However, the selection can become very sensitive to land price increases. In this example, it becomes more profitable to construct a 9-story Type IV-C building when the unit land price is higher than $420/sq.ft., and an 18-story Type IV-A starts to make sense if the land price rises over $580/sq.ft. A six-story Type IV-HT option seems to always be a viable and competitive alternative while providing fully exposed wood if desired. The 12-story Type IV-B construction seems to be very expensive at first glance. However, it should be noted that it is the only option for exposed wood above an 85 ft building height, thus requiring a premium from the investors. The overall price analysis conducted here is very simplistic and did not include real budget constraints and other implications such as the construction economies of scale. It is a simple illustration of how other financial factors (such as land price) can significantly impact engineering decision making.

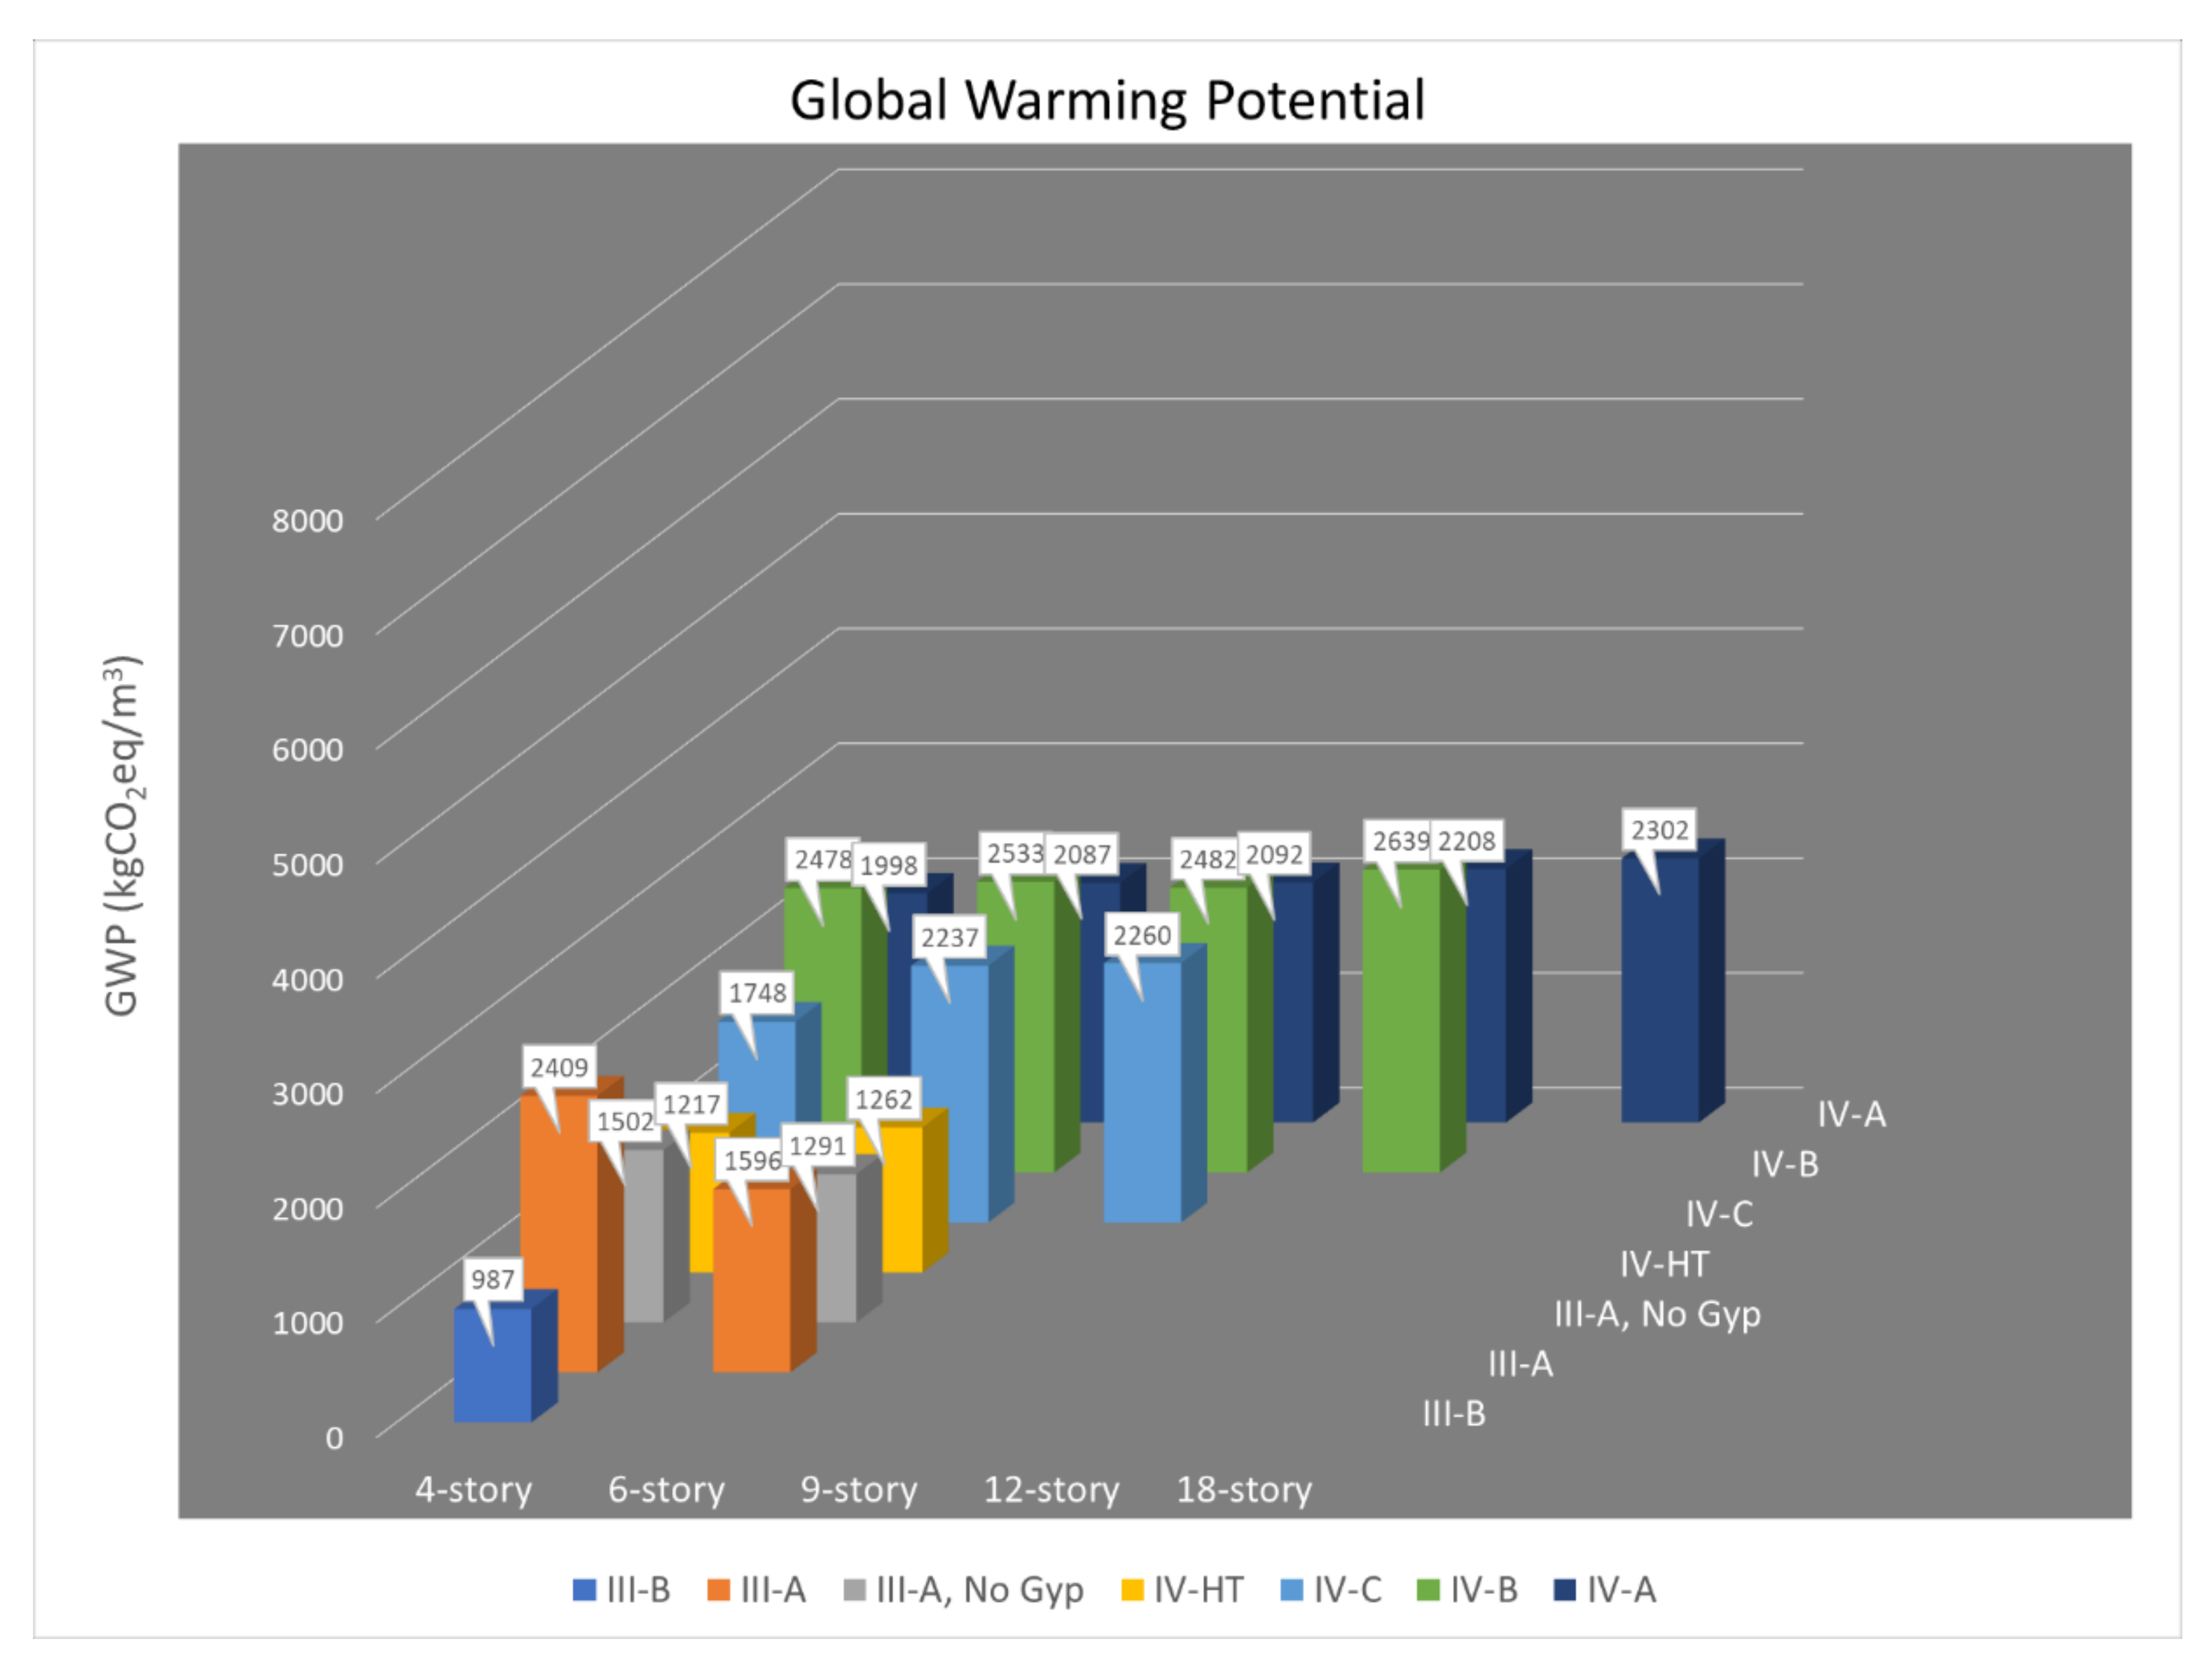
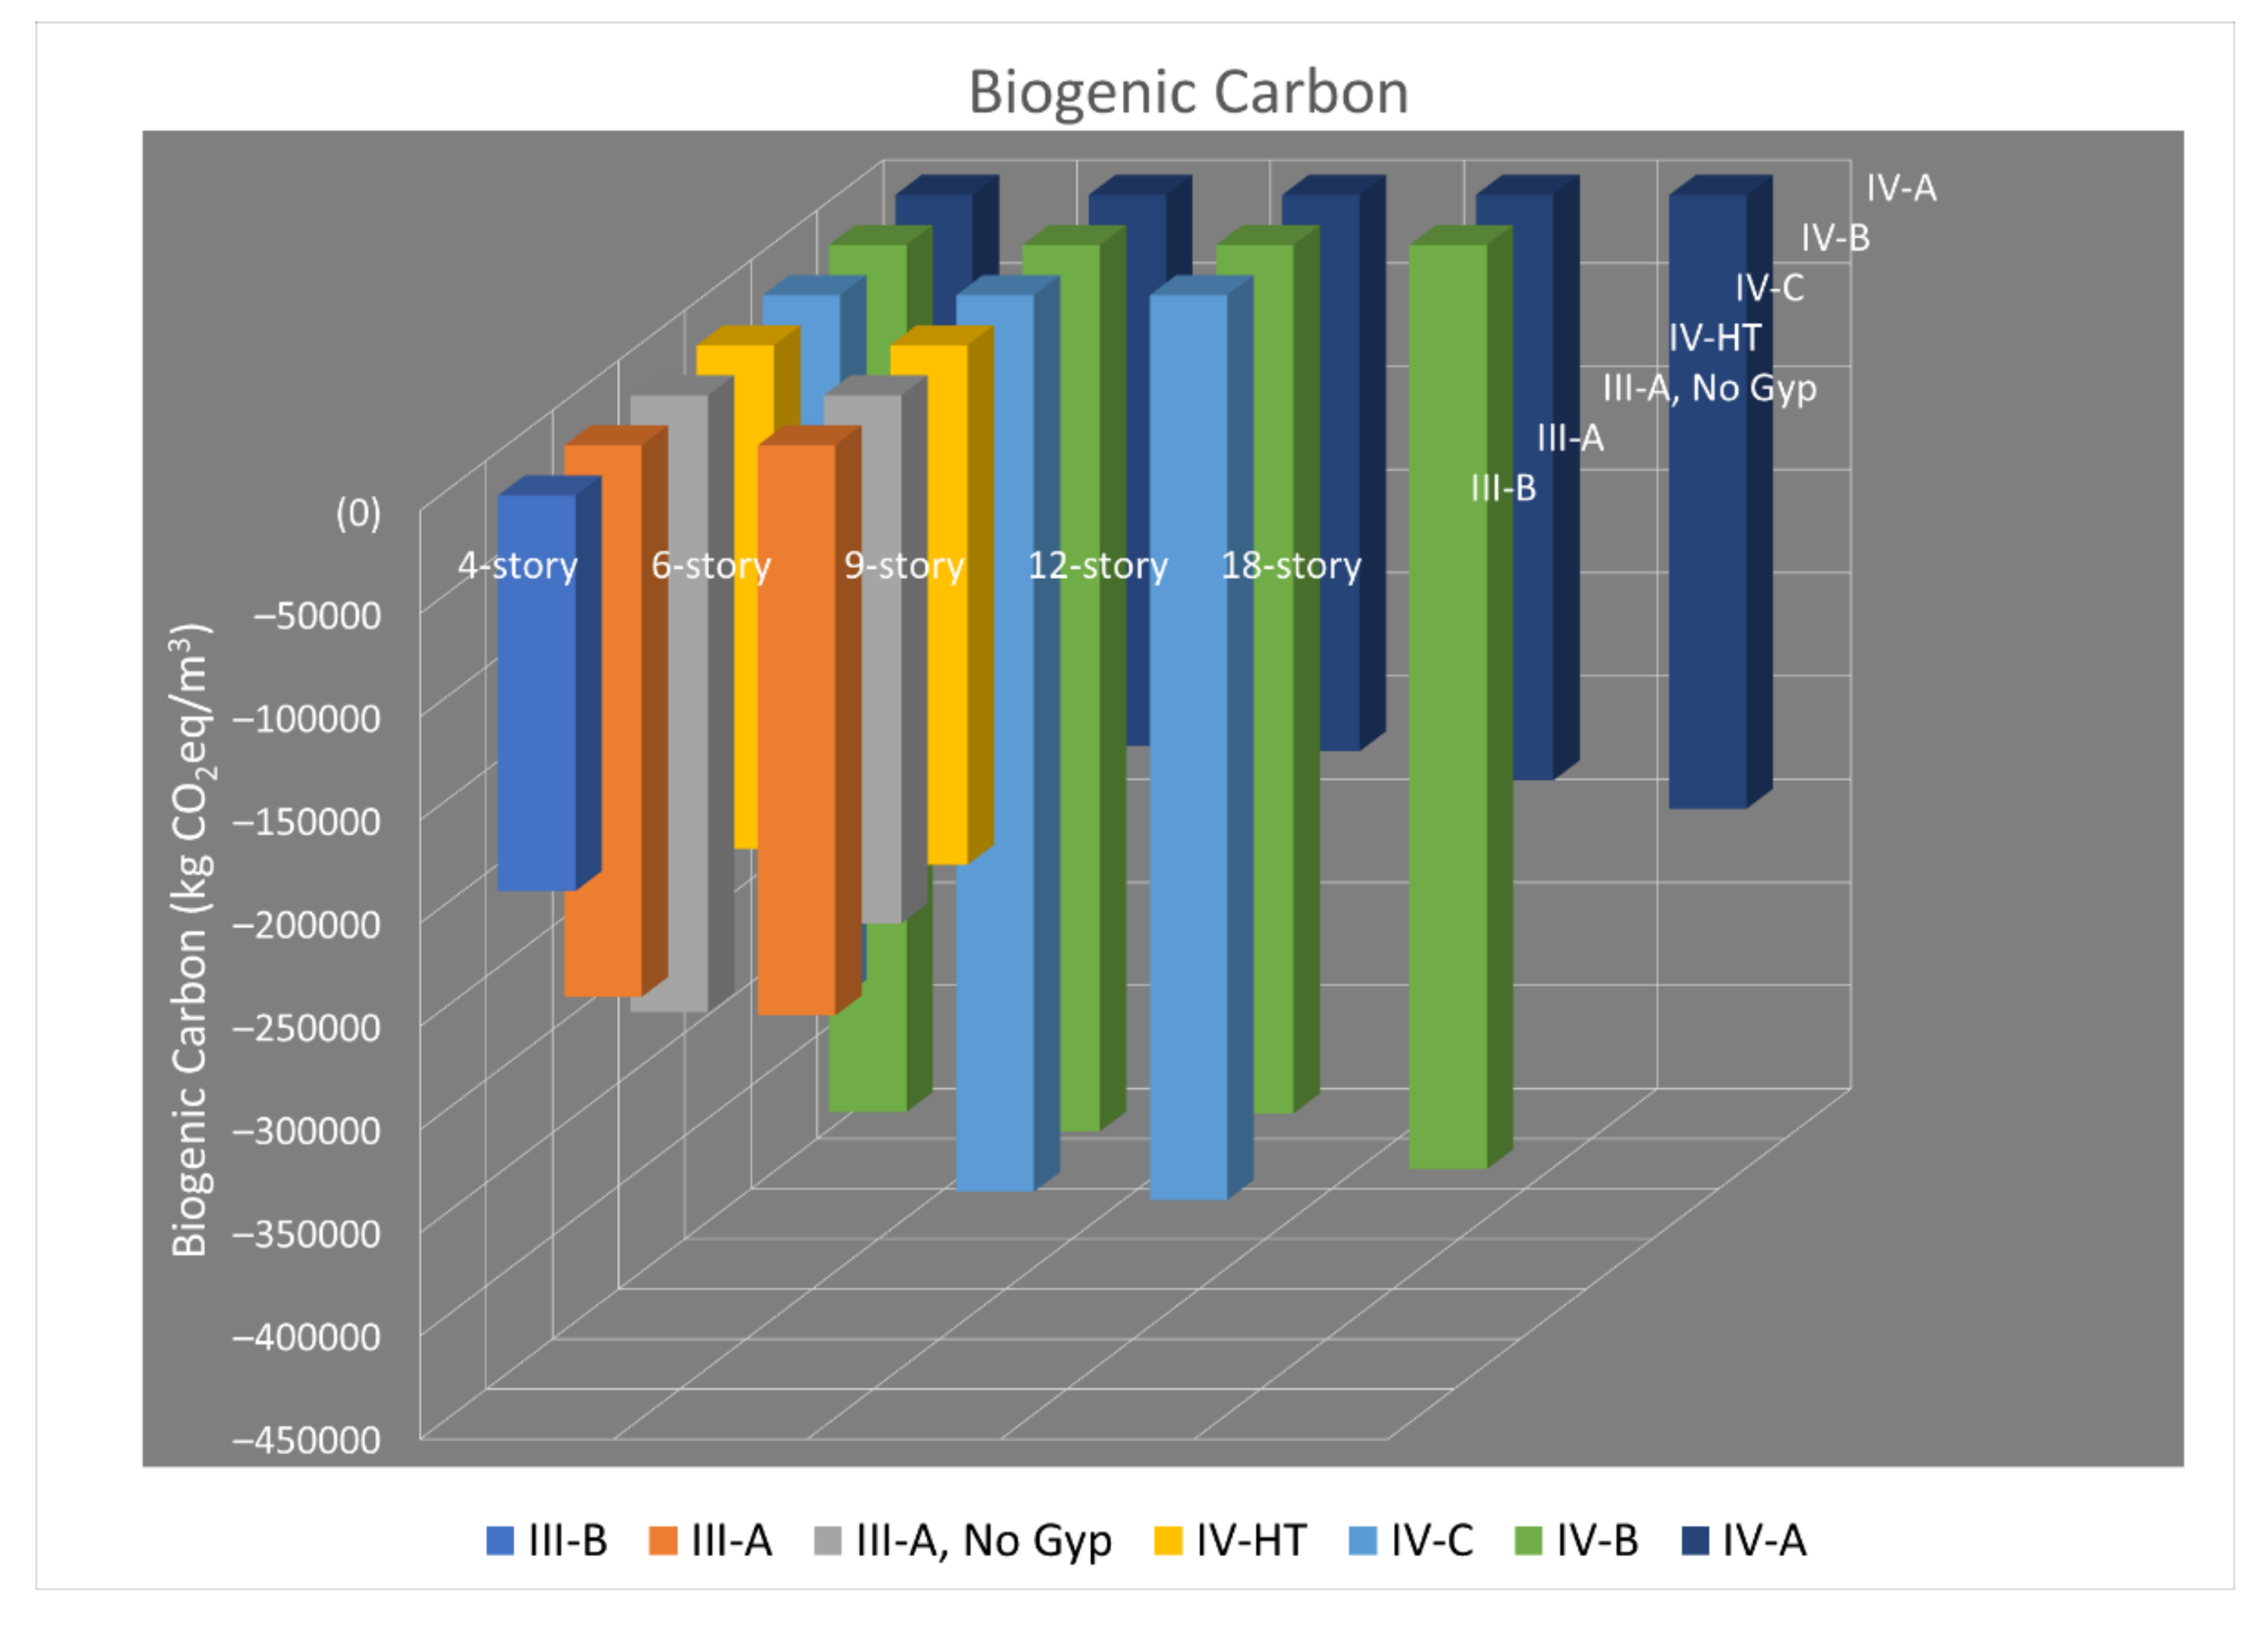
3.2.6. Sensitivity Study: Carbon Impact

This study began with a focus on monetary cost analysis; however, it became apparent that the data collected could also be used to establish the relative global warming potential (GWP) of the different timber systems, and the biogenic or sequestered carbon. The GWP and sequestered carbon per cubic meter for CLT used in this study are 137.19 kgCO2 eq/m3 and −741.36 kgCO2 eq/m3, respectively [13]. The GWP for glulam is 197.97 kgCO2 eq/m3 and the sequestered carbon is −964.28 kgCO2 eq/m3 [14]. The GWP for gypsum board is 187.82 kgCO2 eq/m3 and it has no sequestered carbon [15]. Figure 18 and Figure 19 illustrate these quantities for the limited set of the most economical configuration for each building type at its maximum allowable story height; these can be compared directly to the monetary cost for the same systems in Figure 16. The relative differences in GWP between systems is relatively small (Figure 18); however, when considering biogenic carbon within the wood products, more differences are revealed. It can be seen that, when the required fire rating is achieved using the mass timber volume, the volume of wood increases, as does the sequestered carbon potential (negative GWP impact). Compare, for example, building types IV-A and IV-B in Figure 19.
This figure includes only the estimated biogenic carbon and does not include life cycle embodied carbon impacts, illustrating the sequestration potential of the wood products.

4. Conclusions

As mass timber is increasingly used as a means to lower the embodied carbon impact of the built environment, its cost has become a—hopefully momentary—impediment to its use. As the mass timber market in the U.S. experiences rapid growth, the cost of mass timber buildings will fluctuate based on the relationship of demand and supply among many other factors. However, designers can, within the constraints for different code-specified building types, still optimize building grid systems for carbon impact and cost from the earliest point in design using wood volume and noncombustible cover (gypsum board) as primary drivers of both. It should be clear that the particular values and unit cost data used in this study are already obsolete; however, since this study was conducted for different building height and types on a level playing field of cost data, some general conclusions can be made from the comparison:
  • The cost of CLT floor material and gypsum board for non-combustible protection (when needed) tend to dominate the material cost for mass timber gravity systems regardless of building type;
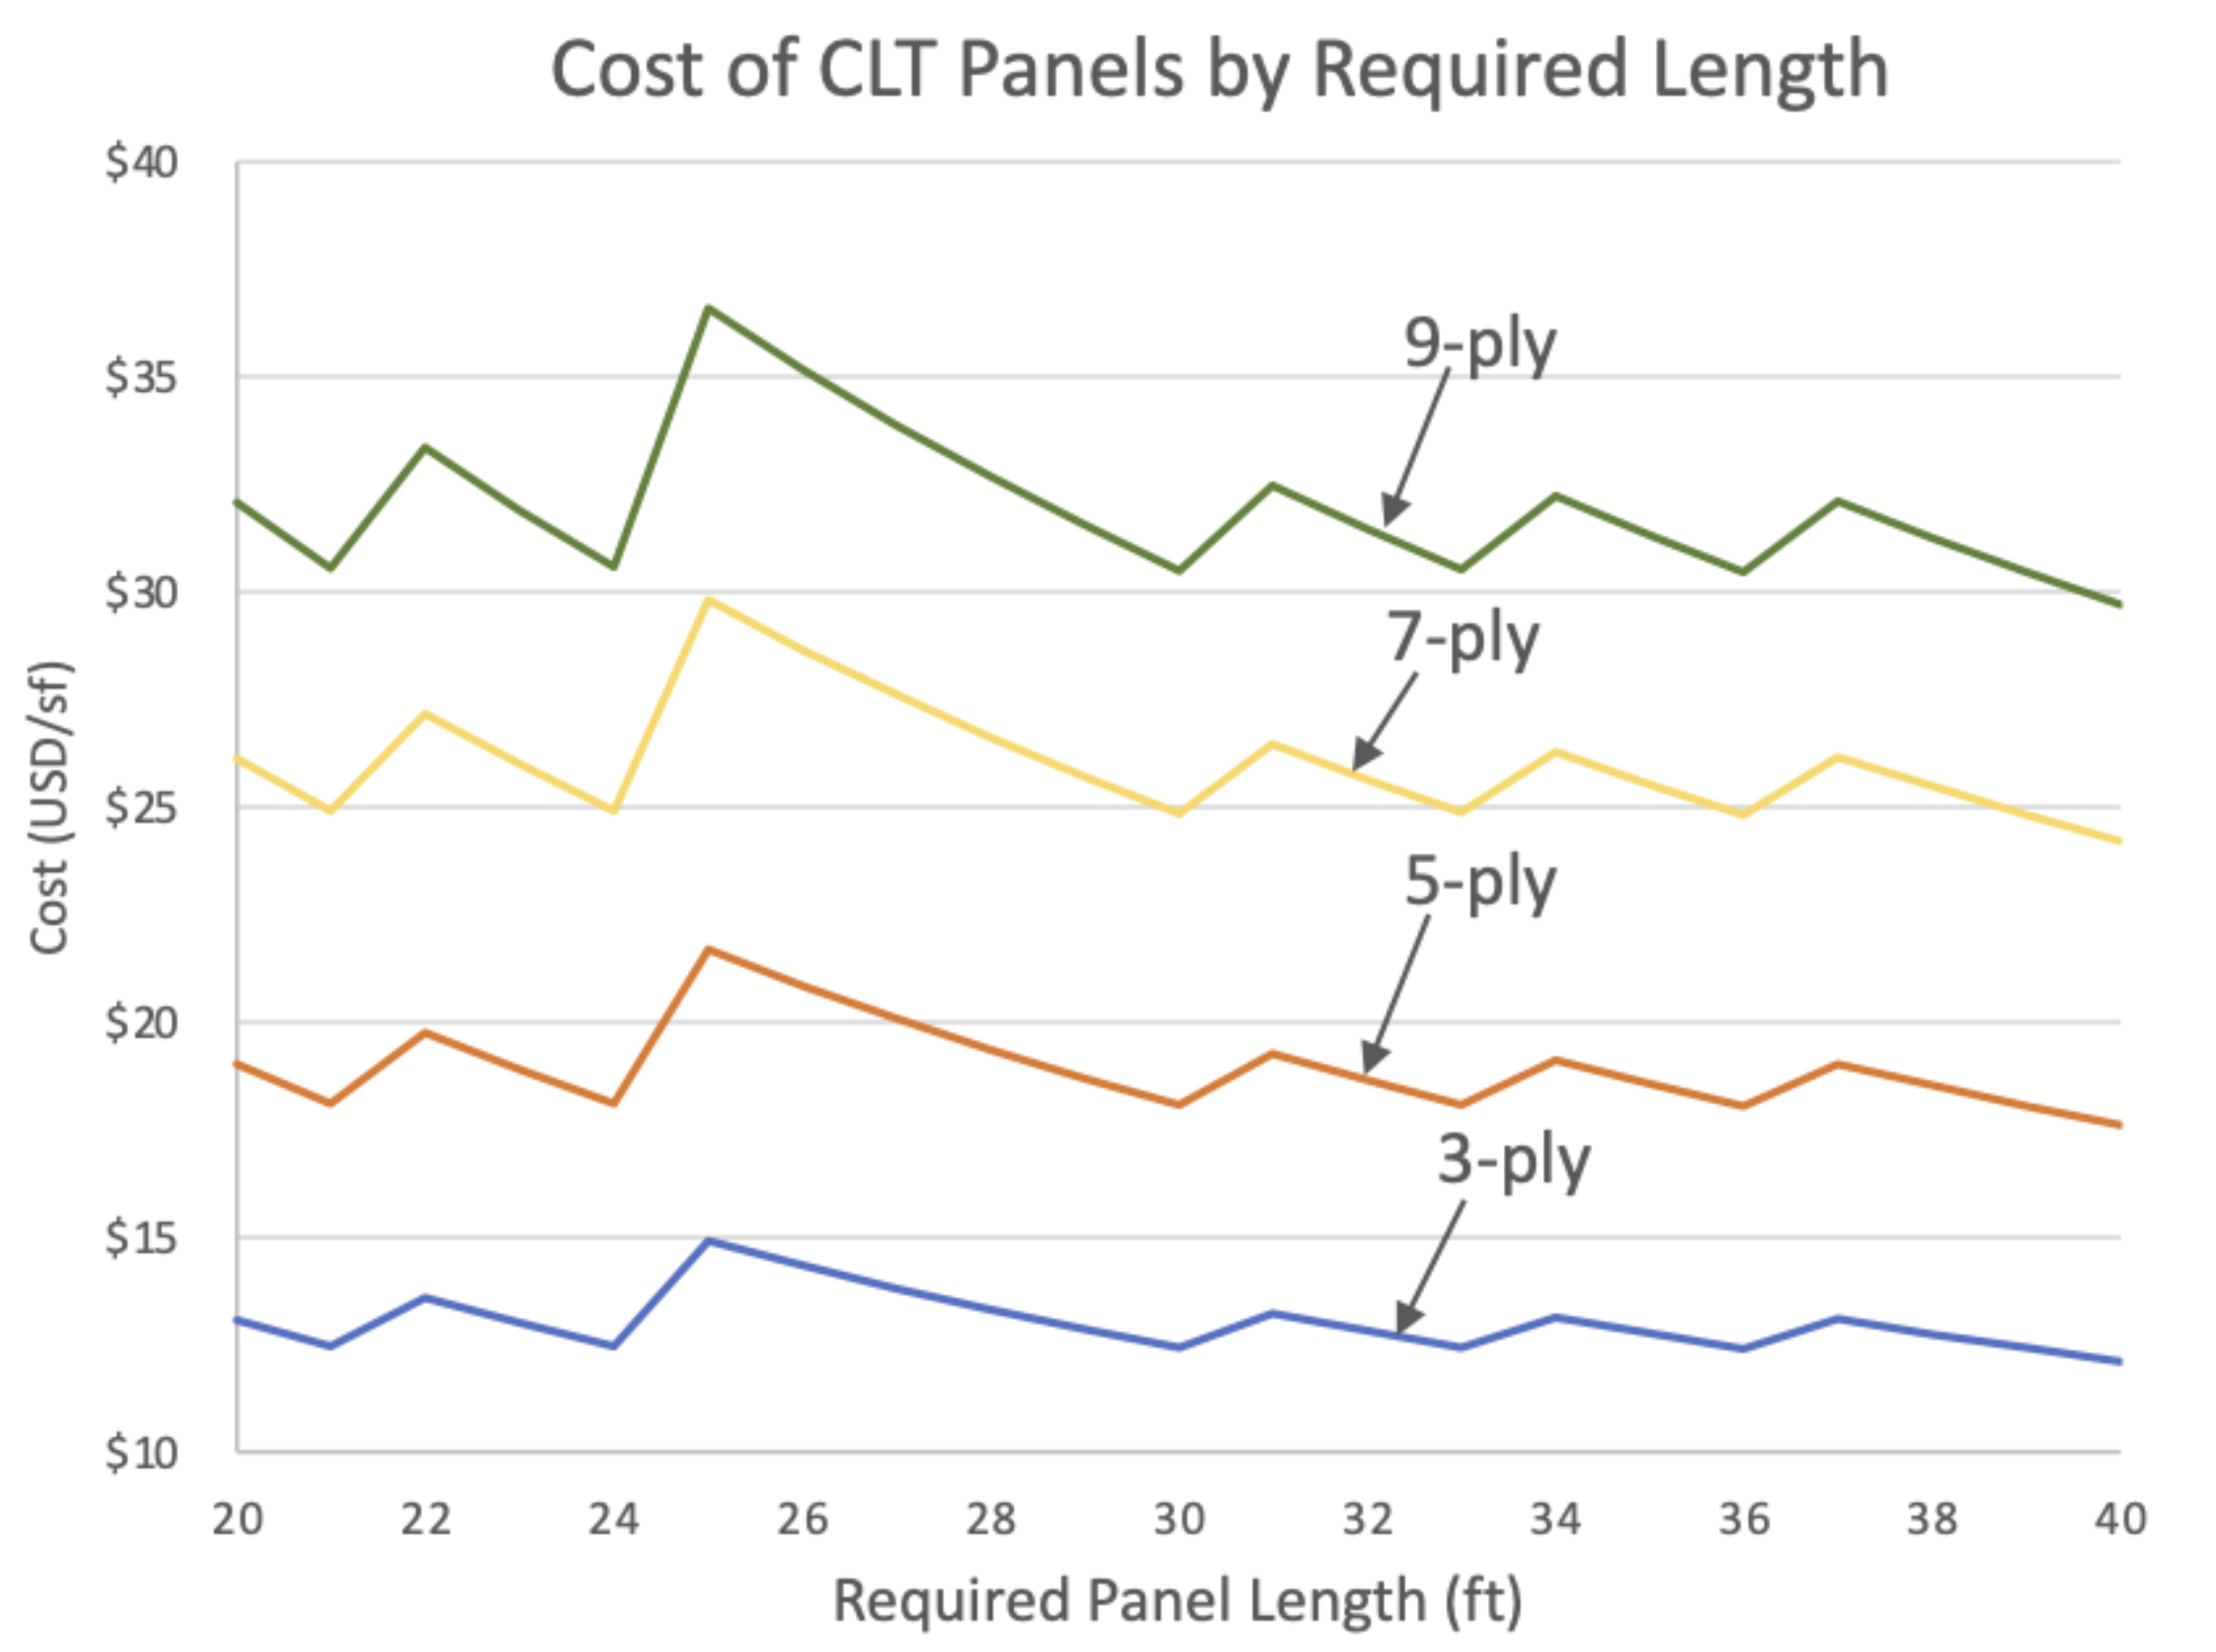
  • The unit cost of CLT is greatly affected by the pressed lengths used by the manufacturer (dictated by the manufacturing process and equipment unique to each manufacturer). There is a non-linear relationship between required panel length and cost that the designer must be aware of because this trend will transfer to the overall building system cost;
  • For a four-story building, the most economical building type is Type III-B because no FRR or non-combustible protection is required for this building type;
  • For a six-story building, Type III-A and Type IV-HT have fairly close price performances, with Type III-A requiring FRR that can be addressed with limited gypsum board coverage or increased wood member sizes;
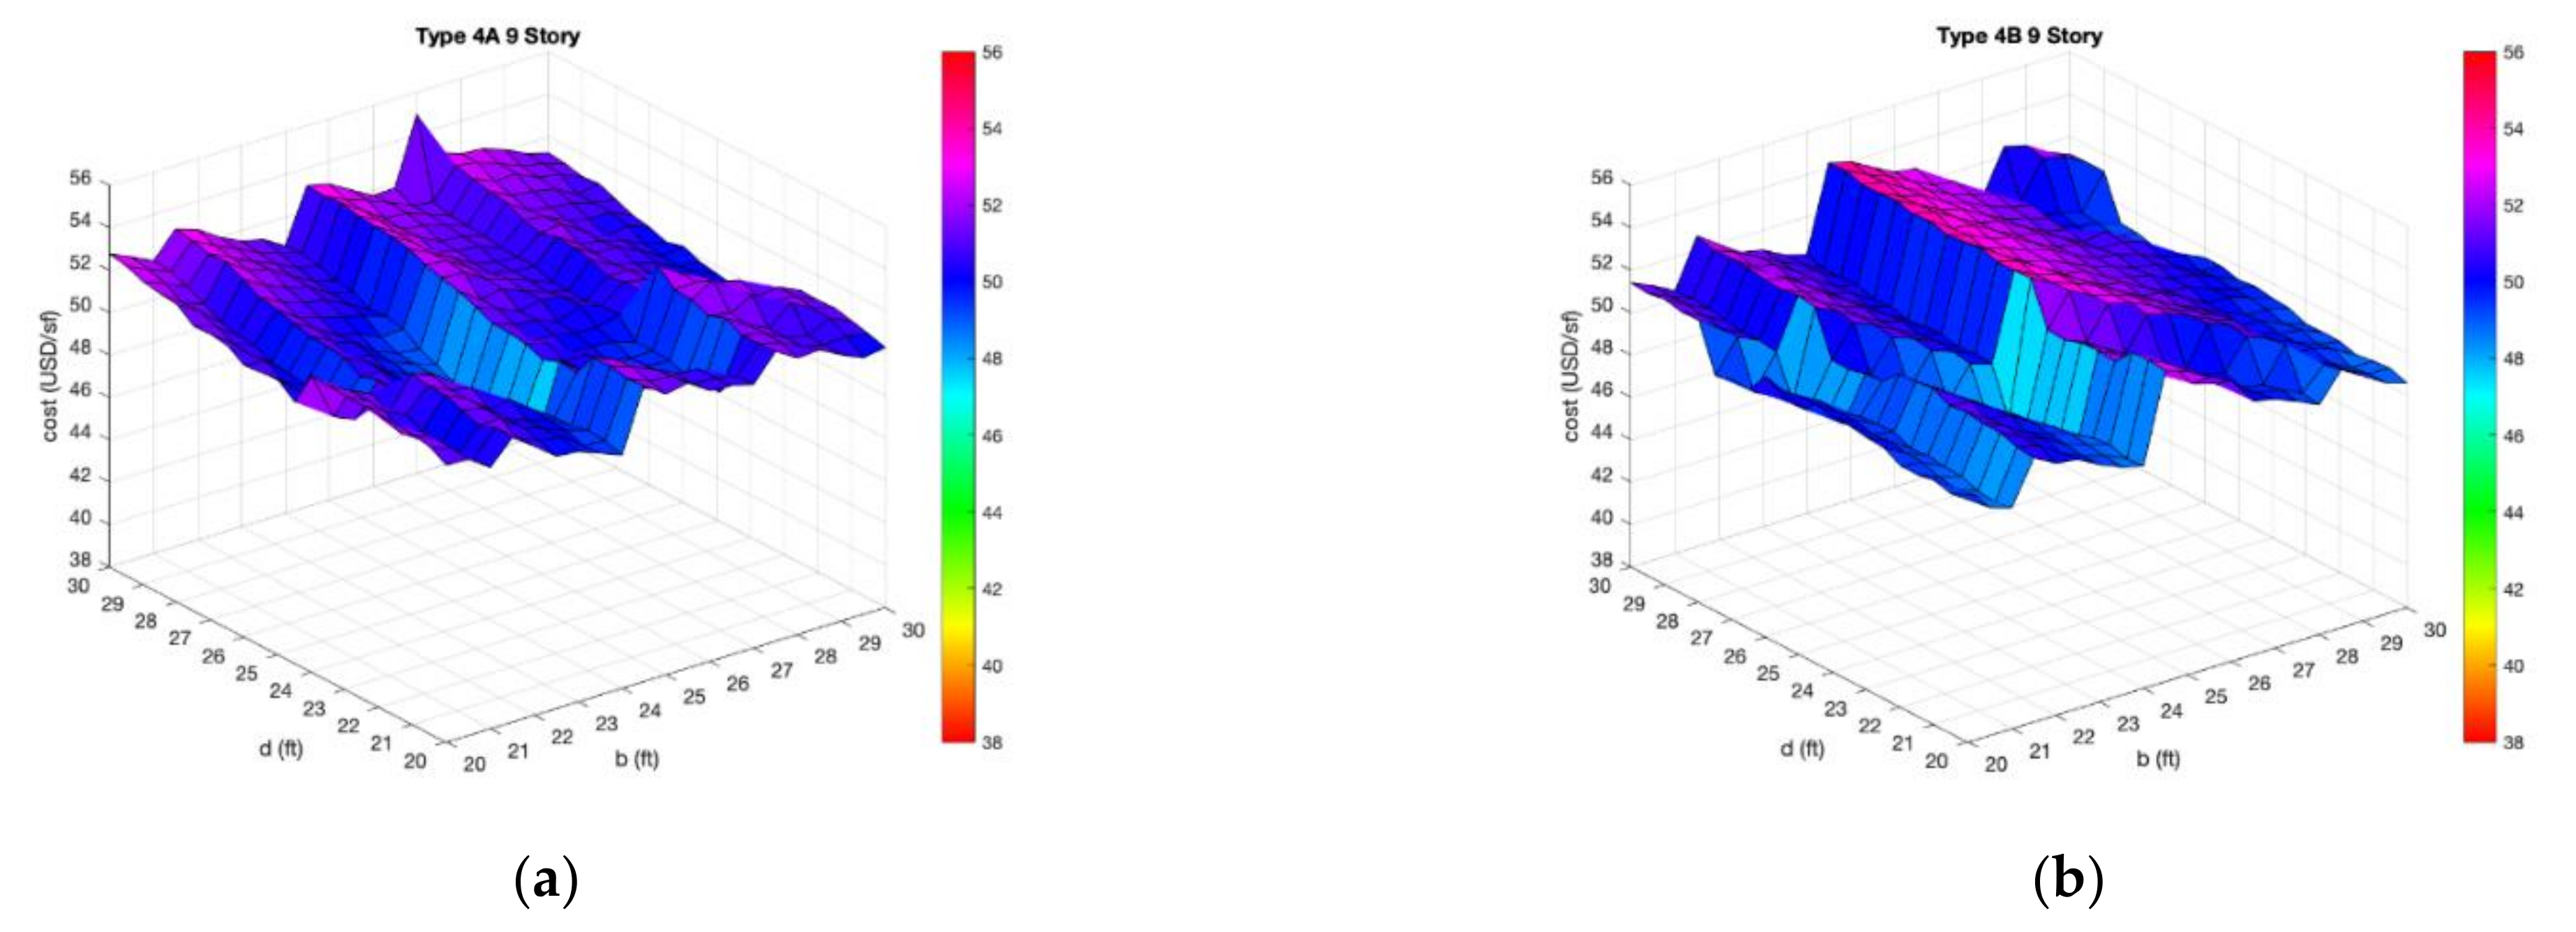
  • For a nine-story building, Type IV-C is the least expensive building type as it does not require any gypsum board. Type IV-A and IV-B both require gypsum board;
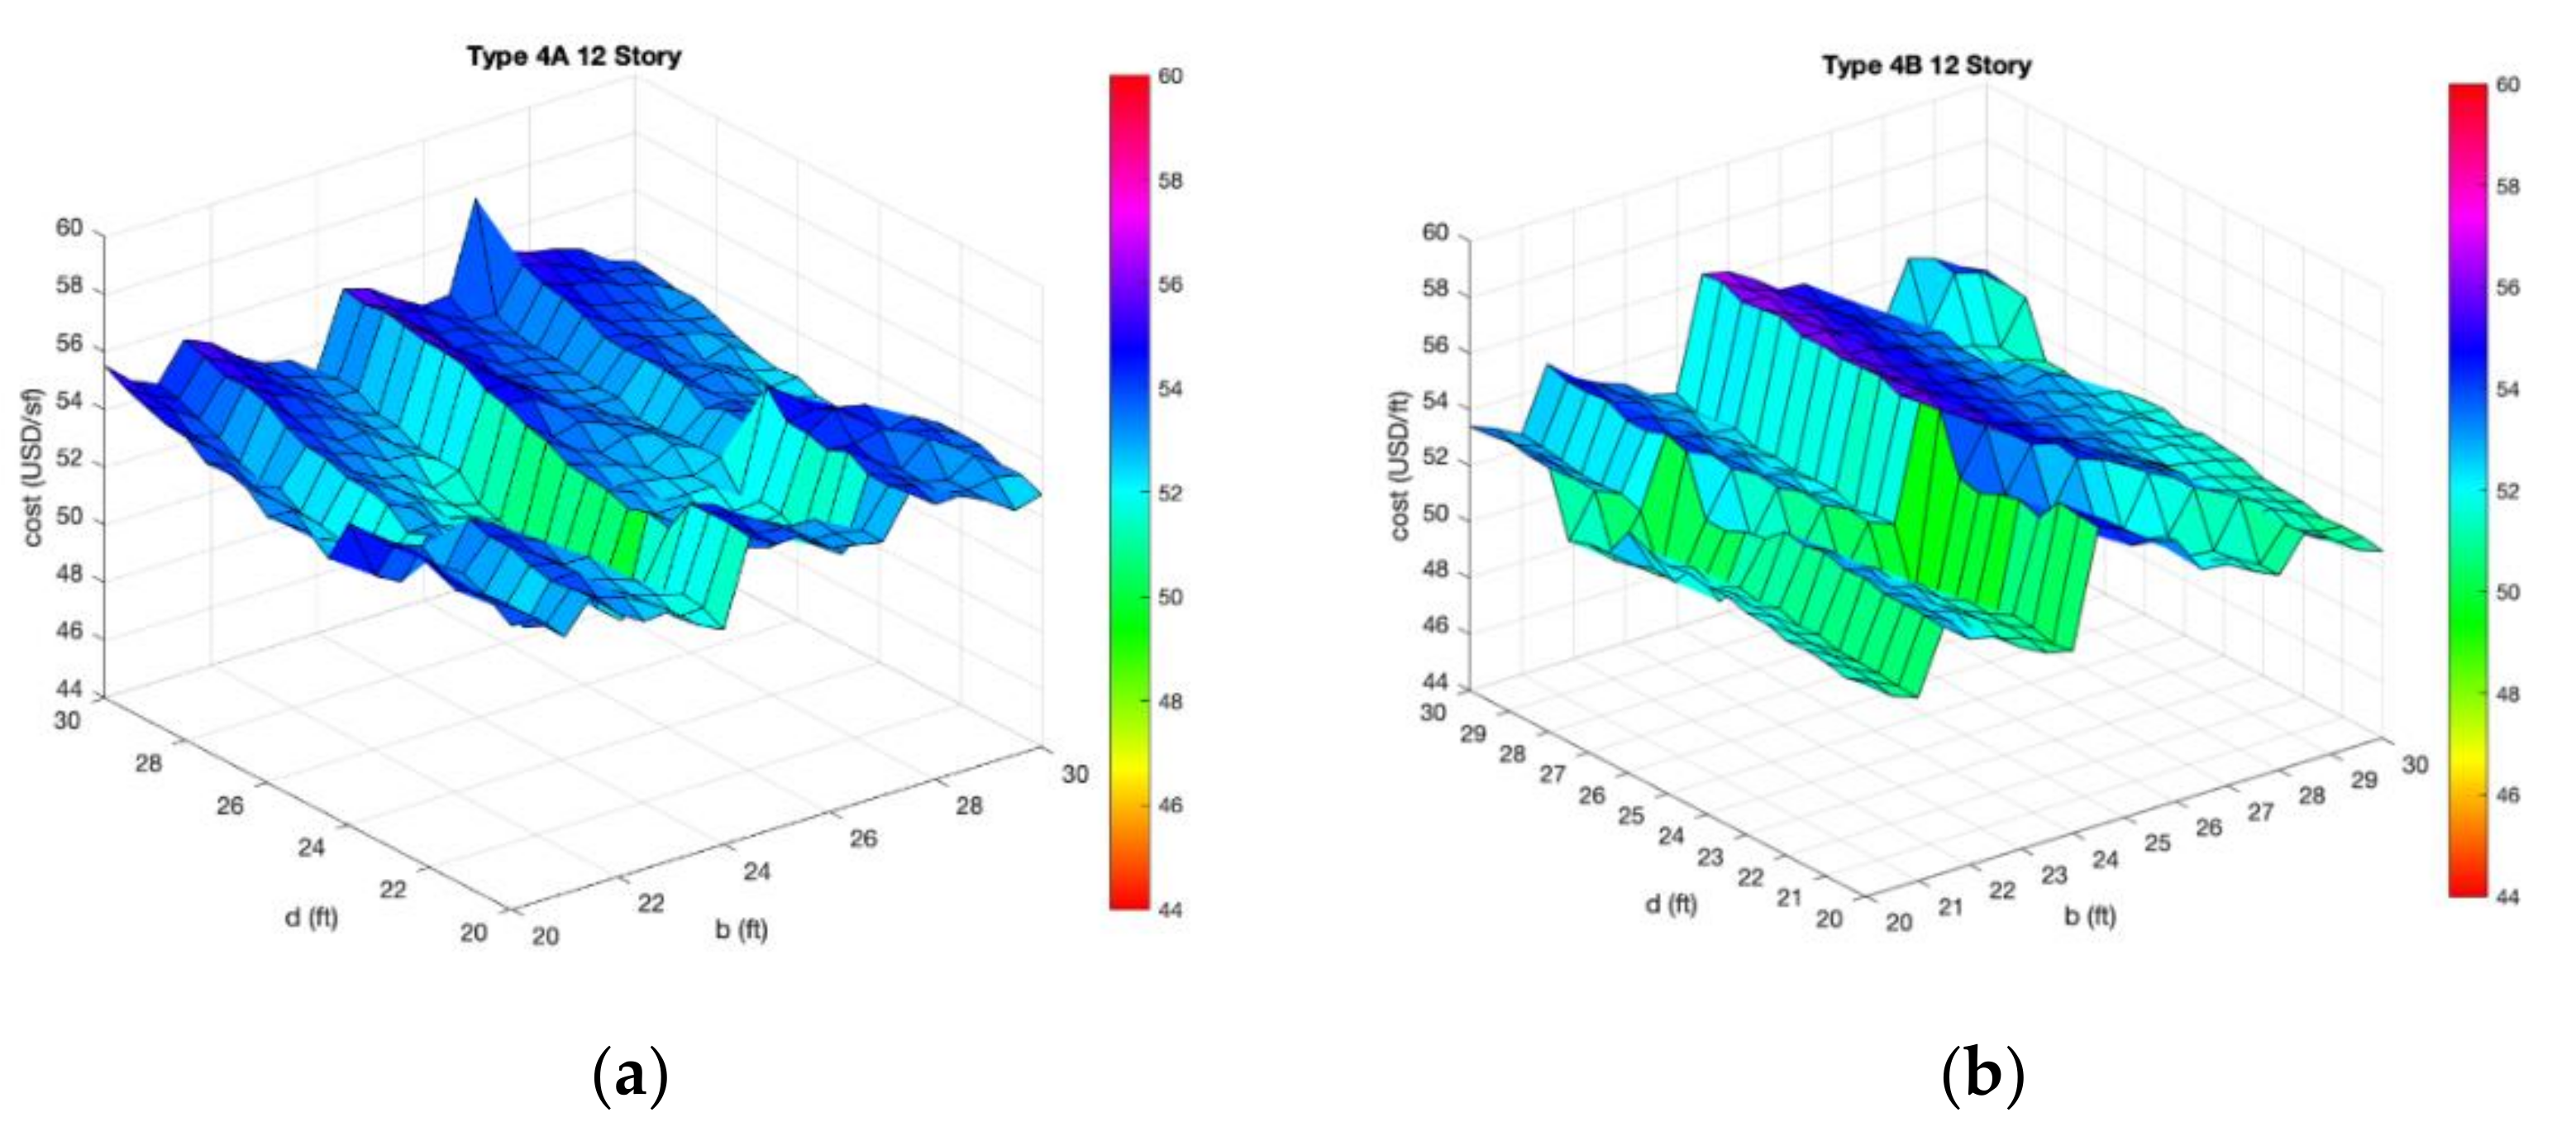
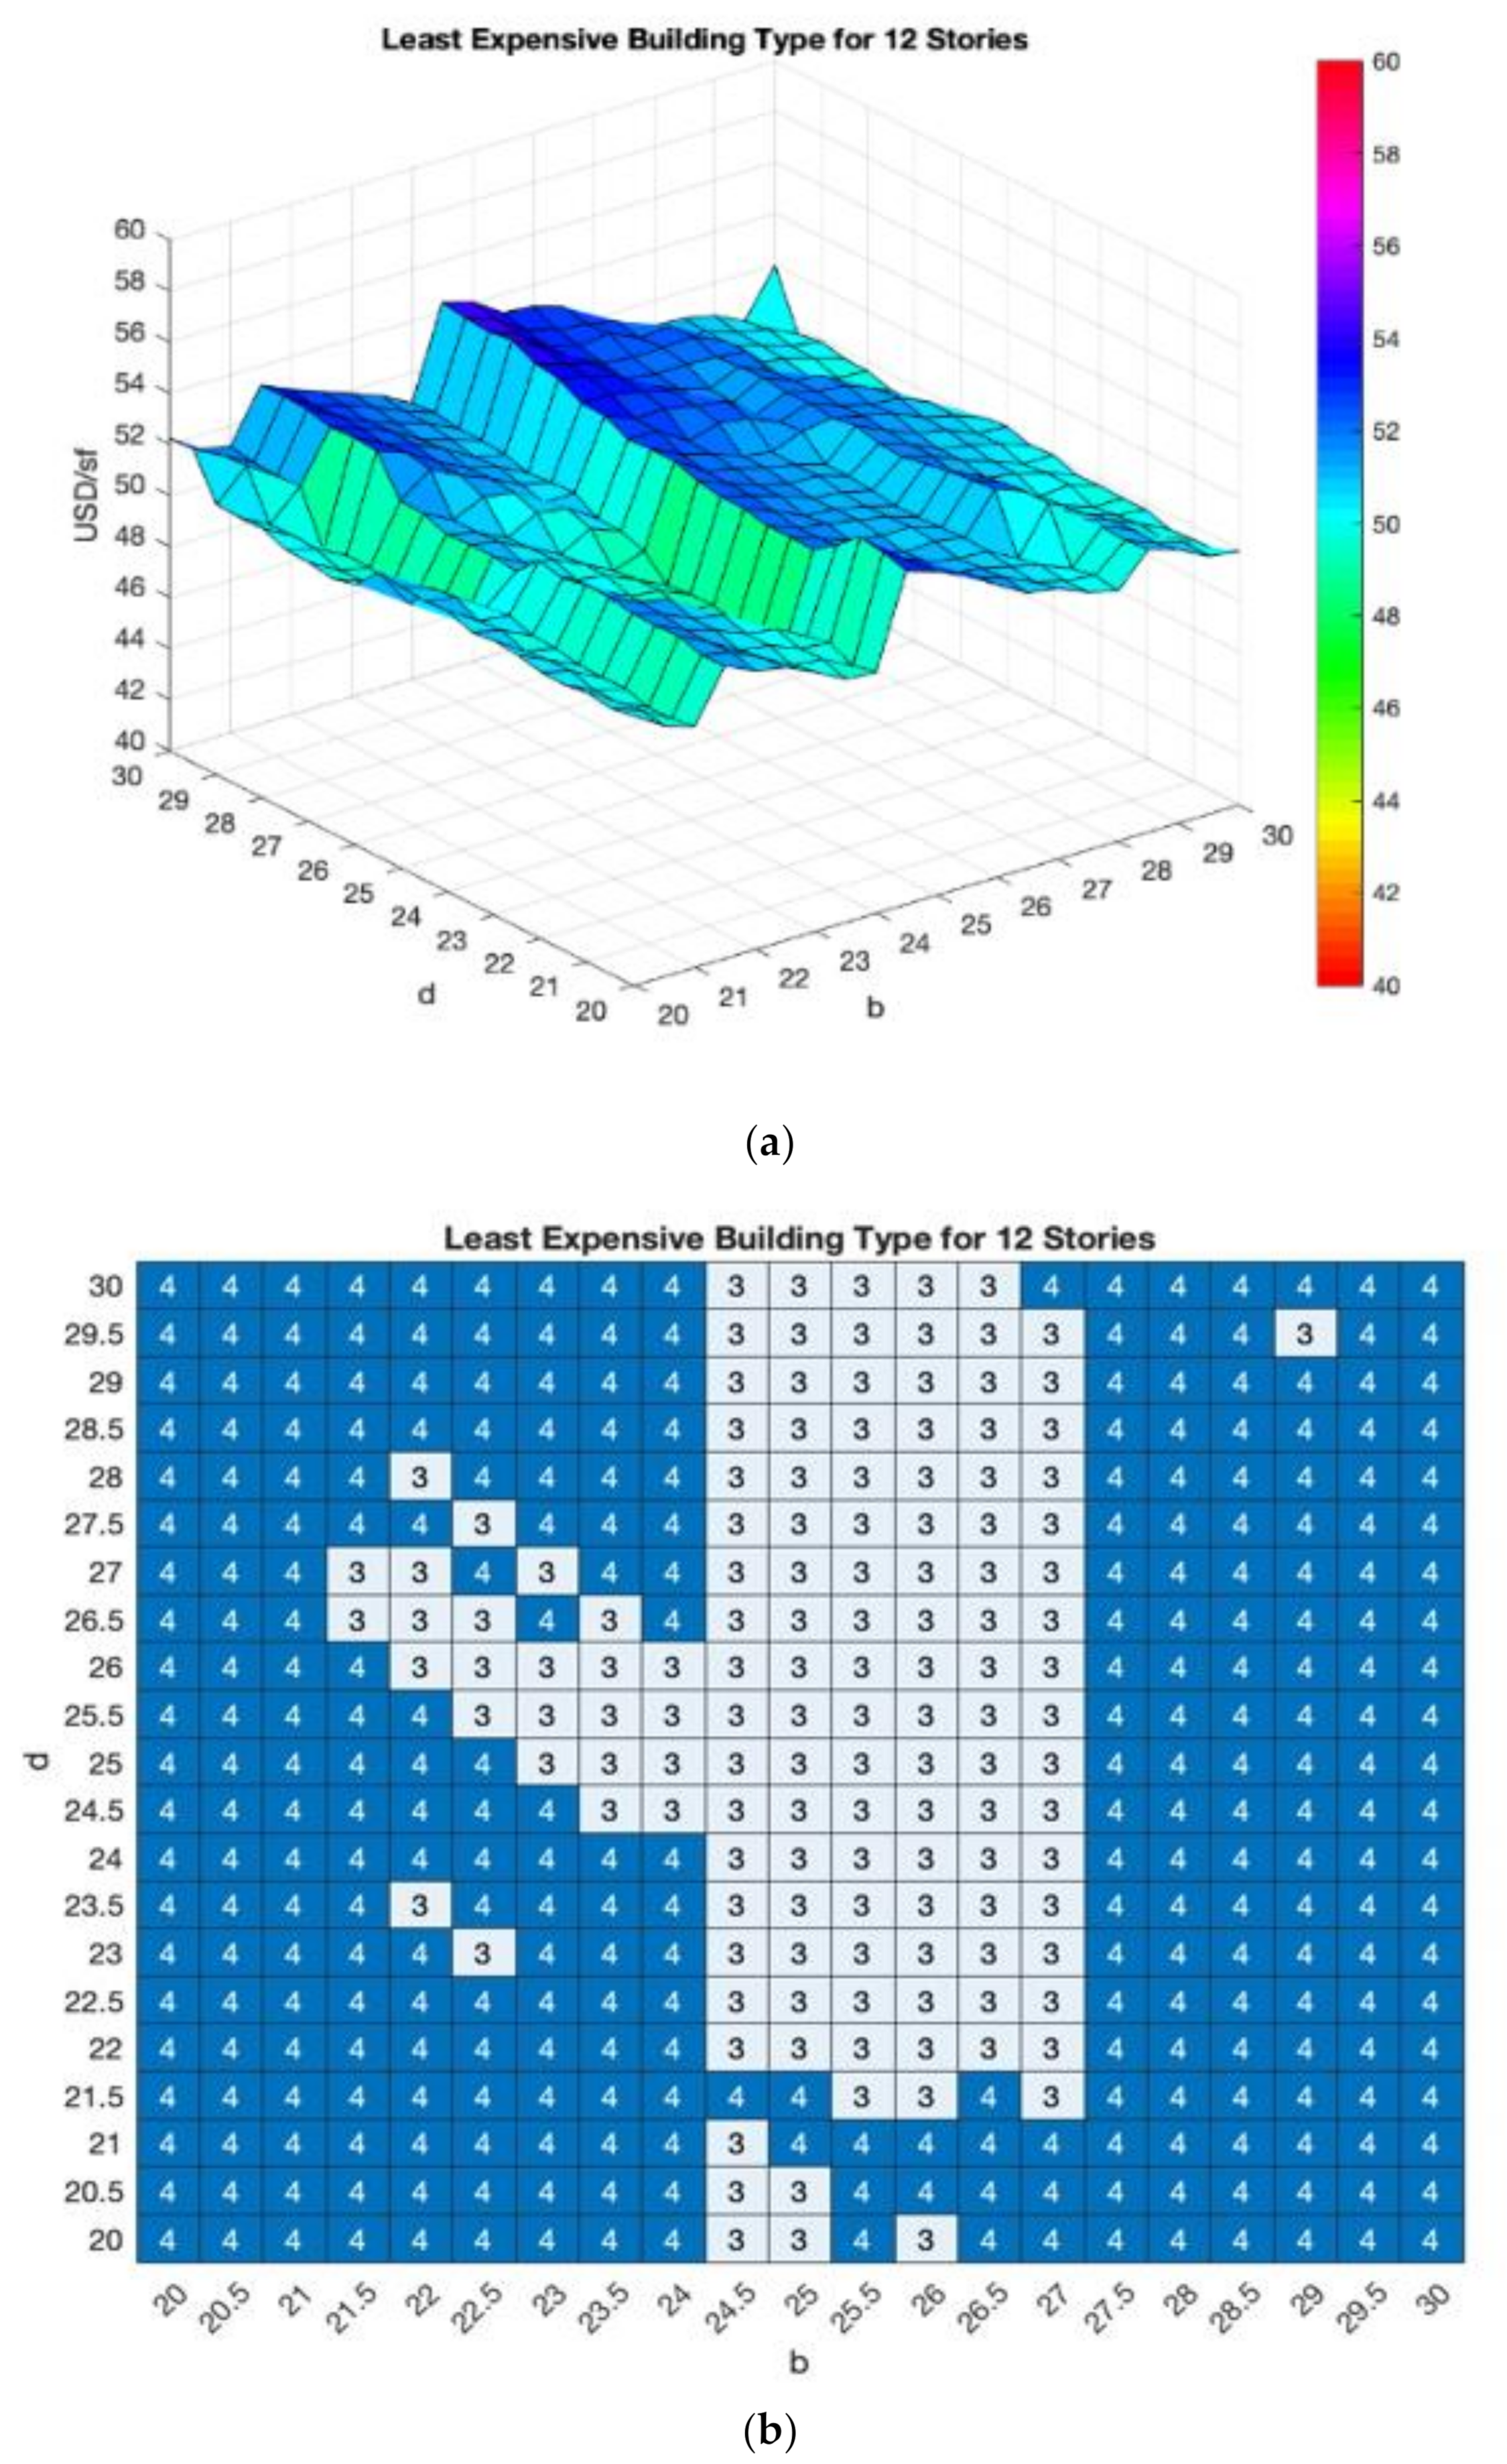
  • For a 12-story building, Type IV-B is a cheaper option than Type IV-A for most of the bay sizes investigated in this study. However, this cost-effectiveness is highly dependent on the unit price of CLT that is available to the project. Thus, the Type IV-B option might become more attractive once the CLT market becomes more mature and production capacity increases. In addition to cost consideration, Type IV-B is the only option to enable exposed wood at this height level;
  • As the only wood option above 12 stories, the cost of the Type IV-A gravity system is high mainly due to the gypsum protection costs. Great innovations in non-combustible fire protection could greatly increase the competitiveness of this building type. Even with the current method of fire-proofing, Type IV-A could become favorable once other costs are factored in, such as the cost of the land;
  • Goals to sequester carbon using wood products can be at odds with goals for cost, because, in general, both increase as the volume of wood increases. This study has shown that the interplay of wood volume and noncombustible covering must be considered together to obtain a realistic understanding of both cost and embodied carbon impact;
  • The rise of viable platforms to provide embodied carbon credits [12] may ultimately alter the dynamic between monetary cost and carbon sequestration goals.
The cost of mass timber construction is a very complicated topic. This study is quite simplified and has only scratched the surface of this area. Aside from the maturity of the market, and improvement in fire-protection methods, one other area that could significantly impact tall wood building viability is policy and public opinion on renewable resources, carbon sequestration benefit, and long-term life cycle building benefit. These topics need to be further investigated in future studies in order to enable the efficient and informed use of these new building types.

Author Contributions

Conceptualization, S.P. and G.K.; Data curation, G.K. and A.F.; Investigation, S.P.; Methodology, R.C., S.P. and A.F.; Resources, G.K.; Supervision, S.P.; Writing — original draft, R.C., S.P., G.K. and A.F.; Writing — review & editing, R.C., G.K. and A.F. All authors have read and agreed to the published version of the manuscript.

Funding

This research was funded by US Endowment of Forestry and Communities and National Science Foundation, grant CMMI 1636164.

Institutional Review Board Statement

Not applicable.

Informed Consent Statement

Not applicable.

Data Availability Statement

The data presented in this study are available on request from the corresponding author.

Acknowledgments

The authors would also like to thank anonymous timber product suppliers for willingness to share cost information and Shawn Brannon of Adolfson & Peterson Construction for providing estimation of gypsum cost.

Conflicts of Interest

The authors declare no conflict of interest.

References

  1. International Energy Agency; United Nations Environment Programme. 2018 Global Status Report: Towards a Zero-Emission, Efficient and Resilient Buildings and Construction Sector; UN Environment and International Energy Agency: Paris, France, 2018. [Google Scholar]
  2. Churkina, G.; Organschi, A.; Reyer, C.P.O.; Ruff, A.; Vinke, K.; Zhu, L.; Reck, B.K.; Graedel, T.E.; Schellnhuber, H.J. Buildings as a global carbon sink. Nat. Sustain. 2020, 3, 269–276. [Google Scholar] [CrossRef]
  3. Borjen, Y.; Gagnon, S.; Williamson, T.; Pirvu, C. The cross-laminated timber standard in north America. In Proceedings of the World Conference on Timber Engineering, Auckland, New Zealand, 15–19 July 2012. [Google Scholar]
  4. Muszyński, L.; Gupta, R.; Hong, S.H.; Osborn, N.; Pickett, B. Fire resistance of unprotected cross-laminated timber floor assemblies produced in the USA. Fire Saf. J. 2019, 107, 126–136. [Google Scholar] [CrossRef]
  5. Breneman, S.; Timmers, M.; Richardson, D. Tall Wood Buildings in the 2021 IBC Up to 18 Stories of Mass Timber. WoodWorks. Available online: https://www.woodworks.org/wp-content/uploads/wood_solution_paper-TALL-WOOD.pdf (accessed on 19 September 2020).
  6. Mallo, M.F.L.; Espinoza, O. Outlook for cross-laminated timber in the United States. BioResources 2014, 9, 4. [Google Scholar]
  7. Mallo, M.F.L.; Espinoza, O. Cross-laminated timber vs. concrete/steel: Cost comparison using a case study. In Proceedings of the World Conference on Timber Engineering, Vienna, Austria, 22–25 August 2016. [Google Scholar]
  8. Kremer, O.D.; Symmons, M.A. Mass timber construction as an alternative to concrete and steel in Australia building industry: A PESTEL evaluation of the potential. Int. Wood Prod. J. 2015, 6, 3. [Google Scholar] [CrossRef]
  9. Chaggaris, R.; Pei, S.; Kingsley, G.; Kinder, E. Cost effectiveness of mass timber beam–column gravity systems. J. Archit. Eng. 2021, 27, 3. [Google Scholar] [CrossRef]
  10. ANSI/AWC (American National Standards Institute/American Wood Council). National Design Specification for Wood Construction (NDS). 2018. Available online: https://www.awc.org/pdf/codes-standards/publications/nds/AWC-NDS2018-ViewOnly-171117.pdf (accessed on 19 September 2020).
  11. International Code Council (ICC). International Building Code (IBC). 2018. Available online: https://codes.iccsafe.org/content/IBC2018 (accessed on 19 September 2020).
  12. Srubar, W.; Barnes, S.; Grieshaber, M.; Orens, A. A Methodology for Building-Based Embodied Carbon Offsetting. A white paper, Aureus Earth, Inc. 2021. Available online: http://www.aureusearth.com (accessed on 19 September 2020).
  13. Environmental Product Declaration: Nordic X-Lam. FPInnovations. August 2018. Available online: https://library.fpinnovations.ca/en/permalink/fpipub7910?utm_source=blog&utm_medium=blogpost&utm_campaign=20210204Recentpublications. (accessed on 23 February 2021).
  14. Environmental Product Declaration: North American Glued Laminated Timbers. American Wood Council and Canadian Wood Council. April 2013. Available online: https://www.awc.org/pdf/greenbuilding/epd/AWC-EPD-Glulam-1307.pdf (accessed on 23 February 2021).
  15. An Environmental Product Declaration. Gypsum Association. April 2020. Available online: https://www.pabcogypsum.com/sites/default/files/EPD_Type_X_Gypsum_Board_2020.pdf (accessed on 23 February 2021).
Figure 1. Mass timber gravity system with notations.
Sustainability 13 12966 g001
Figure 2. Schematic of the automated design and cost estimation program.
Sustainability 13 12966 g002
Figure 3. The unit cost for CLT for a manufacturer that uses press lengths of 5.6m (18.5 ft), 6.58 m (21.6 ft), 7.53 m (24.7 ft), and 9.39 m (30.8 ft) (1 ft = 0.3048 m, 1 ft2 = 0.0929 m2).
Sustainability 13 12966 g003
Figure 4. The unit cost of glulam for a given beam or column width (1 in = 25.4 mm).
Sustainability 13 12966 g004
Figure 5. The estimated cost of beam connections for each class (1 lb = 4.448 N).
Sustainability 13 12966 g005
Figure 6. The estimated cost of column connections for each class (1 in = 25.4 mm).
Sustainability 13 12966 g006
Figure 7. Price breakdown for Type III-B, Type IV-A, and Type IV-C 25x25 foot bay for a four-story building.
Sustainability 13 12966 g007
Figure 8. (a) Surface plot of costs of bay configurations for Type III-B building type. (b) Surface plot of costs of bay configurations for Type IV-A building type. (c) Contour plot of costs of bay configurations of Type III-B building type. (d) Contour plot of costs of bay configurations of Type IV-A building type.
Sustainability 13 12966 g008
Figure 9. (a) Surface plot of costs of bay configurations for Type III-A building type. (b) Surface plot of costs of bay configurations for Type III-B building type. (c) Surface plot of costs of bay configurations for Type IV-A building type. (d) Surface plot of costs of bay configurations for Type IV-B building type. (e) Surface plot of costs of bay configurations for Type IV-C building type. (f) Surface plot of costs of bay configurations for Type IV-HT building type.
Sustainability 13 12966 g009
Figure 10. (a) Surface plot of costs of bay configurations for Type III-A building type. (b) Surface plot of costs of bay configurations for Type IV-A building type. (c) Surface plot of costs of bay configurations for Type IV-B building type. (d) Surface plot of costs of bay configurations for Type IV-C building type. (e) Surface plot of costs of bay configurations for Type IV-HT building type.
Sustainability 13 12966 g010
Figure 11. (a) Surface graph of the most economical costs of bay configurations for a six-story building. (b) Building type of the most economical costs of bay configurations for a six-story building (1 = Type III-A, 6 = Type IV-HT).
Sustainability 13 12966 g011
Figure 12. (a) Surface plot of costs of bay configurations for Type IV-A building type. (b) Surface plot of costs of bay configurations for Type IV-B building type. (c) Surface plot of costs of bay configurations for Type IV-C building type.
Sustainability 13 12966 g012aSustainability 13 12966 g012b
Figure 13. (a) Surface plot of costs of bay configurations for Type IV-A building type. (b) Surface plot of costs of bay configurations for Type IV-B building type.
Sustainability 13 12966 g013
Figure 14. (a) Surface graph of the most economical costs of bay configurations for a 12-story building. (b) Building type of the most economical costs of bay configurations for a 12-story building (3 = Type IV-A and 4 = Type IV-B).
Sustainability 13 12966 g014
Figure 15. Cost breakdown for a 25 × 25 foot bay for a 4-story, 6-story, 12-story, and 18-story building.
Sustainability 13 12966 g015
Figure 16. The cost of the least expensive bay option for each viable building type for a given number of stories.
Sustainability 13 12966 g016
Figure 17. The total price given a land price for the cheapest building type for each number of stories.
Sustainability 13 12966 g017
Figure 18. GWP for Stages A1–A3 (extraction through manufacturing) for least expensive bay option for each viable building type for a given number of stories.
Sustainability 13 12966 g018
Figure 19. Biogenic Carbon Potential for least expensive bay option for each viable building type for a given number of stories.
Sustainability 13 12966 g019
Table 1. The FRR, Required Non-combustible Protection, Story Limit, and Maximum Height for each Building Type.
Construction TypeFRR (hours)Non-Combustible ProtectionStory LimitMaximum Height (m(ft))
Primary Structural FrameFloorRoof
III-A111Not required626 (85)
III-B000Not required423 (75)
IV-A321.5Fully Covered1882 (270)
IV-B221Partially Covered1255 (180)
IV-C221Not Required926 (85)
IV-HTHT 1HT 1HT 1Not Required626 (85)
1 HT means that this member is required to meet the size prescribed in IBC Table 2304.11. All Type IV constructions must comply with HT size limits in addition to explicit FRR requirements.
Table 2. Assumed GWP of Stages A1–A3 per material volume for the three building products in the scope of this study.
ProductGWP (kg CO2 eq/m3)EPD
Cross Laminated Timber137.19Nordic X-Lam, Nordic Structures (2018)
Glulam Beams and Columns197.97North American Glued Laminated Timber, American Wood Council (2020)
Gypsum Wallboard187.825/8″ Type X Conventional Gypsum Board, Gypsum Association (2020)
Table 3. Cases for sensitivity study.
StoriesViable Building TypesMaximum FTF [m(ft)]
4III-A, III-B, IV-A, IV-B, IV-C, IV-HT3.5 (11.5)
6III-A, IV-A, IV-B, IV-C, IV-HT3.5 (11.5)
9IV-A, IV-B, IV-C2.7 (9)
12IV-A, IV-B3.5 (11.5)
18IV-A3.5 (11.5)
Table 4. Design loads used for each case in sensitivity study.
Design Load TypeDesign Load Quantity [kPa (psf)]
DeadCalculated 1
Office Live2.4 (50)
Partition0.7 (15)
Superimposed Dead—Office2.3 (47.5)
Superimposed Dead—Roof0.5 (10)
Roof Live1 (20)
1 Dead load calculation was based on wood material volume and an assumed density of 560 kg/m3 (35 lb/ft3).
Table 5. The most economical option for each building type for each number of stories.
Building Type
Stories III-BIII-AIV-HTIV-CIV-BIV-A
4Grid21 × 20.524 × 23.520.5 × 2024 × 2024 × 2424 × 22.5
Cost$25.53$31.28$30.14$36.97$45.49$45.04
6Grid--24 × 23.520.5 × 2024 × 24.524 × 2424 × 22
Cost$32.56$31.50$38.47$46.68$46.72
9Grid------24 × 24.524 × 2424 × 22.5
Cost$39.16$47.37$47.64
12Grid--------24 × 2424 × 22
Cost$49.44$49.93
18Grid----------24 × 22
Cost$52.81
Publisher’s Note: MDPI stays neutral with regard to jurisdictional claims in published maps and institutional affiliations.

