Article

The U-Shaped Relationship between Intellectual Capital and Technological Innovation: A Perspective on Enterprise Ownership and the Moderating Effect of CSR

1
Graduate School of Management of Technology, Pukyong National University, Busan 48547, Korea
2
School of Economics and Management, Hulunbuir University, Hulunbuir 021000, China
*
Author to whom correspondence should be addressed.
Sustainability 2021, 13(22), 12872; https://doi.org/10.3390/su132212872
Submission received: 21 October 2021 / Revised: 19 November 2021 / Accepted: 20 November 2021 / Published: 21 November 2021

Abstract

:
Promoting technological innovation is an essential issue for enterprises to maintain sustainable development in a highly competitive environment. Previous studies have focused on exploring the linear relationship between intellectual capital and technological innovation, ignoring the possibility of a non-linear relationship between them. This study draws on a dualistic view of intellectual capital and divides it into two elements: human capital and structural capital. Based on the factor endowment theory, we explored the non-linear relationship between intellectual capital and technological innovation, using the data of Chinese A-share listed companies from 2014 to 2019 as the sample, and then analyzed the moderating effect of corporate social responsibility (CSR) on their relationship. The results of the OLS regressions indicated a significant U-shaped relationship between intellectual capital and its elements on technological innovation. This means a “regressive” effect of low levels of intellectual capital on technological innovation and an “incremental” effect of high levels of intellectual capital on technological innovation. Improving CSR could positively enhance the U-shaped effect of intellectual capital on technological innovation. A further study found that the U-shaped effects of intellectual capital and human capital on technological innovation were still supported in state-owned and private enterprises. The U-shaped effect of structural capital on technological innovation was still supported in private enterprises but not in state-owned enterprises. This study explored the relationship between intellectual capital and technological innovation from a unique perspective. It provides a theoretical basis for enterprises to appropriately fulfill their social responsibility and actively promote technological innovation.

1. Introduction

In the era of the knowledge-based economy, intellectual capital based on knowledge has gradually become a vital strategic resource for enterprises to gain competitive advantages and realize value appreciation [1], which has a profound impact on their financial performance and technological innovation. Technological innovation is the core element for the long-term development of enterprises. In order to survive and progress in the highly competitive and unpredictable market environment, enterprises must obtain sustainable competitive advantages through technological innovation [2]. Promoting technological innovation has become the key for enterprises to achieve the goal of becoming bigger and stronger. However, for most enterprises, technological innovation based on R&D activities means facing the uncertainty of results and the instability of cycles in the innovation process. They need to invest many R&D resources and take the high intensity of innovation risks [3]. Therefore, if enterprises want to improve their innovation performance, it is even more necessary to carry out technological innovation activities by strengthening their talent pool and building innovative organizations. Intellectual capital is an important strategic resource for enterprises, which helps alleviate the insufficient investment in R&D resources and enhances the motivation of technological innovation [4]. Based on the division of intellectual capital structure by Pulic [5], there are differences in the degree of influence of different types of intellectual capital on technological innovation. Among them, human capital can promote technological innovation by providing core resources such as employees’ knowledge and skills [6], while structural capital can promote technological innovation by building an organizational structure that drives innovation, developing a standardized innovation system, and creating a positive innovation culture [7]. Therefore, it is essential to explore the impact of intellectual capital and its components on enterprise technological innovation.
The mechanism of the effect of intellectual capital on enterprise technological innovation has increasingly become a hot topic of academic research. While scholars have contributed very many research results, they have also developed very many debates. Some scholars argue that intellectual capital and its elements can motivate enterprises to carry out technological innovation and positively affect technological innovation. For example, Harrison and Sullivan [8] pointed out that intellectual capital can enhance the returns of strategically important businesses across the board while enhancing enterprises’ innovation capabilities. Furthermore, Hayton’s [9] empirical study of 237 high-tech companies in the United States showed that intellectual capital is a source of technological development that can significantly increase innovation performance by reducing risk. Meanwhile, Chahal and Bakshi [10], through an empirical study of the banking industry, confirmed that intellectual capital could positively affect technological innovation and improve the competitive advantage of enterprises.
Of course, other scholars argue that intellectual capital and its elements can negatively affect technological innovation. For example, Subramaniam and Youndt [4] studied the impact of intellectual capital and its elements on enterprises’ innovation capability with 93 organizations. They found a significant negative relationship between human capital and innovation capability. Cao et al. [11] explored the differences in the effects of intellectual capital and its elements on innovation performance in different life cycles. They found that enterprises’ human capital in the growth stage showed a significant negative effect on innovation performance. Zha et al. [12] verified that organizational capital would negatively affect low-cost innovation based on structural equation modeling. Some scholars’ studies found that the impact of intellectual capital on technological innovation is not a simple linear relationship. For example, Bejinaru and Bratianu [13,14] criticized the linearization of the study of intellectual capital in academia. They pointed out that the assumption of a direct and linear causal relationship between intellectual capital and firm performance is false. Many researchers ignore the intangible nature of intellectual capital and even make it tangible, while all intangible resources are non-linear in nature. Using the usual linear logic not only fails to reflect the value of intellectual capital, but may lead to misinterpretation of the results. Zhan and Li [15] examined empirical data from 39 developing countries using a threshold test model. They found that the effect of intellectual capital on technological innovation showed a significant U-shaped relationship after controlling for variables such as economic level and R&D investment.
With the increasingly significant effect of stakeholders on business conditions, companies increasingly need to consider their responsibilities to customers, employees, investors, and even society when making technological innovation decisions. In the current political and economic environment, it is important and urgent for enterprises to actively fulfill their social responsibility, helping them maintain long-term sustainable development and increase their business performance [16]. For example, Luo and Du [17] confirmed the positive relationship between CSR and technological innovation through an empirical study, i.e., the more CSR activities a company performs, the more innovative the company is. Intellectual capital is the sum of the knowledge and experience of the employees embedded in the firm and the firm’s relationships with external stakeholders [18]. One of the ways a company fulfills its social responsibility is by using its employees’ internal knowledge and experience to create multilevel value for external stakeholders [19]. It can be seen that the connotation of intellectual capital and the goal of CSR coincide in some respects and have a high degree of intrinsic relevance. The two have a certain synergistic effect on technological innovation. However, scholars currently ignore the role of CSR when studying the impact of intellectual capital on technological innovation. We argue that it is necessary to explore what role CSR plays in the relationship between the effect of intellectual capital on enterprise technological innovation.
Although existing studies have explored the relationship between intellectual capital and technological innovation, there is still a lack of in-depth research on the specific mechanisms of intellectual capital and its components on technological innovation, mainly in the following aspects. First, as the status of intellectual capital as a strategic resource is increasingly consolidated, scholars have paid sufficient attention to the effect of intellectual capital on technological innovation. However, most previous studies have defaulted to a linear relationship between the two, ignoring the possibility that intellectual capital as a whole and its constituents have a non-linear impact on technological innovation. Second, as companies pay more and more attention to considering stakeholders when making decisions, it is more important for companies to consider the fulfillment of social responsibility when making technological innovation decisions through intellectual capital. This helps reduce inefficient R&D investments and reasonably protect the interests of all parties. However, few scholars have studied and answered the practical question of “how CSR affects intellectual capital and technological innovation.” Third, in China’s market environment, state-owned and private enterprises face very different constraints in technological innovation. The existing literature has not done enough to compare how enterprises with different ownership characteristics use intellectual capital to influence technological innovation. Therefore, we argue that there is a need to further explore in detail the mechanisms of the role of intellectual capital on technological innovation.
Based on the preceding analysis, this study analyzes the impact of intellectual capital on technological innovation from the standpoint of factor endowment theory, using data from Chinese A-share listed companies between 2014 and 2019. The study introduces CSR as a moderating variable to investigate the moderating effect of CSR on the relationship between intellectual capital and technological innovation. The differences in the effects of intellectual capital on technological innovation under various ownership properties are then investigated further. It is hoped that this will provide empirical references for enterprises to pay attention to the accumulation of intellectual capital and technological innovation practices.
The rest of the article is organized as follows: Section 2 reviews the previous literature on intellectual capital, corporate social responsibility and technological innovation and presents the research hypotheses. Section 3 describes the sample data and research design. Section 4 discusses the empirical results and analysis. Section 5 concludes the paper and provides recommendations.

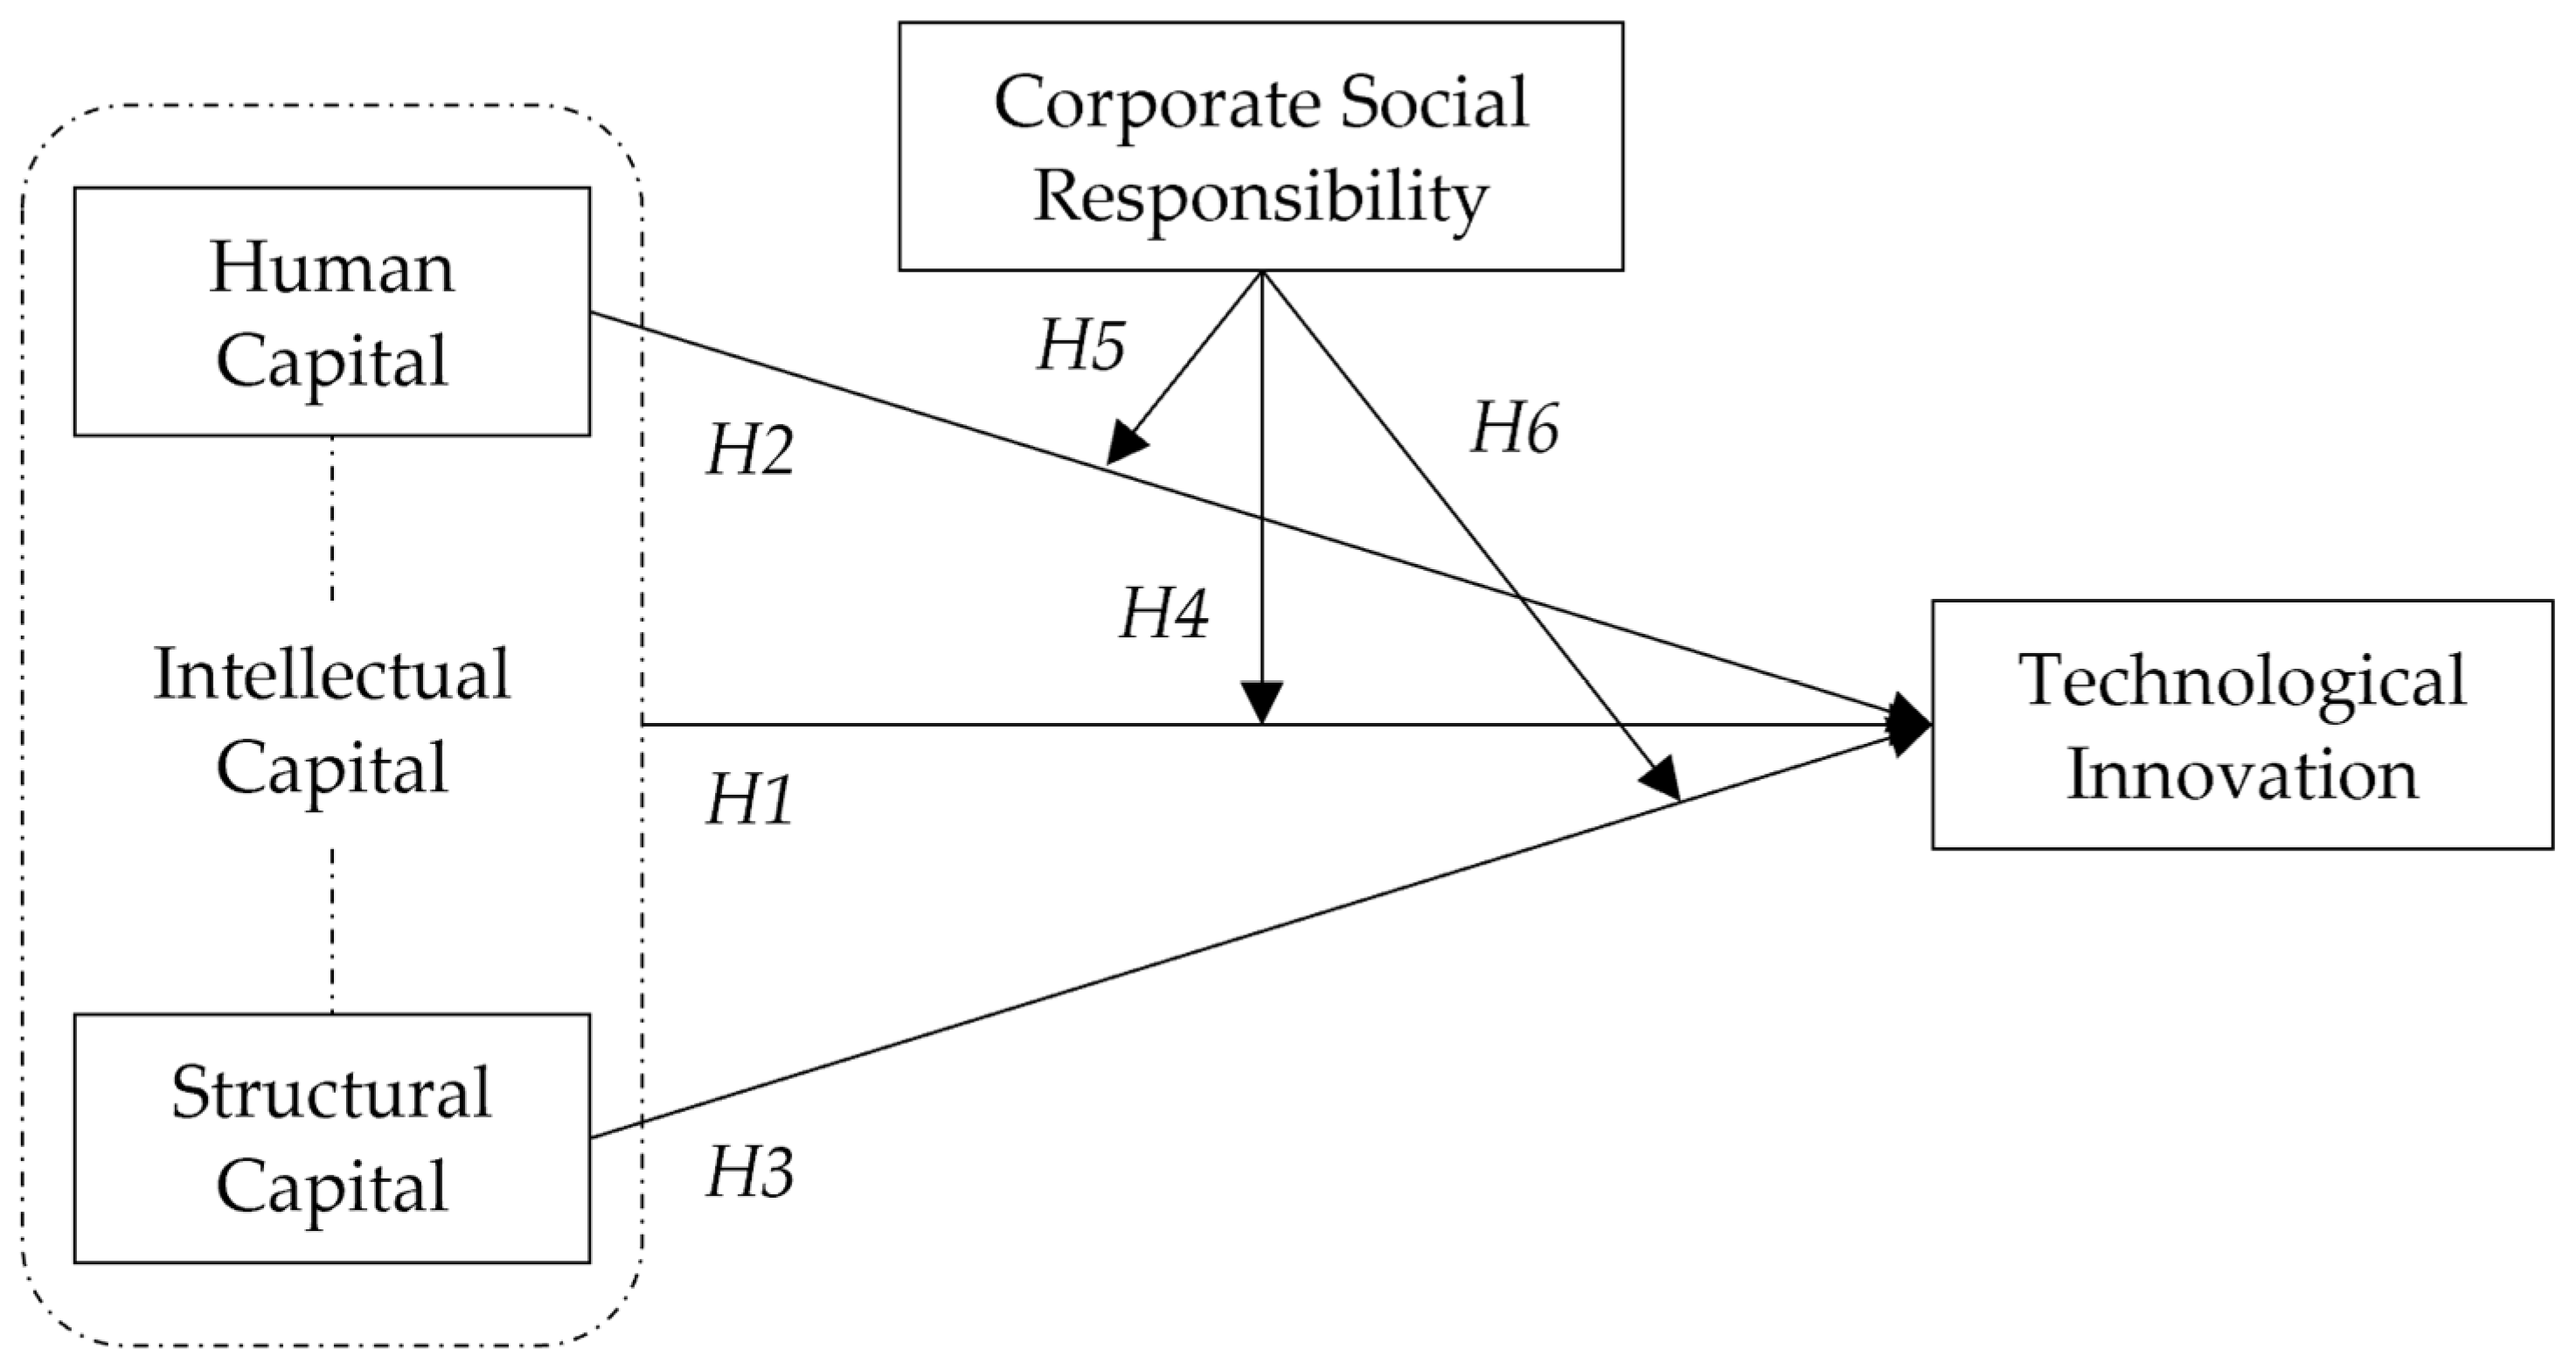
2. Theoretical Basis and Research Hypothesis

2.1. The Effect of Intellectual Capital on Technological Innovation

Regarding the connotation of intellectual capital, Stewart [20] believed it is distinguished from physical capital and is the sum of a set of intangible knowledge, skills, and experience in an organization. Intellectual capital is closely related to value creation and is a strategic resource that accelerates value creation and increases competitive advantage [21,22]. This view, based on a resource-based theory, is usually less about specific products and services and more about the firm’s resources and capabilities, such as how to develop and deploy those intangible assets that can lead to competitive advantage [23]. Gallego et al. (2020) stated that intellectual capital should include strategic design capability, which could influence process and innovation management. The application of strategic design increases the value of intangible assets, promotes enterprise innovation, generates systems that integrate tangible products and intangible services, and triggers changes in organizational structures. AlQershi et al. (2021) [7] argued that by improving structural capital, firms can develop new structures that will contribute to value creation and sustain superior performance. These inferences were supported in the study by Ali and Anwar (2021) [24], who found a significant positive correlation between the elements of intellectual capital and value creation.
Regarding the components of intellectual capital, academics have formed dualistic, triadic, and pluralistic theories. Among them, the dualism proposed by Pulic [5] is widely used by academics. He believes that intellectual capital can be divided into human capital and structural capital. Human capital refers to the individual employee’s knowledge reserve, innovation ability, cognitive judgment, experience skills, and work attitude, while structural capital refers to the knowledge management, organizational culture, information system, and institutional norms embedded within the organization. The later emerged triadic and pluralistic viewpoints are not essentially different from the above dualism. They are basically obtained by expanding and extending the concept of structural capital on the basis of dualism. However, the subdivision of the concept does not affect the correctness of various theories of intellectual capital structure classification. Therefore, this study draws on Pulic’s [5] dualistic framework, which states that intellectual capital consists of human capital and structural capital, to investigate the impact of intellectual capital and its elements on enterprise technological innovation.
Factor endowment theory suggests that the abundance of production factors can increase firms’ incentives to produce. As long as the advantages of factor endowment are greater than the corresponding production costs and high returns can be obtained from factor input, enterprises will accept the corresponding production decisions [25]. Similarly, technological innovation cannot be achieved without the support of intellectual capital and its constituents. Enterprises’ motivation to make technological innovation decisions will vary according to the size of the intellectual capital. That is, the intellectual capital of different sizes will exert different effects on enterprise technological innovation. When the increased cost of enhancing intellectual capital is lower than the endowment benefit generated by enhancing intellectual capital, enhancing intellectual capital can stimulate enterprises’ enthusiasm for technological innovation and positively impact technological innovation. On the contrary, if the increased cost of enhancing intellectual capital is higher, and even its endowment benefit cannot compensate for the increased cost, the enterprise will lose the incentive of technological innovation. Then, intellectual capital will have a negative impact on technological innovation.
As a special kind of decision, the enterprise technology innovation decision is characterized by high technical requirements, long periods and unstable processes, and the long-term benefits it produces are often greater than the short-term benefits [26]. Enterprise technology innovation is not only difficult to bring direct economic inflow to enterprises in the short term but also requires enterprises to invest much intellectual capital in carrying out technology research, which, to a certain extent, crowds out or constrains enterprises’ investment in other operational projects [27]. Because of the high opportunity cost of technological innovation, many enterprises do not have the subjective willingness to implement technological innovation. A study by Niu et al. [28] found that under a supervisory corporate governance mechanism, executives are likely to undermine a firm’s motivation to engage in technological innovation in order to achieve their short-term performance and compensation covenants. Cao et al. [11] explored the differences in the impact of intellectual capital on innovation performance under different enterprises’ life cycles. They found that the positive effect of intellectual capital on innovation performance is higher in the maturity period than in the growth period. Apparently, companies usually do not initiate technological innovation without sufficient intellectual capital and incentives for innovation effectiveness.
Combining the factor endowment theory and the essential characteristics of enterprise technology innovation, we believe that the relationship between intellectual capital and enterprise technology innovation is not a simple linear relationship but a U-shaped relationship. Intellectual capital has a “double impact” on technological innovation. When intellectual capital is at a low level, weak intellectual capital is usually accompanied by a low willingness and investment in technological innovation. This is because technological innovation involves R&D expenditures, technological upgrading, product renewal, and organizational management. In terms of human capital, companies need not only to increase the number of R&D personnel, and salary expenditures, and increase training; in terms of structural capital, they need to establish information management systems, improve process norms, and create an innovation culture. Increased investment in intellectual capital often leads to higher operating costs for companies [29]. Moreover, a lower level of intellectual capital usually indicates a weaker physical base when the enterprise is mostly in the start-up or growth stage. The risks associated with implementing technological innovation are often higher than those associated with investing in other operational projects [30]. Thus, even if intellectual capital grows within a certain range, firms are still not very motivated to carry out technological innovation for the sake of controlling costs and risks. It can be seen that there is a “regressive” effect of a low level of intellectual capital on enterprise technological innovation. However, when the intellectual capital continues to grow beyond a certain threshold, the human capital (e.g., the number of R&D personnel, training) reaches a high level, and employees expect that they can obtain higher benefits by exchanging their knowledge, experience, and expertise. As a result, the willingness and quality of knowledge-sharing becomes higher, and the flow and updating of knowledge within the enterprise are improved [6]. In terms of structural capital, enterprises also have richer information management systems, complete process specifications, and sufficient intellectual capital to support technological innovation. Moreover, at this time, the increased cost of implementing technological innovation may be much lower than the comprehensive benefits brought by technological innovation, and the company has sufficient capital accumulation and the ability to cope with the risks that may be caused by technological innovation. The company should pursue technological innovation at this time actively [31]. Thus, it can be seen that there is an “incremental” effect of the high level of intellectual capital on enterprise technological innovation. In summary, we propose the following research hypotheses.
Hypothesis 1 (H1).
Intellectual capital has a U-shaped effect on technology innovation.
Hypothesis 2 (H2).
Human capital has a U-shaped effect on technology innovation.
Hypothesis 3 (H3).
Structural capital has a U-shaped effect on technology innovation.

2.2. Intellectual Capital, Corporate Social Responsibility, and Technological Innovation

According to the stakeholder theory, firms need to consider stakeholders’ expectations and support when making technological innovation decisions. As a typical stakeholder-driven behavior, fulfilling CSR can deepen the intimate relationship between a firm and its stakeholders, thus helping the firm to obtain valuable stakeholder support for technological innovation [32]. This may complement the internal resources that intellectual capital provides for technological innovation, which in turn affects the effectiveness of firms’ use of intellectual capital for technological innovation [33]. For example, Gangi et al. (2019) [34] showed that CSR engagement positively affects intellectual capital. CSR could create trusting relationships, stimulate tacit knowledge sharing, and make it explicit, thus benefiting the entire firm. They also argued that companies actively fulfilling their social responsibility help improve managers’ reputations and recruit more talented employees. A similar opinion appears in the study of Cegarra-Navarro et al. (2021) [35]. They argued that fulfilling the responsibility for the ecological environment contributes to corporate reputation. It also promotes the understanding and sharing of environmental information, which drives companies to improve their technology to meet or improve environmental standards continuously. However, at the stage where an enterprise’s intellectual capital accumulation is relatively weak, excessive fulfillment of CSR can consume the available resources of firms, seriously distract them from technological innovation, and ultimately reduce the efficiency of technological innovation [36]. Therefore, the impact of CSR on technological innovation can be summarized as the incentive effect and crowding-out effect.
The incentive effect of CSR can help alleviate the knowledge dilemma of technological innovation, improve the cooperative relationship between companies and stakeholders, acquire external knowledge and skills to carry out innovation, and improve the efficiency of enterprise technological innovation [37]. The crowding-out effect of CSR can make enterprises bias their resource focus toward stakeholders and seriously crowd out the resource input for technological innovation activities, thus weakening their incentive for technological innovation [38]. As a result, while CSR plays an important role in promoting technological innovation, an impractical CSR performance may have a negative impact on technological innovation by crowding out resources.
When intellectual capital is at a low level, the crowding-out effect of CSR is stronger than the incentive effect, which will enhance the negative influence of intellectual capital on technological innovation. Enterprises with a low level of intellectual capital usually have weak profitability and innovation levels. Most of them are in the start-up or growth stage, facing serious resource scarcity and business risks, with limited human capital to invest in technological innovation. Structural capital such as the organizational process, knowledge management system, and innovation culture are not yet sound, so improving CSR is more likely to crowd out enterprises’ originally insufficient technological innovation resources. Although the incentive effect of social responsibility is conducive to the acquisition of external knowledge and skills from stakeholders, the fulfillment of social responsibility in the start-up or growth stage of such companies requires the enterprises to invest many resources to maintain the relationship with stakeholders. The investment of these resources will easily make the companies sink into existing customer relationships and distract the enterprises’ focus on technological innovation, thus crowding out the enterprises’ technological innovation resources. This will have a negative impact on the use of intellectual capital for technological innovation. It follows that CSR enhances the negative effect of intellectual capital on technological innovation when intellectual capital is at a low level.
When intellectual capital exceeds a certain threshold, the incentive effect of CSR is stronger than the crowding-out effect, which can enhance the positive influence of intellectual capital on technological innovation. Enterprises with a high level of intellectual capital have strong human capital, and their structural capital has been improved to a certain extent. The comprehensive benefits of using intellectual capital to carry out technological innovation are greater than the costs, and enterprises are more eager to carry out relevant technological innovation activities in order to enhance their competitive advantages and sustainable development capabilities. CSR as an external mechanism can quickly help enterprises obtain knowledge, skills, and relationships from stakeholders that are beneficial to technological innovation, and improving CSR will have a strong incentive effect on technological innovation. At the same time, the higher intellectual capital means that the internal resources of enterprises are sufficient, and enterprises are no longer limited to the contradiction of resource allocation between fulfilling social responsibility and carrying out technological innovation. Thus, they are less likely to be constrained by the problem of resource scarcity when the crowding-out effect of CSR is greatly reduced. In other words, CSR will enhance the positive effect of intellectual capital on technological innovation after a certain threshold is exceeded. Based on the above analysis, the following hypotheses are proposed:
Hypothesis 4 (H4).
CSR can positively moderate the relationship between intellectual capital and technological innovation.
Hypothesis 5 (H5).
CSR can positively moderate the relationship between human capital and technological innovation.
Hypothesis 6 (H6).
CSR can positively moderate the relationship between structural capital and technological innovation.
The analysis framework of the research is shown in Figure 1 below.

3. Research Design

3.1. Selection of Samples and Acquisition of Data

This study used Chinese A-share listed companies from 2014 to 2019 as the research sample. To ensure the reliability of the research results, we continued the practice of previous studies and adhered to the following principles in processing the sample: (1) ST and *ST listed companies were excluded from the sample, mainly because the operating conditions of such companies are poor. Their financial data may seriously deviate from the data when operating normally, thus affecting the objectivity of the results. (2) The sample of listed companies in the financial industry was excluded mainly because the business nature and financial indicators of such companies are significantly different from those of companies in other industries, and their analysis may be biased when put together. (3) The sample of listed companies with abnormal data and missing data were excluded. Finally, we obtained a total of 15,757 valid observation samples. The technological innovation data used in this study come from the CNRDS database, the social responsibility data come from Hexun’s CSR report, and other financial data come from the CSMAR database.

3.2. Variable Definitions

3.2.1. Dependent Variable

Previous scholars have two main approaches to measure technological innovation (INO): one is from the perspective of technological innovation output, measured by indicators such as the number of patent applications, the number of patents granted, and the percentage of new product sales, and the other is from the perspective of technological innovation input, measured by indicators such as the number of R&D personnel and R&D expenses. Unlike the indicators focusing on measuring technological innovation inputs, output indicators emphasize the need for enterprises to achieve substantial results in technological innovation, thus having better screening effects. Since patent applications involve product upgrades, technology, or method improvements that require a certain degree of technicality and innovation to pass, enterprises’ efforts on patent applications reflect the degree of their efforts for technological innovation. In order to measure enterprise technological innovation, we selected the number of patent applications and then added 1 to the value to take the logarithm.

3.2.2. Independent Variables

In this study, we used intellectual capital efficiency (ICE), human capital efficiency (HCE), and structural capital efficiency (SCE) to measure intellectual capital, human capital, and structural capital, respectively, with definitions derived from the value-added intellectual coefficient (VAIC) method. VAIC was developed by Pulic [5]. This method does not directly calculate the intellectual capital. It considers that the types of resources in the development process of a company can be divided into physical capital and intellectual capital. Both of which jointly contribute to the performance of a company through value appreciation.
The core idea of VAIC is first to calculate the value-added component and then divide the value-added component of the company by physical capital and intellectual capital, respectively, to obtain the degree of contribution of physical capital and intellectual capital to the value-added component of the company. The VAIC consists of three components: capital employed efficiency (CEE), human capital efficiency (HCE), and structural capital efficiency (SCE), where the sum of HCE and SCE is called intellectual capital efficiency (ICE), i.e., ICE = HCE + SCE. Since ICE can be used to measure intellectual capital, it can be calculated by the VAIC method to measure intellectual capital indirectly. The specific relationship and calculation ideas are as follows:
(1) ICE = HCE + SCE.
(2) HCE = VA/HC = Value Added/Human Capital, where VA = Wage Costs + Interest Costs + Profit Before Taxes, and human capital is measured using wage costs, which are measured using cash paid to and for employees in the cash flow statement.
(3) SCE = SC/VA = Structural Capital/Value Added, where SC = VA − HC.
It should be noted that there is no consensus or mainstream opinion among academics on the measurement model of VAIC. In particular, scholars disagree widely on how VA should be calculated. To resolve some of the controversies, scholars have modified their calculations of VA from time to time [39]. According to Singla (2020) [40] alone, there are currently four main ways of calculating VA. What these formulas have in common is that all of them include profit after tax, wage costs, and most of them include taxes, interest, and depreciation, and sometimes amortization [5,21,41,42,43]. In addition, some scholars believe that VA should be calculated directly using Sales minus Costs in the financial statements [44]. In this study, we adopted a common method used by academics in recent years when studying Chinese samples, which is very similar to the calculation method of Riahi-Belkaoui (2003) and Chen et al. (2005). Considering the actual situation of the information disclosure of listed companies in China, this formula directly uses the concept of profit before tax and does not include depreciation and amortization [45].

3.2.3. Moderating Variable

The corporate social responsibility (CSR) data used in this study comes from the Hexun CSR score, a comprehensive assessment of CSR in five dimensions, including shareholders, employees, and environmental responsibility. Each dimension not only examines the numerical indicators of social responsibility but also takes into account logical indicators to ensure the professionalism, rigor, and reliability of the evaluation results. Therefore, this study chose this score to measure corporate social responsibility.

3.2.4. Control Variables

In this study, we referred to Yuan et al. [36] and the study of Li and Zhang [45]. We finally selected company size (Size), financial leverage (Lev), and growth capacity (Growth), etc., as control variables, in addition to controlling for year and industry. The definition and metrics of the relevant variables are shown in Table 1.

3.3. Model Construction

In order to test the relationship between intellectual capital and technological innovation, the following research model was developed in this study.
I N O i , t = α 0 + α 1 I C E i , t + α 2 I C E 2 i , t + k α k C o n t r o l s i , t , k + Y e a r i , t + I n d i , t + ε i , t
I N O i , t = α 0 + α 1 H C E i , t + α 2 H C E 2 i , t + α 3 S C E i , t + α 4 S C E 2 i , t + k α k C o n t r o l s i , t , k + Y e a r i , t + I n d i , t + ε i , t
I N O i , t = α 0 + α 1 I C E i , t + α 2 I C E 2 i , t + α 3 C S R i , t + α 4 I C E i , t × C S R i , t + α 5 I C E 2 i , t × C S R i , t + k α k C o n t r o l s i , t , k + Y e a r i , t + I n d i , t + ε i , t
I N O i , t = α 0 + α 1 H C E i , t + α 2 H C E 2 i , t + α 3 S C E i , t + α 4 S C E 2 i , t + α 5 C S R i , t + α 6 H C E i , t × C S R i , t + α 7 H C E 2 i , t × C S R i , t + α 8 S C E i , t × C S R i , t + α 9 S C E 2 i , t × C S R i , t + k α k C o n t r o l s i , t , k + Y e a r i , t + I n d i , t + ε i , t
Model 1 tests the relationship between intellectual capital and technological innovation; Model 2 further tests the relationship between human capital, structural capital, and technological innovation. Model 3 is based on Model 1 with the cross-product term of intellectual capital and CSR. Model 4 is based on Model 2 with the cross-product terms of human capital, structural capital, and CSR, respectively, to test the moderating effect of CSR on the influence of intellectual capital on technological innovation.

4. Data Analysis

4.1. Descriptive Statistics

The results of the descriptive statistics are presented in Table 2. The mean value of technological innovation (INO) is 2.639, and the standard deviation is 1.811, indicating that Chinese listed companies’ overall level of technological innovation is still low. There are some differences in the level of technological innovation among different listed companies. The mean value of intellectual capital efficiency (ICE) is 3.124, and the median value is 2.457, which indicate that the intellectual capital of most companies is far below the average level, reflecting the phenomenon of the insufficient accumulation of intellectual capital value among Chinese listed companies in general. The mean values of human capital efficiency (HCE) and structural capital efficiency (SCE) are 2.472 and 0.652. The median values are 1.947 and 0.509, indicating that most listed companies’ human capital and structural capital are below average. The contribution of human capital to the value-added of intellectual capital is higher than that of structural capital. However, it can be seen from the standard deviation of the two that the degree of variation of the structural capital of listed companies is smaller than that of the human capital. The mean value of CSR is 22.693, the median value is 21.740, and the standard deviation is 12.566, which indicate that the level of social responsibility performance of listed companies is normally distributed. The difference in social responsibility performance among different companies is obvious. The mean value of ownership nature (State) is 0.315, indicating that 31.5% of the sample companies are state-owned enterprises.
Prior research concluded that a firm’s resources are dynamically evolving and flowing. A firm’s resource stock must reach a specific size to affect its effectiveness. The flow of resources means that a firm’s resource stock may be different at any point in time, which also means that there is an impact on firm effectiveness [46]. Moreover, changes in human capital, especially the loss of key talent, could affect organizational operations and hurt structural capital, which could negatively impact firm performance [47,48]. For this reason, we explore the impact of year-to-year changes in intellectual capital and its elements on technological innovation. A set of descriptive statistics is given in Table 3. It can be seen that the mean values of ICE and HCE for each year are greater than the mean values of SCE, which implies that the human capital of the sample as a whole is at a higher level of development compared to the structural capital. Combining the trends presented in Figure 2, we can see that the year-to-year trends of intellectual capital and its elements remain consistent with the trends of technological innovation in some years, while showing inconsistencies in other years. As an example, the year-to-year trends of the mean values of ICE and INO are inconsistent from 2015 to 2017, while from 2017 to 2019, the trends of the mean values of ICE and INO reach a clear consistency. This indicates that the flow of intellectual capital could make a difference in the impact of intellectual capital on technological innovation, and this difference in impact may also be related to the size of the stock of the intellectual capital.

4.2. Regression Analysis

Table 4 reports the regression results of the models. The regression coefficient of ICE2 in Model 1 is significantly positive (β = 0.110, p < 0.01), indicating a U-shaped relationship between intellectual capital and enterprise technological innovation. To verify this U-shaped effect more precisely, we use the utest command to test it. The results show that the slope of the relationship between intellectual capital efficiency and technological innovation is characterized by a negative change (−0.0842, p < 0.01) and then a positive change (0.0579, p < 0.01). The Fieller interval of intellectual capital efficiency at a 95% confidence level is [118.3167, 147.6273], and the extreme point is 131.1483, which is right within the Fieller interval. It indicates a threshold effect on the influence of intellectual capital on technological innovation, and the threshold point is at the value of 131.1483 of intellectual capital efficiency. When the value-added rate of intellectual capital is less than 131.1483, intellectual capital has a negative effect on technological innovation. The lower the value-added rate of intellectual capital, the higher the level of technological innovation. When the value-added rate of intellectual capital is greater than 131.1483, intellectual capital positively affects technological innovation. The higher the value-added rate of intellectual capital, the higher the level of technological innovation. The above results support the U-shaped relationship between intellectual capital and enterprise technological innovation, and H1 is verified. Model 2 further verifies the relationship between human capital, structural capital, and enterprise technological innovation. The regression coefficients of HCE2 and SCE2 are 0.081 (p < 0.01) and 0.039 (p < 0.01), respectively, indicating that both human capital and structural capital have a U-shaped effect on enterprise technological innovation, and H2 and H3 are supported.
In order to test the moderating effect of CSR on the relationship between intellectual capital and technological innovation, the interaction term of intellectual capital and CSR is added to Model 3. The results show that the regression coefficient of ICE2 × CSR is significantly positive (β = 0.124, p < 0.01), indicating that CSR can positively regulate the U-shaped relationship between intellectual capital and technological innovation. The enhancement of CSR can make the U-shaped relationship between intellectual capital and technological innovation more concave. The negative relationship between intellectual capital and technological innovation is more obvious before the extreme value point. The positive relationship between intellectual capital and technological innovation is more obvious after the extreme value point is exceeded, so H4 is supported. To visualize the moderating effect of CSR, we plot the moderating effect of CSR on the relationship between intellectual capital and technological innovation. As shown in Figure 3, the enhancement of CSR strengthens the negative effect of intellectual capital on technological innovation at lower levels, but when intellectual capital exceeds a certain threshold, the enhancement of CSR strengthens the promotion of intellectual capital on technological innovation. Model 4 further tests the moderating effect of CSR on human capital–technology innovation and structural capital–technology innovation. The regression coefficients of HCE2 × CSR and SCE2 × CSR are 0.159 (p < 0.01) and 0.125 (p < 0.01), respectively, implying that CSR positively moderates the relationship between human capital–technology innovation and structural capital–technology innovation, respectively the U-shaped relationship. H5 and H6 are verified. Accordingly, Figure 4 and Figure 5 demonstrate the moderating effects of CSR on the relationship between human capital and technological innovation, and CSR on the relationship between structural capital and technological innovation, respectively.

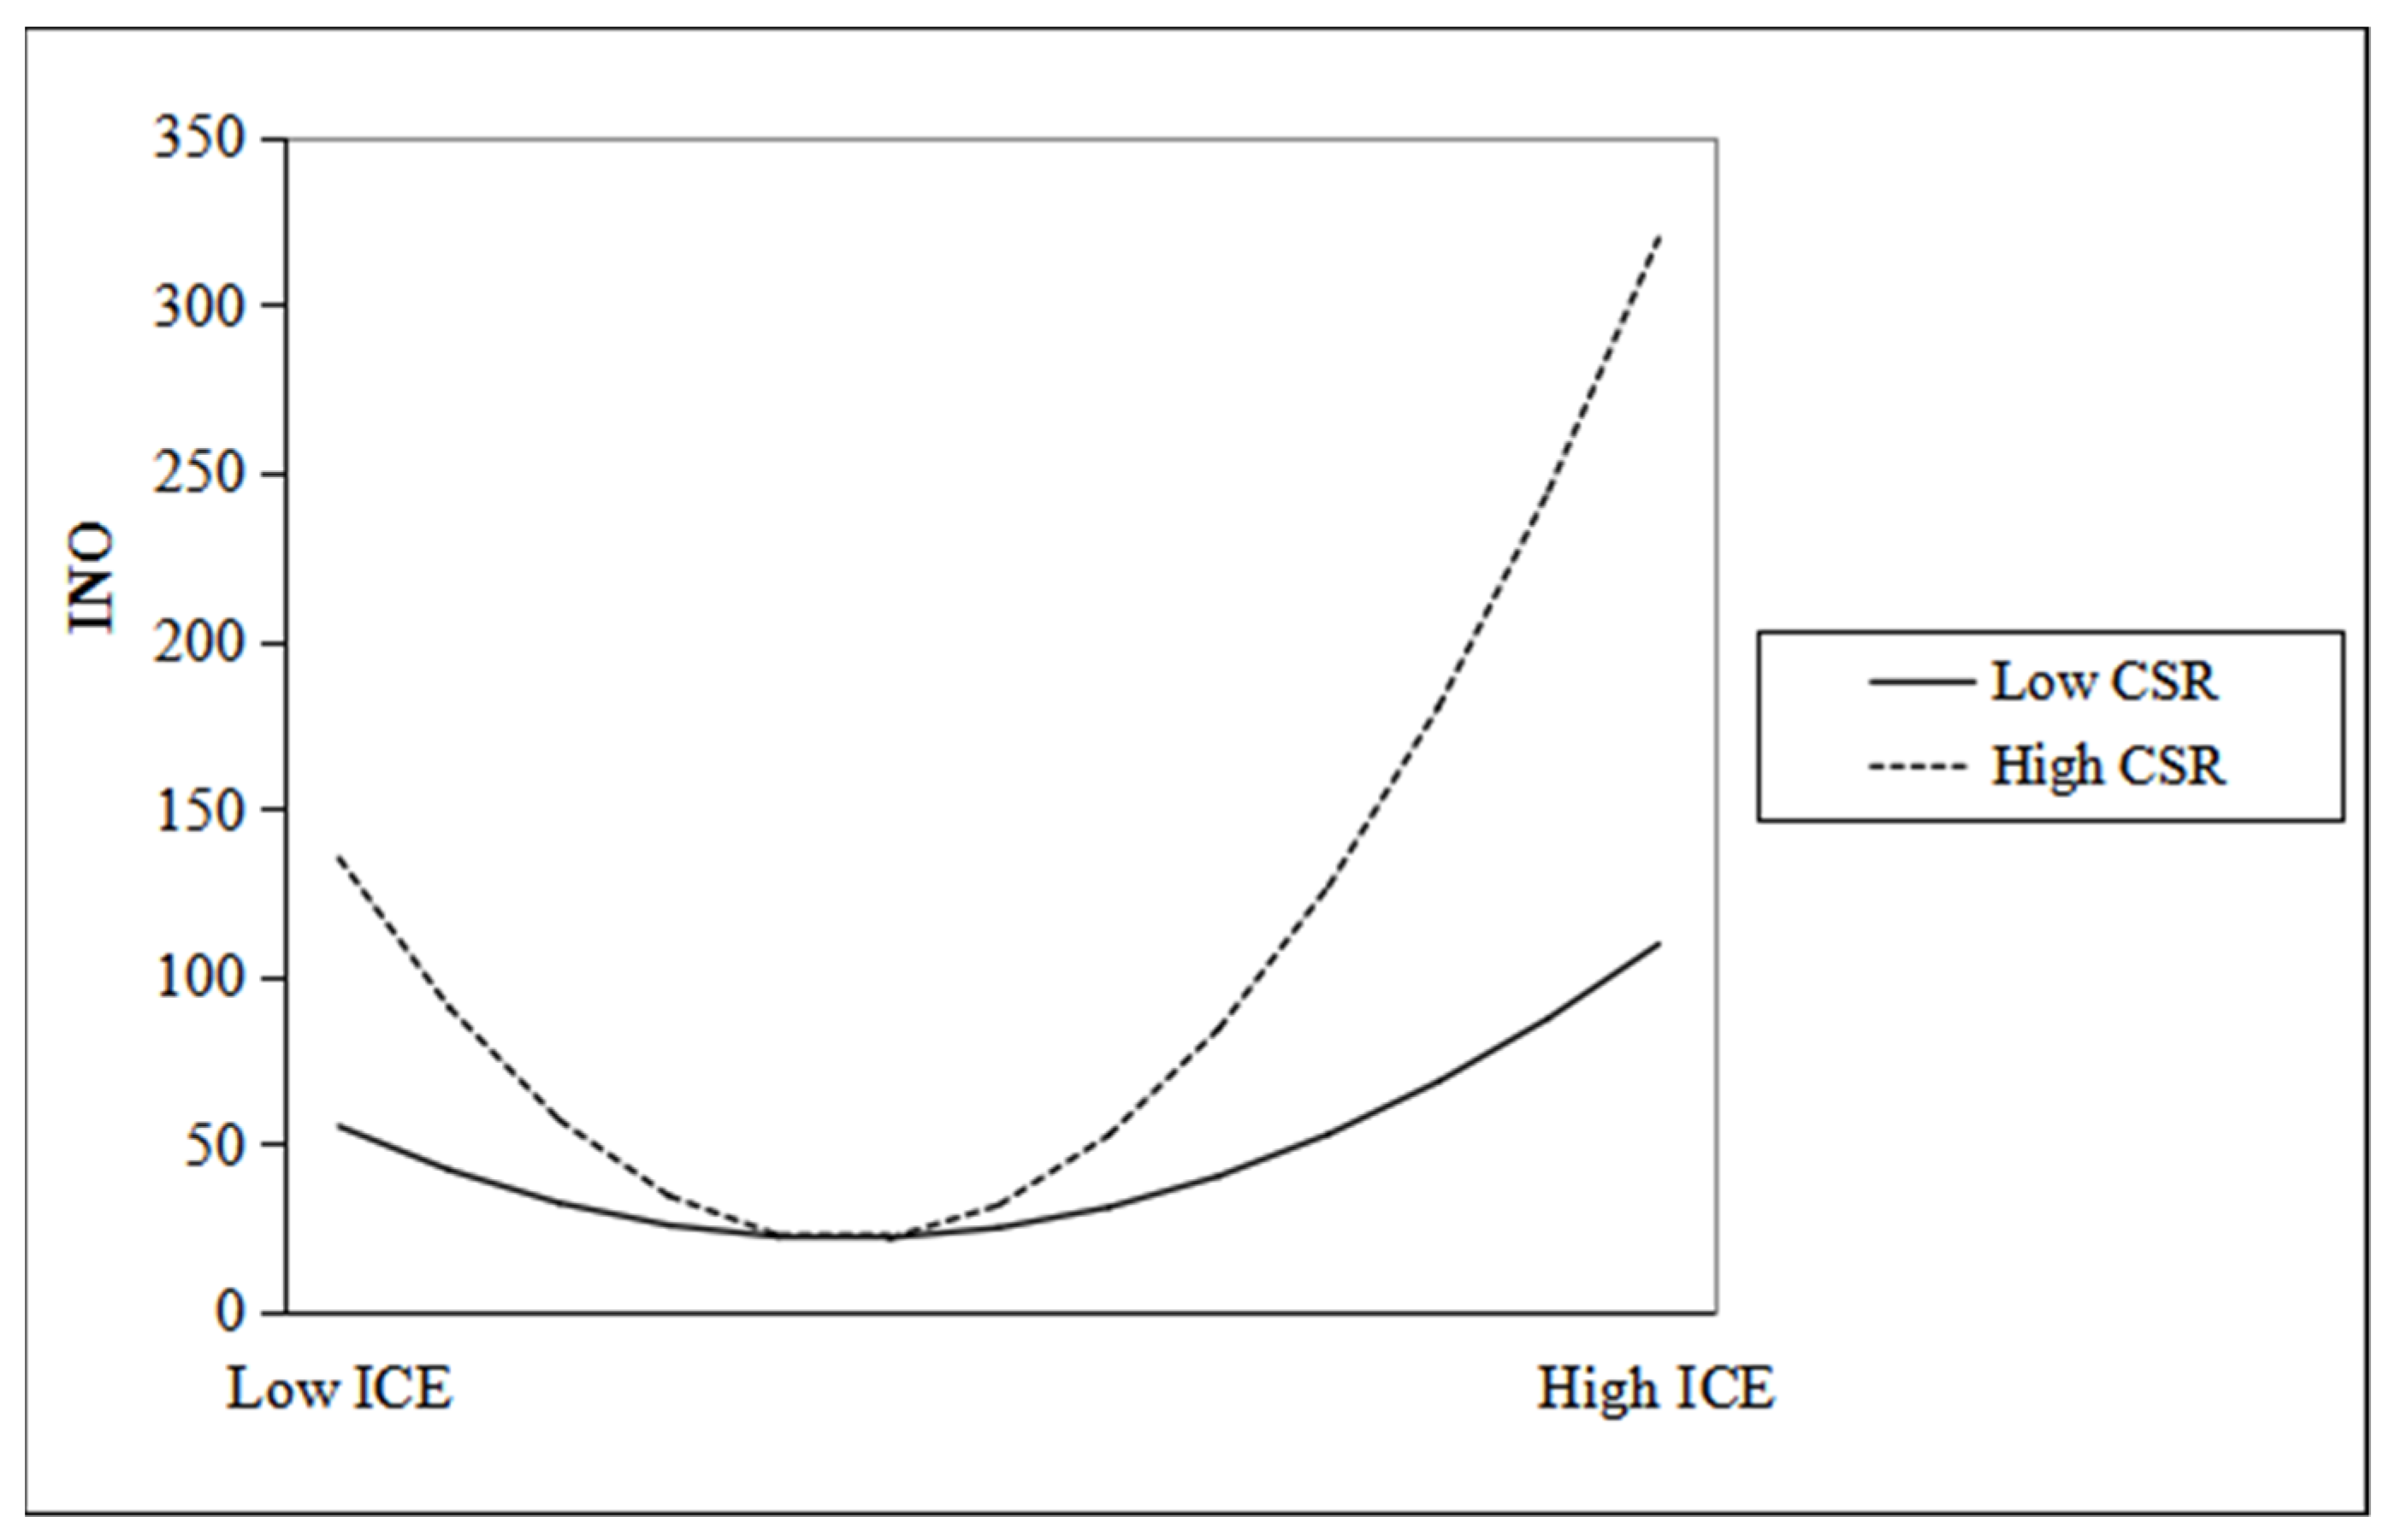
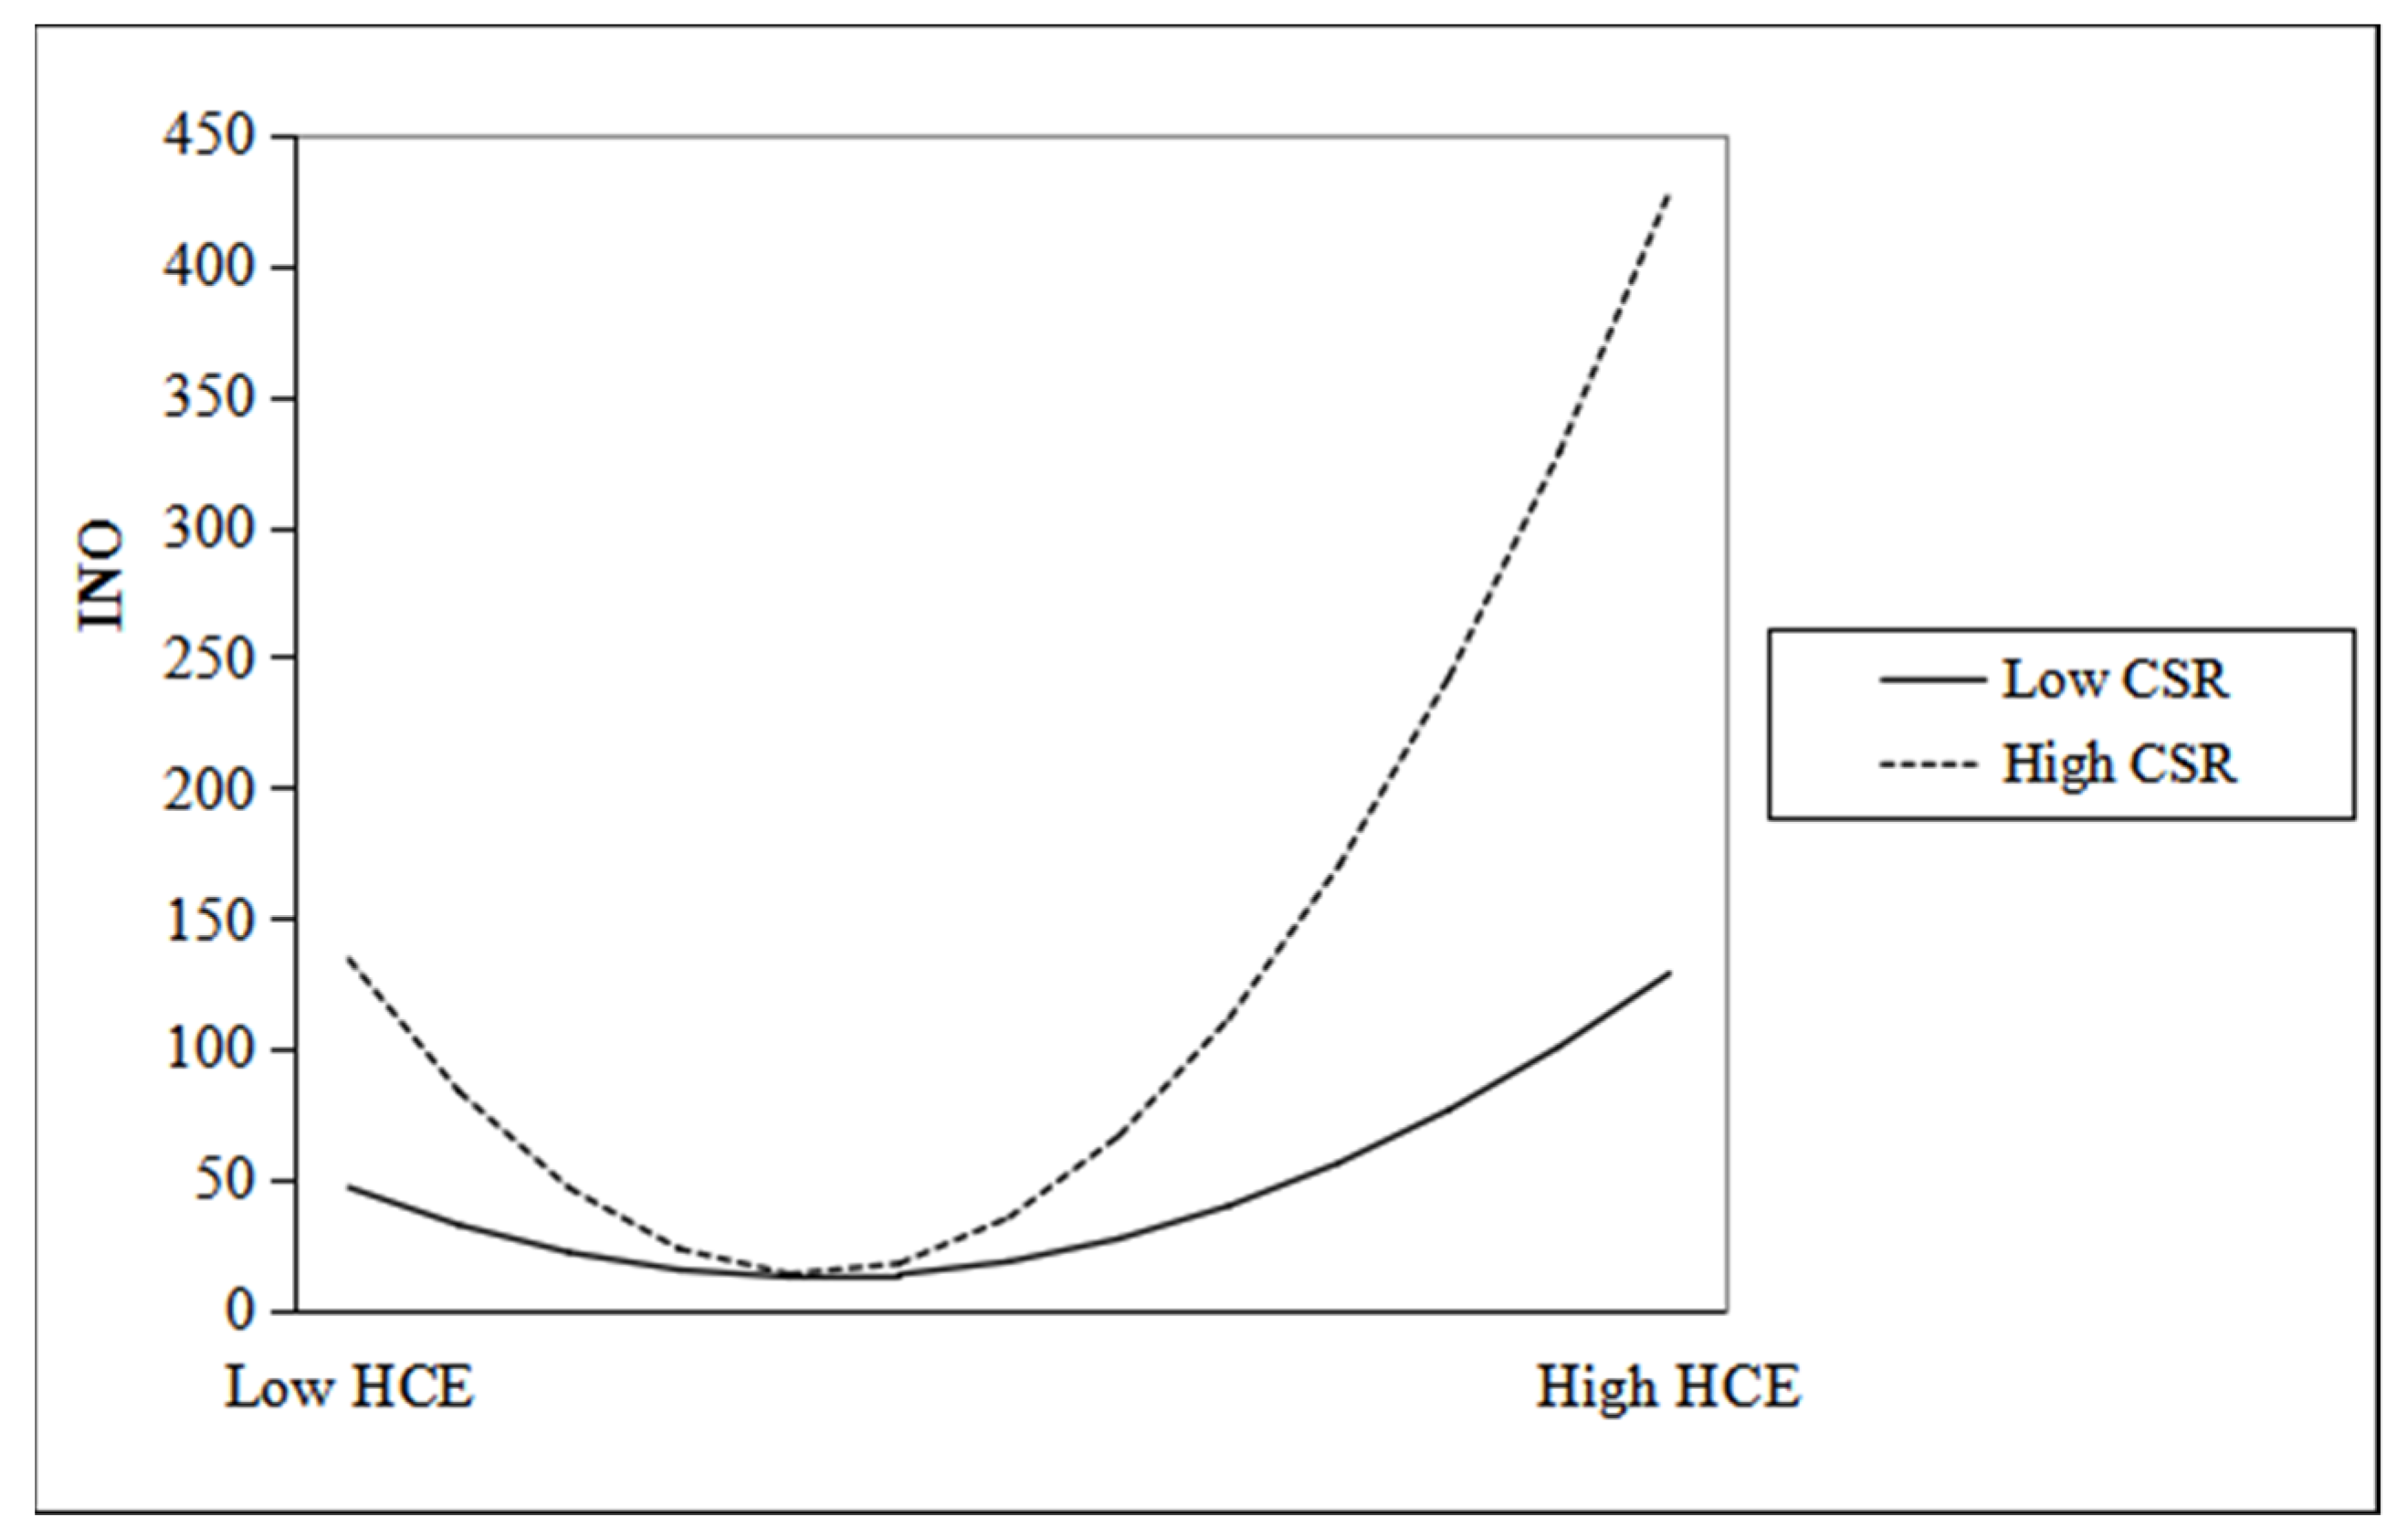
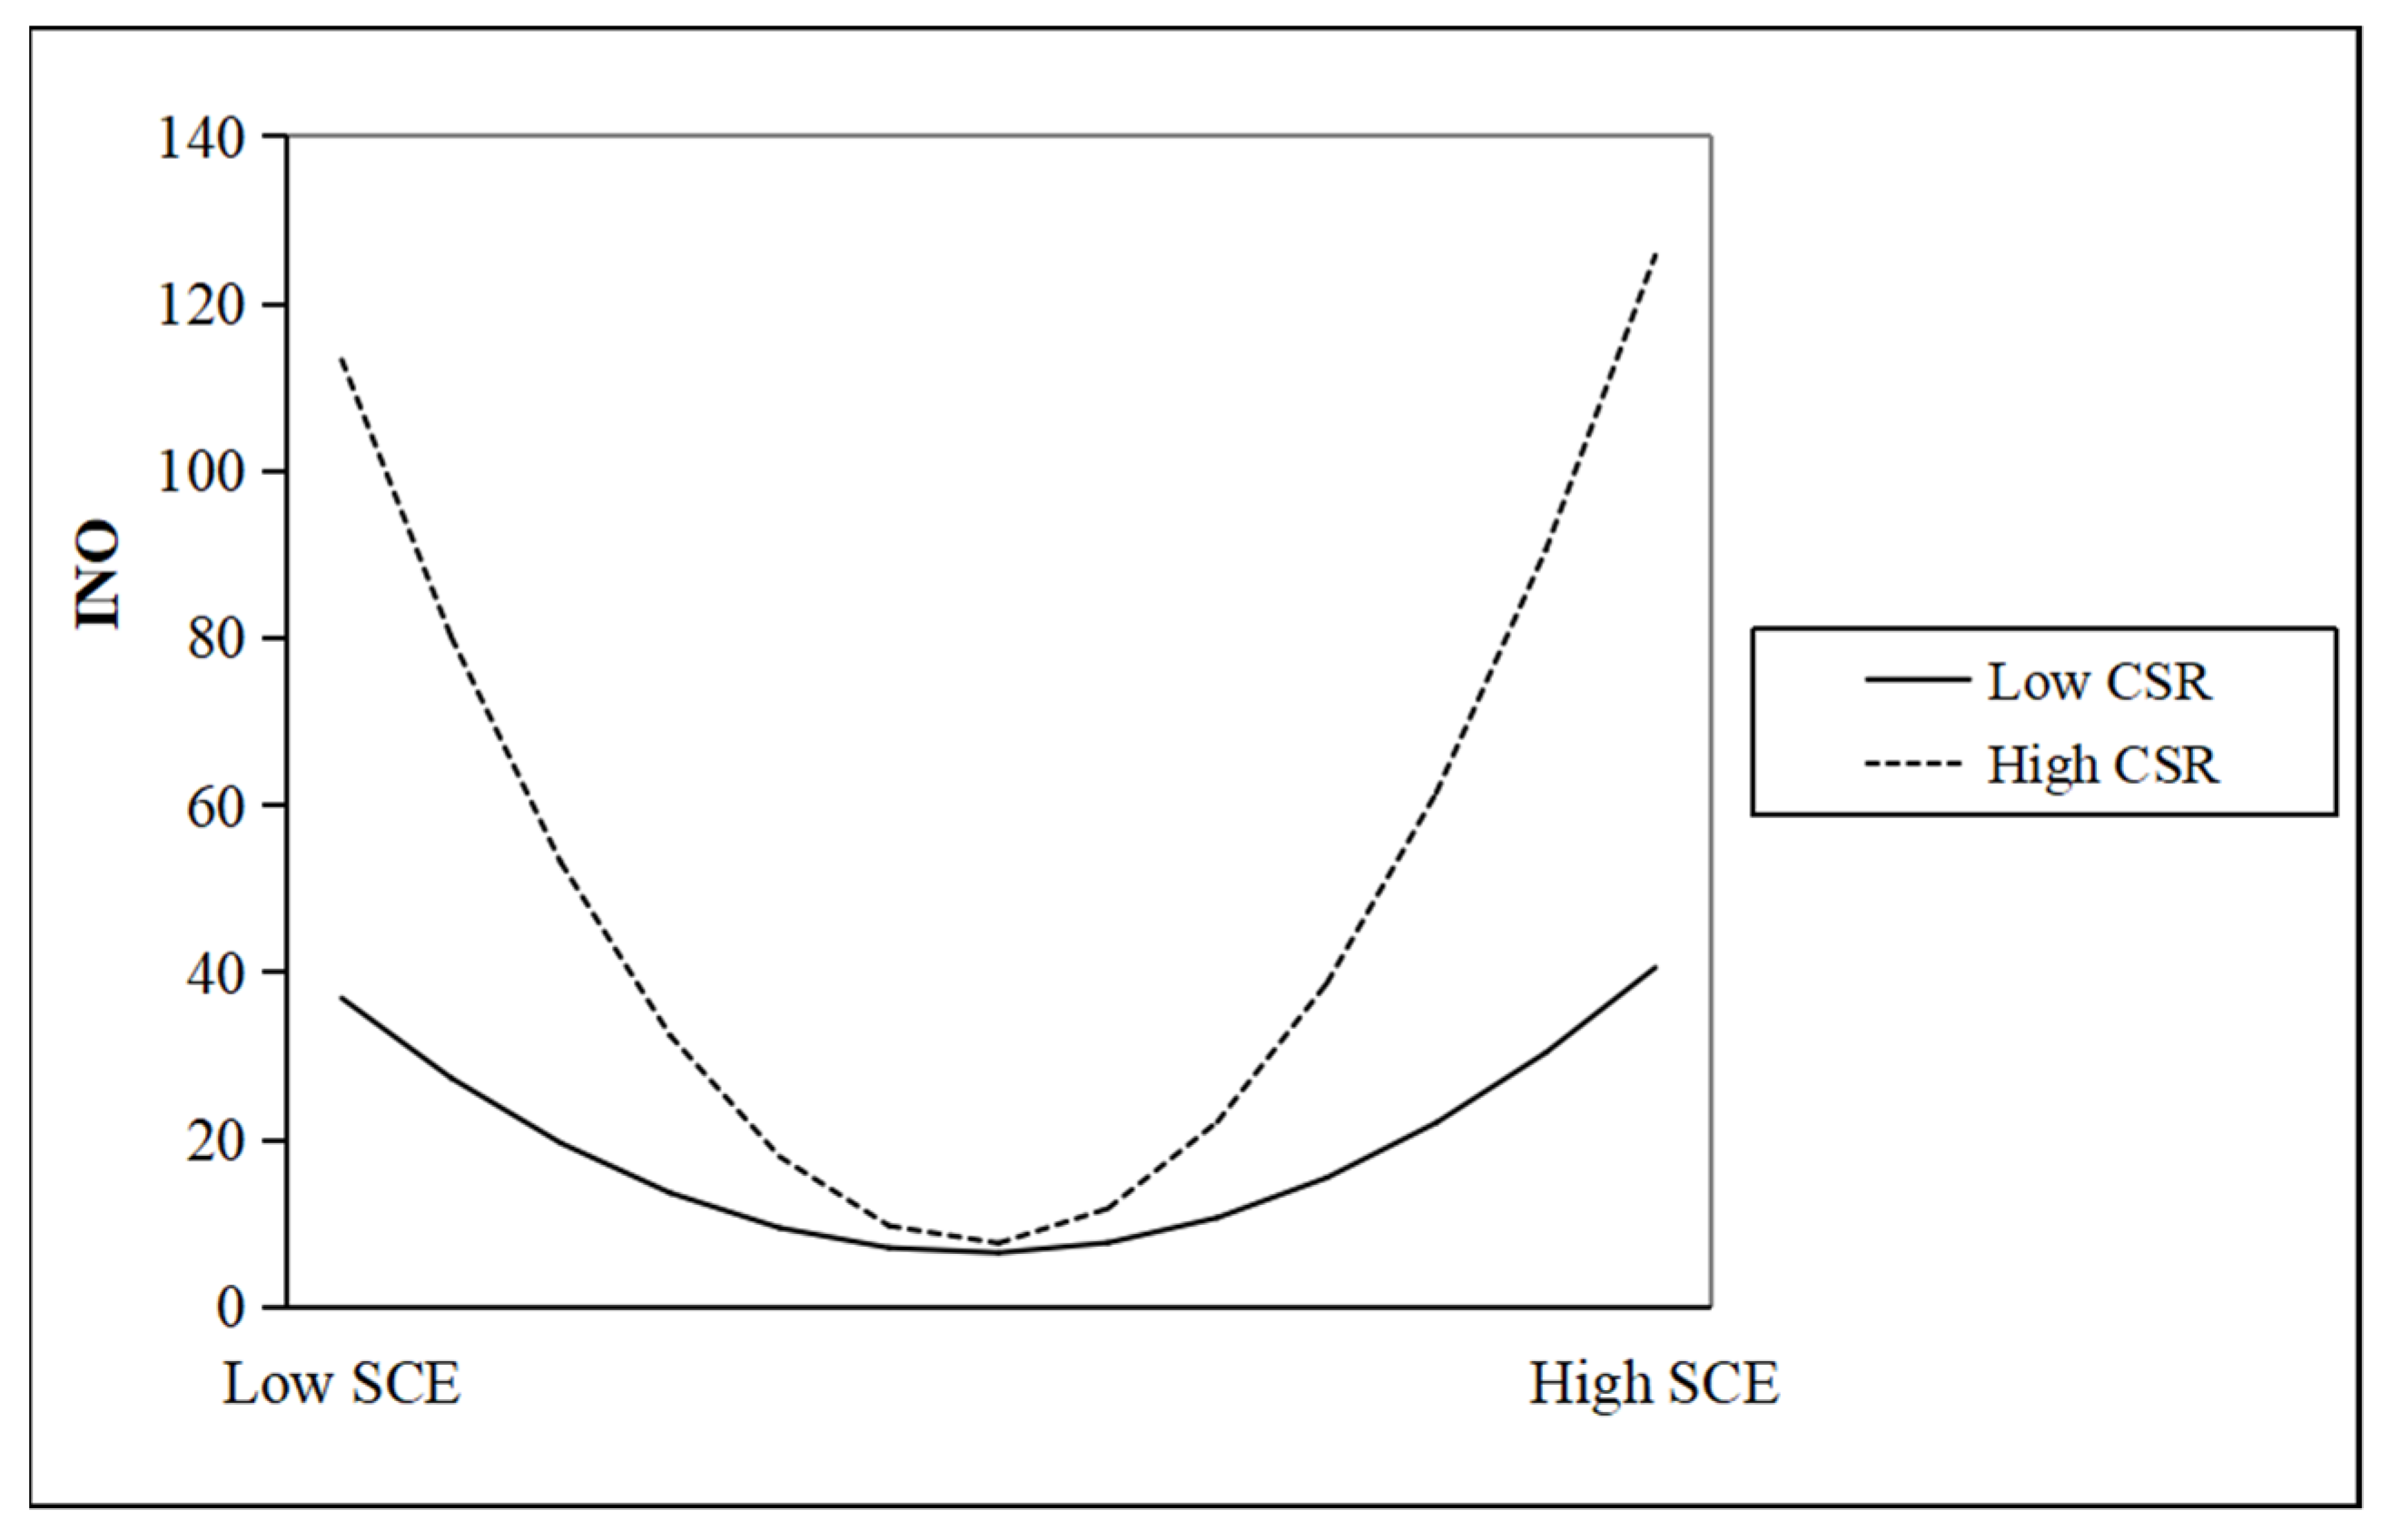
4.3. Further Analysis

The previous regression results show that intellectual capital and the components of intellectual capital (human capital and structural capital) have a significant U-shaped relationship with technological innovation. Moreover, CSR can positively moderate the above U-shaped relationship. Since the different ownership nature of the listed companies may also affect the implementation of technological innovation, we further explore whether the constraint of ownership nature impacts the above U-shaped relationship.
Table 5 presents further regression results for enterprises with different ownership properties. The results in columns 1 and 5 show that intellectual capital has a significant U-shaped effect on technological innovation for both state-owned and private enterprises. The regression coefficient of state-owned enterprises is higher than that of private enterprises, indicating that state-owned enterprises are more susceptible to the effect of intellectual capital and focus more on the value creation of intellectual capital. The results in columns 2 and 6 show that human capital has a significant U-shaped relationship with technological innovation in both state-owned and private enterprises, and structural capital has a significant U-shaped relationship with technological innovation in private enterprises. In contrast, this relationship is not significant in state-owned enterprises. Possible reasons are: (1) the sample size is limited and cannot fully reflect the U-shaped relationship between structural capital and technological innovation in state-owned enterprises. (2) Compared with private enterprises, state-owned enterprises are more likely to be subject to government control and intervention. Both the approval of innovation projects and the approval of R&D funds are often influenced by government decisions, making the role of structural capital in technological innovation smaller. The results in columns 3 and 7 show that the positive moderating effect of corporate social responsibility on the U-shaped relationship between intellectual capital and technological innovation holds in both state-owned enterprises and private enterprises. The positive moderating effect is higher in private enterprises than in state-owned enterprises, indicating that private enterprises can better play the U-shaped role of intellectual capital in technological innovation by actively fulfilling their social responsibility. The results in columns 4 and 8 indicate that CSR positively moderates the U-shaped effects of human capital and structural capital on technological innovation in state-owned and private enterprises.

4.4. Robustness Tests

In the robustness test, we use the number of invention patent applications (INO’) instead of the number of patent applications (INO) to measure technological innovation. The test results are shown in Table 6. The regression coefficient of ICE2 in Model 1 is 0.099 (p < 0.01), indicating a U-shaped relationship between intellectual capital and technological innovation. H1 is still supported. The regression coefficients of HCE2 and SCE2 in Model 2 are 0.075 (p < 0.01) and 0.029 (p < 0.10), respectively, indicating a U-shaped relationship between human capital, structural capital, and technological innovation. H2 and H3 are still supported. The regression coefficient of ICE2 × CSR in Model 3 is 0.111 (p < 0.01), indicating that CSR positively moderates the U-shaped relationship between intellectual capital and technological innovation. H4 is still supported. The regression coefficients of HCE2 × CSR and SCE2 × CSR in Model 4 are 0.137 (p < 0.01) and 0.115 (p < 0.01), respectively, indicating that CSR has a positive moderating effect in the U-shaped relationship between human capital, structural capital, and technological innovation. H5 and H6 are still supported.

5. Conclusions

This study empirically investigates the relationship between intellectual capital and technological innovation based on 15,757 sample data of Chinese A-share listed companies from 2014 to 2019 and then examines the moderating effect of CSR in the above-mentioned relationship. The study results are as follows.
(1) There is a significant U-shaped relationship between intellectual capital and its elements and technological innovation, indicating that the effect of intellectual capital and its elements on enterprise technology innovation has a threshold effect. The findings break through the previous linear research framework of ‘the higher the intellectual capital, the stronger the technological innovation’ and explore the specificity of intellectual capital’s impact on technological innovation in more depth. When the level of intellectual capital is low, innovation costs and risks coexist. The lack of advantage of intellectual capital endowment makes enterprises less motivated to innovate. When intellectual capital exceeds a certain threshold, the comprehensive benefits obtained from technological innovation driven by high intellectual capital far outweigh the costs, and enterprises’ motivation for technological innovation increases.
(2) CSR positively moderates the U-shaped relationship between intellectual capital, its elements, and technological innovation. CSR can make the U-shaped effect of intellectual capital and its elements on technological innovation more concave. When intellectual capital is at a low level, the crowding-out effect of CSR is stronger than the incentive effect, and increasing CSR is more likely to crowd out the technological innovation resources of enterprises, thus enhancing the negative effect of intellectual capital on technological innovation. When intellectual capital exceeds a certain threshold, the incentive effect of CSR is stronger than the crowding-out effect. In order to enhance the competitive advantage, enterprises urgently need to carry out technological innovation activities. Actively fulfilling social responsibility can help enterprises obtain the knowledge, skills, and relationships needed for technological innovation from external stakeholders, thus enhancing the positive effect of intellectual capital on technological innovation.
(3) The U-shaped relationship between intellectual capital and technological innovation still holds for both state-owned and private enterprises. The U-shaped relationship between structural capital and technological innovation exists only in private enterprises and not in state-owned enterprises, indicating that the effect of structural capital on technological innovation in state-owned enterprises is not significant. CSR plays a positive moderating role in the U-shaped effect of intellectual capital and its elements on technological innovation. This finding is verified in both state-owned and private enterprises.
Some implications can be drawn from the findings of this study. On the one hand, there is a threshold effect on the positive effect of intellectual capital on technological innovation. Enterprises should strive to complete the accumulation of intellectual capital, pay attention to the introduction of talents, increase technical training, establish a sound knowledge management system, improve organizational processes, and create an innovation culture according to their own resources and technological innovation needs, so as to provide strong intellectual capital to promote technological innovation. On the other hand, because CSR can strengthen the effect of intellectual capital on technological innovation, managers of enterprises with low intellectual capital should keep CSR fulfillment within a reasonable range to avoid the negative impact of excessive CSR fulfillment on technological innovation. For enterprises with larger intellectual capital, they should actively undertake social responsibility and enhance good relationships with stakeholders to improve the efficiency and output of technological innovation.
There are still some limitations in this study, which could be further explored in the future. First of all, the data used in this study are all from China’s A-share listed companies, so the research results may not, to some extent, have international universality. Moreover, this study tests the differences between state-owned enterprises and private enterprises. China’s unique enterprise ownership system also makes it difficult to find similar research samples in other countries. As the implementation of CSR and the decision-making of technological innovation strategies may be affected by the institutional environment and economic environment, we could try to distinguish between developed and developing countries in the future to test whether the above conclusions are still supported. Secondly, in this study, we do not distinguish between industries. We may not draw the same conclusion by using data from some industries alone, so it is still necessary to explore further. Finally, there are disputes about the definition of intellectual capital and VAIC in academia. In particular, some scholars have identified significant differences in the calculation method of VA. We suggest conducting a comparative study between countries in the future to explore which VAIC measurement model is better for a particular country. As the mainstream of academia holds a triadic view of intellectual capital, it is also necessary to integrate into relational capital when the data conditions permit in the future.

Author Contributions

Conceptualization, Z.Z. and D.C.; methodology, Z.Z. and D.C.; software, Z.Z. and X.W.; validation, Z.Z. and X.W.; formal analysis, Z.Z.; investigation, Z.Z. and X.W.; resources, Z.Z. and D.C.; data curation, Z.Z. and X.W.; writing—original draft preparation, Z.Z.; writing—review and editing, X.W. and D.C.; visualization, Z.Z. and X.W.; supervision, D.C.; project administration, D.C. All authors have read and agreed to the published version of the manuscript.

Funding

This research received no external funding.

Institutional Review Board Statement

Not applicable.

Informed Consent Statement

Not applicable.

Data Availability Statement

The data and models used during the study are available from the corresponding author by request.

Conflicts of Interest

The authors declare no conflict of interest.

References

  1. Bayraktaroglu, A.E.; Calisir, F.; Baskak, M. Intellectual capital and firm performance: An extended VAIC model. J. Intellect. Cap. 2019, 20, 406–425. [Google Scholar] [CrossRef]
  2. Hormiga, E.; García-Almeida, D.J. Accumulated knowledge and innovation as antecedents of reputation in new ventures. J. Small Bus. Enterp. Dev. 2016, 23, 428–452. [Google Scholar] [CrossRef]
  3. Zhang, J.A.; Edgar, F.; Geare, A.; O’Kane, C. The interactive effects of entrepreneurial orientation and capability-based HRM on firm performance: The mediating role of innovation ambidexterity. Ind. Mark. Manag. 2016, 59, 131–143. [Google Scholar] [CrossRef]
  4. Subramaniam, M.; Youndt, M.A. The Influence of Intellectual Capital on the Types of Innovative Capabilities. Acad. Manag. J. 2005, 48, 450–463. [Google Scholar] [CrossRef] [Green Version]
  5. Pulic, A. VAIC™—An accounting tool for IC management. Int. J. Technol. Manag. 2000, 20, 702–714. [Google Scholar] [CrossRef]
  6. Fait, M.; Cillo, V.; Papa, A.; Meissner, D.; Scorrano, P. The roots of “volunteer” employees’ engagement: The silent role of intellectual capital in knowledge-sharing intentions. J. Intellect. Cap. 2021. ahead-of-print. [Google Scholar] [CrossRef]
  7. Al Qershi, N.; Mokhtar, S.S.M.; Abas, Z. The influence of structural capital on the relationship between CRM implementation and the performance of manufacturing SMEs. Int. J. Syst. Assur. Eng. Manag. 2021. [Google Scholar] [CrossRef]
  8. Harrison, S.; Sullivan, P.H. Profiting from intellectual capital. J. Intellect. Cap. 2000, 1, 33–46. [Google Scholar] [CrossRef]
  9. Hayton, J.C. Competing in the new economy: The effect of intellectual capital on corporate entrepreneurship in high-technology new ventures. R&D Manag. 2005, 35, 137–155. [Google Scholar] [CrossRef]
  10. Chahal, H.; Bakshi, P. Examining intellectual capital and competitive advantage relationship. Int. J. Bank Mark. 2015, 33, 376–399. [Google Scholar] [CrossRef]
  11. Cao, Y.; Xiong, S.; Hu, H. A study of the relationship between intellectual capital and innovation performance based on the life cycle of enterprises. Sci. Res. Manag. 2016, 37, 69–78. [Google Scholar] [CrossRef]
  12. Zha, C.; Chen, W.; Tang, C.; Shen, X. Empirical Study on Relationship among Intellectual Capital, Learning from Failure and Low-cost Innovation. Technol. Econ. 2015, 34, 35–43. [Google Scholar] [CrossRef]
  13. Bejinaru, R. Knowledge strategies aiming to improve the intellectual capital of universities. Manag. Mark. Chall. Knowl. Soc. 2017, 12, 500–523. [Google Scholar] [CrossRef] [Green Version]
  14. Bratianu, C.; Bejinaru, R. Knowledge strategies for increasing IC of universities. In Proceedings of the 9th European Conference on Intellectual Capital (ECIC 2017), Lisbon, Portugal, 6–7 April 2017; pp. 34–41. [Google Scholar]
  15. Zhan, G.; Li, Z. A research on the effect of internationalization drain of intellectual capital on technological innovation. Sci. Res. Manag. 2018, 39, 96–102. [Google Scholar] [CrossRef]
  16. Li, Z.; Ruan, D.; Zhang, T. Value Creation Mechanism of Corporate Social Responsibility: A Study Based on Internal Control. Account. Res. 2020, 112–124. [Google Scholar] [CrossRef]
  17. Luo, X.; Du, S. Exploring the relationship between corporate social responsibility and firm innovation. Mark. Lett. 2015, 26, 703–714. [Google Scholar] [CrossRef]
  18. Cabello, C.; Kekäle, T. Managing intellectual capital in small ITC companies. Bus. Strategy Ser. 2008, 9, 163–167. [Google Scholar] [CrossRef]
  19. McWilliams, A.; Siegel, D. Corporate Social Responsibility: A Theory of the Firm Perspective. Acad. Manag. Rev. 2001, 26, 117–127. [Google Scholar] [CrossRef]
  20. Stewart, T.A. Your company’s most valuable asset: Intellectual capital. Fortune 1994, 130, 68–73. [Google Scholar]
  21. Riahi-Belkaoui, A. Intellectual capital and firm performance of US multinational firms. J. Intellect. Cap. 2003, 4, 215–226. [Google Scholar] [CrossRef]
  22. Ujwary-Gil, A. The business model and intellectual capital in the value creation of firms. Balt. J. Manag. 2017, 12, 368–386. [Google Scholar] [CrossRef]
  23. Gallego, C.; Mejía, G.M.; Calderó, G. Strategic design: Origins and contributions to intellectual capital in organizations. J. Intellect. Cap. 2020, 21, 873–891. [Google Scholar] [CrossRef]
  24. Ali, B.J.; Anwar, G. Intellectual capital: A modern model to measure the value creation in a business. Int. J. Eng. Bus. Manag. 2021, 5, 31–43. [Google Scholar] [CrossRef]
  25. Leiter, A.M.; Parolini, A.; Winner, H. Environmental regulation and investment: Evidence from European industry data. Ecol. Econ. 2011, 70, 759–770. [Google Scholar] [CrossRef]
  26. Wang, Z.; Wang, N. Knowledge sharing, innovation and firm performance. Expert Syst. Appl. 2012, 39, 8899–8908. [Google Scholar] [CrossRef]
  27. Chen, V.Z.; Li, J.; Shapiro, D.M.; Zhang, X. Ownership structure and innovation: An emerging market perspective. Asia Pac. J. Manag. 2014, 31, 1–24. [Google Scholar] [CrossRef]
  28. Niu, J.; Li, S.; Yang, Y.; Dong, C. Management Compensation, Governance Mode and Innovation Performance. J. Manag. Sci. 2019, 32, 77–93. [Google Scholar] [CrossRef]
  29. Grajkowska, A. Valuing intellectual capital of innovative start-ups. J. Intellect. Cap. 2011, 12, 179–201. [Google Scholar] [CrossRef]
  30. Wu, W.; Zhang, T. The Asymmetric Influence of Non-R&D Subsidies and R&D Subsidies on Innovation Output of New Ventures. J. Manag. World 2021, 37, 137–160. [Google Scholar] [CrossRef]
  31. Hervas-Oliver, J.; Sempere-Ripoll, F.; Boronat-Moll, C.; Rojas, R. Technological innovation without R&D: Unfolding the extra gains of management innovations on technological performance. Technol. Anal. Strateg. 2015, 27, 19–38. [Google Scholar] [CrossRef]
  32. Kang, Q.; Liu, Q.; Qi, R. The Sarbanes-Oxley act and corporate investment: A structural assessment. J. Financ. Econ. 2010, 96, 291–305. [Google Scholar] [CrossRef] [Green Version]
  33. Jie, X. Value Creation Mechanism of Corporate Social Responsibility. Chin. J. Manag. 2014, 11, 1671–1679. [Google Scholar] [CrossRef]
  34. Gangi, F.; Salerno, D.; Meles, A.; Daniele, L.M. Do Corporate Social Responsibility and Corporate Governance Influence Intellectual Capital Efficiency? Sustainability 2019, 11, 1899. [Google Scholar] [CrossRef] [Green Version]
  35. Cegarra-Navarro, J.; Kassaneh, T.C.; Caro, E.M.; Martínez, A.M.; Bolisani, E. Technology Assimilation and Embarrassment in SMEs: The Mediating Effect on the Relationship of Green Skills and Organizational Reputation. IEEE Trans. Eng. Manag. 2021, 1–9. [Google Scholar] [CrossRef]
  36. Yuan, J.; Hou, Q.; Cheng, C. The curse effect of enterprise political resources: An examination based on political affiliation and enterprise technological innovation. Manag. World 2015, 139–155. [Google Scholar] [CrossRef]
  37. Bellamy, M.A.; Ghosh, S.; Hora, M. The influence of supply network structure on firm innovation. J. Oper. Manag. 2014, 32, 357–373. [Google Scholar] [CrossRef]
  38. Li, W.; Jia, X.; Liao, Y.; Liu, Y. An Empirical Research of the Influence of Corporate Social Responsibility (CSR) on Firm’s Technological Innovation Performance with the Integration of Multiple Perspectives. Chin. J. Manag. 2018, 15, 237–245. [Google Scholar] [CrossRef]
  39. Marzo, G. A theoretical analysis of the value added intellectual coefficient (VAIC). J. Manag. Gov. 2021. [Google Scholar] [CrossRef]
  40. Singla, H.K. Does VAIC affect the profitability and value of real estate and infrastructure firms in India? A panel data investigation. J. Intellect. Cap. 2020, 21, 309–331. [Google Scholar] [CrossRef]
  41. Chen, M.C.; Cheng, S.J.; Hwang, Y. An empirical investigation of the relationship between intellectual capital and firms’ market value and financial performance. J. Intellect. Cap. 2005, 6, 159–176. [Google Scholar] [CrossRef]
  42. Ghosh, S.K.; Maji, S.G. Empirical Validity of Value Added Intellectual Coefficient Model in Indian Knowledge-based Sector. Glob. Bus. Rev. 2015, 16, 947–962. [Google Scholar] [CrossRef]
  43. Nazari, J.A.; Herremans, I.M. Extended VAIC model: Measuring intellectual capital components. J. Intellect. Cap. 2007, 8, 595–609. [Google Scholar] [CrossRef]
  44. Iazzolino, G.; Laise, D. Value added intellectual coefficient (VAIC). J. Intellect. Cap. 2013, 14, 547–563. [Google Scholar] [CrossRef]
  45. Li, L.; Zhang, D. Analysis of Influence Factors on Value Creation Efficiency of Intellectual Capital in High-Tech Enterprise. J. Quant. Tech. Econ. 2017, 34, 55–71. [Google Scholar] [CrossRef]
  46. Ployhart, R.E.; Weekley, J.A.; Ramsey, J. The Consequences of Human Resource Stocks and Flows: A Longitudinal Examination of Unit Service Orientation and Unit Effectiveness. Acad. Manag. J. 2009, 52, 996–1015. [Google Scholar] [CrossRef]
  47. Madsen, T.L.; Mosakowski, E.; Zaheer, S. The dynamics of knowledge flows: Human capital mobility, knowledge retention and change. J. Knowl. Manag. 2002, 6, 164–176. [Google Scholar] [CrossRef]
  48. Hatch, N.W.; Dyer, J.H. Human capital and learning as a source of sustainable competitive advantage. Strateg. Manag. J. 2004, 25, 1155–1178. [Google Scholar] [CrossRef]
Figure 1. Analysis framework.
Sustainability 13 12872 g001
Figure 2. Trends in the mean value of intellectual capital and technological innovation by year.
Sustainability 13 12872 g002
Figure 3. The moderating effect of CSR on the relationship between intellectual capital and technological innovation.
Sustainability 13 12872 g003
Figure 4. The moderating effect of CSR on the relationship between human capital and technological innovation.
Sustainability 13 12872 g004
Figure 5. The moderating effect of CSR on the relationship between structural capital and technological innovation.
Sustainability 13 12872 g005
Table 1. Definition of Variables.
TypesNamesSymbolsDefinition
Dependent VariableTechnological InnovationINOThe number of patent applications for listed companies is added by 1 and taken as a logarithm
Independent VariablesIntellectual CapitalICEICE = HCE + SCE
Human CapitalHCEHCE = VA/HC;
VA = Salary Expense + Interest Expense + Pre-Tax Profit;
HC = Salary Expense
Structural CapitalSCESCE = SC/VA; SC = VA − HC
Moderator VariableCorporate Social ResponsibilityCSRHexun CSR score
Control VariablesCompany SizeSizeTake the total assets of the listed company to the logarithm
Financial LeverageLevTotal liabilities/Total assets
Growth AbilityGrowthChanges in operating income for the period
/Operating income in the previous period
ProfitabilityRoaNet profit/Total assets
Nature of OwnershipStateState = 0 or 1, private take 0, state-owned take 1
Percentage of Independent DirectorsIndirNumber of independent directors
/Total number of directors
Cash Flow SufficiencyCfoNet operating cash flow/Total assets
Top 10 Shareholders’ ShareholdingTop10The sum of the shareholding ratio of the top 10 shareholders
Proportion of Fixed AssetsPpeFixed assets/Total assets
Company AgeAgeYear of observation minus year of company establishment
Table 2. Descriptive Statistics (n = 15,757).
VariablesMaxMinMeanMedianSD
INO9.9090.0002.6392.7731.811
ICE279.535−62.7123.1242.4575.531
HCE278.538−63.7272.4721.9474.428
SCE277.612−0.1000.6520.5093.356
CSR90.010−9.99022.69321.74012.566
Size28.63617.81322.29822.1241.324
Lev0.9870.0080.4210.4100.227
Growth429.036−0.9820.3440.1114.234
Roa0.964−1.8590.0440.0400.074
State1.0000.0000.3150.0000.464
Indir0.8000.2000.3770.3640.056
Cfo0.876−0.7420.0490.0480.073
Top1098.5881.31058.80459.74114.816
Ppe0.9540.0000.2100.1740.163
Age61.0004.00018.16118.0005.510
Table 3. The Average Value of Intellectual Capital and Technological Innovation for Each Year.
201420152016201720182019
INO2.4422.5812.7432.752.6632.611
ICE3.3743.393.2753.2562.8292.816
HCE2.7482.5622.6042.6912.1782.208
SCE0.6260.8280.6710.5650.650.608
Table 4. Regression Analysis Results.
Variables(1)(2)(3)(4)
INOINOINOINO
ICE−0.156 ***
(−14.14)
−0.044 ***
(−3.13)
ICE20.110 ***
(10.60)
0.024 *
(1.81)
HCE −0.152 ***
(−14.88)
−0.060 ***
(−4.43)
HCE2 0.081 ***
(9.04)
−0.039
(−1.59)
SCE −0.035 **
(−2.44)
−0.002
(−0.14)
SCE2 0.039 ***
(2.70)
0.008
(0.51)
CSR 0.073 ***
(8.36)
0.076 ***
(8.41)
ICE × CSR −0.187 ***
(−13.16)
ICE2 × CSR 0.124 ***
(9.64)
HCE × CSR −0.152 ***
(−11.16)
HCE2 × CSR 0.159 ***
(6.22)
SCE × CSR −0.128 ***
(−4.46)
SCE2 × CSR 0.125 ***
(4.55)
Size0.496 ***
(64.37)
0.498 ***
(64.61)
0.500 ***
(63.97)
0.501 ***
(64.21)
Lev0.021 ***
(2.68)
0.023 ***
(2.94)
0.018 **
(2.30)
0.019 **
(2.50)
Growth−0.028 ***
(−4.55)
−0.028 ***
(−4.54)
−0.028 ***
(−4.58)
−0.028 ***
(−4.57)
Roa0.049 ***
(6.17)
0.066 ***
(7.69)
0.022 **
(2.56)
0.033 ***
(3.53)
State−0.012 *
(−1.71)
−0.012 *
(−1.75)
−0.018 **
(−2.57)
−0.019 ***
(−2.75)
Indir−0.003
(−0.50)
−0.003
(−0.55)
−0.001
(−0.21)
−0.002
(−0.26)
Cfo0.018 ***
(2.71)
0.015 **
(2.23)
0.026 ***
(3.77)
0.024 ***
(3.52)
Top10−0.039 ***
(−5.96)
−0.040 ***
(−6.16)
−0.037 ***
(−5.73)
−0.038 ***
(−5.86)
Ppe−0.137 ***
(−18.20)
−0.137 ***
(−18.26)
−0.143 ***
(−18.98)
−0.144 ***
(−19.17)
Age−0.069 ***
(−10.21)
−0.068 ***
(−10.11)
−0.067 ***
(−9.98)
−0.066 ***
(−9.87)
YearYESYESYESYES
IndYESYESYESYES
n15,75715,75715,75715,757
R20.41910.42050.42550.4275
F333.66316.91314.67286.18
Note: Values in parentheses are t-values; *, **, and *** indicate significance at the 10%, 5%, and 1% levels, respectively.
Table 5. Further Regression Analysis Results.
VariablesState-Owned EnterprisesPrivate Enterprises
12345678
ICE−0.175 ***
(−7.59)
−0.136 ***
(−3.51)
−0.144 ***
(−11.49)
−0.02
(−1.33)
ICE20.150 ***
(6.66)
0.101 ***
(3.08)
0.085 ***
(7.39)
0.051 **
(2.00)
HCE −0.148 ***
(−7.76)
−0.062 *
(−1.87)
−0.153 ***
(−12.03)
−0.094 ***
(−3.91)
HCE2 0.092 ***
(5.26)
−0.636 ***
(−5.14)
0.079 ***
(7.18)
−0.195 ***
(−2.92)
SCE −0.038
(−1.16)
−0.022
(−0.45)
−0.075 ***
(−3.75)
−0.022
(−1.00)
SCE2 0.045
(1.35)
0.024
(0.53)
0.076 ***
(3.81)
−0.044
(−1.56)
CSR 0.034 **
(2.36)
0.082 ***
(4.74)
0.098 ***
(8.78)
0.096 ***
(7.74)
ICE × CSR −0.081 ***
(−2.67)
−0.246 ***
(−14.50)
ICE2 × CSR 0.082 ***
(4.06)
0.117 ***
(4.61)
HCE × CSR −0.193 ***
(−5.13)
−0.170 ***
(−7.69)
HCE2 × CSR 0.749 ***
(5.76)
0.362 ***
(5.19)
SCE × CSR −0.242 *
(−1.83)
−0.111 ***
(−5.34)
SCE2 × CSR 0.248 *
(1.93)
0.142 ***
(4.83)
Size0.560 ***
(44.48)
0.561 ***
(44.56)
0.560 ***
(43.46)
0.566 ***
(43.92)
0.407 ***
(43.96)
0.409 ***
(44.20)
0.414 ***
(44.33)
0.417 ***
(44.66)
Lev−0.029 **
(−2.30)
−0.027 **
(−2.13)
−0.029 **
(−2.31)
−0.025 **
(−1.98)
0.040 ***
(4.14)
0.042 **
(4.30)
0.037 ***
(3.80)
0.038 **
(3.96)
Growth−0.035 ***
(−3.71)
−0.034 ***
(−3.68)
−0.035 ***
(−3.71)
−0.034 ***
(−3.70)
−0.024 ***
(−3.04)
−0.024 ***
(−3.05)
−0.024 ***
(−3.00)
−0.023 ***
(−3.00)
Roa0.020 *
(1.73)
0.034 ***
(2.72)
0.021 *
(1.68)
0.031 **
(2.33)
0.062 ***
(5.83)
0.077 ***
(6.73)
0.025 **
(2.17)
0.044 ***
(3.42)
Indir0.003
(0.29)
0.003
(0.30)
0.005
(0.47)
0.003
(0.33)
−0.014 *
(−1.82)
−0.015 *
(−1.84)
−0.013 *
(−1.69)
−0.013 *
(−1.71)
Cfo−0.008
(−0.77)
−0.01
(−0.97)
−0.009
(−0.83)
−0.007
(−0.66)
0.032 ***
(3.70)
0.029 ***
(3.25)
0.044 ***
(5.02)
0.040 ***
(4.48)
Top10−0.041 ***
(−3.78)
−0.042 ***
(−3.87)
−0.043 ***
(−3.88)
−0.044 ***
(−4.04)
−0.056 ***
(−6.84)
−0.057 ***
(−6.94)
−0.053 ***
(−6.52)
−0.053 ***
(−6.53)
Ppe−0.202 ***
(−16.36)
−0.203 ***
(−16.42)
−0.203 ***
(−16.36)
−0.204 ***
(−16.50)
−0.088 ***
(−9.71)
−0.089 ***
(−9.80)
−0.099 ***
(−10.92)
−0.099 ***
(−10.97)
Age−0.037 ***
(−3.55)
−0.036 ***
(−3.49)
−0.036 ***
(−3.48)
−0.036 ***
(−3.46)
−0.079 ***
(−9.32)
−0.079 ***
(−9.26)
−0.077 ***
(−9.14)
−0.076 ***
(−9.07)
YearYESYESYESYESYESYESYESYES
IndYESYESYESYESYESYESYESYES
n495949594959495910,79810,79810,79810,798
R20.5740.5750.57560.57920.33720.33930.35010.3525
F207.46195.95190.79173.63165.93157.91161.04146.39
Note: Values in parentheses are t-values; *, **, and *** indicate significance at the 10%, 5%, and 1% levels, respectively.
Table 6. Robustness Tests.
Variables1234
INO’INO’INO’INO’
ICE−0.137 ***
(−12.00)
−0.037 ***
(−2.60)
ICE20.099 ***
(9.22)
0.022
(1.59)
HCE −0.136 ***
(−12.95)
−0.056 ***
(−4.00)
HCE2 0.075 ***
(8.07)
−0.029
(−1.15)
SCE −0.023
(−1.50)
0.007
(0.45)
SCE2 0.029 *
(1.90)
−0.001
(−0.02)
CSR 0.077 ***
(8.56)
0.080 ***
(8.57)
ICE × CSR −0.164 ***
(−11.21)
ICE2 × CSR 0.111 ***
(8.32)
HCE × CSR −0.132 ***
(−9.40)
HCE2 × CSR 0.137 ***
(5.20)
SCE × CSR −0.117 ***
(−3.96)
SCE2 × CSR 0.115 ***
(4.06)
Size0.514 ***
(64.72)
0.516 ***
(64.94)
0.515 ***
(63.83)
0.516 ***
(64.04)
Lev0.003
(0.34)
0.005
(0.60)
0.001
(0.06)
0.002
(0.27)
Growth−0.027 ***
(−4.36)
−0.027 ***
(−4.35)
−0.027 ***
(−4.34)
−0.027 ***
(−4.34)
Roa0.041 ***
(4.97)
0.058 ***
(6.51)
0.012
(1.37)
0.024 **
(2.52)
State0.007
(0.92)
0.006
(0.89)
0.001
(0.13)
−0.001
(−0.02)
Indir0.002
(0.33)
0.002
(0.29)
0.004
(0.60)
0.003
(0.56)
Cfo0.015 **
(2.09)
0.011
(1.63)
0.020 ***
(2.83)
0.018 **
(2.55)
Top10−0.062 ***
(−9.28)
−0.063 ***
(−9.47)
−0.061 ***
(−9.20)
−0.062 ***
(−9.34)
Ppe−0.142 ***
(−18.27)
−0.142 ***
(−18.32)
−0.146 ***
(−18.77)
−0.147 ***
(−18.92)
Age−0.063 ***
(−9.02)
−0.062 ***
(−8.92)
−0.061 ***
(−8.83)
−0.061 ***
(−8.73)
YearYESYESYESYES
IndYESYESYESYES
n15,75715,75715,75715,757
R20.38290.38420.38810.3898
F286.94272.48269.47244.88
Note: Values in parentheses are t-values; *, **, and *** indicate significance at the 10%, 5%, and 1% levels, respectively.
Publisher’s Note: MDPI stays neutral with regard to jurisdictional claims in published maps and institutional affiliations.

