Abstract
Energy requirements have increased dramatically due to industrialization, economic, and population growth. To meet this demand, and solve its challenges, such as climate change, renewable energies do play an important role. This research work aims at selecting the best renewable energy projects using a hybrid decision-making framework from environmental, economic, technical, and social aspects at a sub-national level. In this regard, a new hybrid fuzzy multi-criteria decision-making model is deployed in which Vise Kriterijumska Optimizacija I Kompromisno Resenje, distance from average solution, and additive ratio assessment methods are used. In addition, for the weighing of criteria, Fuzzy Shannon’s entropy is used. Furthermore, the North Khorasan province is nominated as a sub-national study area. The results show that among 30 sub-criteria, social acceptance, net-presented cost, and noise were the top three with weights of 0.1105, 0.1003, and 0.0988, respectively. Solar energy projects also accomplished high ranks with an overall score of roughly 0.22. After that, small hydropower got second place with a score of 0.187. Moreover, the ranking of cities indicates that Jajarm was the most suitable location for implementing renewable energy development with a score of 0.14. Finally, sensitivity analysis was carried out to show that the mathematical model possessed good robustness.
1. Introduction
To achieve the Sustainable Development Goals (SDGs) set by the United Nations (UN), the years between 2020 to 2030 are the most important and critical periods [1]. One of the objectives of this vision is the seventh goal, entitled “Ensure access to affordable, reliable, sustainable, and modern energy for all”, which includes the three subsets of ensuring universal access to energy services, increasing the share of renewable energy (RE) in the energy basket, and increasing international cooperation to promote the technical level related to energy [2]. According to these definitions and the presented overall vision, RE can play a main role in achieving these goals by 2030, as RE is directly related not only to the seventh goal, but also to the other goals of the international program [3]. For instance, RE sources (RES) can help remote communities to obtain clean energy for cooking because it is abundant in the region [3].
On the other hand, the world will be confronted with two major crises: environmental pollution from the combustion of fossil fuels and the accelerated use of these fossil fuels due to widespread population growth and industrialization [4,5]. If nations want optimal and sustainable development without compromising the ability of future generations, it is necessary to follow the two policies of energy consumption management and the diversification of the energy supply system [6,7]. RESs have been known as the most effective tool for reducing greenhouse gas emissions and improving the recently intensified climate change challenge [8]. In the coming years, the share of electricity generation from RE, compared to the total electricity production in the world, will increase significantly as it is highly reliable, economic, efficient, inexhaustible, highly available in a local capacity, and clean [9]. It is expected that RE will increase from 25% of electricity generation (in 2017), to 85% by 2050 [8]. However, this development requires new approaches for power supply system planning, market operations, and major policy codification [10,11].
Although the role of energy policy is essential to mitigate challenges, policy making in the field of RESs differs in different countries because requirements and targets for the development of RES are different [12,13]. While plenty of policies have been applied to increase the use of RES in different sectors in many countries, and they have created many spatial variables, there are also geographical and local differences in the distribution of RESs [14,15,16]. Therefore, the sub-nation is being increasingly introduced as an important step towards the development of RE [17] and it has also become an important issue and regional concern because these resources are recognized as key solutions to environmental challenges and the acceleration of economic growth on a local scale [18,19]. The provincial-level (state-level) is considered the main governance scale in which many responsibilities have been shouldered and policies have been implemented [18]. Achieving the upstream goals of RE development requires the proper design and implementation of projects at the sub-national level, such as provinces and states, and their cities [20]. Therefore, the provinces (states) have a fundamental role in achieving the national, and consequently international, vision goals.
However, at the sub-national level, as decision variables become more diverse, smaller, and more uncertain [21], local organizations may also have conflicting interests [22]. Therefore, to solve the multidimensional problem of the potential measurement of RE technologies for the region, an appropriate decision-making framework should be selected to solve all dimensions of the problem in more detail and manage conflicts of interest [23].
Iran, with the production of 1.7% of all world’s greenhouse gases, is ranked first in the Middle East and is also among the top 10 exhaust fume emitting countries in the world [24]. Under the Paris Climate Change Agreement, by 2030 Iran has pledged to reduce its greenhouse gas emissions by 4% unconditionally and by 12% if sanctions are lifted [24]. If Iran plans to limit its greenhouse gas concentrations up to 450 ppm equivalent to carbon dioxide based on scenario 450 [25], new eco-friendly policies should be set to safeguard the environment. Roughly one-third of the greenhouse gas emissions shared in this country are associated with the electricity generation sector. Therefore, using renewable energy could be one of the best options to reduce greenhouse gases in the country [26]. However, according to the Renewable Energy and Energy Efficiency Organization (SATBA)’s report in October 2020, 838.18 MW of renewable energy had been installed [27]. Despites this, Iran possesses favorable geography for RESs and a high potential from them due to the country’s location in the solar belt [28]. Therefore, North Khorasan province, one of the youngest provinces in Iran, was selected as a study area [29]. This province, with a GDP of 0.6 % and an area of 28,434 square kilometers, is ranked 30th among 31 provinces in terms of development [30].
2. Literature Review
After identifying the candidates for RESs at the sub-national level and determining the relevant criteria [31,32], the ranking and selection of the most appropriate alternatives to these problems were raised [33]. Since the selection of the best RE option among a set of candidates is based on conflicting criteria and has geographical, technical, economic, social, and environmental dimensions, a multi-criteria decision-making (MCDM) method was used [33,34]. MCDM methods can simultaneously consider all conflicting criteria, conflicts of interest between actors, and the lack of sufficient and correct information, eventually solving issues easily [35].
There have been numerous research papers related to implementing solar energy for different purposes [36,37,38,39]. Among the various models of MCDM, fuzzy models are used to make the decision environment more realistic, minimize existing uncertainties and obtain more reliable and accurate results [40,41,42]. For example, [43] it has been proven that issues related to RE are caused by problems with insufficient data and uncertainty [33], suggesting that fuzzy theory mode can be used to solve such problems. Moreover, while a group of decision-makers applies different and diverse opinions, FMCDM is appropriate to manage the conflicts of interest to achieve the final result [44]. However, all MCDMs have their advantages and disadvantages, and it is not possible to say which one is the most appropriate [45]. Therefore, to take advantage of different methods and cover their disadvantages, hybrid methods (HFMCDM) have been used [46].
As mentioned above, the current research has utilized a two-phase framework, in which, high RE potential locations are satisfied during the first phase. In the second phase, using a new trigonometric HFMCDM, one of the most common fuzzy methods [47], the RE candidates selected in the previous phase were ranked. In the HFMCDM method, during the first stage, a trigonometric fuzzy decision-making matrix (TFDM) was formed by interviewing eight experts based on the proposed constraints, with a range of linguistic variables [48]. In the next step, using the fuzzy Shannon’s entropy method [49], the nominated criteria were weighed. In the third step, RE candidates were scored through the multi-objective optimization based on ratio analysis (MOORA) [50], Vise Kriterijumska Optimizacija I Kompromisno Resenje (VIKOR) [48], distance from average solution (EDAS) [51], and additive ratio assessment (ARAS) [52] techniques in the fuzzy state. In the last step, by normalizing the scores of each technique and adding them together, the final result was obtained for each alternative. Finally, by comparing the results with the real project in the study area, as well as performing sensitivity analysis, the accuracy and reliability of the intended framework were evaluated. Table 1 illustrates the related studies using MCDM methods and a geographic information system (GIS) tool that encouraged us to present the work.

Table 1.
Comparison of related studies about RES ranking.
A review of the literature reveals some knowledge gaps. First, previous works have mentioned the water consumption of renewable power plants but did not consider the groundwater resources which are directly affected by them. In this case, the status of groundwater resources (extractable, critical, and supercritical) must be determined to check the permissions for the construction of wells or water abstraction. Therefore, the renewable power plants’ location, based on the status of groundwater resources, is of great importance. Second, although many studies have been conducted on the application of MCDM methods to prioritize renewable energy sources, few have attempted to examine real decision conditions that are uncertain and random under a fuzzy environment. The fuzzy decision-making framework becomes more difficult when the case study is at the sub-national level because this political–geographical scale needs more accurate and complete information, which has received less attention in the literature review. Third, GIS software has limitations in determining the importance of some criteria. For example, from a weighting point of view, the location of a wind farm next to a village with a population of a few dozen people is different from it being located near a city with several thousand people. Therefore, this limitation has been removed using the opinions of experts in this current study. Finally, in all previous work, merely the prioritization of RESs has been studied. The independent political areas in which the RE alternatives are located are also important. These areas are cities of a province (or state), and the government should dedicate budgets for all activities. For RESs development, a budget is given to investors in the form of loans or incentives. Therefore, to distribute the RE development’s budget fairly and purposefully among the cities of a province, those must be ranked. Consequently, the prioritization of cities and RE alternatives, which has not been done simultaneously in the literature, is necessary. Briefly, this study seeks to accelerate the SDGs achievement in addition to adding to the literature. The main objectives of this study and its’ contribution to the literature are as follows:
(1) For the first time, a new practical approach of an organization related to RES development at a sub-national level has been introduced into the first phase of a two-phase HF-MCDM. In this approach, the cooperation of different organizations in the study area with the departments of SATBA is determined using the GIS software, with which, various maps are prepared and high RE potential locations related to the province are verified. This management strategy for local conflicts of interest can thus be a good role model for actors involved in RE development around the world and can help to reach the UN’s SDGs.
(2) This paper presents a comprehensive assessment standard framework for prioritizing RE alternatives in the second phase. For this purpose, the main criteria from technical, socioeconomic, and environmental points of view, composed of thirty sub-criteria, are considered. Based on the literature review, these sub-criteria have not been used together yet. In addition, some sub-criteria are new, such as water extraction restrictions and the price of land.
(3) This study uses a new and robust hybrid of F-MCDM methods (i.e., the HF-MCDM) for ranking RESs. The proposed method has the capability to solve the prioritized problems of RESs with insufficient information and uncertainty in a fuzzy environment, as a great advantage. In the proposed HF-MCDM, the F-SE is employed to determine the optimal weights of the criteria, which not only prevent the bias and subjective judgment of experts, but also increases the reliability of the results. To demonstrate the applicability and feasibility of the proposed decision-making model, a real case study was conducted for North Khorasan Province, Iran. In addition, this novel HF-MCDM could lead to an increase in the scope of decision-making methods in the field of RE development. Finally, the reliability, accuracy, and robustness of the proposed framework were evaluated by comparing them with a real practical project and conducting sensitivity analysis.
(4) To make the decision-making environment more realistic in this paper, the GIS software was used twice in addition to considering uncertainties, applying restrictions, and publishing real information by SATBA. At the first time, it is employed in the planning stage of the conflict of interest management strategy, and at the second time, in the stage of determining the most suitable RE candidates, because, in the first stage, the GIS software does not distinguish the locations with different qualities. However, in the second stage, this information is covered by the experts through a questionnaire and a range of linguistic variables; therefore, the gap created by the GIS software is filled. For example, the score of the distance of a wind farm from a city with a population of several thousand should be different from that of a wind farm located near a village with several households. However, identifying potential locations via the GIS software can be of great assistance in reducing administrative bureaucracy and starting the project implementation phase as soon as possible.
(5) In addition to ranking the candidates for RESs, the proposed framework can rank the cities in the study area so that the budget can be fairly allocated to advance the RE development goals. This represents another advantage of the proposed method.
The rest of this paper is structured as follows. In Section 3, the materials and methods are presented. Section 4 describes the study area. In Section 5, the definitions of the criteria and constraints are provided. Section 6 describes the analysis. Section 7 presents the results and discussions. Finally, conclusions and future studies are presented in Section 8.
3. Materials and Methods
The research approach adopted here was to use the new two-phase framework for dealing with the potential measurement of RESs and ranking the alternatives identified for this purpose simultaneously. During the first phase, the SATBA’s new executive approach was applied. In this vision, with the cooperation of the SATBA’s different offices and the local organizations of each province, various pieces of information, from technical, socioeconomic, environmental, and geographic perspectives, were obtained with the help of the GIS software. Of note, the SATBA’s Potential and Renewable Energy Resources Office shows these data in the form of reports by province. In these reports, there is information such as the latitude and longitude of high potential RE locations, distance from roads, residential areas, and power substations, types of land, the area required for power plant construction, and the estimated power plant capacity. In addition, based on coordination among different organizations of each province in this phase, conflict of interest management would occur in such a way that the development of RESs was accelerated and the SDGs could be achieved by 2030 at the sub-national level.
After identifying the high potential alternatives in the study area in the first phase, it was necessary to employ the suitable MCDM techniques from expert opinions in the second phase to rank the alternatives introduced for this purpose. This process required the selection of appropriate criteria, extracted from the first phase and the literature review. Since each MCDM technique is not superior to others and all have their advantages and disadvantages, the hybrid method was used to achieve better performance in the decision-making process. The fuzzy model was also applied to make decisions closer to reality, and to manage uncertainties, incomplete data, and different expert opinions. Consequently, the new HF-MCDM models were considered for this work due to the type of problem.
3.1. Phase I
Currently, private investors involved in the construction of an RE power plant, starting work after the potential assessment and placement by themselves or via consulting with independent experts in the field, first go through the registration and filing processes. Next, they obtain the licenses of the power plant gradually by participating in various organizations associated with the environment, electricity, and land acquisition. For waste-based biomass power plants and hydropower ones, the licenses from the municipality and organizations in charge of water for waste use, transmission lines, and streams are required. After this, the 20-year guaranteed power purchase agreement (PPA) is concluded with the investor. Finally, there are the stages of construction of the power plant and the period of operation, which vary according to the type of RESs and their capacity. This process is shown in Figure 1.
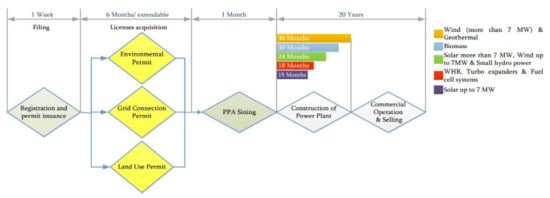
Figure 1.
The administrative process of RE plant investment [62].
As mentioned, there are two major problems facing this process, first, the long time to reach the operation stage and make money from the project, despite the fact that the time of studies and potential assessment of the investor is ignored, and second, there might be a conflict of interest between the responsible organizations which wastes time and consequently reduces the motivation of investors in this field.
Therefore, SATBA has recently taken a new approach to address the above-mentioned shortcomings and pave the way for investing in RE in Iran. According to this approach, the primary information-preparing task associated with the potential of RESs, and the evaluation of their feasibility, is often a government task around the world, as collecting, processing, and finally identifying RE potential locations are costly and they can be also used as a leverage policy in directing private investors.
The SATBA’s new approach is to create a quantitative and qualitative RES database using the information obtained from field statistical work. This approach is to create a roadmap based on evaluating RES potentials individually, as well as developing scenarios and integrated models to determine the share of clean energy, preparing and compiling appropriate documents and prioritizing projects, and finally, doing comprehensive planning and RES potential assessment. The output is often obtained based on data collection, including GIS maps, data integration and analysis, and the prioritization of energy consumption and resources in each province based on Iran’s electricity network through field negotiations with local organizations related to RESs. Figure 2 depicts the process of this approach.
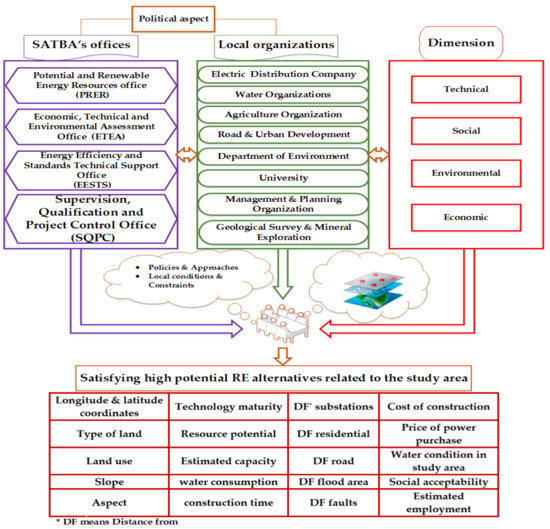
Figure 2.
The SATBA’s new practical approaches as a novel framework, Phase I.
The new approach accordingly tackles the disadvantages of the power plant construction process by investors. Therefore, it can be introduced to policymakers, planners, and researchers as a desirable plan, not only in Iran, but also around the world.
Upon identifying the high potential RE alternatives in the study area, it is necessary to evaluate the proposed ones by SATBA to find out which part of the province is under study and which RE is the most suitable alternative for investment. Therefore, in the second phase, this evaluation will be done as follows.
3.2. Phase II
After identifying the RES potential locations and eliminating the disadvantages of the renewable power plant construction process, such as non-conflict among organizations, it is time to prioritize and rank these locations from various socioeconomic, environmental, and technical aspects. For this purpose, in the second phase of the present study, the HF-MCDM method, consisting of F-SE, F-MOORA, F-VIKOR, F-EDAS, and F-ARAS, were used.
The methodology adopted in this work was comprised of four key steps. In the first step, the required information for ranking was collected, which could often be identified in Phase I as the criteria and their amount based on the case study and expert opinions. In the second step, first, the TFDM was determined, and after that, the F-SE was applied to get the weights of all criteria. At the next step, F-MOORA, F-VIKOR, F-EDAS, and F-ARAS were employed to score the RE alternatives for the case study, and then, the final ranking was obtained by employing the summation of the scores concluded in the previous step.
3.2.1. F-Shannon’s Entropy Method
The weight calculation consists of objective and subjective weighting. The subjective way is appointed by an expert judgment based on their knowledge and experiences. The Delphi method, and the analytic hierarchy process (AHP), are two examples of subjective judgments. SE is one of the objective methods wherein the real information alternatives are extracted. The advantage of this technique also decreases the decision-makers’ subjective impression and develops objectivity [55].
Hosseinzadeh et al. [63] developed the SE for imprecise information, especially fuzzy and interval data instances. In this paper, the weights of the criteria were obtained using this method. The steps of the F-SE are described as follows [49]:
Step 1—Construct TFDM via expert opinions, in which linguistic variables for each criterion should be changed into relevant fuzzy numbers:
Step 2—Transform into interval data by using the α-level sets via Equation (2).
Step 3—Normalize the value of the transformed matrix through Equation (3).
Step 4—Calculate the lower and upper bounds of the interval entropy using Equations (4) and (5).
where is equal to , and or is equal to 0 if .
Step 5—Calculate and , the upper and lower bounds and the interval diversification.
Step 6—Obtain the lower bound , the upper bound , and their average as follows:
3.2.2. Alternative Ranking
In this section, the scoring of the RE candidates is explained. The initial fuzzy weights of the criteria are also obtained by the F-SE as mentioned in the previous section.
F-MOORA
MOORA is a procedure for optimizing more than one conflicting characteristic subject to specific constraints [64]. Accordingly, this method seems to be an effective mechanism to evaluate the ranking or selection the best alternative from a group of feasible ones [50]. The values of scores are thus calculated for each alternative, providing the foundation of the comparison, and consequently, aid the selection of the best (i.e., the most satisfactory alternative).
The primary logic of MOORA is to measure the whole performance of each alternative as the difference between the sum of its normalized performance of positive and negative criteria through Equation (8).
where represents dimensionless quantity, belonging to the [0, 1] interval, and shows the normalized efficiency of the i-th candidate on the j-th factor, r is the number of beneficial criteria, which is counted to be maximized, (n-r) refers to the number of negative criteria counted to be minimized, and shows the overall performance index amount of the i-th alternative in respect of the whole factors.
Preference weights may be also employed to provide the relative importance of one attribute over the other since it is clear that some criteria are more significant than others. Once these weights are considered, Equation (9) is changed as:
where the j-th criterion weight is , which can be obtained by various weighting methods. The final priority may be also realized by the ordinal ranking of . Moreover, the best and worst alternatives have the highest and lowest values, respectively.
In this study, F-MOORA was presented for ranking the RE candidates. This method can be expressed using the following seven steps [50]:
Step 1—Extend a TFDM according to expert opinions where each criterion is determined by the trigonometric function (TMF) (viz. Step 1 of Section 3.2.1 F-SE).
Step 2—Normalize the TFDM, developed in Step 1, via vector normalization. The following equations are thus applied for this object.
Step 3—Determine the weighted normalized FDM using Equation (13).
where , , and are the fuzzy weights of the j-th criterion, which can be obtained by the F-SE.
Step 4—Compute the overall ratings of positive and negative criteria for each alternative using this procedure.
The whole rating of an alternative for the lower, middle, and upper values of the TFDM for positive criteria are determined by the following Equation (14).
The same calculations for the non-beneficial criteria are as follows:
Step 5—Defuzzify the overall values of ranking for positive and negative criteria for each alternative through the vertex method to specify the overall performance indicator (Si).
Step 6—Order Si in the descending arrangement. The alternative with the highest Si is thus the most favorable one.
F-VIKOR
The F-VIKOR is one of the MCDM methods that aims to select the best alternative under fuzzy conditions. Besides, the ranking criterion here is according to their level of closeness to the ideal answer. This method can prepare the highest amount of group benefit for the most and the least amount of individual influence to the opposition.
The process of this method is also similar to the VIKOR method, as stated by Apricovik [48]:
Step 1—This step is the same as that in F-MOORA. Moreover, the weight and the types of criteria must be specified. The weight of the criteria can also be calculated from the weighting methods used in the current work, the F-SE. The types of criteria are then divided into two categories of positive and negative. The positive criteria are the metrics that help increase profits and improve the system while the negative ones are the metrics whose reduction leads to improvements in the system.
Step 2—Determine the values of the ideals. For the positive criteria, equals the largest fuzzy number array, equals the smallest fuzzy number array, and vice versa for negative criteria. These relationships are given in the following equations:
Step 3—In this step, normalization for positive and negative criteria is done based on Equations (19) and (20).
Step 4—Determine the values of T and U. In this step, first, the normal matrix is weighted, and then, values are obtained using Equation (21).
where (as the fuzzy weighted plural) is related to the division ratio of Aj from the most suitable fuzzy value. Likewise, (as the fuzzy operator Max) signifies the division ratio of Aj from the worst fuzzy amount, and refers to the fuzzy weights of the j-th criterion, which can be obtained by the F-SE.
Step 5—Calculate the VIKOR index via Equation (22).
where , and v = (n−1/2n) is the maximum group utility. and are also the best values of T and U.
Step 6—Defuzzify , and , and then rank the alternatives with respect to the diffused values. The lowest values are in the first rank and the highest values are vice versa.
To choose the best alternative, the following conditions should be considered:
An alternative is the best once it has the lowest value of Y, provided that:
Condition 1—Acceptable superiority, as seen in Equation (23).
where is the alternative that has the second position in the ranking list of Y, DY = 1/ (n−1).
Condition 2—Standard consistency in the decision-making process
must be first placed in T and/or U.
If only one of these conditions is met, the collection of accommodation results is presented, which contains:
a—Alternatives and if only condition 1 is satisfied, or
b—Alternatives [,], if only condition 2 is met. Moreover, is determined by the relation for maximum m (of note, the rank of these alternatives is “in closeness”).
F-EDAS
The EDAS was extended by Keshavarz et al. [65] to evaluate and then rank alternatives according to the mediocre solution, which is often reached by the negative interval computation from average (NIA) and the positive interval from average (PIA). The candidate that has lower NIA and higher PIA values is thus the first-ranked RE alternative.
In the event of using the F-EDAS, alternatives are ranked under the subtractive amount of the defuzzified assessment grade. The F-EDAS can be also described by the following eight steps [51]:
Step 1—Create a TFDM as formerly described.
Step 2—Obtain the mean solution decision matrix according to the decision matrix:
Step 3—Determine the matrices for the fuzzy NIA (F-NIA) and fuzzy PIA (F-PIA) by Equations (25) and (26).
Step 4—Extend the matrices to fuzzy weighted positive and negative intervals, as indicated in Equation (27):
Step 5—Calculate fuzzy normalized values for FSP and FSN via Equation (28):
Step 6—Compute the fuzzy evaluation score using Equation (29):
Step 7—Eventually, rate the alternatives with regard to the FES subtractive value. The top option is the one with the maximum value on the assessment score.
F-ARAS
The ARAS was conceptualized and presented in 2010 by Zavadskas and Turskis [66]. This technique is characterized by determining performances according to ideal alternatives. In this method, it is argued that the degree of optimality is the ratio of the total score of normal and weighted criteria of the intended alternative to the normal and weighted criteria of the desired one. This proportion is represented by the alternative obtained in this comparison. Recently, its application range has been developed by the progress at the grey ARAS [67] and the F-ARAS [68], respectively, involving grey and fuzzy numbers for solving the MCDM problems.
Scoring and ranking using this method also includes the following steps [52]:
Step 1—Create a TFDM as formerly described in Equation (1)
Step 2—Extend the expanded FDM by adding an individual row with optimal values of each criterion considering Equation (30)
where the optimal value of the criterion is calculated as:
Step 3—Normalize the expanded FDM:
(a) The criteria, whose preferable amounts are maximum or minimum, are normalized via Equation (33).
Step 4—Form a weighted normalized decision matrix and the values of optimality function as below:
where describes the optimal performance value of alternative i. Considering the calculation process, is directly related to the value and the weight of the criteria. The center of area defuzzification approach can be also used as:
Step 5—Compute the value of the alternative utility degree as follows:
where Si and So are the optimal performance values of the alternatives. An alternative should be thus selected as the top one if it has the maximum amount of Ki.
3.2.3. Hybrid Fuzzy Decision-Making Method
The four scores of each alternative, named , , , and were obtained by the four mentioned fuzzy techniques under the descriptions of the previous subsections. After specifying these scores, they were normalized via Equation (37), and then, using Equation (38), the normalized scores were aggregated to determine the final score of each alternative, labeled . The alternative with the highest score will be accordingly ranked first.
Before the ranking process, it is needed to define suitable criteria for the related study area and determine their value for each alternative. Therefore, first, the criteria are defined, and their values are determined in the next section.
4. Study Area
North Khorasan Province, one of 31 provinces of Iran, was founded by the Greater Khorasan in 2004. It is located in the northeastern part of Iran (37.4761°N latitude and 57.3317°E longitude) with a population of roughly 0.8 million, placing the region at a ranking of 27th from a population point of view [29]. The capital of this province is the city of Bojnord, and Esfarayen, Shirvan, Ashkhaneh (Maneh and Samalqan), Faruj, Germeh, Raz, Jargalan, and Jajarm are other counties, as seen in Figure 3.
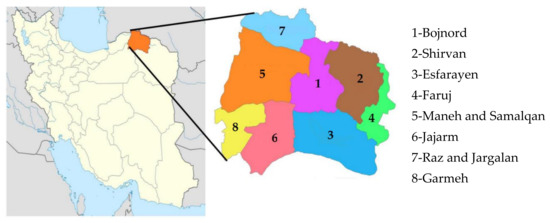
Figure 3.
North Khorasan Province and its affiliated cities located in northeastern Iran.
North Khorasan Province also contains numerous tourist attractions, divided into natural and historical ones, such as small lakes, Ayoub Peighambar hot spring, protected regions, many hiking areas, Salouk and Ghaisar old castles, Sari Gol protected area, Noshirvan, Armadloo, and Bidag caves, Belqeys castle, Baba-Aman spring, Mofakham historical house, Jameh Mosque of Jajarm, and Bazkhaneh valley.
Turkmenistan, as well as the Razavi Khorasan, Semanan, and Golestan provinces, neighbor North Khorasan Province from the north, east, southwest, and west, respectively.
Since North Khorasan province is ranked 30th in terms of national GDP by province [30], and 27th in respect of literacy rate [29], it is considered as one of the deprived regions. Therefore, one of the best ways to achieve sustainable development here is using RESs [69].
As mentioned in Phase 1, the proposed approach determines suitable RE candidates in the study area to avoid time wasting and to encourage investors to construct renewable power plants. These RE candidates were thus used in the current work. All of the alternative sites in North Khorasan Province are illustrated in Figure 4.
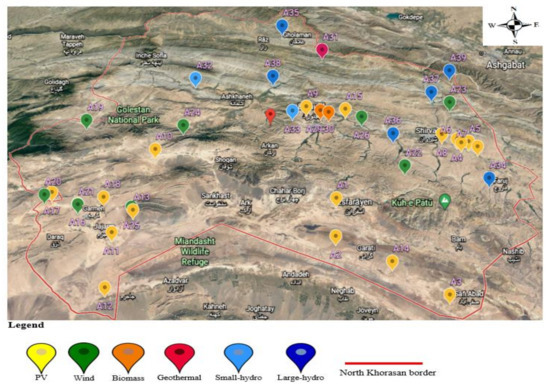
Figure 4.
All RE alternatives in North Khorasan Province in the current work [70].
5. Definition of Criteria and Constraints
Before ranking the RE alternatives in North Khorasan Province, a set of criteria and constraints should be identified, which are often common among RESs and affect the decision-making process. The spatial features of alternatives and expert opinions could also be exploited to determine these criteria and constraints.
5.1. Definition of Criteria
Based on the related literature, a set of thirty criteria in four dimensions have been so far applied for ranking RESs. Such criteria are categorized into two general types, viz. quantitative and qualitative, and divided into two categories in terms of their nature, i.e., cost criteria and benefit criteria. Table 2 describes these criteria.
Table 2.
The criteria recognized in this case study.
5.2. Qualitative and Quantitative Data Collection
After considering the suitable criteria for all alternatives, data collection was needed in the proportion of each alternative and its location. SATBA has also released reports in which there are estimated data for RE candidate in all provinces of Iran, such as power plant capacity, locations, as well as distances from roads and substations. This report for North Khorasan Province was thus used in this paper. As some data were not in the SATBA’s report, they were retrieved from the literature. The information about the quantitative criteria of the RE technologies and all alternatives were also extracted from [70].
In addition, other remaining criteria were explained and Figure 5, Figure 6 and Figure 7 show them for all alternatives in the study area.
5.2.1. Type of Land (C1)
The type of land is an important factor included in the RE siting analysis. Considering that the construction of renewable power plants on different types of land creates varying costs, and it is not possible to build them on all land, the purpose of classifying the rangelands in North Khorasan Province in this work was to prepare a land-use map.
The map could show how to use a piece of land (e.g., agricultural, residential, and forestry). Providing accurate information on land use is thus essential for any activity and planning at the geographic level of the study area, and remote sensing plays a key role in this respect. During classifications, each image pixel was compared to the natural symbols in the previous steps, and each group of pixels was assigned to one of the sampling classes. The results were a single-band image in which different types of land could be separated from each other in diverse categories. After obtaining the land use map of the study area, different land uses were scored by applying some constraints. The data related to the type of rangelands in North Khorasan Province were also taken from the North Khorasan Agricultural Jihad Organization, then a map related to the type of use was created with the help of the Arc-GIS software. Figure 5a displays the type of land map.
5.2.2. Slope of Land (C2)
The roughness and sloping of land is the criterion that can be evaluated in RE plant construction. If the terrain cannot satisfy the slope constraint, filling or digging operations can cause a delay in the completion time of a construction project and increase the costs. In addition, facilities must be built in a firm area. In this paper, the slope map of North Khorasan Province was provided from the Geological Survey and Mineral Exploration Organization of Iran. Figure 5b presents the land map slope.
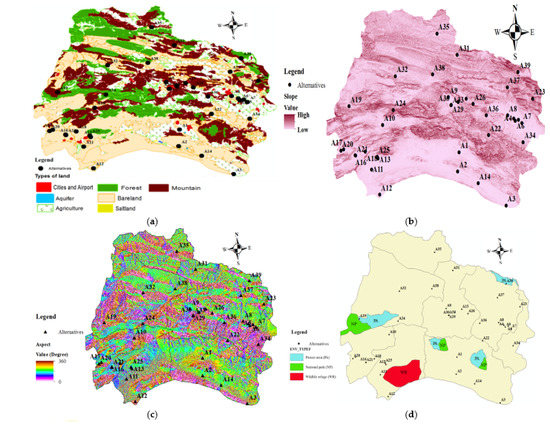
Figure 5.
Qualitative criteria related to C1, C2, C4, and C5 in the study area. (a) The type of land in North Khorasan Province, (b) The slope of land in North Khorasan Province, (c) The aspect of North Khorasan Province land, and (d) The distance of alternatives from special ecosystems.
5.2.3. Aspect of Land (C4)
The aspect plan is substantial in revealing slope directions. The aspect map is accordingly obtained from altitude maps as the representation of the territory topography. To create these maps, North Khorasan Province contours (from contour lines) were derived from the Geological Survey and Mineral Exploration Organization of Iran. Finally, the aspect map was made via a three-dimensional spatial modeling investigation of GIS. This factor could affect the energy potential, especially for solar and wind resources. The highest solar energy potential also occurred in the southern direction because of the most sunlight there. For wind energy, the southwest to the northeast direction, or vice versa, had the most potential. Considering hydropower, the aspect affected surface evaporation but not so much to produce a significant impact; therefore, this was excluded from the study. For other technologies not affected by the aspect factor, the highest score would be considered. Figure 5c shows the aspect of North Khorasan Province land.
5.2.4. Distance from Protected Area (C5)
The distance from protected areas is one of the paramount environmental indices for the establishment of RE plants. The RE plant field is also obligated not to damage the protected areas around itself; for this reason, constraints on land use must be imposed. Thus, the RE site area should be situated as far away as possible from surrounding protected areas. In this study, the data on the distance from protected areas were collected from the North Khorasan Department of Environment and added to the geologic database in a polygon model. Figure 5d depicts the distance of the alternatives from the protected areas.
5.2.5. Water Extraction Restrictions (C6)
In addition to the capacity and type of REs that might shape water consumption rates, the water potential of the study area was also considered in the water consumption criterion. During the last two decades, a crisis has also occurred in terms of water extraction and groundwater reserves following the establishment of the North Khorasan Province, human migration, and consequently, population growth in its various regions, as well as irregular and illegal water abstraction, entry or expansion of industries, reduced rainfall, and plains. Therefore, the North Khorasan Regional Water Company has classified the plains in terms of a water abstraction permit, as illustrated in Figure 6a. This classification directly affects water consumption rates along with the type and capacity of RE plants, so it was respected by the experts in scoring each alternative.
5.2.6. Distance from Flood Area (C7)
To prevent any irreparable water-overflow damage during a year in which flooding is high, regions with topmost water flush and high flooding risk should not be used. In this context, the zone classification map of North Khorasan Province in terms of flood risk was obtained from the North Khorasan Regional Water Company. Figure 6b displays the flood risk map.
5.2.7. Distance from Fault Lines (C10)
For the establishment of RE plants, zones with low-temblor hazards should be considered. Accordingly, the next criterion was the distance from fault lines. The data related to this criterion was acquired by digitizing the fault map nominated by the Geological Survey and Mineral Exploration Organization of Iran and then supplementing them in a polyline template into the geographic database. Figure 6c shows the location of fault lines and alternatives.
5.2.8. RES Potential (C15)
Solar Energy Potential
The amount of solar radiation indicates the regional potential for solar power generation, known as the paramount factor in locating solar power plants [73]. The amount of solar radiation in all regions in the world is different. Iran is also one of the countries, possessing a substantial level of solar radiation throughout its areas per year due to being located in the solar belt. In addition, the power received from sunlight is higher there because Iran is a mountainous country, and its many regions are located at an altitude of more than 1000 m above sea level [74].
North Khorasan Province, with more than 330 sunny days a year, mild weather, and a suitable temperature, is also one of the best regions in Iran for the construction of solar power plants. The SATBA’s Assessment Office of Renewable and Clean Resources has also presented solar power plant construction candidates for each province of Iran with high potentials for solar energy by reviewing the World Bank Atlas and applying various parameters [70]. These candidates for North Khorasan Province are named from A1 to A18, as depicted in Figure 6d.
Wind Energy Capacity
Recently, with the spread of cost-effective approaches and environmental perspectives in RESs, wind energy is more applied than others worldwide because of its advantages such as job opportunities, clean fuel source, sustainability, etc., [75]. Nevertheless, wind energy is not free from negative effects, including electromagnetic interference for radio signals in the range of large installations, noise pollution, and more [76].
Based on the above-mentioned advantages, and with regard to the challenges facing wind energy and using the probability density function developed by the Assessment Office of Renewable and Clean Resources, alternatives with good wind potentials have been so far presented in Iran, indicating good adaptation to wind speed data, especially in the wind turbine speed range [70]. Consequently, suitable spatial alternatives for wind farm construction in North Khorasan Province were raised. A19 to A26 in Figure 6e are the names of these candidates.
Hydropower Capacity
Hydropower plants are eco-friendly power plants used for many purposes due to their ease of operation, reasonable costs, flood control, water supply, electricity generation, effectiveness in maintaining the stability of the electricity network, and low maintenance charges. During the development and operation of hydropower plants, limited financial resources to invest in new power plants and long construction periods are the main challenges. Such plants also have two categories, large- and small-scale, so that the large plants consist of a dam on the main river to store water in a reservoir, and mini-hydro use of the run of a river to produce electricity [77].
Iran Water and Power Resources Development Company has also introduced the treatment plants of each city, dams, and rivers of provinces as sites with high hydropower potential and investment-ready projects nationwide [78]. Figure 6f shows the hydropower alternatives in North Khorasan Province, named A31 to A39.
Biomass Energy Capacity
Biomass is a renewable resource, consisting of biodegradable components of crop, agriculture, and forest wastes, as well as biodegradable industrial and municipal resources. The use of biomass energy is thus attractive not only for financial enrichment but also for economic and environmental development. On the other hand, it is considered as one of the major factors to achieve energy sustainability [79]. Furthermore, emissions from biomass combustion are usually lower compared with those of fossil fuels. Furthermore, their commercial use and exploitation can eliminate or reduce the problems associated with waste disposal in other industries, such as forestry, wood, and urban waste [80].
Today, various biomass technologies are also being used for electricity generation around the world, while only waste incineration and biogas plants produce electricity in Iran [80]. In this context, bioenergy accounts for about one percent of the capacity of renewable sources exploited to generate electricity [81]. The city of Bojnord with the largest population among those in North Khorasan Province produces 130 tons of waste per day, which is currently dumped in the mountain hills called Babamousa, near a village of the same name, which has caused many social and environmental problems [70]. The distance of this non-standard depot to the nearest road was about two and a half km and it was 2 km to the power grid. This waste could also produce approximately 800 KW (with landfill technology [70]) or approximately 1 MW (due to the high fraction of organic matter in the wastes), named A27 and A28 in the present work. On the other hand, water treatment plants in North Khorasan Province with a production of 1,678,716 m3 of sludge per year could produce 702 KW of electricity (A29). Other sources such as horticultural biomass, crop waste, and livestock waste were other sources of biomass production in this province [70], labeled A30 as another RE alternative.
Geothermal Energy Potential
Geothermal energy is the warmth inscribed under the earth’s surface. Despite the great potential for the use of this energy in Iran, a lack of macro policies on the application of RE, no appropriate technology in the field of deep drilling and reservoir engineering, and finally, the existence of low-cost sources of fossil fuels as strong competitors have caused geothermal energy not to be taken seriously [82].
The advantages of using geothermal energy in electricity generation also include cleanliness, low space and costs for power plant construction, adequate reliability, efficiency in bad weather, natural disasters or political tensions, renewability and permanence, currency savings, and contributions to the growth of developing countries. The disadvantage of a geothermal power plant is the pollution of its surroundings as the gases coming out of the ground pollute the air and result in sediments contaminating the earth [82].
In North Khorasan Province, there was only one geothermal site called Ayub Peighambar, located in the north of the city of Bojnord, with an area of roughly 680 m2 [83]. The water of this hot spring had healing properties due to its minerals, and for this purpose, locals and tourists were using it for balneotherapy. The main reason for high water temperature (about 40 °C) is the geothermal gradient, which puts the geothermal power plant in steam-heated water types [83]. This RES is named A31 in the present study.
5.2.9. Price of Land (C22)
The factors related to the costs of RE projects are one of the major subjects, which should be considered. One of these factors, affecting the costs incurred by the construction of RE plants, is the price of land in such a way that the cost of construction will be different if this factor is multiplied by land area as power plants with the same capacity may have various dimensions. In this regard, the relative price of land in North Khorasan Province was obtained via the Road and Urban Development Organization of North Khorasan, as illustrated in Figure 7a.
5.2.10. Unemployment and Literacy Criteria (C27 and C28)
RE plants can create job opportunities for the locals in terms of both non-technical and technical situations. RE technologies that promise more job occasions for local inhabitants are also preferable. In this regard, in addition to the capacity of RE technologies for job creation in this work, the unemployment and literacy rates in the statistics reported by the Management and Planning Organization of North Khorasan were considered because they could directly affect the government’s view for prioritizing projects. It should be noted that the above-mentioned rates, along with the job creation factor, could also affect the social acceptability criterion. Figure 7b,c show unemployment and literacy rates, respectively.
5.2.11. Distance from Residential District (C9 and C29)
Constructing RE plants inside or near a community could be restricted taking into account their CO2 and noise emissions, the high price of land in this area, and eventually, the developmental direction of inhabitable regions. However, the RE plants should be near residential areas because the energy needs and costs of such plants must be met. In this work, the map of the residential areas in Figure 7d was obtained via the Road and Urban Development Organization of North Khorasan Province.
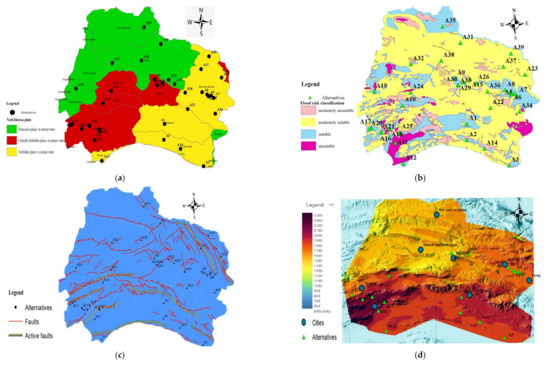
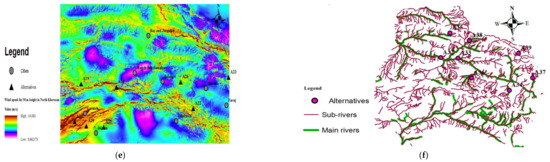
Figure 6.
Qualitative criteria related to C6, C7, C10, and C15 in North Khorasan Province. (a) The type of plains from water extraction point of view, (b) The distance of alternatives from flood area, (c) The location of fault lines and alternatives, (d) The photovoltaic alternatives and power output (kWh/kWp) [84], (e) The wind farm alternatives and speed for 50 m height [85], (f) The North Khorasan Province hydropower alternatives, sun, and main rivers.
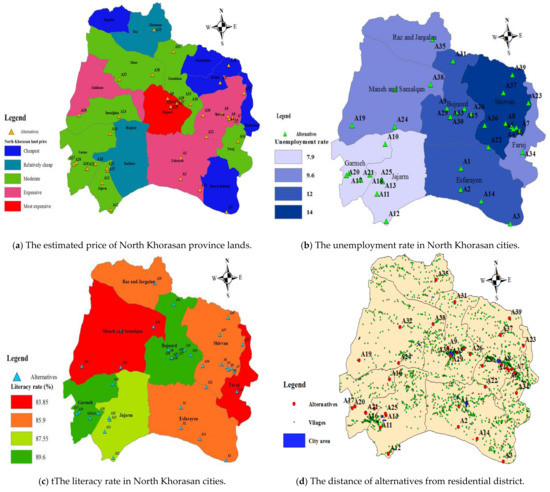
Figure 7.
Qualitative criteria related to C22, C27, C28, C9, and C29 in North Khorasan Province. (a) The estimated price of North Khorasan Province lands, (b) The unemployment rate in the cities affiliated to North Khorasan Province, (c) The literacy rate in the cities of North Khorasan Province, (d) The distance of alternatives from residential areas.
5.3. Definition of Constraints
Constraints indicate limitations and data considered on alternatives. They can be also used to evaluate alternatives (e.g., the distance from fault lines), considering the features and definite values, which can help experts form better judgments. Table 3 shows the constraints related to the criteria in this work.
Table 3.
Constraints related to the study area criteria.
6. Assessing Novel Decision-Making Framework for the Study Area
The results will be discussed in the subsequent subsections. The first part is the presentation of expert opinions based on previous-section data. The second part is also related to determining the weights of the criteria using the F-SE. In the third part, the scoring of the RE alternatives is done for North Khorasan Province based on the ARAS, VIKOR, EDAS, and MOORA in a fuzzy environment. Then, after the normalization of the obtained scores, their summation determines the highly suitable site for the study area. In addition, the results of the ranking are analyzed in this part. Eventually, the sensitivity analysis is provided according to different α-level values to establish the accuracy and reliability of the proposed model.
6.1. Expert Opinions
RES strategies are intrinsically subject to different ideas and viewpoints. This subjectivity, rooted in human decisions, can lead to an inequitable attitude in individual judgments, even for experts, as they might not have the essential knowledge regarding a problem. Dependence on an expert also poses individual risks because of personal preferences and limited experiences. Such risks can be dramatically decreased by considering more than one expert in the process. A group decision-making process also includes two or more experts with different roles (viz. industry, academic careers, etc.), who have the same interest and realize the common problem in attaining a collective and comprehensive decision. Group decision-making is mostly better for avoiding the subjectivity and prejudice of individual experts. Consequently, this study used a design and project management group (DMG), seen in Table 4.
Table 4.
The experts’ work inside the RE topic.
Upon finding an experienced and suitable DMG in the field of RES in North Khorasan Province, fundamentally based on each of the criteria, alternative location, and their constraints (Section 5.1, Section 5.2 and Section 5.3), the experts could judge and give their opinions for determining the weights of the criteria and ranking the alternatives. However, traditional quantification classifications could have a problem in logically expressing the situations that are excessively hard or complicated to describe, and consequently, linguistic attitude could contribute a practical way to describe such conditions. Providing evaluators with suitable linguistic variables to appraise the weight value of assessment criteria and judging the performance ratings of all alternatives due to each criterion were thus vital within the MCDM. Linguistic variables could be thus revealed by positive triangular fuzzy numbers.
In addition, experts could judge the alternatives due to their attitudes and alternative features. There were even large pieces of data for collecting expert opinions for each alternative and each criterion, so it was not suitable to put all of them in the current work as a table or tables. However, this study attempted to show the relevant data using a figure (Figure 8), indicating expert opinions so that each box is for one criterion, ensuring there is the number of expert opinions in each column while their summation is equal to the number of experts (8).
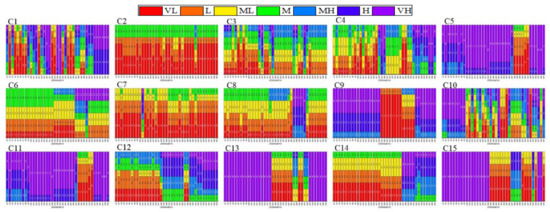
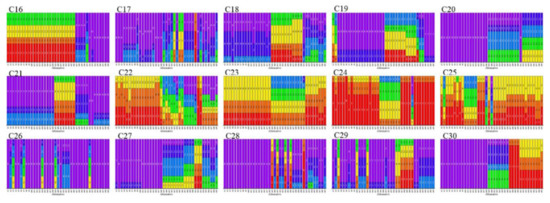
Figure 8.
The TFDM based on expert opinions.
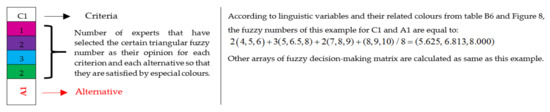
Figure 9.
The example of TFDM.
6.2. Weighting by the F-SE
After forming the FDM, its fuzzy data should be transferred into interval data. To do this, α is considered equal to 0.4. The interval decision matrix (IDM) is displayed in Figure 10.
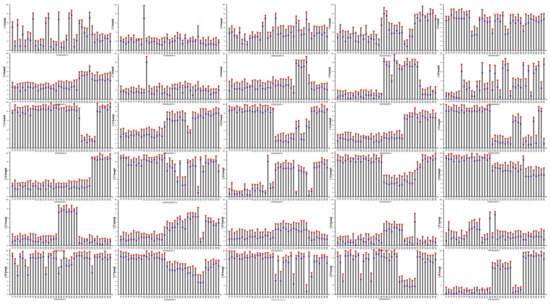
Figure 10.
IDM.
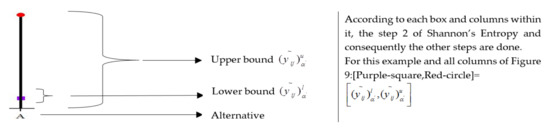
Figure 11.
The example of IDM.
Finally, after the completion of the steps of the F-SE based on the interval matrix (Figure 10), the interval weights and mean weights were calculated as listed in Table 5.
Table 5.
The interval and mean weights of the criteria (α = 0.4).
For this paper, the lower, upper, and mediocre values of the interval vector of each criterion were considered with the names , , and , respectively.
7. Results and Discussion
The weighting results revealed that C28 (namely, social acceptability) accompanied by C21 (NPC), C9 (noise pollution), C18 (construction time), and then C15 (energy potential) were the most important criteria based on the mean weight, and indirectly with reference to the experts’ interviews via the F-SE. These five criteria could cover approximately 44% of the entire evaluation weight. The analysis of the significance of high weight criteria can be enumerated as follows:
- When studies are performed on a local scale, all project aspects are more concerned with its social feedback. Various parameters such as literacy, unemployment, and accident-related fatality rates can also have an impact on the environment, specially protected areas, and water consumption in water-scarce communities and the acceptance or maturity of technologies are even among the factors that shape social acceptability; hence, the given criterion is related to other ones. As a result, according to expert opinions, and eventually, the results of the F-SE, this criterion gained the first rank.
- C21 had direct and indirect effects on all economic criteria, and it was one of the most important criteria for each project under construction and study. In addition, due to the fluctuations in the price of international currencies and the devaluation of the national currency for consecutive years in Iran, the construction time of the project (C18) could raise concerns among investors as it could directly affect the income and costs of each project.
- The criterion of noise pollution (C9) was considered at the high position because the location of most of the studied alternatives was in densely populated areas, which had a direct impact on the social welfare of those areas.
- As mentioned in Section 2, some alternatives had high potentials in North Khorasan Province, while others did not. Besides, from a local point of view, due to the definite space, there are attempts to prioritize renewable plants, which have a high production capacity, but at the same time, occupy less physical space. This issue is directly related to the potential of REs in that area. It is for this reason that C15 (energy potential) gained the fifth rank among 30 criteria.
By determining the fuzzy weights of each criterion for the alternatives, the data were obtained using the MOORA, VIKOR, EDAS, and ARAS in a fuzzy environment. Next, the scores and ranks of the alternatives were accomplished by the combination of these ranking techniques with the F-SE. After specifying all scores, they were normalized. Thereafter, the normalized scores were aggregated to determine the ultimate score of any alternative. Figure 12 depicts the final scores of the novel framework and each technique for all alternatives.
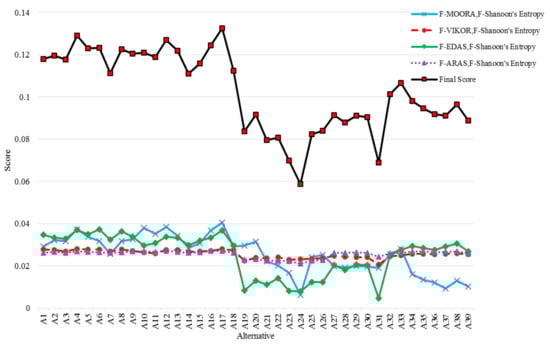
Figure 12.
The normalized and final scores of alternatives.
Table 6 presents the final ranking of the alternatives based on the final scores, illustrated in Figure 12. The color of the alternative rows shows the technologies henceforth yellow, green, orange, brown, pale blue, and dark blue, which stand for solar, wind, biomass, geothermal, small-, and large-scale hydropower technologies, respectively. The purple cell also denotes the best alternative, which is for A17. According to the results, all the alternatives related to solar technology are at the top of the ranking followed by small and large hydropower alternatives.
Table 6.
The final ranking of alternatives.
To calculate the score of the technologies separately from their number of candidates, firstly, the ultimate scores of their alternatives were aggregated for each technology. Next, the entire score of the technologies was discretized into the number of their alternatives individually. At last, the computed ones were distributed in their aggregates to normalize the scores.
There is clear evidence that solar technology is the best technology with the maximum score (0.217), small hydropower arrives in second place (0.187), and large hydropower and biomass energy are taking the third and fourth ranks with nearby scores. Lastly, wind and geothermal technologies ranked bottommost. Given that all the alternatives of each technology are in almost the same ranking range, the results of each technology will be analyzed as follows.
7.1. Discussing the Obtained Results
7.1.1. Solar Technology Alternatives
The top ranking of solar candidates and, consequently, the rank of this technology was expected because the solar resource is the best known for the country, experts, and the public. Moreover, numerous home, commercial, and government solar projects in the study area are currently in operation. According to expert opinions and the weight determined for each criterion, the superiority of solar technology over others can be seen. More precisely, C28 (social acceptability), C21 (NPC), C9 (noise pollution), C18 (construction time), and then, C15 (energy potential) gained the highest weights (about 44% of the total). These top-ranked criteria were related to the type of technologies and their scores were almost the same for the alternatives of each technology. Consequently, as depicted in Figure 8, they have the highest scores for solar alternatives, showing why solar candidates are superior. In the following paragraph, an expert opinion and his comparison between three top-ranked alternatives are analyzed.
In this technology and the entire ranking procedure, A17, A4, and A12 are the first three alternatives with 0.1325, 0.1291, and 0.1269 scores, respectively. Here, in addition to the criteria, their constraints, which affect expert opinions and calculations, are compared with each other to clarify why these three candidates are at the top of the ranking list. To avoid over-increasing the paper, only the analysis for these three alternatives is performed. Based on C15, A17 is in a better situation among the top-ranked alternatives because solar energy potential in these alternatives is at a high level and its score is ten according to the C15 constraint, while A4 and A12 are in medium solar potential and their score is between 3 and 7. Based on C1, A17 is in a better condition again because, as shown in Figure 5a, it has been located in bare land (its score based on the constraint table is VH) but A4 and A12 are located in suburban agricultural land (its score range is VL) and poor range land (its score range is MH-VH), respectively. For C10, the condition of A4 is better than A17 and A12. It also gets a high score due to Figure 6c because its place is at a safe distance from fault lines. The aspect criterion (C4) for A17, A12, and A4 is south (its score range is VH), southeast (its score range is MH-VH), and east (its score is M-MH), respectively. Distance from the substation (C25) is also 1.5, 20, and 100 km for A4, A12, and A17, respectively; therefore, A4 score range is VH while that of A12 and A17 is M and VL-L in that order. C29 and its constraints additionally show that A17 gets the perfect score while A12 and A4 reach 4 and 0. The project safety from flood criterion (C7) is important, which is great for A17 and A4, while A12 is not good. The generation capacity of the plant (C11) is also in a suitable range for A17 and A12; however, it is in the medium range for A4, so A17 and A12 get the highest score, while A4 gets the medium value. Although the technology of these alternatives is the same for C6, their scores vary because of their location. As can be seen in Figure 6a, A4 and A12 are in forbidden plains, while A17 is in a critical plain from a water extraction point of view; therefore, the score of water consumption criteria for A4 and A12 is better than A17. The maximum land use criterion (C3) for A17 and A12 is also 300 hectares while it is equal to 90 hectares for A4. At the first glance, because of the area needed for the construction, it turns out that the land cost for A12 and A17 is higher than A4; however, since A4 is located in the suburbs of the city of Shirvan, the land price in its area is much higher than A12 and A17. Although A4 could outperform in this criterion, it did not have the necessary efficiency in practice to put it in a higher rank. C27 is also related to job creation, which depends on various parameters such as the capacity of the power plant, the literacy status in the area, as well as the local unemployment rate. Besides, A12 and A17 are in a better situation than A4 in terms of the capacity of the power plant and literacy rate. However, the high unemployment rate in A4 has increased the incentive to build a power plant, putting the status of this alternative in a more favorable position than other alternatives for C27.
According to the above analysis, there is a significant point, viz. the difference in the ranking of the alternatives located in the same region of the study area, which shows the efficiency of the model presented in this study in addition to determining the importance of selecting the criteria, constraints, as well as the weights and scores for each alternative.
7.1.2. Small- and Large-Scale Hydropower Alternatives
Small and large hydropower technologies gained second and third places in the final ranking. The most negative feature of these technologies is the long-term construction time, which causes an increase in the payback period; however, in this study, all the facilities of the related alternatives had been built so that negative features were resolved before the ranking process. As a result of this, land use and the type of land criteria for these types of alternatives have high scores in comparison with other technologies. In addition, large- and small-scale hydropower technologies are often located far away from the population center, so the noise pollution criterion for these technologies is in a good condition. Moreover, the best features of these technologies are low NPC, low operation and maintenance (O&M) cost, and good flexibility, which have high weights in the list of the criteria, so they are put in the second and third rankings.
The main reason for the superiority of small scale over large scale is that the primary purpose of large dams in this area is agricultural irrigation, so this type of hydropower has less social acceptability. Moreover, the water purification system is constantly working and can generate electricity in a continuous manner. Likewise, the guaranteed purchase price of electricity on a small scale is higher than that on a large one. Considering large dams, Shirin-Dareh and Barzo, located in the same name areas, are suitable after small-scale alternatives because the amount of rainfall in the given areas is better than others (that is, higher energy potential) and they are the largest dams in the study area, as well. Consequently, they can be used as sources to compensate for power fluctuations and provide spinning and regulation reserves.
7.1.3. Biomass Alternatives
As mentioned in Section 5.2.8 and Biomass Energy Capacity, one of the problems not only in the study area but also in Iran, is landfills and waste recycling. Due to the unsuitable location for landfilling, significant environmental and social challenges have thus arisen in the cities of North Khorasan Province. In addition to the urban sector, agricultural and industrial wastes have also intensified this challenge. Therefore, this has caused a very high impact on local experts, so the second high score of social acceptability criterion has been assigned to it after solar technology. It is also second only to hydropower technology in the NPC, and the government has encouraged investors to meet the above-mentioned challenges by considering the second affordable price for a guaranteed purchase of electricity from this system. Furthermore, easy access to power plant resources and locations, a short distance from the substations, and a shorter construction time, are other advantages of this technology, which puts it in the fourth place. The negative features of this technology, such as CO2 emissions, short-term useful life, high maintenance costs, and low capacity are also the factors that have made this technology, not to be ranked higher.
Among the alternatives of this technology, A27 and A28 are ahead of the others because the technology maturity and the concentration of its resources in one location (i.e., availability and energy potential) are higher.
7.1.4. Wind Technology Alternatives
This technology, despite being highly popular among REs, is the one rank before the last in the present study area. The main reason is that most of these technology alternatives are located near residential areas or around protected ones, which have low social acceptability and high construction costs due to technical characteristics such as noise pollution and high lands required for their construction. Moreover, SATBA has classified the wind alternatives based on the classification of the United States Department of Energy, so most of them are in the first class (namely, poor). This class is not suitable for the construction of a wind farm compared with other parts of the country because of low energy potential and minimal accessibility due to high uncertainty.
A24, as one of the alternatives of this technology, is the worst in the final ranking. The A24 location is also next to Golestan National Park, causing the lowest score for social acceptability among all alternatives. In addition, this region has inadequate geographic features for constructing power plants because, in addition to the inappropriate land-use type (i.e., forests), it has a steep slope and unsuitable aspects, leading to more time consumption and high costs of construction. Moreover, there is wildlife in this park; therefore, constructing a wind farm is not optimal because of the noisy nature of wind technology.
On the other hand, among the alternatives of this technology, A20 has been able to obtain a good rank because of the high potential of wind energy at that location, a perfect distance from urban and protected areas, and the appropriate type of land use for the construction of this power plant. The special point explained here is that A20 is next to the best alternative of the final ranking (viz. A17), while its rating is not better than A25. Therefore, it reveals the importance of selecting the criteria and defining the appropriate constraints for such studies in addition to showing the great performance of the proposed model. Accordingly, these two alternatives (namely, A20 and A17) can be introduced together as a suitable hybrid RE system.
7.1.5. Geothermal Alternatives
The ranking of this technology was expected. In general, the maturity of this technology is very low in Iran so that the first geothermal power plant in the best geographic region will be operationalized around 2022. The low technology maturity criterion unquestionably causes the provision of equipment to be done through imports, which increases the construction time of the power plant and imposes a significant cost in the construction of geothermal projects due to the devaluation of Iran’s national currency compared with its’ international counterparts (i.e., euros and dollars). Furthermore, the proximity of this location to the village and its type of land use (namely, agriculture, housing, and tourism), in addition to creating environmental hazards caused by harmful GHG emissions, also multiplies the costs of land supply. This area and its hot spring are one of the tourist and religious attractions for locals and tourists, especially since people believe that such a spring belongs to Ayoub the Prophet, so the construction of a power plant at this location would receive minimal social acceptability.
7.2. City Ranking
Each alternative was located in a city, although the allocation of government funds is different. Therefore, it is necessary to find out how the budget should be dedicated to the RE sector for the cities of this province. In this paper, a new scheme was presented to prioritize the cities based on their candidacy for investment. The ultimate scores of the alternatives in each city were thus summed up. Later, the whole score of each city was discretized into the number of its alternatives. Eventually, the measured scores were divided into their summation to normalize them. Figure 13 depicts these scores.
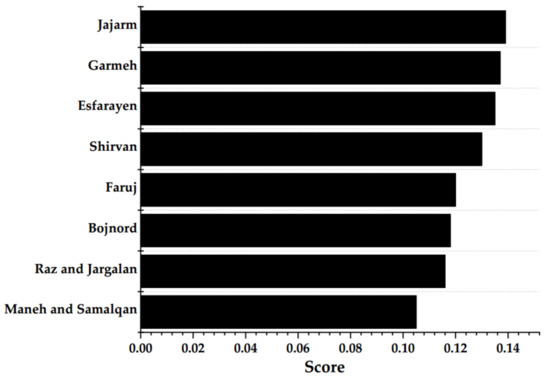
Figure 13.
The scores of the cities affiliated to North Khorasan Province.
As indicated in Figure 13, the southern cities of the study area (namely, Jajarm, Garmeh, and Esfarayen) have the top three scores among the cities in this province.
7.3. Sensitivity Analysis
In the research process, alpha to selection was significantly correlated with the ranking of the alternatives when using the SE so that the same results were obtained with different alphas, indicating that the decision-making framework had robustness and reliability. Therefore, in the first part, sensitivity analysis was performed on different values of α-cut to test the strength and reliability of the proposed method.
While using the SE, sensitivity analysis aimed to test its strength and reliability. The ranking results were also the same or close to each other, showing that the decision-making method was strong. On the other hand, the alpha to selection was directly related to the decision-makers’ tastes so that higher alpha suggested strict accuracy, while lower alpha meant higher confidence in the results. In other words, the risk-averse decision-maker selected higher alpha because of their unwillingness towards uncertainty, while the decision-maker who opted for lower alpha was risk-averse. Therefore, sensitivity analysis was performed to test the robustness of the ranking obtained, considering the four levels of α-cut (namely, 0.1, 0.4, 0.7, and 0.9). The final ranking of the alternatives for these four levels can be seen in Table 7.
Table 7.
The final alternative ranking based on different sets.
The results in Table 7 show that the proposed model has a fine balance between accuracy and reliability and even possesses good robustness because it has resulted in almost the same ranking in all of the four levels that have been analyzed.
8. Conclusions
With the increasing purposefulness in the RES development through the fulfillment of the UN’s SDGs, the promotion of their advancement process has become a major focus in the decision-making process not only internationally, but also in different parts of a nation. This promotion includes identifying the suitable areas of RE technologies, to the operation stage of an RE project to generate electricity. In this regard, the purpose of this study was to present a comprehensive decision-making framework to enable governments and experts to identify the high potential RE locations for constructing RE power plants and achieving SDGs at the sub-national level. Therefore, this framework consisted of two phases. In the first phase, the new SATBA’s approach was used, in which this organization, in cooperation with the study area’s organizations, has created a mixed database of RESs based on the information obtained from field-statistical work in technical, socioeconomic, and environmental dimensions. Finally, in this approach, all the data had been entered into the GIS software and the high potential RE alternatives were identified. For the current work, North Khorasan Province of Iran was selected as the study area.
In the second phase, using the novel model based on expert opinions, the local high potential RE alternatives were ranked. In this regard, this new model was composed of both hybrid and fuzzy states to solve the problems in which there were uncertainty, imprecise data, different expert opinions, and multi-dimensions, including geographical, socioeconomic, technical, and environmental ones. Therefore, in this novel model, first, the TFDM needed for weighting and ranking techniques was created via a series of interviews with eight experts, considering 30 criteria as well as the related constraints. Next, the F-SE was used for calculating the weights of all criteria, and the F-MOORA, F-VIKOR, F-EDAS, and F-ARAS techniques were employed to score all alternatives.
Among 30 criteria, 20 cases were extracted via Phase 1 results, and the rest were retrieved from the literature. Moreover, the accuracy and reliability of the proposed two-phase framework were evaluated by performing a sensitivity analysis based on different α-level values. Eventually, the findings of the proposed two-phase decision-making framework to achieve the SDGs in North Khorasan Province at the sub-national level were as follows:
- The results of Phase I of this framework introduced high potential RE candidates for each RES, useful and applicable information such as estimated capacity, distance from substations and transmission lines, the type of land and area required for power plant construction, and the distance from residential areas for investors and experts working in this field. This approach had some advantages in terms of saving time and money when identifying RE candidates and gathering information. Therefore, this approach could help achieve the country’s RE development goals following the accelerated RE project implementation, and consequently, meet the UN’s SDGs related to RE. Therefore, it was introduced as a new sub-national approach to other countries, planners, and policies.
- The results of determining the weights of the criteria revealed that social acceptability (C28), NPC as the economic criterion (C21), the environmental criterion of noise pollution (C9), and the technical criterion of construction time (C18) and resource potential (C15) were the most important ones in the present study so that 44% of the total weight was dedicated to them. This weighting also showed that the criteria were indirectly related, and they could affect each other because the relationships among the criteria were also considered in the interviews with experts.
- Because of the sanctions imposed on Iran and the problems facing the import of modern technologies, the technical criteria of the alternatives with the same technology were almost equal and had insignificant variety. The only noteworthy criteria, making the different alternatives of the same type, were the resource potential and other criteria related to the location such as the distance from the road. On the other hand, the high weights were dedicated to the criteria, common among the alternatives of the same technology. Therefore, in the overall ranking, almost all alternatives of the same technology obtained the ranks next to each other so that they were classified based on their technology. In this classification, solar technology came in the first rank with a score of 0.218 and small- (0.187) and large-scale hydropower (0.168), biomass (0.162), and finally, wind (0.141) and geothermal (0.124) alternatives were put in the subsequent ranks, respectively.
- The RE candidates were scattered in the study area, which belonged to the political geography of the city. Therefore, it was necessary to do the urban ranking because if government funds were allocated to that area, the priority of the project would be considered. Consequently, at the end of the decision-making phase, based on the scores of the RE candidates located within a city, the cities were ranked. In this ranking, Jajarm, Garmeh, Esfarayen, Shirvan, Faruj, Bojnord, Ashkhaneh (Maneh and Samalqan), Raz, and Jargalan were ranked from first to eighth with the scores of 0.139, 0.137, 0.135, 0.13, 0.12, 0.118, 0.116, and 0.105, respectively.
- The novel two-phase decision-making framework consisted of a practical approach as well as a new mathematical model. In this regard, first, the results of this framework were compared with a real project. The city of Jajarm and solar technology also gained the first rank among other cities and technologies. Second, sensitivity analysis was performed based on different levels of α-cut, suggesting a range of decision-makers’ tastes from risk aversion to risk-taking. The results of the sensitivity analysis also indicated that the mathematical model possessed good robustness and was able to strike a good balance between accuracy and reliability so that it could satisfy a wide range of experts with different opinions and tastes.
Other criteria could also be added to make the model more realistic and practical, such as local policies, return on investment, innovation, and reliability. For future research, it is accordingly suggested to use similar work with the proposed criteria, and to evaluate other regions at a sub-national level using the framework presented here.
Author Contributions
Conceptualization, M.R., H.K., A.M., K.T., K.A. and H.A.X.; methodology, M.R., H.K., H.A.X., A.M. and J.S.; software, M.R., A.M., J.S. and K.T.; validation, M.R., H.K. and H.A.X.; formal analysis, H.K.; investigation, M.R., A.M., J.S. and K.T.; resources, M.R. and A.M.; data curation, M.R., A.M., K.A., J.S., H.A.X. and K.T.; writing—original draft preparation, M.R., H.A.X., J.S. and A.M.; writing—review and editing, M.R., A.M. and K.T.; visualization, M.R. and K.A.; supervision, A.M.; project administration, K.T.; funding acquisition, K.T. All authors have read and agreed to the published version of the manuscript.
Funding
This research was supported by Prince of Songkla University from grant number ENV6402012N.
Institutional Review Board Statement
Not applicable.
Informed Consent Statement
Not applicable.
Data Availability Statement
Data will be available upon request.
Acknowledgments
The authors would like to thank the editor and the anonymous reviewers, whose insightful comments and constructive suggestions helped us to significantly improve the quality of this paper.
Conflicts of Interest
The authors declare no conflict of interest.
Nomenclature
| GDP | Gross domestic product |
| TFDM | trigonometric fuzzy decision-making matrix |
| AORCR | Assessment Office of Renewable and Clean Resources of SATBA |
| Ref. | References |
| VL | Very low |
| L | Low |
| ML | Medium low |
| M | Medium |
| H | High |
| MH | Medium high |
| VH | Very high |
| F- | Indicates fuzzy state |
| i | Indicates alternative i-th |
| j | Indicates criterion j-th |
| m | The number of alternatives |
| n | The number of criteria |
| trigonometric fuzzy decision-making matrix | |
| The value of interval variable for alternative i and criterion j | |
| Sa | The overall score indicator in ARAS method |
| FSi | The final score of decision-making framework |
| L | Lower bound |
| U | Upper bound |
| M | Middle of the fuzzy values |
| the lower bound of the interval weight of a criterion | |
| The upper bound of the interval weight of a criterion. | |
| The middle value of the interval weight of a criterion. | |
| Sm | The overall score indicator in MOORA method |
| Sv | The overall score indicator in VIKOR method |
| Se | The overall score indicator in EDAS method |
References
- Johnston, R.B. Transforming Our World: The 2030 Agenda for Sustainable Development. 2016. Available online: https://www.semanticscholar.org/paper/Arsenic-and-the-2030-Agenda-for-Sustainable-Johnston/ce835c47d4eb12b1764b61a83d0b16182e933c3b (accessed on 18 November 2021).
- United Nations. Affordable and Clean Energy. 2019, pp. 17–34. Available online: https://www.un-ilibrary.org/content/books/9789210476003c007 (accessed on 18 November 2021).
- McCollum, D.; Echeverri, L.G.; Riahi, K.; Parkinson, S. SDG 7 Ensure Access to Reliable, Sustainable and Morden Energy. n.d. Available online: http://pure.iiasa.ac.at/id/eprint/14621/ (accessed on 18 November 2021).
- Ebrahimi, M.; Rahmani, D. A five-dimensional approach to sustainability for prioritizing energy production systems using a revised GRA method: A case study. Renew. Energy 2019, 135, 345–354. [Google Scholar] [CrossRef]
- Colak, E.H.; Memisoglu, T.; Gercek, Y. Optimal site selection for solar photovoltaic (PV) power plants using GIS and AHP: A case study of Malatya Province, Turkey. Renew. Energy 2020, 149, 565–576. [Google Scholar] [CrossRef]
- Owusu, P.A.; Asumadu-Sarkodie, S. A review of renewable energy sources, sustainability issues and climate change mitigation. Cogent Eng. 2016, 3. [Google Scholar] [CrossRef]
- Sánchez-Lozano, J.; García-Cascales, M.; Lamata, M. GIS-based onshore wind farm site selection using fuzzy multi-criteria decision making methods. Evaluating the case of Southeastern Spain. Appl. Energy 2016, 171, 86–102. [Google Scholar] [CrossRef]
- Wu, Y.; Zhang, T.; Xu, C.; Zhang, B.; Li, L.; Ke, Y.; Yan, Y.; Xu, R. Optimal location selection for offshore wind-PV-seawater pumped storage power plant using a hybrid MCDM approach: A two-stage framework. Energy Convers. Manag. 2019, 199, 112066. [Google Scholar] [CrossRef]
- Baruah, A.; Basu, M.; Amuley, D. Modeling of an autonomous hybrid renewable energy system for electrification of a township: A case study for Sikkim, India. Renew. Sustain. Energy Rev. 2020, 135, 110158. [Google Scholar] [CrossRef]
- Roddis, P.; Roelich, K.; Tran, K.; Carver, S.; Dallimer, M.; Ziv, G. What shapes community acceptance of large-scale solar farms? A case study of the UK’s first ‘nationally significant’ solar farm. Sol. Energy 2020, 209, 235–244. [Google Scholar] [CrossRef]
- Wang, Q.; Yang, X. Investigating the sustainability of renewable energy—An empirical analysis of European Union countries using a hybrid of projection pursuit fuzzy clustering model and accelerated genetic algorithm based on real coding. J. Clean. Prod. 2020, 268, 121940. [Google Scholar] [CrossRef]
- Wang, Y.; Xu, L.; Solangi, Y.A. Strategic renewable energy resources selection for Pakistan: Based on SWOT-Fuzzy AHP approach. Sustain. Cities Soc. 2019, 52, 101861. [Google Scholar] [CrossRef]
- Kong, Y.; Feng, C.; Yang, J. How does China manage its energy market? A perspective of policy evolution. Energy Policy 2020, 147, 111898. [Google Scholar] [CrossRef]
- De Laurentis, C. Mediating the form and direction of regional sustainable development: The role of the state in renewable energy deployment in selected regions. Eur. Urban. Reg. Stud. 2020, 27, 303–317. [Google Scholar] [CrossRef]
- Bernath, C.; Deac, G.; Sensfuß, F. Impact of sector coupling on the market value of renewable energies—A model-based scenario analysis. Appl. Energy 2020, 281, 115985. [Google Scholar] [CrossRef]
- Zwickl-Bernhard, S.; Auer, H. Open-source modeling of a low-carbon urban neighborhood with high shares of local renewable generation. Appl. Energy 2020, 282, 116166. [Google Scholar] [CrossRef]
- Di Gregorio, M.; Fatorelli, L.; Paavola, J.; Locatelli, B.; Pramova, E.; Nurrochmat, D.R.; May, P.H.; Brockhaus, M.; Sari, I.M.; Kusumadewi, S.D. Multi-level governance and power in climate change policy networks. Glob. Environ. Chang. 2019, 54, 64–77. [Google Scholar] [CrossRef]
- Mrówczyńska, M.; Skiba, M.; Sztubecka, M.; Bazan-Krzywoszańska, A.; Kazak, J.; Gajownik, P. Scenarios as a tool supporting decisions in urban energy policy: The analysis using fuzzy logic, multi-criteria analysis and GIS tools. Renew. Sustain. Energy Rev. 2021, 137, 110598. [Google Scholar] [CrossRef]
- Guler, E.; Kandemir, S.Y.; Acikkalp, E.; Ahmad, M.H. Evaluation of sustainable energy performance for OECD countries. Energy Sources Part. B: Econ. Plan. Policy 2021, 16, 1–24. [Google Scholar] [CrossRef]
- Duran, A.S.; Sahinyazan, F.G. An analysis of renewable mini-grid projects for rural electrification. Socio-Econ. Plan. Sci. 2020, 77, 100999. [Google Scholar] [CrossRef]
- Brummer, V.; Herbes, C.; Gericke, N. Conflict handling in Renewable Energy Cooperatives (RECs): Organizational effects and member well-being. Ann. Public Cooperative Econ. 2017, 88, 179–202. [Google Scholar] [CrossRef]
- de Santoli, L.; Mancini, F.; Garcia, D.A. A GIS-based model to assess electric energy consumptions and usable renewable energy potential in Lazio region at municipality scale. Sustain. Cities Soc. 2019, 46. [Google Scholar] [CrossRef] [Green Version]
- Hosseini, S.M.; Saifoddin, A.; Shirmohammadi, R.; Aslani, A. Forecasting of CO2 emissions in Iran based on time series and regression analysis. Energy Rep. 2019, 5, 619–631. [Google Scholar] [CrossRef]
- Nikzad, A.; Chahartaghi, M.; Ahmadi, M.H. Technical, economic, and environmental modeling of solar water pump for irrigation of rice in Mazandaran province in Iran: A case study. J. Clean. Prod. 2019, 239, 118007. [Google Scholar] [CrossRef]
- Eshraghi, H.; Maleki, A. Reshaping energy policy for sustainable development: Curbing Iran’s carbon emission monster via renewable energies. Energy Sources Part. B: Econ. Plan. Policy 2016, 11, 830–840. [Google Scholar] [CrossRef]
- Mirzaei, M.; Bekri, M. Energy consumption and CO2 emissions in Iran, 2025. Environ. Res. 2017, 154, 345–351. [Google Scholar] [CrossRef] [PubMed]
- SATBA. Statistics of RE Power Plants. SATBA; n.d. Available online: http://www.satba.gov.ir/en/statistics-STATISTICS (accessed on 12 September 2021).
- Mousavi-Nasab, S.H.; Sotoudeh-Anvari, A. An extension of best-worst method with D numbers: Application in evaluation of renewable energy resources. Sustain. Energy Technol. Assess. 2020, 40, 100771. [Google Scholar] [CrossRef]
- North-Khorasan Province. n.d. Available online: https://en.wikipedia.org/wiki/North_Khorasan_Province (accessed on 3 November 2021).
- North Khorasan GDP. n.d. Available online: https://en.wikipedia.org/wiki/Provinces_of_Iran (accessed on 11 November 2021).
- Kizielewicz, B.; Wątróbski, J.; Sałabun, W. Identification of relevant criteria set in the mcda process-wind farm location case study. Energies 2020, 13, 6548. [Google Scholar] [CrossRef]
- Bączkiewicz, A.; Kizielewicz, B.; Shekhovtsov, A.; Yelmikheiev, M.; Kozlov, V.; Sałabun, W. Comparative analysis of solar panels with determination of local significance levels of criteria using the mcdm methods resistant to the rank reversal phenomenon. Energies 2021, 14, 5727. [Google Scholar] [CrossRef]
- Sitorus, F.; Brito-Parada, P.R. A multiple criteria decision making method to weight the sustainability criteria of renewable energy technologies under uncertainty. Renew. Sustain. Energy Rev. 2020, 127, 109891. [Google Scholar] [CrossRef]
- Deveci, K.; Cin, R.; Kağızman, A. A modified interval valued intuitionistic fuzzy CODAS method and its application to multi-criteria selection among renewable energy alternatives in Turkey. Appl. Soft Comput. 2020, 96, 106660. [Google Scholar] [CrossRef]
- Niu, D.; Zhen, H.; Yu, M.; Wang, K.; Sun, L.; Xu, X. Prioritization of renewable energy alternatives for China by using a hybrid FMCDM methodology with uncertain information. Sustainability 2020, 12, 4649. [Google Scholar] [CrossRef]
- Vakilabadi, M.A.; Bidi, M.; Najafi, A.F.; Ahmadi, M.H. Energy, exergy analysis and performance evaluation of a vacuum evaporator for solar thermal power plant zero liquid discharge systems. J. Therm. Anal. Calorim. 2020, 139, 1275–1290. [Google Scholar] [CrossRef]
- Aramesh, M.; Pourfayaz, F.; Haghir, M.; Kasaeian, A.; Ahmadi, M.H. Investigating the effect of using nanofluids on the performance of a double-effect absorption refrigeration cycle combined with a solar collector. Proc. Inst. Mech. Eng. Part. A J. Power Energy 2020, 234, 981–993. [Google Scholar] [CrossRef]
- Ghasempour, R.; Nazari, M.A.; Ebrahimi, M.; Ahmadi, M.H.; Hadiyanto, H. Multi-criteria decision making (MCDM) approach for selecting solar plants site and technology: A review. Int. J. Renew. Energy Dev. 2019, 8, 15–25. [Google Scholar] [CrossRef] [Green Version]
- Alizadeh, H.; Ghasempour, R.; Shafii, M.B.; Ahmadi, M.H.; Yan, W.-M.; Nazari, M.A. Numerical simulation of PV cooling by using single turn pulsating heat pipe. Int. J. Heat Mass Transf. 2018, 127, 203–208. [Google Scholar] [CrossRef]
- Solangi, Y.A.; Longsheng, C.; Shah, S.A.A.; AlSanad, A.; Ahmad, M.; Akbar, M.A.; Gumaei, A.; Ali, S. Analyzing renewable energy sources of a developing country for sustainable development: An integrated fuzzy based-decision methodology. Processes 2020, 8, 825. [Google Scholar] [CrossRef]
- Karimi, H.; Sadeghi-Dastaki, M.; Javan, M. A fully fuzzy best–worst multi attribute decision making method with triangular fuzzy number: A case study of maintenance assessment in the hospitals. Appl. Soft Comput. 2020, 86, 105882. [Google Scholar] [CrossRef]
- Riaz, M.; Sałabun, W.; Farid, H.M.A.; Ali, N.; Wątróbski, J. A robust q-rung orthopair fuzzy information aggregation using einstein operations with application to sustainable energy planning decision management. Energies 2020, 13, 2155. [Google Scholar] [CrossRef]
- Sitorus, F.; Cilliers, J.J.; Brito-Parada, P.R. An integrated constrained fuzzy stochastic analytic hierarchy process method with application to the choice problem. Expert Syst. Appl. 2019, 138, 112822. [Google Scholar] [CrossRef]
- Naicker, P.; Thopil, G.A. A framework for sustainable utility scale renewable energy selection in South Africa. J. Clean. Prod. 2019, 224, 637–650. [Google Scholar] [CrossRef]
- Li, T.; Li, A.; Guo, X. The sustainable development-oriented development and utilization of renewable energy industry—A comprehensive analysis of MCDM methods. Energy 2020, 212, 118694. [Google Scholar] [CrossRef]
- Zavadskas, E.K.; Govindan, K.; Antucheviciene, J.; Turskis, Z. Hybrid multiple criteria decision-making methods: A review of applications for sustainability issues. Econ. Res. Istraz. 2016, 29, 857–887. [Google Scholar] [CrossRef] [Green Version]
- Kahraman, C.; Onar, S.C.; Oztaysi, B. Fuzzy Multicriteria Decision-Making: A Literature Review. Int. J. Comput. Intell. Syst. 2015, 8, 637–666. [Google Scholar] [CrossRef] [Green Version]
- Chang, T.-H. Fuzzy VIKOR method: A case study of the hospital service evaluation in Taiwan. Inf. Sci. 2014, 271, 196–212. [Google Scholar] [CrossRef]
- Cavallaro, F.; Zavadskas, E.K.; Raslanas, S. Evaluation of combined heat and power (CHP) systems using fuzzy shannon entropy and fuzzy TOPSIS. Sustainability 2016, 8, 556. [Google Scholar] [CrossRef] [Green Version]
- Siddiqui, Z.A.; Tyagi, K. Application of fuzzy-moora method: Ranking of components for reliability estimation of component-based software systems. Decis. Sci. Lett. 2016, 169–188. [Google Scholar] [CrossRef]
- Editor, S.; Davim, J.P.; Shunmugam, M.S. Lecture Notes on Multidisciplinary Industrial Engineering Advances in Unconventional Machining and Composites; Springer: Basel, Switzerland, 2018. [Google Scholar]
- Jaukovic Jocic, K.; Jocic, G.; Karabasevic, D.; Popovic, G.; Stanujkic, D.; Zavadskas, E.K.; Thanh Nguyen, P. A Novel Integrated PIPRECIA–Interval-Valued Triangular Fuzzy ARAS Model: E-Learning Course Selection. Symmetry 2020, 12, 928. [Google Scholar] [CrossRef]
- Büyüközkan, G.; Güleryüz, S. Evaluation of Renewable Energy Resources in Turkey using an integrated MCDM approach with linguistic interval fuzzy preference relations. Energy 2017, 123, 149–163. [Google Scholar] [CrossRef]
- Santos, M.; Ferreira, P.; Araújo, M.; Portugal-Pereira, J.; Lucena, A.F.P.; Schaeffer, R. Scenarios for the future Brazilian power sector based on a multi-criteria assessment. J. Clean. Prod. 2017, 167, 938–950. [Google Scholar] [CrossRef]
- Lee, H.-C.; Chang, C.-T. Comparative analysis of MCDM methods for ranking renewable energy sources in Taiwan. Renew. Sustain. Energy Rev. 2018, 92, 883–896. [Google Scholar] [CrossRef]
- Genco, F.; Genco, G. Selection of energy matrix sources in Chile using a fuzzy logic decision approach. Energy Syst. 2019, 12, 411–429. [Google Scholar] [CrossRef]
- Habib, S.M.; Suliman, A.E.-R.E.; Al Nahry, A.H.; El Rahman, E.N.A. Spatial modeling for the optimum site selection of solar photovoltaics power plant in the northwest coast of Egypt. Remote. Sens. Appl. Soc. Environ. 2020, 18. [Google Scholar] [CrossRef]
- Chien, F.; Wang, C.-N.; Nguyen, V.T.; Nguyen, V.T.; Chau, K.Y. An evaluation model of quantitative and qualitative fuzzy multi-criteria decision-making approach for hydroelectric plant location selection. Energies 2020, 13, 2783. [Google Scholar] [CrossRef]
- Aryanfar, A.; Gholami, A.; Pourgholi, M.; Shahroozi, S.; Zandi, M.; Khosravi, A. Multi-criteria photovoltaic potential assessment using fuzzy logic in decision-making: A case study of Iran. Sustain. Energy Technol. Assess. 2020, 42, 100877. [Google Scholar] [CrossRef]
- Karaaslan, A.; Adar, T.; Delice, E.K. Regional evaluation of renewable energy sources in Turkey by new integrated AHP-MARCOS methodology: A real application. Int. J. Sustain. Energy 2021, 1–23. [Google Scholar] [CrossRef]
- Abdel-Basset, M.; Gamal, A.; Chakrabortty, R.K.; Ryan, M.J. Evaluation approach for sustainable renewable energy systems under uncertain environment: A case study. Renew. Energy 2021, 168, 1073–1095. [Google Scholar] [CrossRef]
- Executive Process of Clean and Renewable Energy Power Plants Investment Guaranteed Feed in Tariffs. Available online: http://www.satba.gov.ir/en/investment1/investmentpowerplant/guaranteedfeedintariffs (accessed on 12 November 2021).
- Lotfi, F.H.; Fallahnejad, R. Imprecise shannon’s entropy and multi attribute decision making. Entropy 2010, 12, 53–62. [Google Scholar] [CrossRef] [Green Version]
- Brauers, W.K.M.; Zavadskas, E.K. The MOORA method and its application to privatization in a transition economy. Control Cybern. 2006, 35, 445–469. [Google Scholar]
- Ghorabaee, M.K.; Zavadskas, E.K.; Olfat, L.; Turskis, Z. Multi-criteria inventory classification using a new method of evaluation based on distance from Average Solution (EDAS). Informatica 2016, 26, 435–451. [Google Scholar] [CrossRef]
- Zavadskas, E.K.; Turskis, Z. A new additive ratio assessment (ARAS) method in multicriteria decision-making. Technol. Econ. Dev. Econ. 2010, 16, 159–172. [Google Scholar] [CrossRef]
- Turskis, Z.; Zavadskas, E.K. A novel method for multiple criteria analysis: Grey Additive Ratio Assessment (ARAS-G) method. Informatica 2010, 21, 597–610. [Google Scholar] [CrossRef]
- Turskis, Z.; Zavadskas, E.K. A new fuzzy additive ratio assessment method (ARAS-F). Case study: The analysis of fuzzy Multiple Criteria in order to select the logistic centers location. Transport 2010, 25, 423–432. [Google Scholar] [CrossRef] [Green Version]
- Güney, T. Renewable energy, non-renewable energy and sustainable development. Int. J. Sustain. Dev. World Ecol. 2019, 26, 389–397. [Google Scholar] [CrossRef]
- Available online: http://www.satba.gov.ir/suna_content/media/image/2018/12/7249_orig.pdf (accessed on 12 November 2018). (In Persian)
- IRENA. Renewable Energy and Jobs—Annual Review 2018; International Renewable Energy Agency: Abu Dhabi City, United Arab Emirates, 2018; pp. 1–28. [Google Scholar]
- Ramezanzade, M.; Saebi, J.; Karimi, H.; Mostafaeipour, A. A new hybrid decision-making framework to rank power supply systems for government organizations: A real case study. Sustain. Energy Technol. Assess. 2020, 41, 100779. [Google Scholar] [CrossRef]
- Ahmadi, M.H.; Ghazvini, M.; Sadeghzadeh, M.; Nazari, M.A.; Kumar, R.; Naeimi, A.; Ming, T. Solar power technology for electricity generation: A critical review. Energy Sci. Eng. 2018, 6, 340–361. [Google Scholar] [CrossRef] [Green Version]
- Mohammadi, K.; Khorasanizadeh, H. The potential and deployment viability of concentrated solar power (CSP) in Iran. Energy Strat. Rev. 2019, 24, 358–369. [Google Scholar] [CrossRef]
- Adeyeye, K.; Ijumba, N.; Colton, J. Exploring the environmental and economic impacts of wind energy: A cost-benefit perspective. Int. J. Sustain. Dev. World Ecol. 2020, 27, 718–731. [Google Scholar] [CrossRef]
- Cuadra, L.; Ocampo-Estrella, I.; Alexandre, E.; Salcedo-Sanz, S. A study on the impact of easements in the deployment of wind farms near airport facilities. Renew. Energy 2019, 135, 566–588. [Google Scholar] [CrossRef]
- Singh, V.K.; Singal, S. Operation of hydro power plants—A review. Renew. Sustain. Energy Rev. 2017, 69, 610–619. [Google Scholar] [CrossRef]
- Available online: https://iwpco.ir/ (accessed on 18 November 2021).
- Samadi, H.; Ghobadian, B.; Nosrati, M. Prediction and estimation of biomass energy from agricultural residues using air gasification technology in Iran. Renew. Energy 2019, 149, 1077–1091. [Google Scholar] [CrossRef]
- Liu, B.; Rajagopal, D. Life-cycle energy and climate benefits of energy recovery from wastes and biomass residues in the United States. Nat. Energy 2019, 4, 700–708. [Google Scholar] [CrossRef] [Green Version]
- Available online: http://www.satba.gov.ir/suna_content/media/image/2020/08/8389_orig.jpg (accessed on 18 November 2021).
- Ghazvini, M.; Sadeghzadeh, M.; Ahmadi, M.H.; Moosavi, S.; Pourfayaz, F. Geothermal energy use in hydrogen production: A review. Int. J. Energy Res. 2019, 43, 7823–7851. [Google Scholar] [CrossRef]
- Mohammadzadeh, H.; Kazemi, M. Geofluids assessment of the Ayub andShafa hot springs in kopet-dagh zone (NE Iran): An isotopic geochemistry approach. Geofluids 2017, 2017, 1–11. [Google Scholar] [CrossRef] [Green Version]
- Global Solar Atlas. Available online: https://globalsolaratlas.info/map?c=37.474858,57.038269,9&s=37.470498,57.321167&m=site (accessed on 18 November 2021).
- Global Wind Atlas. Available online: https://globalwindatlas.info/area/Islamic%20Republic%20of%20Iran/North%20Khorasan (accessed on 18 November 2021).
Publisher’s Note: MDPI stays neutral with regard to jurisdictional claims in published maps and institutional affiliations. |
© 2021 by the authors. Licensee MDPI, Basel, Switzerland. This article is an open access article distributed under the terms and conditions of the Creative Commons Attribution (CC BY) license (https://creativecommons.org/licenses/by/4.0/).