Article

Comparing Models with Positive Anticipated Emotions, Food Values, Attitudes and Subjective Norms as Influential Factors in Fast-Food Purchase Intention during the COVID-19 Pandemic in Two Channels: Restaurants and Mobile Apps

by
María Núñez-Fernández
,
Héctor Hugo Pérez-Villarreal
* and
Yesica Mayett-Moreno
Faculty of Marketing, UPAEP University, Puebla 72410, Mexico
*
Author to whom correspondence should be addressed.
Sustainability 2021, 13(22), 12857; https://doi.org/10.3390/su132212857
Submission received: 13 October 2021 / Revised: 15 November 2021 / Accepted: 17 November 2021 / Published: 20 November 2021
(This article belongs to the Special Issue Sustainable Food Management and Marketing)

Abstract

:
The purpose of this research is to determine if positive anticipated emotions, food values, attitudes and subjective norms influence food purchase intention in two different models: a fast food restaurant and a food delivery service via mobile apps. For this study, we utilized a non-experimental, causal, descriptive and cross-sectional design. From October 2020 to January 2021, self-administered online surveys were distributed to a convenience sample of 200 fast-food consumers at restaurants, and users of food delivery services via mobile apps Puebla City, Mexico. IBM–SPSS Statistics and the SmartPLS 3 Partial Least Squares Structural Equation Modeling were used to test our hypotheses. The results underscored a difference in attitudes between the models. The attitude toward the brand positively and significantly influenced purchase intention via mobile apps, whereas attitude toward eating a hamburger positively and significantly influenced purchase intention of visiting a fast-food restaurant. In both models, positive anticipated emotions exhibited the closest relationships with purchase intention, attitude toward the brand and attitude toward eating a hamburger, whereas food values exerted an insignificant effect on attitudes and purchase intention. Future research should consider performing a face-to-face survey with a random sample while accounting for different demographics, regions and countries, as well as including other brands, food types and restaurants.

1. Introduction

The tourism sector in general, and restaurants in particular, are especially vulnerable to disease outbreaks, which can threaten firms’ financial viability and impose great burdens on workers [1]. Kim et al. (2020) [2] confirmed the negative influence of epidemic disease outbreaks on the restaurant industry.
With the onset of the COVID-19 pandemic, humans have changed their habits and behaviors around food acquisition and consumption [3,4,5,6]. In tandem, the introduction of social distancing as a pandemic containment strategy has disrupted food systems [7]. In Mexico, for instance, there was a 90% decrease in the number of diners sitting at restaurant tables by 18 March 2020 [8]. However, some food and beverage establishments were able to continue operating by adopting food delivery services [8]. Against this background, the present research seeks to determine the factors that positively and significantly influence consumers’ food purchasing during the COVID-19 pandemic under two situations: whether people (1) are eating at a fast-food restaurant and (2) are using a food delivery service via mobile apps. To this end, we followed several studies and emphasized purchase intention as an important factor [9,10,11]. The literature review confirmed that several variables from the Theory of Planned Behavior (hereafter TPB) influence food purchase intention [12,13,14,15,16,17]. According to Ellison et al. (2021) [18], there is an ongoing shift toward online food purchasing, while Choi et al. (2021) [10] affirmed that more people are using food delivery apps. Several studies on such delivery apps have found that they can impact loyalty, service quality, packaging and customer satisfaction [19]. Yet, none of those studies have addressed food values, positive anticipated emotions or TPB variables (such as the influence of food purchase intention) while comparing different channels.
It is important to note that choices around food and food channels is increasingly complex—and COVID-19 has only exacerbated this reality by adding a safety dimension to the choice of distribution channel [20,21]. Various channels are having to modify their sales, supply and satisfaction planning in response to dramatic behavioral shifts from new and current customers [22]. For this reason, this study focuses on detecting the factors that cause a purchase intention which implies making adjustments to the sector, taking purchase intention as a reference. Practitioners would benefit from knowing what factors can predict food purchase intention in this climate. To this end, we draw from the TPB and focus on food values, positive anticipated emotions, attitude toward the brand, attitude toward eating and subjective norms [11]. In this way, the paper seeks to illuminate any meaningful differences between eating at fast-food restaurants and using a delivery service through mobile platforms.
In sum, the present article analyzes the decision-making process behind consuming fast food from two types of channels: in-person restaurants (traditional) and mobile delivery apps (modern). This study aims to examine the influence of: (i) food values and positive anticipated emotions on consumers’ attitudes and subjective norms; (ii) both attitudes to purchase intention; and (iii) subjective norms on purchase intention. The paper proceeds as follows: we review the previous literature on food values, positive anticipated emotions, attitudes and subjective norms on purchase intention; after that step, we delineate the research hypotheses and then define the empirical methodology used to test said hypotheses; and in the final section, we describe the main findings and highlight some implications for theory and management.

1.1. Positive Anticipated Emotions

Bagozzi et al. (2006) [23] defined anticipated emotions as a person’s belief about the emotional consequences of an action. Mellers and McGraw (2001) [24] suggest that these emotions serve to guide behavior and make decision making easier. Some authors consider emotions to be indicators of an individual’s intention to perform a particular behavior, such as purchase behaviors during the information processing phase [25,26]. Ajzen and Sheikh (2013) [27] included TPB with emotions as an influence variable in purchase intention.
A consumer who experiences positive emotions toward a brand will be more likely to develop a relationship with the brand, which can then shape their future perceptions, experiences and attitudes toward the brand and its offerings [28]. Similarly, foods generate powerful emotional responses that are fundamental to the satisfaction of consumers’ needs and expectations [29]. The study by Pérez-Villarreal et al. (2019) [11] connected food values and positive anticipated emotions with two different attitudes to predict purchase intention for hamburgers. The authors concluded that positive anticipated emotions such as happiness, enthusiasm and satisfaction positively influence attitude toward the brand, attitude toward eating and the intention to purchase a hamburger from a fast-food restaurant.
In short, emotions work via attitudes to substantially affect people’s purchase intention toward a specific product or brand [29]. Prinyawiwatkul (2020) [30] affirmed that the emotions stemming from eating are foundational to consumers’ satisfaction and thereby significantly influence their attitude toward purchasing from a particular brand.
Several authors have incorporated the variable of positive anticipated emotions into the original TPB model and established its importance [27,31,32]. Accordingly, we propose the following hypotheses:
Hypothesis 1 (H1).
Positive anticipated emotions will positively influence attitude toward the brand among people (a) eating in a fast-food restaurant and (b) eating fast food via a mobile delivery app.
Hypothesis 2 (H2).
Positive anticipated emotions will positively influence attitude toward eating among people (a) eating in a fast-food restaurant and (b) eating fast food via a mobile delivery app.
Hypothesis 3 (H3).
Positive anticipated emotions will positively influence subjective norms among people (a) eating in a fast-food restaurant and (b) eating fast food via a mobile delivery app.
Hypothesis 4 (H4).
Positive anticipated emotions will positively influence purchase intention among people (a) eating in a fast-food restaurant and (b) eating fast food via a mobile delivery app.

1.2. Food Values

According to Martínez-Ruíz and Gómez-Cantó (2016) [33], Izquierdo-Yusta et al. (2020) [34] and Muro-Rodríguez et al. (2021) [35], product attributes can highly influence a product choice. Consumers assign a level of importance to certain product features, which could positively or negatively affect the purchase decision process. Several authors have affirmed that food values reflect the importance of product attributes [11,15]. Such food values are emblematic of Marketing 3.0 approaches, which emphasize treating individuals as full human beings rather than as mere consumers. This is also known as the values-driven era because marketing decisions often try to incorporate consumers’ personal values [35]. In recent years, scholars have connected food values to emotions and attitude, with the goal of enhancing the relationship between food values and purchase intention [15]. One landmark study in this vein is by Lusk and Briggeman (2009) [36], who synthesized the literature on food preferences and human values to devise a food values scale that can reflect consumers’ willingness to purchase. Their efforts led to the values proposed by Lusk (2011) [37] constituting a fundamental contribution to marketing and consumer behavior [33].
According to Rokeach (1973) [38], a value is a belief that defines an individual’s behavior. Meanwhile, a value system results when a group of individuals hold the same ideology and preferences for an enduring length of time.
Manan (2016) [39] and Lang and Lemmerer (2019) [40] proved that food-related values effectively influence attitudes, which then impact food purchase intention and behavior [41]. Similarly, Cunha et al. (2014) [42] found that food values influence attitude toward eating a specific food. Likewise, Pérez-Villarreal et al. (2019) [11] proved that food values influence people’s attitude toward not only eating a hamburger at a fast-food restaurant, but also toward the brand itself. Nevertheless, none of these authors analyzed whether these same attitudes shift when people use a food delivery service via mobile apps. Because of the COVID-19 pandemic, we expect that consumers have assigned different importance to food values in 2020 compared to 2019 [18]. Based on the above ideas, we propose the following hypotheses:
Hypothesis 5 (H5).
Food values will positively influence attitude toward the brand among people (a) eating in a fast-food restaurant and (b) eating fast food via a mobile delivery app.
Hypothesis 6 (H6).
Food values will positively influence attitude toward eating among people (a) eating in a fast-food restaurant and (b) eating fast food via a mobile delivery app.
Hypothesis 7 (H7).
Food values will positively influence attitude toward the brand among people (a) eating in a fast-food restaurant and (b) eating fast food via a mobile delivery app.

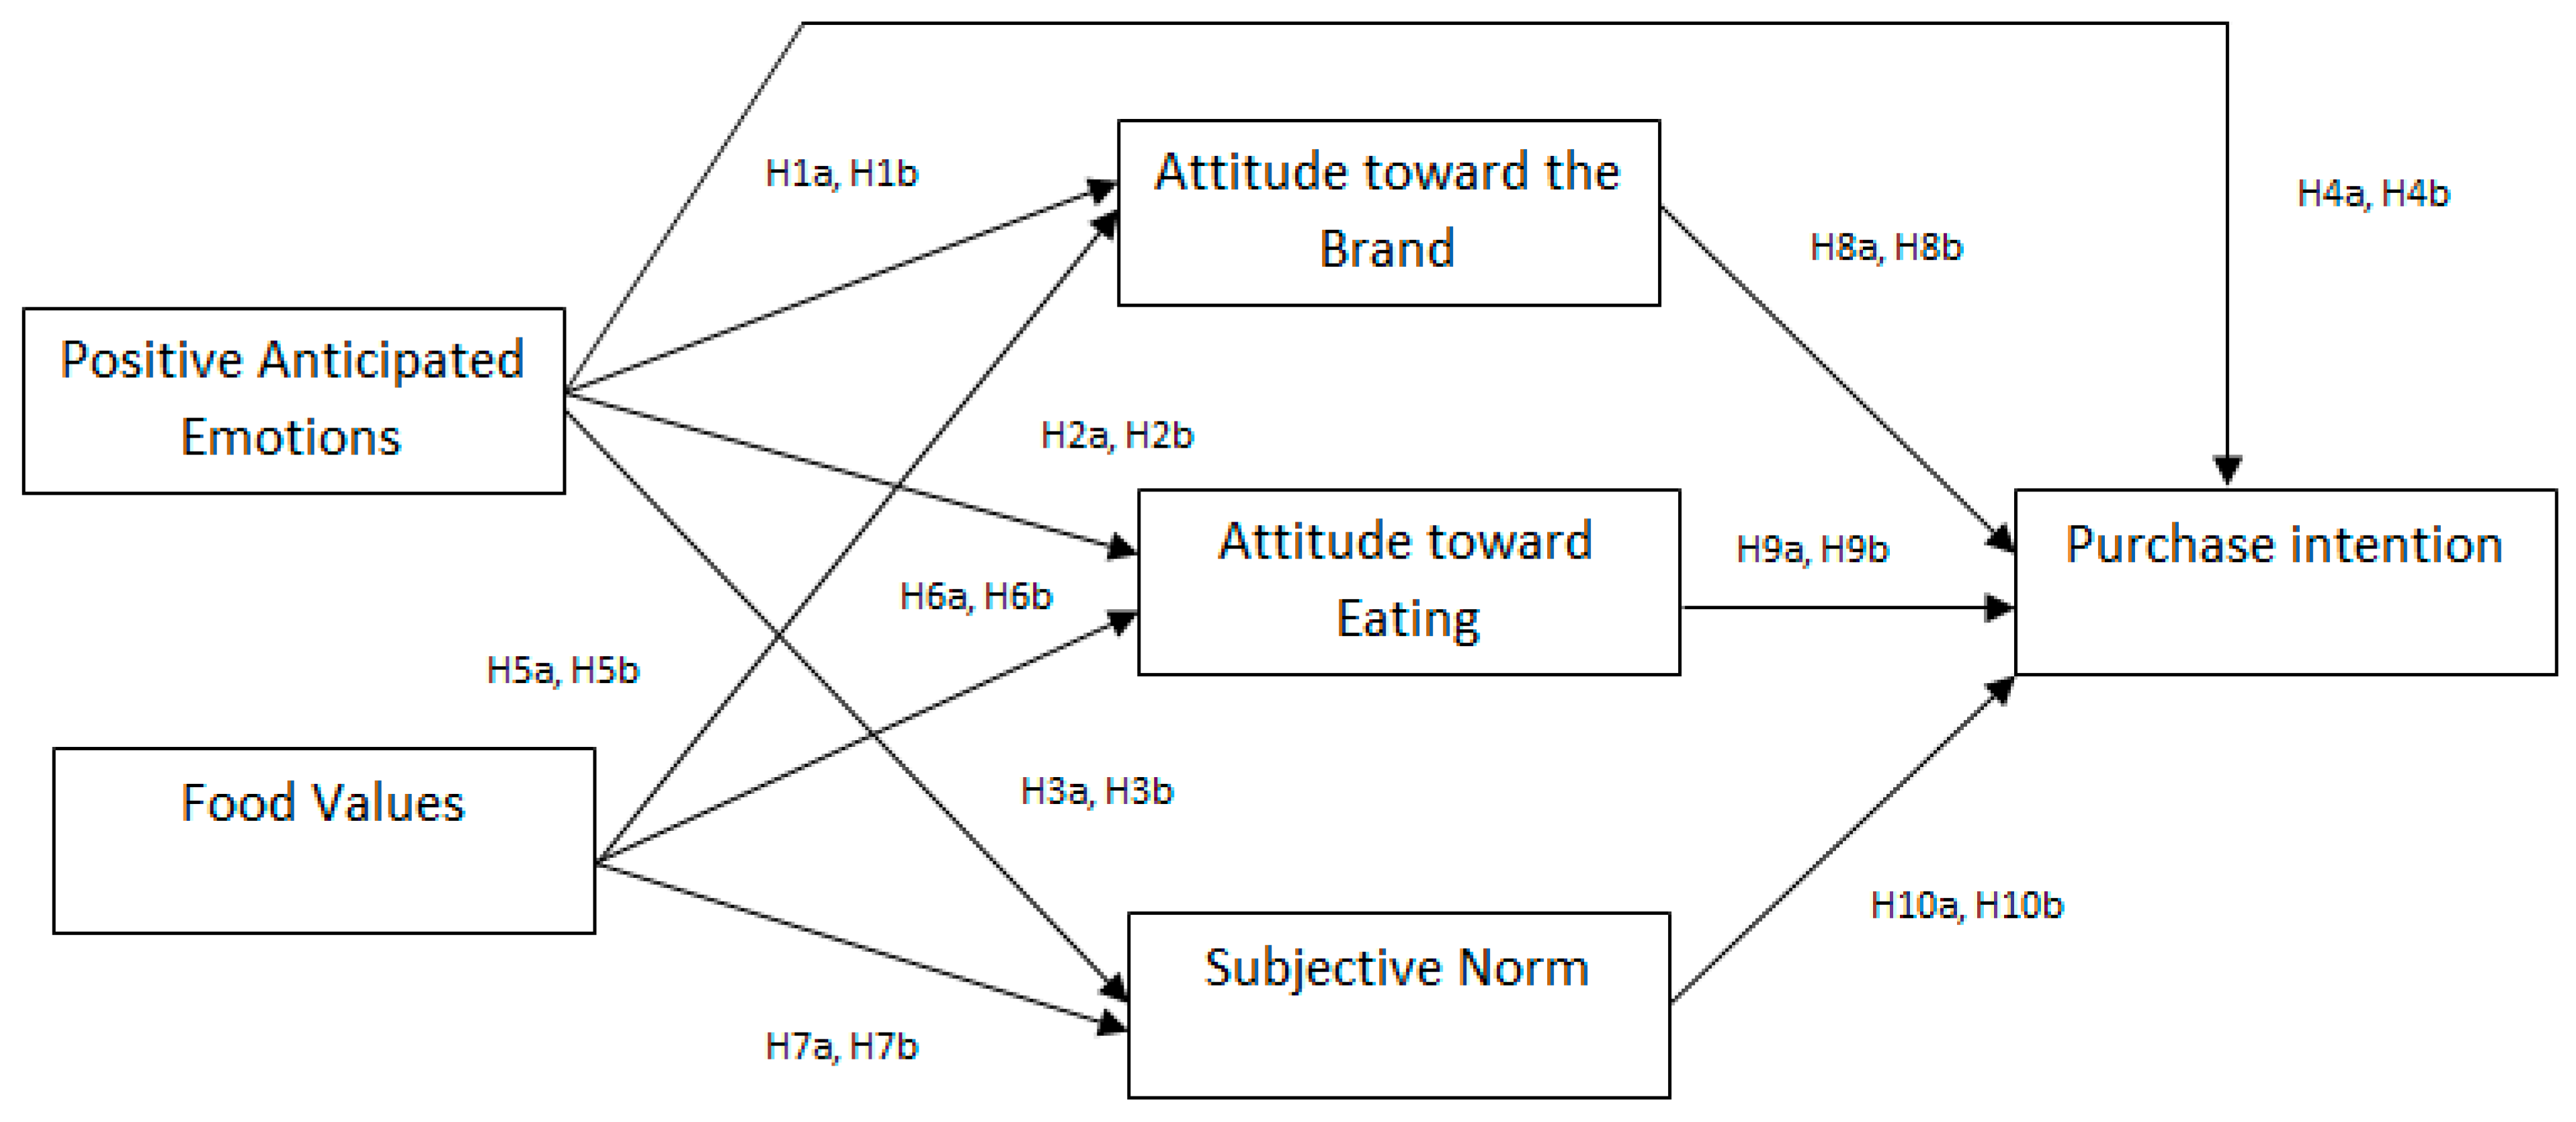
1.3. Attitudes, Subjective Norms and Purchase Intention

Every attitude and intention are stemmed from values, through a hierarchic relationship between values, attitudes, intention and finally, behavior [38,43]. The Theory of Planned Behavior (TPB) has recently become a premier tool for explaining purchase intention and behavior, especially in relation to several facets of eating [44]. TPB argues that consumers’ identities—and by extension, their food choices—are rooted in their intentions, experiences, attitudes and subjective norms. Therefore, consumers will never hold the exact same opinions, even if they technically belong to the same market segment [45,46].
TPB contends that behavior is influenced by three determining factors: (1) attitude, (2) subjective norms and (3) perceived control over one’s own behavior [47]. Note that the theory treats these three variables as conceptually independent [47,48]. This study specifically focused on attitudes and subjective norms with the possibility of continuing the research by adding perceived control.
Multiple authors have considered attitude to be a relevant factor in interpreting and predicting purchase intention, including toward food [11,13,47,49,50]. Bredahl (2001) [51] argued that a strong attitude can drive an individual’s intention to purchase a product; in other words, an individual’s attitudes and intentions to perform a specific behavior are intertwined.
Attitude toward the brand may positively and negatively influence purchase intention, as consumers will leverage brand knowledge when evaluating a product [52,53]. Individuals’ experiences or recommendations will shape their attitudes toward a brand, and then they will decide to adopt or reject those perceptions [54]. Individuals generally become more familiar with, and positive toward, a brand through repeated exposure to it [55]. Such exposure is strongly related to purchase intention and even post-purchase behaviors [56].
With regard to food, attitude toward eating is a significant psychological factor that may shape purchase intention toward the foods in question [57]. Phrased differently, purchasing a food is reflective of a positive attitude toward it [11,58,59]. Thus, a restaurant should understand consumers’ perceptions about the offered food, as well as the cultural, psychological and social motivations that drive consumer behavior [58,59]. Some factors that influence food purchase intention include taste, smell, texture, price, brand and quality, among others [60]. Another important factor is lifestyle, which shapes people’s attitude toward what they eat and where they purchase it [12,61]. Naturally, people have had to adapt their lifestyles to the realities of the pandemic. Accordingly, we propose the following hypotheses:
Hypothesis 8 (H8).
Attitude toward the brand positively influences purchase intention. among people (a) eating in a fast-food restaurant and (b) eating fast food via a mobile delivery app.
Hypothesis 9 (H9).
Attitude toward eating positively influences purchase intention among people (a) eating in a fast-food restaurant and (b) eating fast food via a mobile delivery app.
Subjective norms describe the social pressure exerted on an individual to perform or refrain from a specific behavior. The individual assesses whether relevant others agree that a behavior should be performed—that he/she “should do it” [47,62]. Fishbein and Ajzen (1975) [63] defined subjective norms as the sum of people’s opinions about whether a given individual should (or should not) engage in a behavior.
Several authors have used the subjective norms variable to predict and understand intention and the resulting behavior in different fields, finding that this variable and attitudes are among the strongest predictors [15,64,65]. Scholars have even found a positive relationship between subjective norms toward food consumption and visiting fast-food restaurants [66]. Based on the above, we propose the following hypothesis:
Hypothesis 10 (H10).
Subjective norms positively influence purchase intention among people (a) eating in a fast-food restaurant and (b) eating fast food via a mobile delivery app.
In sum, these ten hypotheses reflect ten different effects across two fast-food purchase models (within a restaurant vs. via a mobile delivery app) during a pandemic. The effects are: (1) attitude toward the brand on purchase intention, (2) attitude toward eating a hamburger on purchase intention, (3) food values on attitude toward the brand, (4) food values on attitude toward eating a hamburger, (5) food values on subjective norms, (6) positive anticipated emotions on purchase intention, (7) positive anticipated emotions on attitude toward the brand, (8) positive anticipated emotions on attitude toward eating a hamburger, (9) positive anticipated emotions on subjective norms and (10) subjective norms on purchase intention (see Figure 1).

2. Materials and Methods

This research utilizes a non-experimental, causal, descriptive and simple cross-sectional design that has been supported by quantitative empirical evidence. The data were collected via a self-administered online survey distributed to a convenience sample of fast-food consumers over age 18. The survey was distributed via Google Forms and participants had to indicate that they eat at fast-food restaurants and/or have used restaurants’ mobile apps. In the first phase, we distributed 250 surveys from October 2020 to January 2021. Of those, 80% responded completely, leaving 200 usable surveys for this research. The final number of the sample is according to the power statistical confidence level and margin of error. For these calculations, we used 11 predictors, with a 95% confidence level and 6.94 margin of error. The geographical scope was Puebla City, Mexico. The survey contained some screening questions that participants completed before answering to ensure that they met the criteria for the research. We used the IBM–SPSS Statistics Base version 22 and the SmartPLS 3 Partial Least Squares Structural Equation Modeling (hereafter PLS-SEM) to statistically test our hypotheses.

Survey Development

The survey featured 55 indicators (items) in total, divided into three sections: one corresponded to food values (33 items) and the other two sections (covering 22 items) corresponded to attitudes toward the brand and attitudes toward eating, respectively; all answers used a Likert scale from 1–5 (1 = not important at all/strongly disagree; 5 = very important/strongly agree). All items were tailored to reference the two models (inside the restaurant versus delivery via mobile app). Regarding attitude toward the brand, items were adjusted based on the brands used in this study. We used a generic hamburger as the focal food product when assessing the variables. Meanwhile, we applied a Likert scale from 1–5 (1 = strongly disagree, 5 = strongly agree) to measure positive anticipated emotions, used purchase intention and subjective norms. Indicators with a variance inflation factor (hereafter VIF) greater than 3.3 were eliminated [67]. Thus, the items ATEH2Rest and DelightedRest were eliminated from the fast-food restaurant model, while the items ATEH2Delivery, DelightedDelivery and NS2Delivery were removed from the mobile app model.
The item descriptions in Table 1 and Table 2 were modified. We want to emphasize that the variable proposal applies to the two channels of interest: (1) the fast-food restaurant model and (2) food delivery service via mobile app model.

3. Results

Henseler et al. (2016) [72] suggested that model goodness of fit should be assessed by using the standardized root mean squared residual (hereafter SRMR) and normed fit index (hereafter NFI). According to Hair et al. (2011) [73] and Hu and Bentler (1999) [74], a good fit parameter for SRMR is 0.05 to 0.08, and for NFI, 0 to 1, with numbers closer to 1 being better [73]. The fast-food restaurant model criteria were SRMR = 0.061 < 0.08 and NFI = 0.748, while the mobile app model criteria were SRMR = 0.062 < 0.08 and NFI = 0.813 (Table 3). Therefore, both models demonstrated acceptable fit.
To assess model reliability, we used Cronbach’s alpha (α), coefficient rho_A and composite reliability (hereafter CR). These three indicators should have a measurement criterion above 0.7 [75,76]. It is relevant to mention that reliability tests should be applied only to latent variables with reflective indicators—hence, food values are not present in Table 4 [77]. Regarding average variance extracted (hereafter AVE), the index should be above 0.5 [75]. Table 4 shows α, rho_A and CR values above 0.7 and AVE values above 0.5. Thus, both models fulfill established criteria, and they are reliable (Table 4).
Next, we applied techniques to establish the variables’ convergent and discriminant validity. According to Fornell and Larcker (1981) [78], an adequate score for convergent validity is when AVE is fewer than variance and α is above 0.7. According to Bagozzi and Yi (1988) [79], discriminant validity occurs when the AVE square root exceeds the correlations between variables. Table 5 and Table 6 show the convergent and discriminant validity of both models. In both tables, numbers in the diagonal are the AVE square root, while numbers outside the diagonal are correlations between constructs.

Hypothesis Testing

To verify the hypotheses, we used path coefficient (β), standard error, t-value and p-value, employing bootstrapping method and a subsample of 10,000. The hypotheses are statistically significant when β is close to −1 or +1; p-value ≤ 0.000 and p ≤ 0.001 mean the results are statistically significant [72]. However, after analyzing both models, we could not confirm support for all the hypotheses.
Regarding the fast-food restaurant model, Table 7 shows the influential variables, such as positive anticipated emotions and attitude toward eating a hamburger. It also establishes that subjective norms are important to purchase prediction. There are three hypotheses with the highest association level: (1) H2a with β = 0.696, t = 17.670 and p ≤ 0.000; (2) H3a with β = 0.655, t = 13.794 and p ≤ 0.000; (3) H4a with β = 0.645, t = 14.345 and p ≤ 0.000. Consequently, this model supported H1a, H2a, H3a, H4a, H9a and H10a, whose t-values ≥ 1.960, p-values ≤ 0.000 and β indicate significant results. In contrast, H5a, H6a, H7a and H8a were rejected due to an insignificant or even negative influence from food values to subjective norms, attitude toward the brand and attitude toward eating a hamburger, and to attitude toward the brand to purchase intention.
Regarding the mobile app model, Table 8 shows that attitude toward the brand and positive anticipated emotions were influential, but with a low association level. As before, subjective norms were important to purchase prediction. There are three hypotheses with the highest association level: (1) H2b with β = 0.662, t = 13.669 and p ≤ 0.000; (2) H1b with β = 0.495, t = 7.376 and p ≤ 0.000; and (3) H3b with β = 0.367, t = 5.097 and p ≤ 0.000. In other words, this model supported H1b, H2b, H3b, H4b, H8b and H10b, whose t-values ≥ 1.960, p-values ≤ 0.050 and β indicate significant results. In contrast, H5b, H6b, H7b and H9b were rejected due to an insignificant or even negative influence from food values to subjective norms, attitude toward the brand and attitude toward eating a hamburger, and to attitude toward eating to purchase intention.
R2 was calculated to assess the structural model; the higher the value, the better the constructs explain the model. Recommended R2 values may start from above 0.10, 0.75, 0.50 or 0.25, equivalent to typical, substantial, moderate or weak, respectively [73,80]. According to Hair et al. (2019) [81], another measurement option besides R2 is predictive relevance (Q2). Recommended Q2 values are above 0.02, 0.15 or 0.35, which means the model has a weak, moderate or significant predictive relevance, respectively.
Regarding the fast-food restaurant model, Table 9 shows the R2 attitude toward the brand = 0.473 (weak-moderate) and R2 attitude toward eating a hamburger = 0.585 (moderate), meaning that positive anticipated emotions explain attitudes. R2 purchase intention = 0.681 (moderate-substantial), meaning that attitude toward the brand, attitude toward eating a hamburger, positive anticipated emotions and subjective norms explain purchase intention in 68%. R2 subjective norms = 0.520 (moderate), meaning that positive anticipated emotions explain subjective norms in 52%. As for Q2, the four results support that the model has significant predictive relevance.
Regarding the mobile app model, Table 9 shows values that are lower than the other model, yet still meet both criteria. R2 attitude toward the brand = 0.236 (weak) and R2 attitude toward eating a hamburger = 0.521 (moderate-weak), meaning that positive anticipated emotions explain attitudes in 23% and 53%, respectively. R2 purchase intention = 0.310 (weak), meaning that attitude toward the brand, attitude toward eating a hamburger, positive anticipated emotions and subjective norms explain purchase intention in 31%. R2 subjective norms = 0.174 (weak), meaning that positive anticipated emotions and food values explain subjective norms in 18%. As for Q2, the four results support the correct operation of these models. Attitude toward the brand had a moderate yet significant relevance, while attitude toward eating had a marginal but still significant predictive relevance.
Traditional reliability and validity assessments do not apply to formative variables, as they do not have to match each other, but food values theory should support the construct as formative. Additionally, the PLS algorithm exposed loadings for reflective indicators and weights for formative indicators.

4. Discussion and Conclusions

The main objective of this research was to compare consumer purchase intention behavior by differentiating the channel used for consuming hamburgers from a fast-food restaurant. To this end, we analyzed the differences between two purchase contexts: an in-store channel (traditional or model A) versus a mobile delivery app (modern or model B). For this study, we assessed variables such as positive anticipated emotions, food values, attitude toward the brand, attitude toward eating a hamburger and subjective norms.
For model A, we observed that positive anticipated emotions had a strong effect on attitudes, subjective norms and purchase intention. This resulted in a top view of the model where positive emotions are evoked prior to determining purchase intention, both directly and indirectly (e.g., through attitudes and subjective norms). Managers need to analyze the emotional typology and take actions that arouse those emotions at the point of sale. Consumer communications, point-of-sale locations, prices and products should emphasize the most relevant emotions in order to drive consumer behavior. On the other hand, the attitude toward eating a hamburger represents a very efficient relationship toward the intention, i.e., the utilitarian aspect of consumption is reinforced in this relationship. This can make a strategic synergy, raising the hedonic (emotional) versus values (utilitarian) aspect. Likewise, it is proven that although the relationship between subjective norms and purchase intention has a positive aspect, it does not form a strong relationship; thus, it must be taken into consideration, but not in the first stage.
In model B, the affective emotional component is observed as the main one. We also found a robust relationship between positive anticipated emotions, attitude toward eating a hamburger and attitude toward the brand. In this model, the attitude toward the brand has a notable impact on purchase intention. Additionally, subjective norms and positive anticipated emotions exert a medium-strength influence on purchase intention. In conclusion, this model provides some initial insights, but future work is needed to establish more conclusive evidence.
Both models constitute a method for explaining purchase intention through some TPB variables as well as food values. In both schemes, we established the transcendental role of positive anticipatory emotions in explaining the purchase intention of fast-food consumers. Likewise, we observed that food values did not perform remarkably in the models; thus, there would be value in exploring other adjacent variables that have more explanatory power. The traditional model demonstrates significant relevance of 68.1% versus 31% for the mobile application one. In other words, the first model features some solid directions, while the second model lacks an optimal level of explanation. There may be other variables that drive food purchases when using an app. For instance, whether the app is directly tied to the restaurant or instead to a third party may play a significant role. In addition, it makes a significant difference between the brand of the app and that of the restaurant.
The fast-food industry needs to invest in more research to understand consumer behavior and values. Managers need more in-depth knowledge about using some channels and the consequences of the purchase intention. More and more consumers are growing closer to the opinions of different external actors, which would be interesting to investigate who they are, for making strategies that possibly impact subjective norm and consumer purchase intention. In order to endure, fast-food companies need to invest more in food values, positive anticipated emotions, attitude toward eating, attitude toward the brand and subjective norms.

Limitations and Future Research

The first limitation of this research is that we used an online survey rather than a face-to-face survey, which is recommended for ensuring a representative sample of participants. Future work should consider population differences and select individuals by proportional allocation to obtain a representative sample by age, gender, socioeconomic status, schooling and region of Puebla State or other states in Mexico. In this way, scholars can classify opinions according to demographic profiles and, more broadly, perform cross-cultural comparisons.
Furthermore, future research could increase the reliability level by performing random sampling and using a larger sample size, as well as analyzing each factor separately. Research should also consider other brands, food types and restaurants, such as full-service restaurants.
Likewise, we recommend adding other TPB-related variables, including predecessor variables to food purchase intention, such as word-of-mouth recommendation, loyalty or satisfaction. Additionally, scholars should more deeply evaluate the importance and relevance that consumers assign to nutritional food values and food safety issues.
Finally, there would be value in performing a longitudinal study in order to chart the evolution of people’s priorities during different periods of the pandemic or in response to a different health crisis.

Author Contributions

Conceptualization, M.N.-F. and H.H.P.-V.; methodology, M.N.-F.; software, M.N.-F. and H.H.P.-V.; validation, M.N.-F., H.H.P.-V. and Y.M.-M.; formal analysis, H.H.P.-V.; investigation, Y.M.-M.; resources, H.H.P.-V. and Y.M.-M.; data curation, Y.M.-M.; writing—original draft preparation, M.N.-F. and Y.M.-M.; writing—review and editing, M.N.-F.; visualization, Y.M.-M.; supervision, H.H.P.-V.; project administration, H.H.P.-V.; funding acquisition, H.H.P.-V. and Y.M.-M. All authors have read and agreed to the published version of the manuscript.

Funding

This research was funded by Universidad Popular Autónoma del Estado de Puebla (UPAEP), Sistemas de Información de Marketing: Sistemas de información, modelización y gestión para la toma de decisiones en Marketing, and the APC was funded by UPAEP.

Institutional Review Board Statement

Not applicable.

Informed Consent Statement

Not applicable.

Data Availability Statement

The data is available by request to the correspondence author. Also, the names of participants are confidential to guarantee their anonymity.

Conflicts of Interest

The authors declare no conflict of interest.

References

  1. Hall, C.M. Crisis Events in Tourism: Subjects of Crisis in Tourism. Curr. Issues Tour. 2010, 13, 401–417. [Google Scholar] [CrossRef]
  2. Kim, J.; Kim, J.; Lee, S.K.; Tang, L.R. Effects of Epidemic Disease Outbreaks on Financial Performance of Restaurants: Event Study Method Approach. J. Hosp. Tour. Manag. 2020, 43, 32–41. [Google Scholar] [CrossRef]
  3. AlTarrah, D.; AlShami, E.; AlHamad, N.; AlBesher, F.; Devarajan, S. The Impact of Coronavirus COVID-19 Pandemic on Food Purchasing, Eating Behavior, and Perception of Food Safety in Kuwait. Sustainability 2021, 13, 8987. [Google Scholar] [CrossRef]
  4. Choi, J.; Park, J.; Jeon, H.; Asperin, A.E. Exploring Local Food Consumption in Restaurants through the Lens of Locavorism. J. Hosp. Mark. Manag. 2021, 30, 982–1004. [Google Scholar] [CrossRef]
  5. Cranfield, J.A.L. Framing Consumer Food Demand Responses in a Viral Pandemic. Can. J. Agric. Econ./Revue canadienne d’agroeconomie 2020, 68, 151–156. [Google Scholar] [CrossRef]
  6. Gössling, S.; Scott, D.; Hall, C.M. Pandemics, Tourism and Global Change: A Rapid Assessment of COVID-19. J. Sustain. Tour. 2021, 29, 1–20. [Google Scholar] [CrossRef]
  7. Niles, M.T.; Bertmann, F.; Belarmino, E.H.; Wentworth, T.; Biehl, E.; Neff, R. The Early Food Insecurity Impacts of COVID-19. Nutrients 2020, 12, 2096. [Google Scholar] [CrossRef]
  8. Dube, K.; Nhamo, G.; Chikodzi, D. COVID-19 Cripples Global Restaurant and Hospitality Industry. Curr. Issues Tour. 2021, 24, 1487–1490. [Google Scholar] [CrossRef]
  9. Brewer, P.; Sebby, A.G. The Effect of Online Restaurant Menus on Consumers’ Purchase Intentions during the COVID-19 Pandemic. Int. J. Hosp. Manag. 2021, 94, 102777. [Google Scholar] [CrossRef]
  10. Choi, Y.; Zhang, L.; Debbarma, J.; Lee, H. Sustainable Management of Online to Offline Delivery Apps for Consumers’ Reuse Intention: Focused on the Meituan Apps. Sustainability 2021, 13, 3593. [Google Scholar] [CrossRef]
  11. Pérez-Villarreal, H.H.; Martínez-Ruiz, M.P.; Izquierdo-Yusta, A. Testing Model of Purchase Intention for Fast Food in Mexico: How Do Consumers React to Food Values, Positive Anticipated Emotions, Attitude toward the Brand, and Attitude toward Eating Hamburgers? Foods 2019, 8, 369. [Google Scholar] [CrossRef] [PubMed] [Green Version]
  12. Shepherd, R. Factors Influencing Food Preferences and Choice. In Handbook of the Psychophysiology of Human Eating; Shepherd, R., Ed.; Wiley: Chichester, UK, 1989; pp. 3–24. [Google Scholar]
  13. Brinberg, D.; Durand, J. Eating at Fast-Food Restaurants: An Analysis Using Two Behavioral Intention Models. J. Appl. Soc. Psychol. 1983, 13, 459–472. [Google Scholar] [CrossRef]
  14. Shepherd, R.; Stockley, L. Fat Consumption and Attitudes towards Food with a High Fat Content. Hum. Nutr. Appl. Nutr. 1985, 39, 431–442. [Google Scholar]
  15. Pérez-Villarreal, H.H.; Martínez-Ruiz, M.P.; Izquierdo-Yusta, A.; Gómez-Cantó, C.M. Food Values, Benefits and Their Influence on Attitudes and Purchase Intention: Evidence Obtained at Fast-Food Hamburger Restaurants. Sustainability 2020, 12, 7749. [Google Scholar] [CrossRef]
  16. Tuorila, H. Selection of Milks with Varying Fat Contents and Related Overall Liking, Attitudes, Norms and Intentions. Appetite 1987, 8, 1–14. [Google Scholar] [CrossRef]
  17. Robinson, R.; Smith, C. Psychosocial and Demographic Variables Associated with Consumer Intention to Purchase Sustainably Produced Foods as Defined by the Midwest Food Alliance. J. Nutr. Educ. Behav. 2002, 34, 316–325. [Google Scholar] [CrossRef]
  18. Ellison, B.; McFadden, B.; Rickard, B.J.; Wilson, N.L.W. Examining Food Purchase Behavior and Food Values During the COVID-19 Pandemic. Appl. Econ. Perspect. Policy 2021, 43, 58–72. [Google Scholar] [CrossRef]
  19. Raina, A.; Rana, V.; Thakur, A. Popularity of Online Food Ordering and Delivery Services—A Comparative Study between Zomato, Swiggy and Uber Eats in Ludhiana. 2019. Available online: https://www.researchgate.net/profile/Ashish-Raina/publication/341109906_POPULARITY_OF_ONLINE_FOOD_ORDERING_AND_DELIVERY_SERVICES-A_COMPARATIVE_STUDY_BETWEEN_ZOMATO_SWIGGY_AND_UBER_EATS_IN_LUDHIANA/links/5eae6f17a6fdcc7050a49dd9/POPULARITY-OF-ONLINE-FOOD-ORDERING-AND-DELIVERY-SERVICES-A-COMPARATIVE-STUDY-BETWEEN-ZOMATO-SWIGGY-AND-UBER-EATS-IN-LUDHIANA.pdf (accessed on 16 November 2021).
  20. Chkalova, O.; Bolshakova, I.; Kopasovskaya, N.; Mukhanova, N.; Gluhov, V. Transformation of Online Consumer Behavior Under the Influence of the Pandemic and the Development of Telecommunications. In Internet of Things, Smart Spaces, and Next Generation Networks and Systems; Galinina, O., Andreev, S., Balandin, S., Koucheryavy, Y., Eds.; Lecture Notes in Computer Science; Springer International Publishing: Cham, Switzerland, 2020; Volume 12526, pp. 338–347. ISBN 978-3-030-65728-4. [Google Scholar]
  21. Pantano, E.; Pizzi, G.; Scarpi, D.; Dennis, C. Competing during a Pandemic? Retailers’ Ups and Downs during the COVID-19 Outbreak. J. Bus. Res. 2020, 116, 209–213. [Google Scholar] [CrossRef]
  22. Akram, U.; Fülöp, M.T.; Tiron-Tudor, A.; Topor, D.I.; Căpușneanu, S. Impact of Digitalization on Customers’ Well-Being in the Pandemic Period: Challenges and Opportunities for the Retail Industry. Int. J. Environ. Res. Public. Health 2021, 18, 7533. [Google Scholar] [CrossRef]
  23. Bagozzi, R.P.; Dholakia, U.M. Antecedents and Purchase Consequences of Customer Participation in Small Group Brand Communities. Int. J. Res. Mark. 2006, 23, 45–61. [Google Scholar] [CrossRef]
  24. Mellers, B.A.; McGraw, A.P. Anticipated Emotions as Guides to Choice. Curr. Dir. Psychol. Sci. 2001, 10, 210–214. [Google Scholar] [CrossRef]
  25. Bagozzi, R.P.; Dholakia, U.M.; Basuroy, S. How Effortful Decisions Get Enacted: The Motivating Role of Decision Processes, Desires, and Anticipated Emotions. J. Behav. Decis. Mak. 2003, 16, 273–295. [Google Scholar] [CrossRef]
  26. Wood, L. Brands and Brand Equity: Definition and Management. Manag. Decis. 2000, 38, 662–669. [Google Scholar] [CrossRef] [Green Version]
  27. Ajzen, I.; Sheikh, S. Action versus Inaction: Anticipated Affect in the Theory of Planned Behavior: Anticipated Affect. J. Appl. Soc. Psychol. 2013, 43, 155–162. [Google Scholar] [CrossRef]
  28. Chang, P.-L.; Chieng, M.-H. Building Consumer–Brand Relationship: A Cross-Cultural Experiential View. Psychol. Mark. 2006, 23, 927–959. [Google Scholar] [CrossRef]
  29. Chonpracha, P.; Ardoin, R.; Gao, Y.; Waimaleongora-ek, P.; Tuuri, G.; Prinyawiwatkul, W. Effects of Intrinsic and Extrinsic Visual Cues on Consumer Emotion and Purchase Intent: A Case of Ready-to-Eat Salad. Foods 2020, 9, 396. [Google Scholar] [CrossRef] [Green Version]
  30. Prinyawiwatkul, W. Relationships between Emotion, Acceptance, Food Choice, and Consumption: Some New Perspectives. Foods 2020, 9, 1573. [Google Scholar] [CrossRef]
  31. Rivis, A.; Sheeran, P.; Armitage, C.J. Expanding the Affective and Normative Components of the Theory of Planned Behavior: A Meta-Analysis of Anticipated Affect and Moral Norms: Meta-analysis of anticipated affect and moral norm. J. Appl. Soc. Psychol. 2009, 39, 2985–3019. [Google Scholar] [CrossRef]
  32. Harth, N.S.; Leach, C.W.; Kessler, T. Guilt, Anger, and Pride about in-Group Environmental Behaviour: Different Emotions Predict Distinct Intentions. J. Environ. Psychol. 2013, 34, 18–26. [Google Scholar] [CrossRef]
  33. Martínez-Ruiz, M.P.; Gómez-Cantó, C.M. Key External Influences Affecting Consumers’ Decisions Regarding Food. Front. Psychol. 2016, 7. [Google Scholar] [CrossRef] [PubMed]
  34. Izquierdo-Yusta, A.; Gómez-Cantó, C.M.; Martínez-Ruiz, M.P.; Pérez-Villarreal, H.H. The Influence of Food Values on Post–Purchase Variables at Food Establishments. Br. Food J. 2020, 122, 2061–2076. [Google Scholar] [CrossRef]
  35. Muro-Rodríguez, A.I.; Pérez-Jiménez, I.R.; Esteban-Dorado, A.; Martínez-Ruiz, M.P. Food Values, Satisfaction, and Loyalty: Some Evidence in Grocery Retailing Acquired during the COVID-19 Pandemic. Sustainability 2021, 13, 3908. [Google Scholar] [CrossRef]
  36. Lusk, J.L.; Briggeman, B.C. Food Values. Am. J. Agric. Econ. 2009, 91, 184–196. [Google Scholar] [CrossRef]
  37. Lusk, J.L. External Validity of the Food Values Scale. Food Qual. Prefer. 2011, 22, 452–462. [Google Scholar] [CrossRef]
  38. Rokeach, M. The Nature of Human Values; The Nature of Human Values; Free Press: New York, NY, USA, 1973; ISBN 978-0-02-926750-9. [Google Scholar]
  39. Manan, H.A. The Hierarchical Influence of Personal Values on Attitudes Toward Food and Food Choices. Procedia Econ. Finance 2016, 37, 439–446. [Google Scholar] [CrossRef] [Green Version]
  40. Lang, M.; Lemmerer, A. How and Why Restaurant Patrons Value Locally Sourced Foods and Ingredients. Int. J. Hosp. Manag. 2019, 77, 76–88. [Google Scholar] [CrossRef]
  41. Chen, M. Attitude toward Organic Foods among Taiwanese as Related to Health Consciousness, Environmental Attitudes, and the Mediating Effects of a Healthy Lifestyle. Br. Food J. 2009, 111, 165–178. [Google Scholar] [CrossRef]
  42. Cunha, S.C.; Faria, M.A.; Pereira, V.L.; Oliveira, T.M.; Lima, A.C.; Pinto, E. Patulin Assessment and Fungi Identification in Organic and Conventional Fruits and Derived Products. Food Control 2014, 44, 185–190. [Google Scholar] [CrossRef]
  43. Bagozzi, R.P. Attitudes, Intentions, and Behavior: A Test of Some Key Hypotheses. J. Pers. Soc. Psychol. 1981, 41, 607–627. [Google Scholar] [CrossRef]
  44. Tuu, H.H.; Olsen, S.O.; Thao, D.T.; Anh, N.T.K. The Role of Norms in Explaining Attitudes, Intention and Consumption of a Common Food (Fish) in Vietnam. Appetite 2008, 51, 546–551. [Google Scholar] [CrossRef]
  45. Conner, M.; Armitage, C.J. Extending the Theory of Planned Behavior: A Review and Avenues for Further Research. J. Appl. Soc. Psychol. 1998, 28, 1429–1464. [Google Scholar] [CrossRef]
  46. Johnson, B.R. Toward a Multidimensional Model of Entrepreneurship: The Case of Achievement Motivation and the Entrepreneur. Entrep. Theory Pract. 1990, 14, 39–54. [Google Scholar] [CrossRef]
  47. Ajzen, I. The Theory of Planned Behavior. Organ. Behav. Hum. Decis. Process. 1991, 50, 179–211. [Google Scholar] [CrossRef]
  48. Chen, M.; Lu, T. Modeling E-coupon Proneness as a Mediator in the Extended TPB Model to Predict Consumers’ Usage Intentions. Internet Res. 2011, 21, 508–526. [Google Scholar] [CrossRef]
  49. Fazio, R.H.; Zanna, M.P. Direct Experience And Attitude-Behavior Consistency. In Advances in Experimental Social Psychology; Elsevier: Amsterdam, The Netherlands, 1981; Volume 14, pp. 161–202. ISBN 978-0-12-015214-8. Available online: https://www.sciencedirect.com/science/article/abs/pii/S006526010860372X (accessed on 16 November 2021).
  50. Towler, G.; Shepherd, R. Application of Fishbein and Ajzen’s Expectancy-Value Model to Understanding Fat Intake. Appetite 1992, 18, 15–27. [Google Scholar] [CrossRef]
  51. Bredahl, L. Determinants of Consumer Attitudes and Purchase Intentions with Regard to Genetically Modified Food—Results of a Cross-National Survey. J. Consum. Policy 2001, 24, 23–61. [Google Scholar] [CrossRef]
  52. Lee, D.; Ganesh, G. Effects of Partitioned Country Image in the Context of Brand Image and Familiarity: A Categorization Theory Perspective. Int. Mark. Rev. 1999, 16, 18–41. [Google Scholar] [CrossRef]
  53. Pipoli de Azambuja, G.M.M.; García-Arrizabalaga, I.; Rodríguez-Peña, G. Analyzing the Purchase Intention of Peruvian Maca. J. Enterprising Communities People Places Glob. Econ. 2020, 14, 91–112. [Google Scholar] [CrossRef]
  54. Foroudi, P. Influence of Brand Signature, Brand Awareness, Brand Attitude, Brand Reputation on Hotel Industry’s Brand Performance. Int. J. Hosp. Manag. 2019, 76, 271–285. [Google Scholar] [CrossRef] [Green Version]
  55. Zajonc, R.B. Attitudinal Effects of Mere Exposure. J. Pers. Soc. Psychol. 1968, 9, 1–27. [Google Scholar] [CrossRef] [Green Version]
  56. Jeng, S.-P. The Influences of Airline Brand Credibility on Consumer Purchase Intentions. J. Air Transp. Manag. 2016, 55, 1–8. [Google Scholar] [CrossRef]
  57. Ghoochani, O.M.; Torabi, R.; Hojjati, M.; Ghanian, M.; Kitterlin, M. Factors Influencing Iranian Consumers’ Attitudes toward Fast-Food Consumption. Br. Food J. 2018, 120, 409–423. [Google Scholar] [CrossRef]
  58. Annunziata, A.; Vecchio, R. Consumer Perception of Functional Foods: A Conjoint Analysis with Probiotics. Food Qual. Prefer. 2013, 28, 348–355. [Google Scholar] [CrossRef]
  59. Siró, I.; Kápolna, E.; Kápolna, B.; Lugasi, A. Functional Food. Product Development, Marketing and Consumer Acceptance—A Review. Appetite 2008, 51, 456–467. [Google Scholar] [CrossRef] [PubMed]
  60. Eertmans, A. Food Likes and Their Relative Importance in Human Eating Behavior: Review and Preliminary Suggestions for Health Promotion. Health Educ. Res. 2001, 16, 443–456. [Google Scholar] [CrossRef]
  61. Rezai, G.; Teng, P.K.; Shamsudin, M.N.; Mohamed, Z.; Stanton, J.L. Effect of Perceptual Differences on Consumer Purchase Intention of Natural Functional Food. J. Agribus. Dev. Emerg. Econ. 2017, 7, 153–173. [Google Scholar] [CrossRef]
  62. Costa-Font, M.; Gil, J.M. Structural Equation Modelling of Consumer Acceptance of Genetically Modified (GM) Food in the Mediterranean Europe: A Cross Country Study. Food Qual. Prefer. 2009, 20, 399–409. [Google Scholar] [CrossRef]
  63. Fishbein, M.; Ajzen, I. Belief, Attitude, Intention, and Behavior: An Introduction to Theory and Research; Addison-Wesley series in social psychology; Addison-Wesley Pub. Co.: Reading, MA, USA, 1975; ISBN 978-0-201-02089-2. [Google Scholar]
  64. Jaccard, J.J.; Knox, R.; Brinberg, D. Prediction of Behavior from Beliefs: An Extension and Test of a Subjective Probability Model. J. Pers. Soc. Psychol. 1979, 37, 1239–1248. [Google Scholar] [CrossRef]
  65. Yusta, A.I.; Ruiz, M.P.M.; Zarco, A.I.J. The Role of the Convenience and the Subjective Norm in the Intention of Purchase Across Internet (B2C): An Application in the Hospitality Industry. Rev. Bus. Manag. 2011, 137–158. [Google Scholar] [CrossRef] [Green Version]
  66. Hewitt, A.M.; Stephens, C. Healthy Eating among 10–13-Year-Old New Zealand Children: Understanding Choice Using the Theory of Planned Behaviour and the Role of Parental Influence. Psychol. Health Med. 2007, 12, 526–535. [Google Scholar] [CrossRef]
  67. Diamantopoulos, A.; Papadopoulos, N. Assessing the Cross-National Invariance of Formative Measures: Guidelines for International Business Researchers. J. Int. Bus. Stud. 2010, 41, 360–370. [Google Scholar] [CrossRef]
  68. Aggarwal, P.; McGill, A.L. When Brands Seem Human, Do Humans Act Like Brands? Automatic Behavioral Priming Effects of Brand Anthropomorphism. J. Consum. Res. 2012, 39, 307–323. [Google Scholar] [CrossRef]
  69. Haws, K.L.; Winterich, K.P. When Value Trumps Health in a Supersized World. J. Mark. 2013, 77, 48–64. [Google Scholar] [CrossRef]
  70. Chiu, H.-C.; Hsieh, Y.-C.; Kuo, Y.-C. How to Align Your Brand Stories with Your Products. J. Retail. 2012, 88, 262–275. [Google Scholar] [CrossRef]
  71. Diallo, M.F. Effects of Store Image and Store Brand Price-Image on Store Brand Purchase Intention: Application to an Emerging Market. J. Retail. Consum. Serv. 2012, 19, 360–367. [Google Scholar] [CrossRef]
  72. Henseler, J.; Ringle, C.M.; Sarstedt, M. Testing Measurement Invariance of Composites Using Partial Least Squares. Int. Mark. Rev. 2016, 33, 405–431. [Google Scholar] [CrossRef]
  73. Hair, J.; Hollingsworth, C.L.; Randolph, A.B.; Chong, A.Y.L. An Updated and Expanded Assessment of PLS-SEM in Information Systems Research. Ind. Manag. Data Syst. 2017, 117, 442–458. [Google Scholar] [CrossRef]
  74. Hu, L.; Bentler, P.M. Cutoff Criteria for Fit Indexes in Covariance Structure Analysis: Conventional Criteria versus New Alternatives. Struct. Equ. Model. Multidiscip. J. 1999, 6, 1–55. [Google Scholar] [CrossRef]
  75. Henseler, J.; Ringle, C.M.; Sinkovics, R.R. The Use of Partial Least Squares Path Modeling in International Marketing. In New Challenges to International Marketing (Advances in International Marketing); Sinkovics, R.R., Ghauri, P.N., Eds.; Emerald Group Publishing Limited: Bingley, UK, 2009; Volume 20, pp. 277–319. ISBN 978-1-84855-469-6. [Google Scholar]
  76. Werts, C.E.; Linn, R.L.; Jöreskog, K.G. Intraclass Reliability Estimates: Testing Structural Assumptions. Educ. Psychol. Meas. 1974, 34, 25–33. [Google Scholar] [CrossRef]
  77. Bollen, K.A.; Ting, K. A Tetrad Test for Causal Indicators. Psychol. Methods 2000, 5, 3–22. [Google Scholar] [CrossRef] [PubMed]
  78. Fornell, C.; Larcker, D.F. Evaluating Structural Equation Models with Unobservable Variables and Measurement Error. J. Mark. Res. 1981, 18, 39. [Google Scholar] [CrossRef]
  79. Bagozzi, R.P.; Yi, Y. On the Evaluation of Structural Equation Models. J. Acad. Mark. Sci. 1988, 16, 74–94. [Google Scholar] [CrossRef]
  80. Falk, R.F.; Miller, N.B. A Primer for Soft Modeling, 1st ed.; University of Akron Press: Akron, OH, USA, 1992; ISBN 978-0-9622628-4-5. [Google Scholar]
  81. Hair, J.F.; Risher, J.J.; Sarstedt, M.; Ringle, C.M. When to Use and How to Report the Results of PLS-SEM. Eur. Bus. Rev. 2019, 31, 2–24. [Google Scholar] [CrossRef]
Figure 1. Analytical model. Ha: traditional fast-food restaurant; Hb: via mobile apps.
Sustainability 13 12857 g001
Table 1. Construct and variable operationalization for survey development for the fast-food restaurant model.
Latent VariableObserved ItemsItems Description
Food Values adapted from Lusk and Briggeman (2009), Lusk (2011) [36,37]AppearanceThe extent to which food is appealing.
ConvenienceEase of cooking and consumption of food.
Environmental ImpactImpact of food production on the environment.
EquityThe extent to which all parties involved in food production equally benefit.
OrganicThe extent to which food production is without modern technologies.
NutritionAmount and type of fat, protein, vitamins, etc.
OriginWhere food products were grown.
PriceThe price paid for food.
SafetyFood consumption will not cause disease.
TasteThe extent to which food consumption is appealing to the senses.
TraditionTraditional consumption patterns preservation.
Positive Anticipated Emotions adapted from Bagozzi and Dholakia (2006) [23]HappyRestIf I can go eat a hamburger in a fast-food restaurant next month, I feel happy.
DelightedRestIf I can go eat a hamburger in a fast-food restaurant next month, I feel delighted.
ExcitedRestIf I can go eat a hamburger in a fast-food restaurant next month, I feel excited.
ProudRestIf I can go eat a hamburger in a fast-food restaurant next month, I feel proud.
SatisfiedRestIf I can go eat a hamburger in a fast-food restaurant next month, I feel satisfied.
Self-assuredRestIf I can go eat a hamburger in a fast-food restaurant next month, I feel self-assured.
Attitude Toward the Brand (ATB) adapted from Aggarwal and McGill (2012) [68]ATB1RestLike the brand.
ATB2Rest Admire the brand.
ATB3Rest The brand fits my lifestyle.
Attitude Toward Eating a Hamburger (ATEH) adapted from Haws and Winterich (2013) [69]ATEH1Rest Eating a hamburger would be pleasurable.
ATEH2Rest I would enjoy eating a hamburger.
ATEH3Rest If I eat a hamburger, it would be satisfying for me.
ATEH4Rest I eat a hamburger because it tastes good.
Subjective Norms (SN) adapted from Brinberg and Durand (1983), Izquierdo-Yusta, Martínez-Ruiz and Jiménez-Zarco (2011) [13,65]SN1RestMost of the people important to me think I should eat in a fast-food restaurant.
SN2RestMy friends think I should eat in a fast-food restaurant.
SN3RestIf my friends eat in a fast-food restaurant, I will probably do it too.
SN4RestMy family thinks I should eat in a fast-food restaurant.
SN5RestIf my family eats in a fast-food restaurant, I will probably do it too.
Purchase Intention (PI) adapted from Chiu, Hsieh and Kuo (2012), Diallo (2012) [70,71]PI1RestI would probably buy products in fast-food restaurants.
PI2RestI would consider buying a fast-food product if I have the need.
PI3RestIt is possible to buy a product in fast-food restaurants.
PI4RestThe probability of considering buying a product in a fast-food restaurant is high.
Table 2. Construct and item operationalization for survey development for the food delivery service model.
Latent VariableObserved ItemsItems Description
Positive Anticipated Emotions adapted from Bagozzi and Dholakia (2006) [23]HappyDeliveryIf I can eat a hamburger with a food delivery service via mobile app next month, I will feel happy.
DelightedDeliveryIf I can eat a hamburger with a food delivery service via mobile app next month, I will feel delighted.
ExcitedDeliveryIf I can eat a hamburger with a food delivery service via mobile app next month, I will feel excited.
ProudDeliveryIf I can eat a hamburger with a food delivery service via mobile app next month, I will feel proud.
SatisfiedDeliveryIf I can eat a hamburger with a food delivery service via mobile app next month, I will feel satisfied.
Self-assuredDeliveryIf I can eat a hamburger by food delivery service via mobile app next month, I will feel self-assured.
Attitude Toward the Brand (ATB) adapted from Aggarwal and McGill (2012) [68]ATB1DeliveryLike the brand.
ATB2DeliveryAdmire the brand.
ATB3DeliveryThe brand fits my lifestyle.
Attitude Toward Eating a Hamburger (ATEH) adapted from Haws and Winterich (2013) [69]ATEH1DeliveryEating a hamburger would be pleasurable.
ATEH2Delivery I would enjoy eating a hamburger.
ATEH3DeliveryIf I eat a hamburger, it would be satisfying for me.
ATEH4DeliveryI eat a hamburger because it tastes good.
Subjective Norms (SN) adapted from Brinberg and Durand (1983), Izquierdo-Yusta, Martínez-Ruiz and Jiménez-Zarco (2011) [13,65]SN1DeliveryMost of the people important to me think I should eat by food delivery service via mobile app.
SN2DeliveryMy friends think I should eat by food delivery service via mobile app.
SN3DeliveryIf my friends eat by food delivery service via mobile app, I will probably do it too.
SN4DeliveryMy family thinks I should eat by food delivery service via mobile app.
SN5DeliveryIf my family eats by food delivery service via mobile app, I will probably do it too.
Purchase Intention (PI) adapted from Chiu, Hsieh and Kuo (2012), Diallo (2012) [70,71]PI1DeliveryI would probably buy products by food delivery service via mobile app.
PI2DeliveryI would consider buying products by food delivery service via mobile app if I have the need.
PI3DeliveryIt is possible to buy a product by food delivery service via mobile app.
PI4DeliveryThe probability of considering buying a product by food delivery service via mobile app is high.
Table 3. Model goodness of fit for the fast-food restaurant and mobile app models.
Statistical MethodFast-Food Restaurant (A)Mobile App (B)
ValueLimitValueLimit
SRMR0.0610.05 and 0.080.0620.05 and 0.08
NFI0.748>0.90.813>0.9
Table 4. Model reliability testing for attitudes, emotions, subjective norms and intention.
Fast-Food Restaurant (A)Mobile App (B)
αrho_ACRAVEαrho_ACRAVE
Attitude Toward Eating a Hamburger0.9140.9140.9460.8530.9320.9350.9670.881
Attitude Toward the Brand0.8740.8800.9230.7990.8310.8330.8990.748
Positive Anticipated Emotions0.9060.9130.9300.7290.9160.9250.8370.749
Purchase Intention0.9190.9230.9430.8050.9350.93709530.837
Subjective Norms0.9100.9110.9330.7370.9170.9210.9410.800
Table 5. Convergent and discriminant validity of the fast-food restaurant model (A).
CRAVEα(1)(2)(3)(4)(5)(6)
Attitude Toward Eating a Hamburger 0.9460.8530.9140.924
Attitude Toward the Brand 0.9230.7990.8740.7910.894
Positive Anticipated Emotions 0.9300.7290.9060.7490.6730.854
Purchase Intention 0.9430.8050.9190.7860.7020.6880.897
Subjective Norms 0.9330.7370.9100.6780.6260.7050.7010.858
Food Values −0.3870.349−0.317−0.432−0.367Formative
Table 6. Convergent and discriminant validity of the mobile app model (B).
CRAVEα(1)(2)(3)(4)(5)(6)
Attitude Toward Eating a Hamburger 0.9570.8810.9320.938
Attitude Toward the Brand 0.8990.7480.8310.4310.865
Positive Anticipated Emotions 0.9370.7490.9160.6980.4720.866
Purchase Intention 0.9530.8370.9350.3650.4880.3130.915
Subjective Norms 0.9410.8000.9170.4910.4800.3940.4570.895
Food Values −0.3150.023−0.914−0.056−0.210Formative
Table 7. Hypotheses testing and path coefficient of the fast-food restaurant model (A).
βStandard Errort-Valuep-ValueSupported
(H1a) Positive Anticipated Emotions → Attitude Toward the Brand0.625 ***0.05311.8910.000Yes
(H2a) Positive Anticipated Emotions → Attitude Toward Eating a Hamburger0.696 ***0.03917.6700.000Yes
(H3a) Positive Anticipated Emotions → Subjective Norms0.655 ***0.04713.7940.000Yes
(H4a) Positive Anticipated Emotions → Purchase Intention0.645 ***0.04514.3450.000Yes
(H5a) Food Values → Attitude Toward the Brand−0.151 (n.s)0.1170.8540.393No
(H6a) Food Values → Attitude Toward Eating a Hamburger−0.135 (n.s)0.1321.0180.309No
(H7a) Food Values → Subjective Norms−0.159 (n.s)0.1521.0460.296No
(H8a) Attitude Toward the Brand → Purchase Intention0.134 (n.s)0.0961.3960.163No
(H9a) Attitude Toward Eating a Hamburger
→ Purchase Intention
0.442 ***0.0875.0800.000Yes
(H10a) Subjective Norms → Purchase Intention0.257 **0.0783.2770.001Yes
Note: n = 10,000 subsamples; *** p < 0.001; ** p ≤ 0.01; (n.s), not significant relationship; R2 of attitude toward the brand = 0.473, attitude toward eating a hamburger = 0.585, purchase intention = 0.681 and subjective norms = 0.520.
Table 8. Hypotheses testing and path coefficient of the mobile app model (B).
βStandard Errort-Valuep-ValueSupported
(H1b) Positive Anticipated Emotions → Attitude Toward the Brand0.495 ***0.0677.3760.000Yes
(H2b) Positive Anticipated Emotions → Attitude Toward Eating a Hamburger0.662 ***0.04813.6690.000Yes
(H3b) Positive Anticipated Emotions → Subjective Norms0.367 ***0.0725.0970.000Yes
(H4b) Positive Anticipated Emotions → Purchase Intention0.310 ***0.0694.5050.000Yes
(H5b) Food Values → Attitude Toward the Brand0.119(n.s)0.1330.8980.369No
(H6b) Food Values → Attitude Toward Eating a Hamburger−0.187 (n.s)0.1501.2450.213No
(H7b) Food Values → Subjective Norms−0.139 (n.s)0.1880.7400.459No
(H8b) Attitude Toward the Brand → Purchase Intention0.328 ***0.0843.8860.000Yes
(H9b) Attitude Toward Eating a Hamburger → Purchase Intention0.115 (n.s)0.0831.3870.166No
(H10b) Subjective Norms → Purchase Intention0.251 **0.0803.1280.002Yes
Note: n = 10,000 subsamples; *** p < 0.000; ** p ≤ 0.01; (n.s), not significant relationship; R2 of attitude toward the brand = 0.236, attitude toward eating a hamburger = 0.521, purchase intention = 0.310 and subjective norms = 0.174.
Table 9. Models’ predictive relevance.
Dependent VariablesFast-Food RestaurantMobile App
R2Q2R2Q2
Attitude Toward the Brand0.4730.3680.2360.164
Attitude Toward Eating a Hamburger0.5850.4870.5210.442
Subjective Norms0.5200.3750.1740.128
Purchase Intention0.6810.5350.3100.247
Publisher’s Note: MDPI stays neutral with regard to jurisdictional claims in published maps and institutional affiliations.

