1. Introduction
Given the increasing demand to reduce the time-to-market, while coping with continuously changing user requirements, agile development methodologies have become state-of-practice. In this context, software development is an iterative process of introducing new and updating existing features while at the same time maintaining software. This last part, i.e., maintaining software, is often overlooked during the agile life cycle. One of the most important reasons for this is that in the “speed vs. quality” dilemma, faster release cycles appear more beneficial in a short term perspective. However, in a mid- to long-term perspective, maintaining software at good quality ensures that risks are mitigated more easily, while technical debt does not “explode”, this way leading to failure or challenged (in cost and time) software projects. Given this constant change combined with the modern software paradigm that involves multiple contributors and technology stacks, the need to produce maintainable software is evident.
According to ISO/IEC 25010:2011 [
1], software maintainability is defined as the “degree of effectiveness and efficiency by which a product or system can be modified by the intended maintainers” and is composed of the following five characteristics:
Modularity,
Reusability,
Analyzability,
Testability and
Modifiability [
2]. The importance of maintainability as a quality attribute is indicated by several studies [
3,
4], which conclude that only 30–40% of the total man effort refers to development, while the remaining 60–70% refers to purely maintenance costs. This is also more than evident considering the fact that 90% of the software life cost is related to its maintenance phase [
5]. At the same time, software sustainability is defined as “the capacity of the software to endure in time” [
6], which is closely related to software maintainability and may even use the same ISO definitions to be quantified [
7]. It is, thus, obvious that improving software maintainability directly improves software sustainability and so the need for methodologies and tools to assess and understand maintainability emerges.
Given the importance of maintainability towards achieving effective software development, various metrics have been proposed that can be used as the information basis upon which maintainability predictors and evaluators can be built. While various systems have been proposed that quantify maintainability from different perspectives, most of these systems assess maintainability on a snapshot of the source code, do not provide explainability on the reasons why maintainability is poor and do not capture the rate that the maintainability is degrading.
In this work, we propose a continuous maintainability evaluation methodology that is explainable and provides actionable insights to software engineers. The proposed methodology is based on the primary source code properties and the static analysis metrics they consist of in order to identify software components that will eventually become non-maintainable. Our approach employs data residing in code hosting platforms to create the ground truth, upon which the progressing behavior of the software quality metrics will be analyzed. The upward trend, along with the actual value of the metrics of a component that has proven non-maintainable (has been dropped from the project it belongs to for quality-related criteria) can provide valuable information and be the basis for actionable recommendations towards the developers.
To this end, we extend our previous methodology proposed in [
2]. There, we proposed a methodology for evaluating the maintainability degree of a software package over time on a per release basis. Specifically, we examined each new release and evaluated the static analysis metrics regarding the primary source code properties per release. Our current work differentiates from the previously proposed methodology in various axes. First, the analysis of the static analysis metrics is performed on a weekly basis and not per release, which goes hand in hand with the actual development process followed by the developers, since new functionality is usually added constantly at the development stage (on a weekly or biweekly sprint basis). Additionally, we propose the evaluation of the maintainability degree at a class level, since it follows the way the developers actually organize their functionality, without the need to aggregate metrics, which is a vital step of the package-level analysis. To that end, we will also refer to the single class under examination as a software component. The use of classes as the base of our approach introduces the need to examine different metrics and create different models. Finally, while in [
2] the only selected feature that is used to train the different models is the trend of each single metric over time; here, we argue that the final value of each metric (i.e., the value of the metric in the last examined week) can also provide valuable information about the (non)maintainability of the software artifact (which is now defined as a class software component).
The rest of this paper is organized as follows.
Section 2 reviews current literature approaches on maintainability evaluation using static analysis metrics, while
Section 3 defines non-maintainability and presents the concepts included in our analysis.
Section 4 describes the designed methodology along with the benchmark dataset and the training procedure of the proposed maintainability evaluation models, while
Section 5 evaluates our methodology on a set of diverse axes. Finally,
Section 6 examines the limitations that threaten the validity of our system, and
Section 7 provides insight for further research and concludes this paper.
2. Related Work
The importance of maintainability as a quality attribute along with its widely recognized value as a way to manage technical debt has drawn the attention of researchers for years [
2,
8,
9]. Various approaches suggest employing code metrics as a way to quantify the extent to which a software component is maintainable. One of the most dominant approaches proposed is the “maintainability index” [
10], which aggregates the Halstead Volume (HV), Cyclomatic Complexity (CC) and Lines of Code (LOC) metrics. Various studies use the maintainability index (MI) as is [
10,
11,
12] or modify it [
13] in order to best fit the empirically validated results. However, its applicability and accuracy are under discussion since it uses fixed thresholds which are both project and technology dependent [
8].
Estimating software maintainability through static analysis metrics is a non-trivial task and often requires the aid of quality experts to manually examine the source code. Obviously, the manual examination of source code can be very tedious, or even impossible for large and complex software projects and/or projects that change on a regular basis. This is the case for the vast majority of today’s projects, given the constantly increasing demands both in terms of functional and/or non-functional requirements. On top of that, using pre-defined thresholds has a negative impact on the ability of the constructed maintainability evaluations models to generalize as they fail to incorporate the individual characteristics of each software project under evaluation.
In an effort to overcome such restrictions, researchers have proposed deriving metrics thresholds and/or acceptable intervals by applying machine learning techniques on benchmark repositories [
14,
15,
16,
17,
18]. These techniques involve fitting the values of metrics into probability distributions [
19], performing ROC Curve analysis [
20] or even bootstrapping [
21]. Additional maintainability evaluation approaches suggest the usage of Artificial Neural Network (ANN) models [
9] and Adaptive Multivariate Regression Splines (MARS) [
22].
In the same context, Schnappinger et al. [
23] resorted to engaging experts in order to manually label a set of data regarding their maintainability degree and made use of a set of various metrics to evaluate maintainability. Other recent research works examine various metrics and approaches for evaluating maintainability, such as the examination of open source projects and their maintainability degree [
24], the combination of machine learning techniques such as the Bayesian networks and association rules [
25], the use of soft computing techniques such as the neuro-fuzzy model [
26] or employing ensembles to predict maintainability on imbalanced data [
27]. Other approaches involve the analysis of software releases as a way for evaluating the maintainability degree of software. Samoladas et al. [
28] examine the maintainability degree of open-source software projects by investigating how the maintainability index (MI) changes over the releases.
However, all approaches are still confined by the empirical evaluation of the software projects towards the formulation of the necessary ground truth, which involves determining the software components that are non-maintainable.
In order to overcome the aforementioned limitation, our previous approach involves employing information residing in online software repositories and combining it with the values of static analysis metrics [
29]. Although using metrics can provide useful information regarding the maintainability degree of software components, it is still restricted by the fact that it can only identify non-maintainability after its occurrence, and thus, it is unable to act in a preventive manner.
In this context, in an effort to predict non-maintainability at an earlier stage, we resort in performing a full life cycle analysis across releases that harnesses the progressing behavior of various static analysis metrics, which quantify certain primary source code properties towards evaluating the degree to which a software component is maintainable. In [
2], we proposed a maintainability evaluation methodology, based on software releases, which identifies non-maintainable packages at an earlier stage. The evaluation of the maintainability degree is performed at package level and on a per release basis. Specifically, the releases of a software project are examined, and the primary code properties are evaluated. The values of these metrics form a time-series over releases, which is then analyzed in order to calculate the trend of each property over time. Finally, a model is created per each property, which aspires to identify components that eventually become non-maintainable.
In this work, we aspire to extend our previous methodology proposed in [
2]. To that end, the contributions of this paper span the following axes:
Obviously, the evaluation of the maintainability degree per release of the software project can provide stability, since a software release contains only completed functionalities and architectural design choices and resembles an actual maturity level. However, such a choice may have certain inherent weaknesses. The release schedule that is followed in projects is usually not stable in time, which could bias the models and result in false positive predictions. We consider that an analysis per week is more proper and goes hand-in-hand with the actual development schedule the developers follow. Following this approach, one can identify low degrees of maintainability at the time they occur and provide actionable, yet on time, recommendations.
At the same time, the maintainability evaluation in [
2] is performed at a package level, since the fluctuations in class-level static analysis metrics can lead to less accurate results. Although true, one may argue that these fluctuations come from the way the developers actually produce software, working on classes separately. Thus, it is a valid hypothesis to assess maintainability from a developer’s perspective and identify non-maintainable components at class level. Additionally, the averaging that takes place during the calculation of the static analysis metrics at package level flattens the distribution of the metrics, causing many times the loss of valuable information.
Finally, while the trend of a static analysis metric can be a good indicator of the maintainability degree of the metric, it may not be adequate enough to indicate non-maintainability. The final value of each software quality metric should also be taken into account, as it reflects the current status of the software component’s maintainability. Combining the current value of the static quality metrics along with their trends can provide significant predictive ability to designate non-maintainability in advance.
In this work, we further extend our previous work [
2] in order to include the aforementioned modifications. Specifically, we employ data from code hosting platforms, as well as their static analysis metrics, in order to examine the progressing behavior of these metrics on a per week basis. Many models are created that aspire to evaluate the maintainability degree of a class derived from the trend of its software quality metrics and the actual values these metrics appear. Different models are built for the evaluation of the (non-)maintainability of a software component upon each metric, as well as the aggregation of the decisions of these models upon each primary source code property. Finally, a general model aspires to provide the final evaluation of the maintainability degree of a software component, based on the respective predictions of the property models.
3. Quantifying Non-Maintainability Using Metrics Trends
In this section, we analyze the basic concepts that are connected to maintainability and constitute our approach to evaluate the maintainability degree of a given component. We discuss the definition of maintainability (and non-maintainability), as well as its interconnection with software quality metrics.
Following the ISO/IEC 25010:2011 standard [
1], the maintainability degree of a software component is composed by various sub-characteristics;
Modularity,
Reusability,
Analyzability,
Testability and
Modifiability, which are described at length in [
30]. While a lot of different metrics have been proposed that could constitute predictors for evaluating maintainability, we only select metrics that correspond to primary source code properties that are closely related to the quality characteristics proposed in the aforementioned standard, which are the
Complexity,
Cohesion,
Inheritance and
Coupling properties.
In [
2], we depict the relation that appears between the selected primary source code properties and the quality characteristics that are related to maintainability. We argue that
Coupling and
Inheritance affect all of the quality characteristics with a negative impact, while
Cohesion has a positive influence on all of them (i.e., the greater the value of the Cohesion property, the stronger the characteristic).
Complexity only affects
Analyzability,
Modifiability and
Testability in a negative manner (the lower the degree of Complexity is, the more maintainable a software component is).
While the static analysis metrics provide a good reflection of the current status of the software component under inspection, examining the progressing behavior of these metrics can provide predictive ability and power. We argue that the identification of metrics that appear to have a negative trend over time (have the tendency to get worse) lead to actionable recommendations that could help the developers take action before the component becomes non-maintainable and is dropped. Additionally, as already mentioned, we claim that the design choice of examining the progressing behavior of the metrics not per release but per week can identify non-maintainable components at the time they occur.
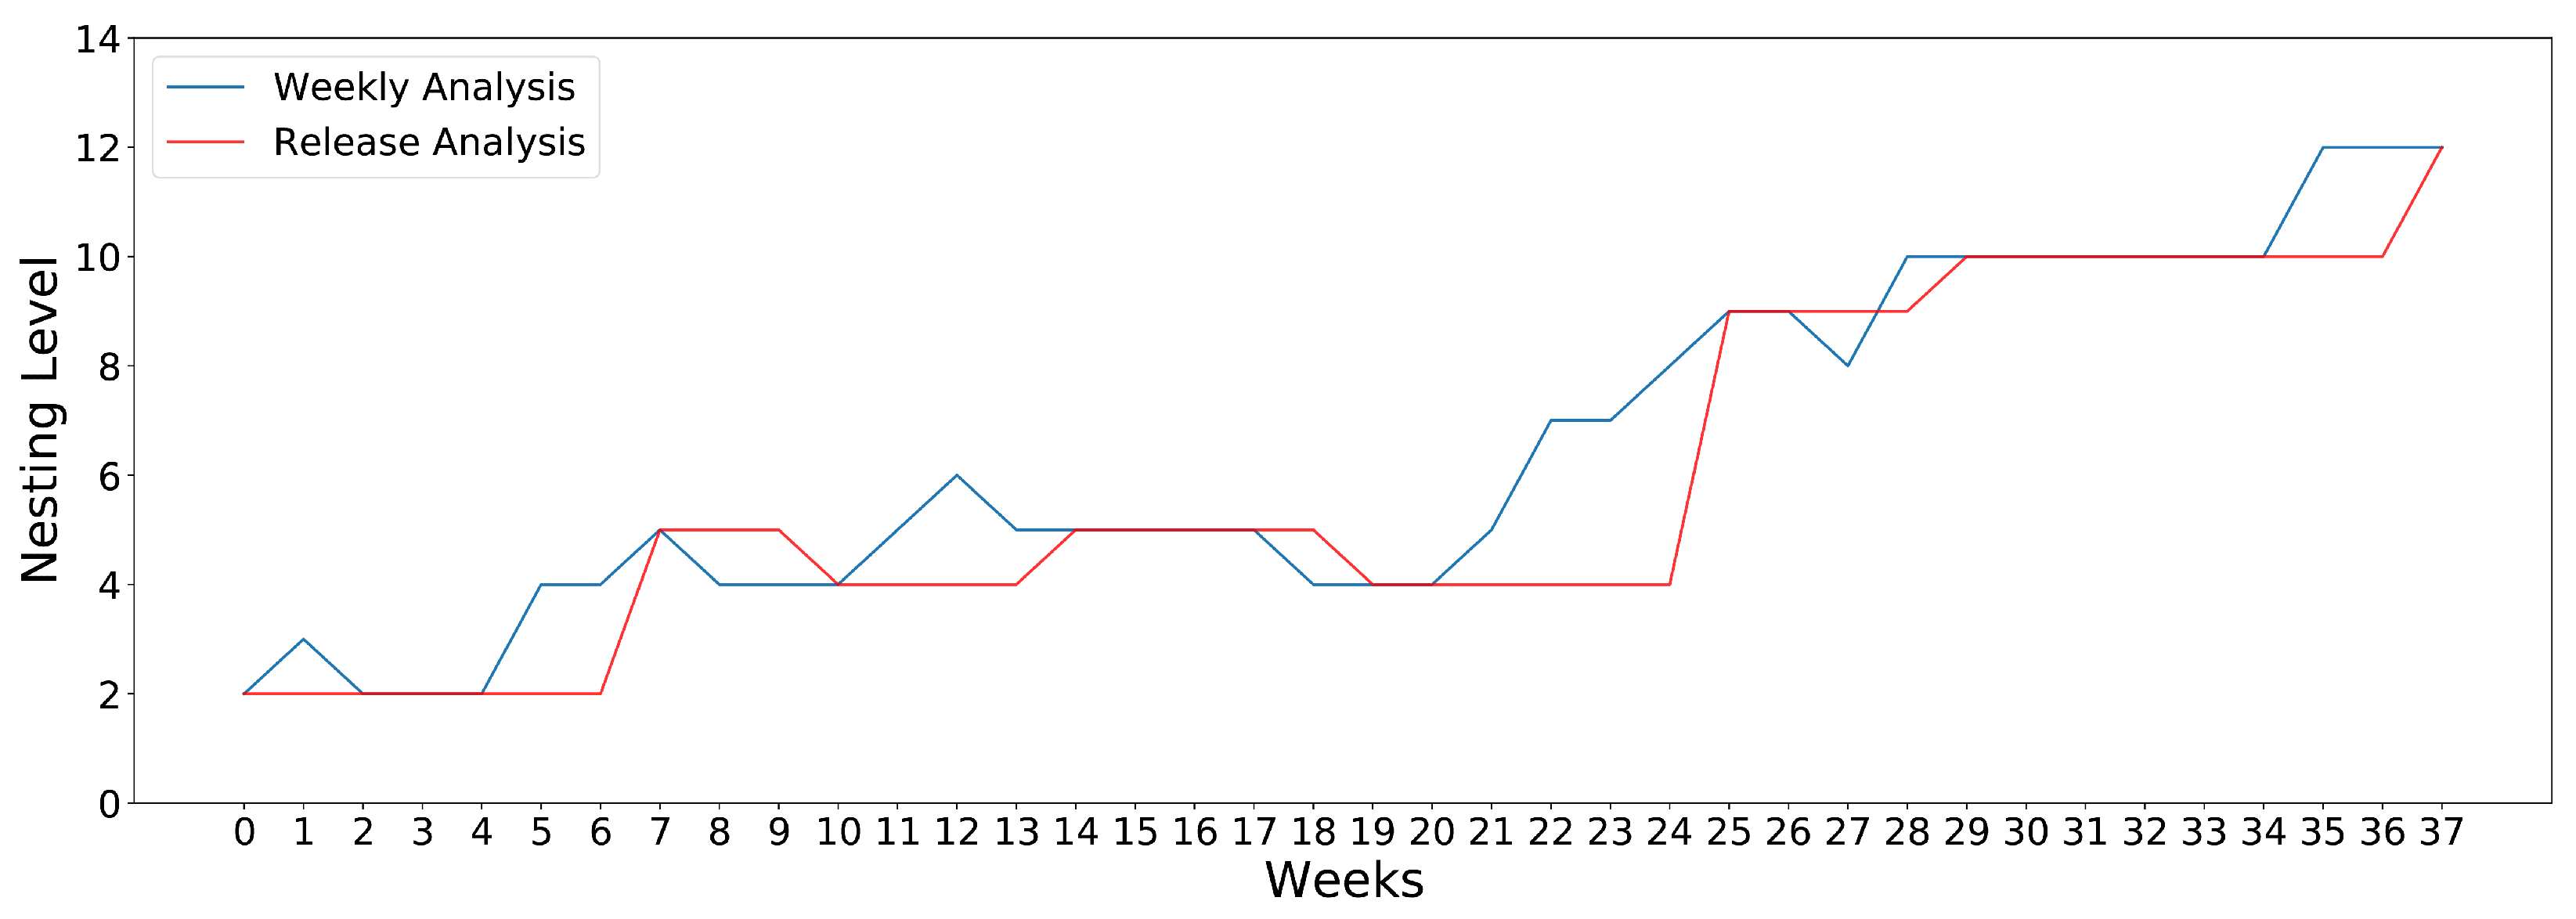
Figure 1 illustrates the degree of the
Nesting Level (NL) metric of a given class selected randomly from our dataset, as it is calculated by an analysis performed on a weekly basis and the respective one performed after each software release. The blue line reflects the NL of the class as it is measured on a weekly analysis, while the red line refers to the NL calculated at each software release. It is obvious that the analysis per week is able to identify fluctuations that, given that software releases are performed at random times, they are unable to point out.
In this work, we employ data residing in code hosting platforms in order to analyze the progressing behavior of the software quality metrics that affect the primary source code properties and influence maintainability. Towards evaluating maintainability and identifying non-maintainable classes, we argue that components that have been dropped and left out of the project can be used as a good indicator in combination with requirements set from the quality point of view. A component that has been dropped from the software projects that are examined not for functionality-related issues but due to non-maintainability can provide useful information about the progressing behavior of the software quality metrics until non-maintainability.
Table 1 depicts the primary source code properties along with the main static quality metrics they consist of. These metrics have been the basis upon which our maintainability evaluation methodology has been built.
4. Materials and Methods
In this section, we present our maintainability evaluation methodology that aspires to assess the maintainability degree of software components based on specific source code properties. As already mentioned before, our analysis is performed at a class level, so we aspire to identify each class that eventually becomes non-maintainable.
4.1. Overview
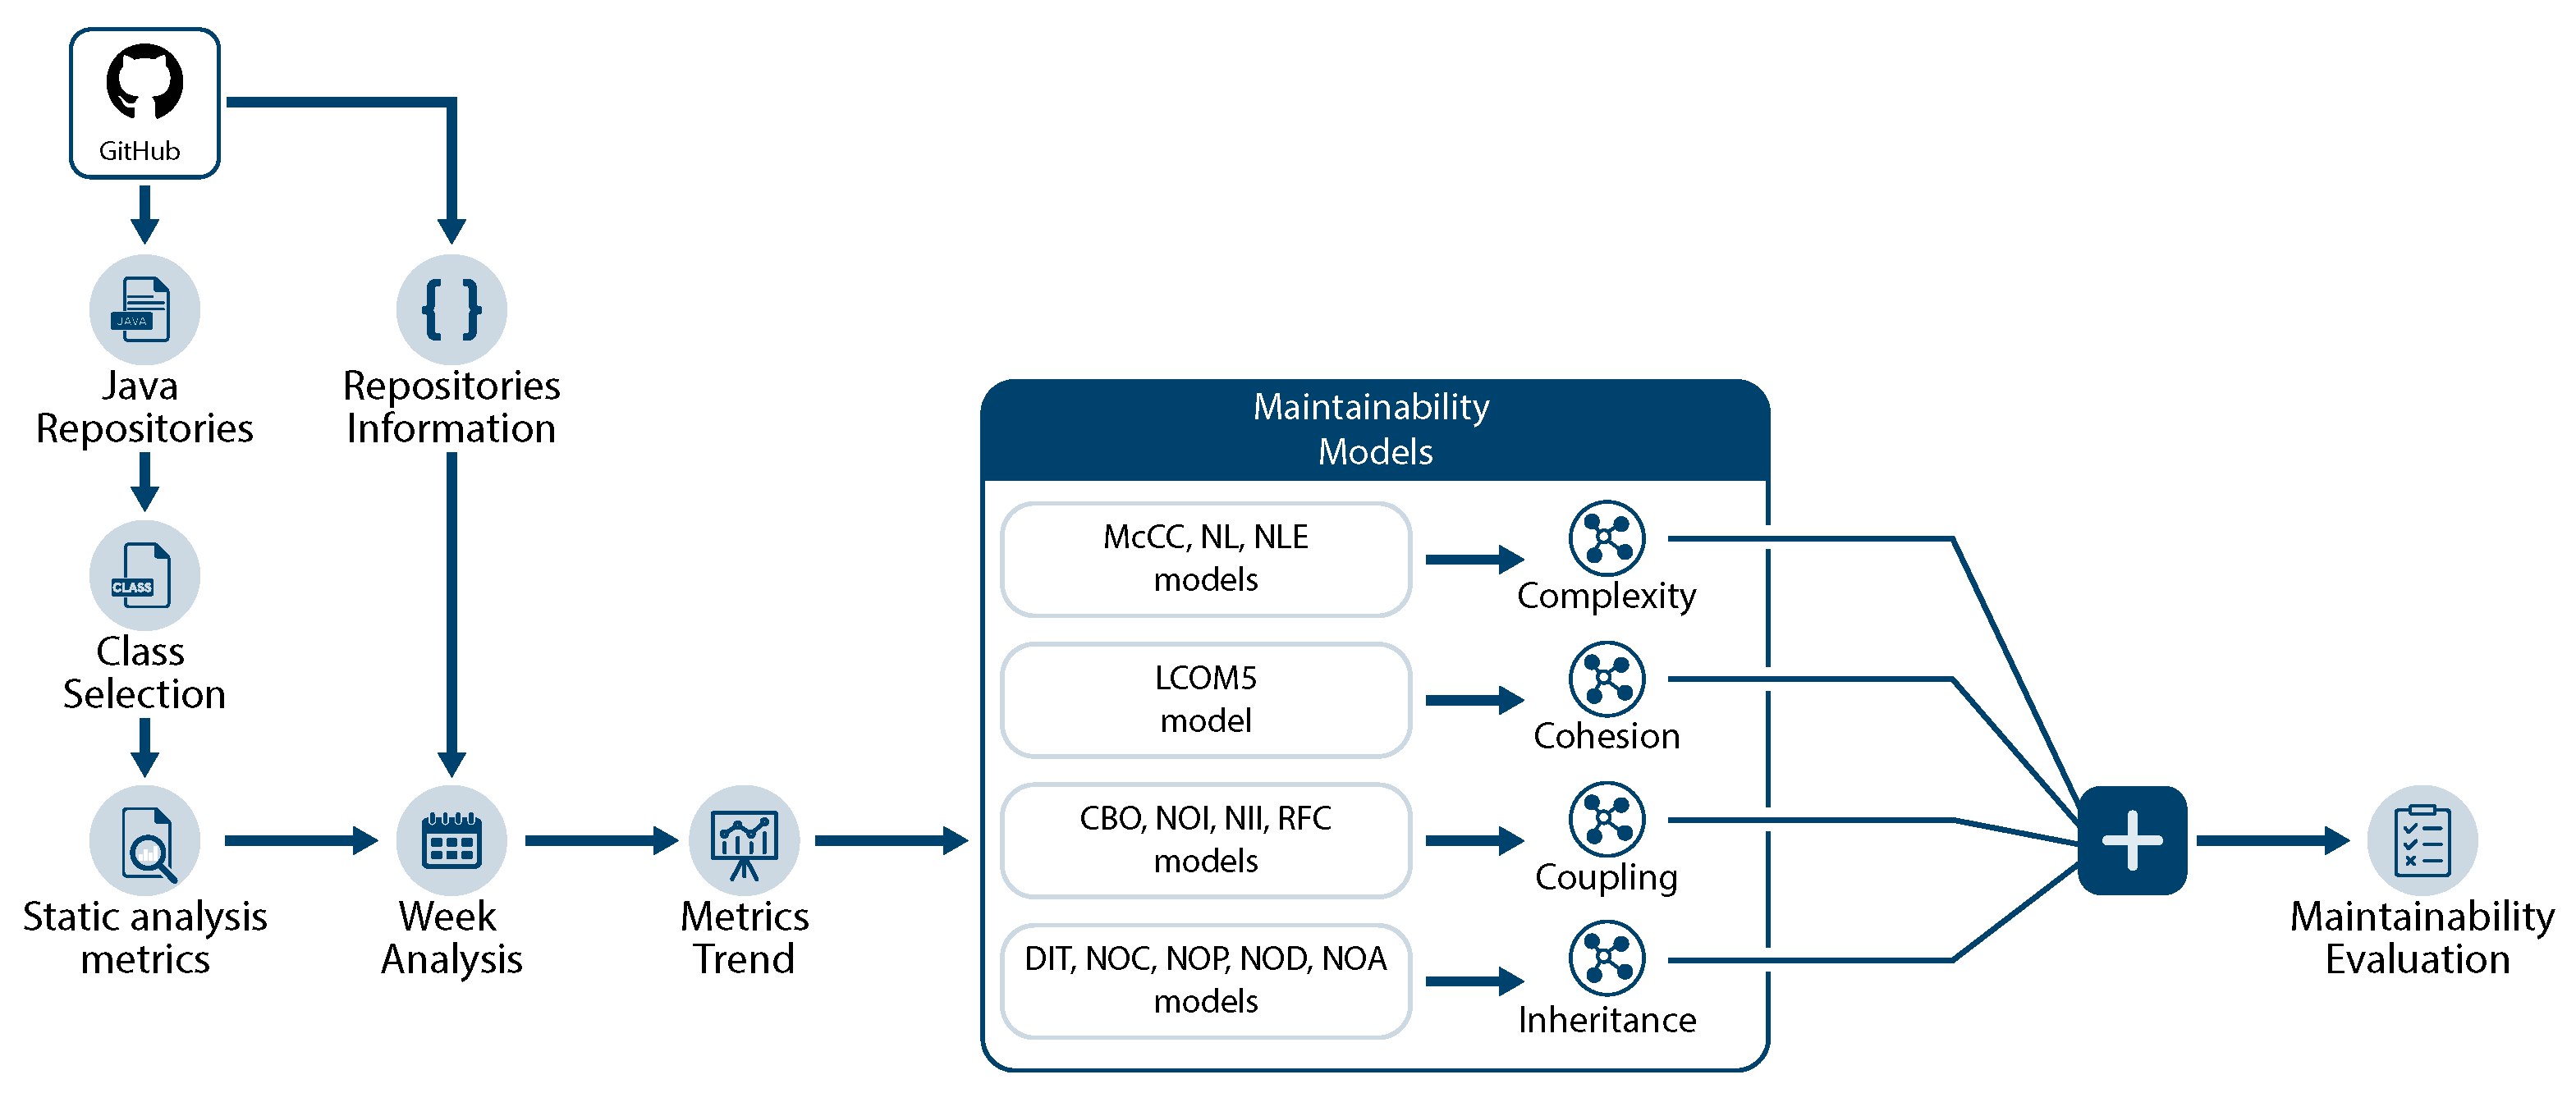
Our analysis towards evaluating maintainability of software components is illustrated in
Figure 2 and it comprises multiple steps. First, we retrieve the necessary information from popular Java repositories from GitHub (
https://github.com/, Access Date: 19 November 2021). Using this information for each repository, we extract the set of classes that are included in the project, as well as the information about when each class first appeared in the project and the last week it existed within the repository, i.e., the
life cycle of each class. In the next step towards the maintainability evaluation of each class, we perform static analysis at class level, in order to calculate the static analysis metrics of the primary source code properties that are highly related to maintainability:
complexity,
cohesion,
inheritance and
coupling. The maintainability degree of each class is assessed based on these source code properties.
Having calculated the static analysis metrics for each class of the software projects, in the next step, we calculate the trend of each metric across the weeks the class “lived” in the project. The trend reflects the progress of each class across weeks and can provide valuable information about the maintainability of the class. With the trend information about each class, the class life cycle details and the actual values of the static analysis metrics of each source code property, we can create our models, evaluating maintainability from each metric’s perspective. Then, we combine the maintainability “score” provided by the modeling of each of the static analysis metrics by creating a separate model for each primary source code property, i.e., the complexity model, the cohesion model, the inheritance model and the coupling model. Our design choice for training different models for each static analysis metric firstly and for each primary code property secondly relies in the fact that we want to provide useful and actionable recommendations to the developers that can be interpreted easily and lead to maintainability improvements of the software project under evaluation. Finally, in the last step of our approach, we aggregate the output of the four models into a single score that reflects the maintainability degree of the class and predicts whether the class will be dropped soon due to maintainability-related inability to sustain.
4.2. Dataset
Towards creating our system, we need to employ a dataset that contains a set of different projects along with the static analysis metrics calculated for every class of the software components. The projects need to exhibit some characteristics: They should have a long life cycle (i.e., number of weeks the project is active and under development), a number of different contributors that vary between them and a large number of different classes. At the same time, the number of issues opened and closed per week needs to be taken into account, as it depicts that new features are introduced constantly, while the project is always under maintenance. We select three repositories as representative for building the benchmark for our methodology that exhibits the defined characteristics:
antlr4 (
https://github.com/antlr/antlr4, Access Date: 19 November 2021),
aws-sdk (
https://github.com/aws/aws-sdk, Access Date: 19 November 2021) and
grails-core (
https://github.com/grails/grails-core, Access Date: 19 November 2021).
Table 2 depicts some statistics about the selected projects as they are calculated across their life cycle.
The three selected projects contain a quite large amount of classes, which span across a long project’s life cycle. There is a big number of classes that have been dropped at some point in the software’s “life”, which can constitute our ground-truth towards identifying components that eventually become non-maintainable and can be used to train our models. Additionally, the number of contributors varies between the selected projects in an attempt to examine projects developed by a varying number of developers and, thus, different characteristics appear. The dataset is publicly available (
https://doi.org/10.5281/zenodo.5539789, Access Date: 19 November 2021).
As has already been mentioned before, our methodology is applied at a class level and on a per week basis. As developers work and complete tasks almost per week, the evaluation of the maintainability degree of the software components they develop at a similar interval could provide actionable and applicable results towards the identification of the components that could result in being non-maintainable.
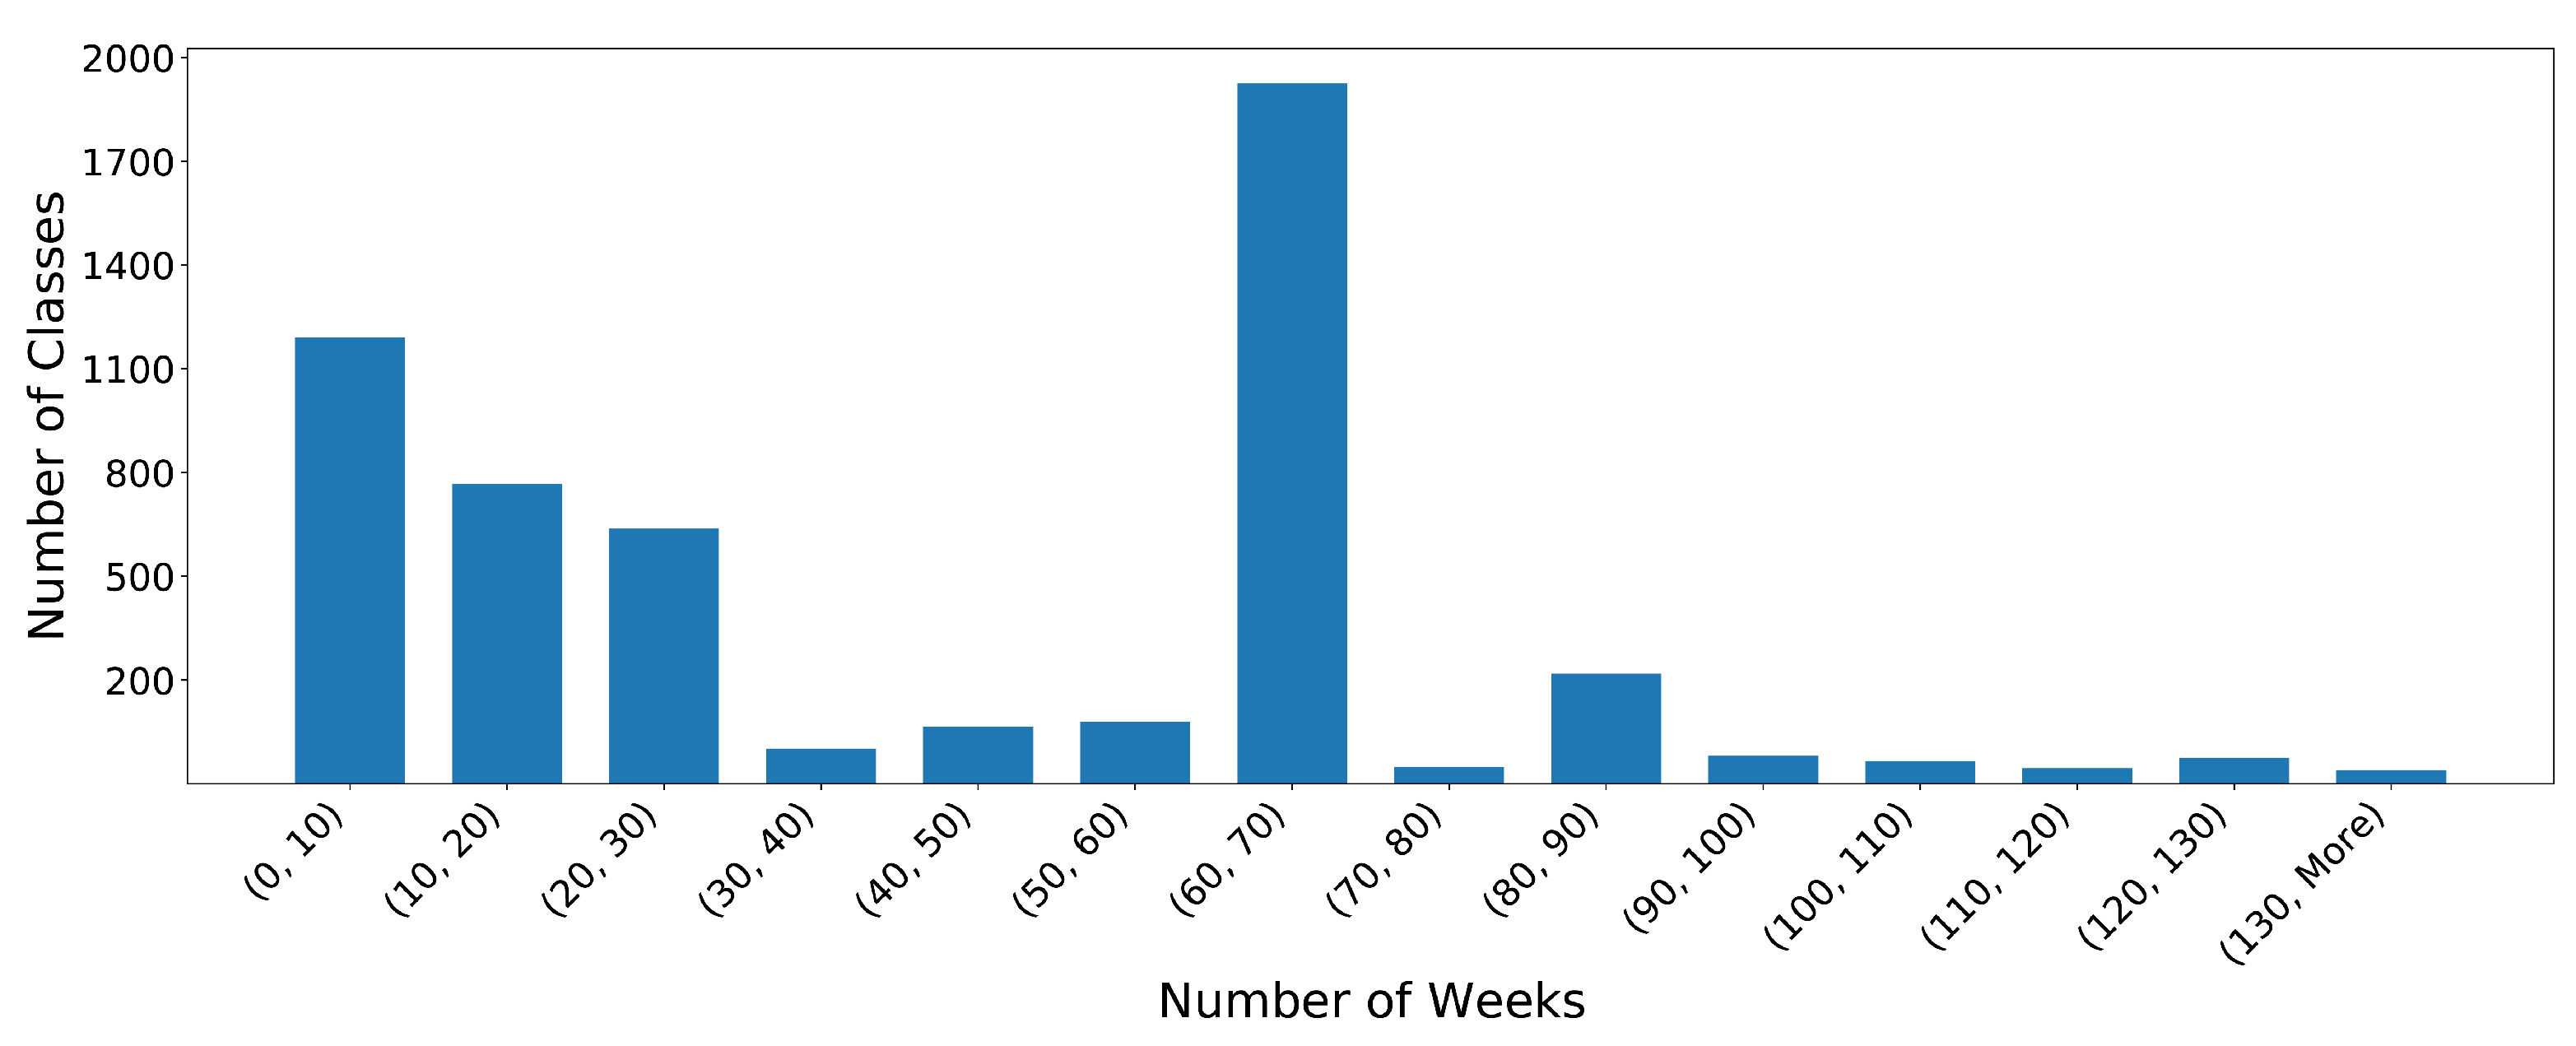
Figure 3 presents the histogram of the length in weeks of the life cycle of all the classes from the three selected projects. The life cycle of a class is easily found by identifying the first and the last week the class exists in the static analysis metrics of the dataset.
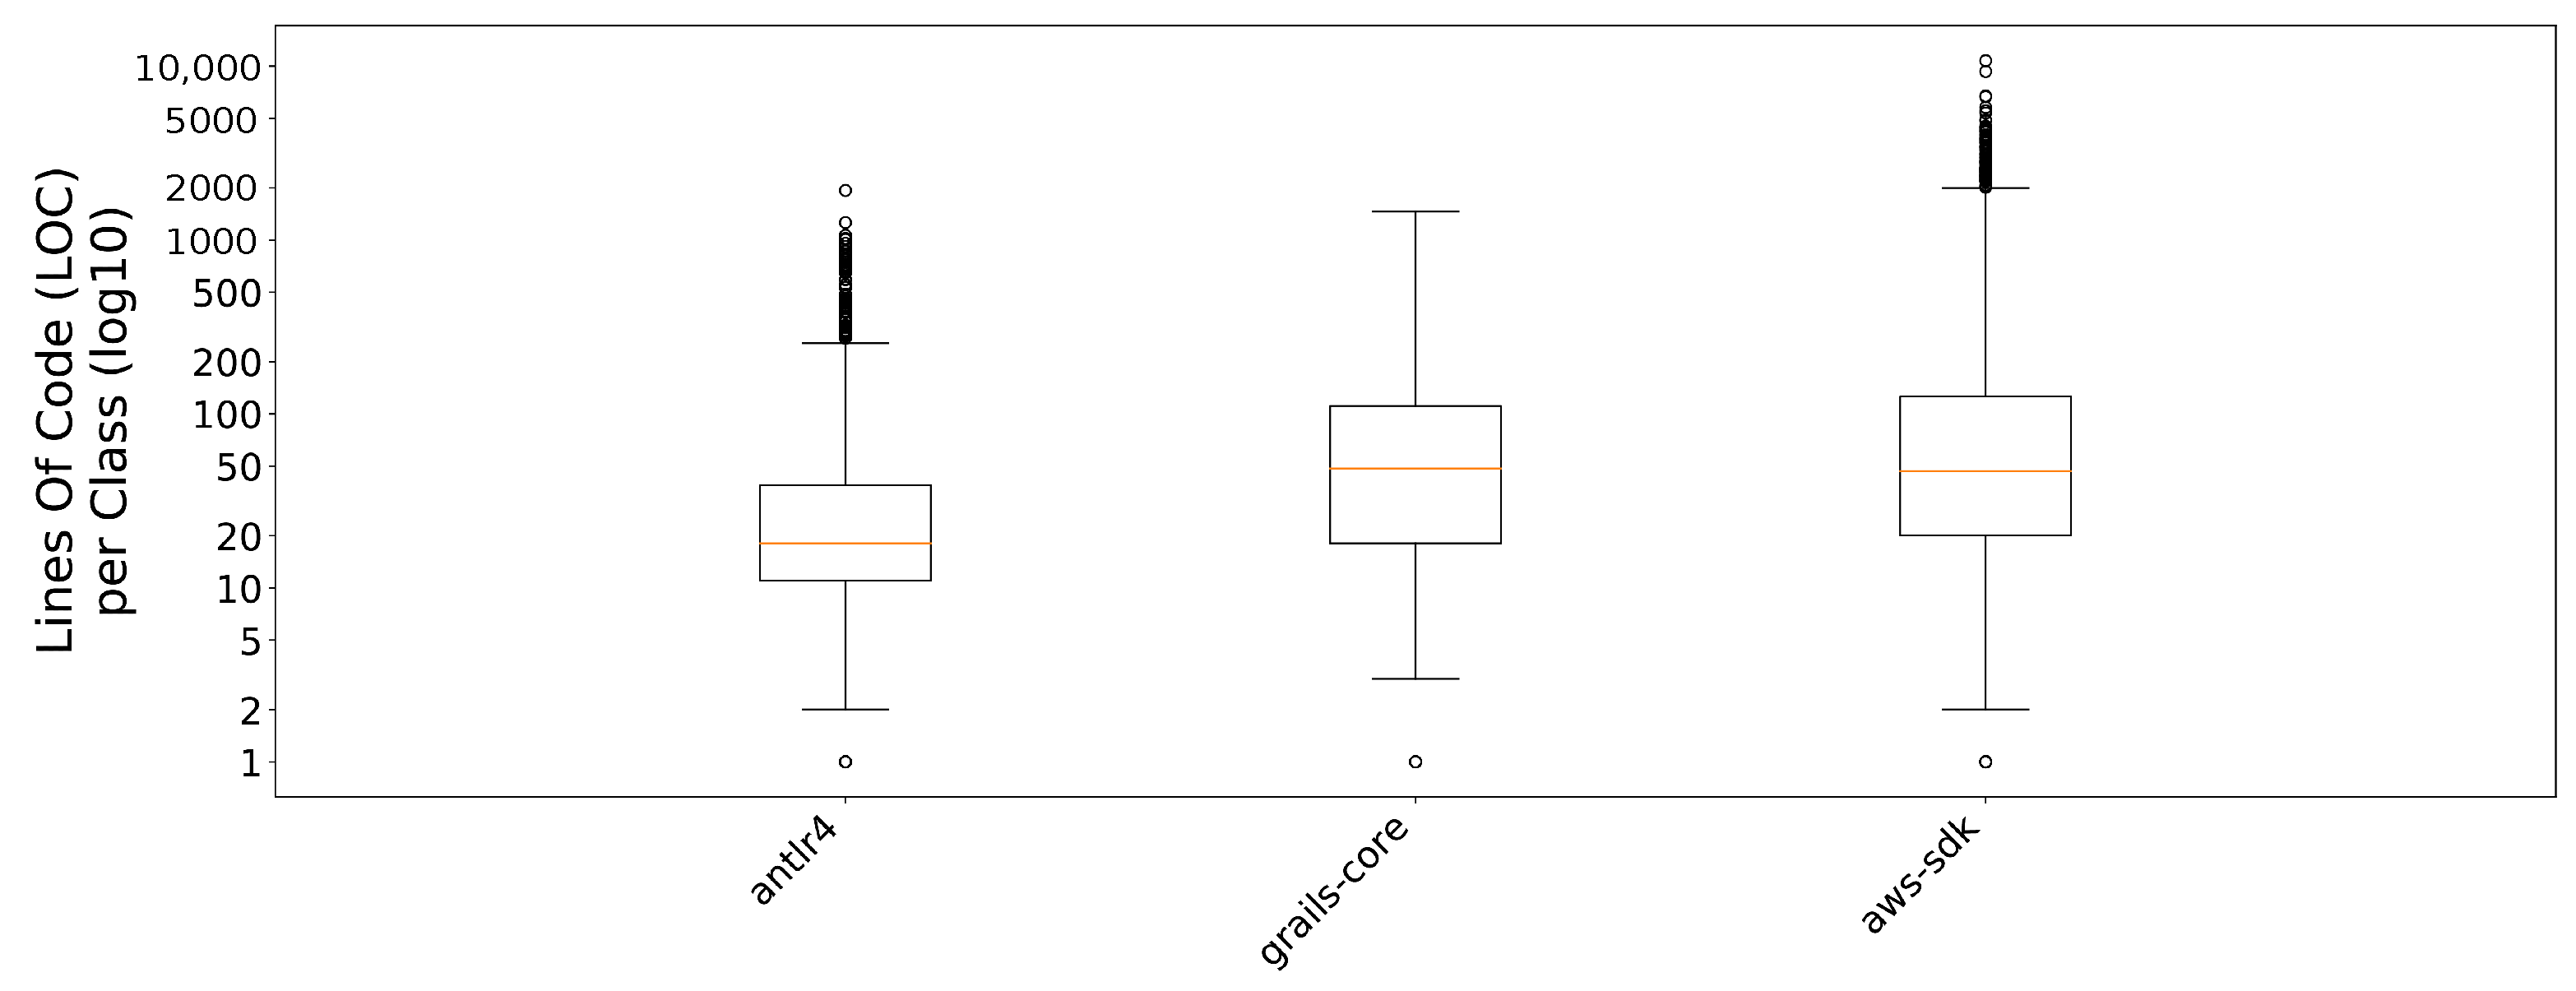
Figure 4 illustrates the distribution of the average lines of code per class (in logarithmic scale) for the three different projects. The diversity both in the size of each software component and in the number of weeks the class has been active and under development can provide a generalization capability to our models.
4.3. Preprocessing
After creating our dataset by collecting all classes from the projects antlr4, aws-sdk and grails-core, as well as their static analysis metrics, we need to process the data before applying our models. First, we identify the classes that have been dropped at some point of the project development time span, which will be used in the next steps of our modeling procedure. Next, we filter the data in order to detect classes that have not been dropped due to maintainability issues, discard these occurrences and eliminate biases. Additionally, we inspect the evolution of the static analysis metrics over time, compute the trends and, finally, we examine the trend coefficients in order to discard any outliers that could bias the models.
The identification of the classes included in the three projects that have been dropped at some point can be easily accomplished by making use of the static analysis information and the weeks the name of each class appears on the dataset. Each class that does not exist in a specific week of the software component under examination constitutes a possible candidate for the non-maintainable classes.
As software classes can be dropped for various other reasons, such as change in functionality or design choice, and not only for maintainability reasons, we need to examine whether a class that has been dropped is, indeed, non-maintainable. To that end, we apply a series of different filters to discard classes that were dropped for not maintainability-related issues.
First, we filter out classes that do not have at least one of the static analysis metrics with a positive trend. As all of the examined static analysis metrics affect maintainability in a negative manner, a positive trend indicates a decrease in the metric and, thus, a decrease in class maintainability. Consequently, a class that appears to have all of its static analysis metrics improving over time is probably dropped due to changes in features, obsolete functionality or other reasons with no quality-related criteria. On the other hand, a class that has at least one metric that becomes worse over a long period of time constitutes a probable candidate for the non-maintainable classes, especially when this period is long enough.
Additionally, we keep only the classes that appear in the project for at least four weeks before being dropped. This design choice is based on the fact that classes that are dropped in less than a month usually constitute one-off components, which are discarded due to change in functionality. A class that exists within the project for a long time constitutes a basic component of the software development process, implements core functionality and they can possibly be dropped due to maintainability reasons.
Finally, we identify classes that are identical and provide the same functionality based on the examination of the static analysis metrics and code cloning detection techniques in order to exclude the cases where a class has been renamed or has been placed in another directory over time.
Having identified the non-maintainable classes, the next step of our approach involves the computation of the trend of each metric. The metrics that refer to a specific class and are calculated on a weekly basis constitute a time-series of values, which refers to the evolution of the metric over time. We can approximate this time-series with a linear regression approach, which can be used to calculate the trend of a metric based on the following equations:
In Equation (
1), the approximation
of the real metric value
is calculated with response to a specific week
, where
refers to the slope and
to a constant factor. The approximation coefficients
and
are calculated with regard to minimizing the sum of squared error from the trend line, calculated in Equation (
2). These equations differ from the respective ones defined in [
2] on the basis upon which these values are calculated. While in [
2], these values refer to a release basis, the aforementioned equations are calculated on a weekly basis.
From the trend calculation described above, we make use of the slope
of the trend line, as it refers to the tendency of each quality metric to increase. However, the upward trend of a metric may not be adequate enough to indicate non-maintainability, as, in many cases, the actual value of the metric itself can also provide useful information. For example, a high value of
McCabe’s Cyclomatic Complexity [
31] can be a significant sign of non-maintainability, even with a small trend. Consequently, we also make use of the current value of the metric as an additional input to our models for evaluating maintainability.
In the last step of our preprocessing stage, we need to examine the generated trends for each metric and apply some filters in order to eliminate any outliers that could bias the models. To that end, we calculate the 1% and the 99% quantiles of both the final values of the metrics and the slopes of the trend lines and discard any class whose values are beyond these limits.
4.4. Models Construction
In the previous steps of our approach, we have identified the classes that have been dropped due to maintainability issues. In the next step, we construct our models, training a different model for each static analysis metric from the list of quality metrics of
Table 1. We select to use different models for each metric, as our primary target is the creation of a system that can effectively provide actionable recommendations to the developers, allowing them to easily interpret the results and apply targeted maintainability-related fixes to their software components. For the modeling procedure, we select the Support Vector Machines One-Class (SVMs One-Class).
The identification of a maintainable class is not a trivial task, and safe conclusions cannot be made, since a class that exists within a project even in the final analyzed week could be dropped in the next week of development. Thus, we can only identify the non-maintainable classes, that have been dropped within the software development procedure. Thereby, we select to use one class models (specifically the SVM One-Class models) that aspire to identify classes that cannot be maintained.
Table 3 depicts the number of non-maintainable classes identified for each static analysis metric from the three selected projects described above and the complete set of classes they contain. From the Table, we can easily notice that the
McCabe’s Cyclomatic Complexity (McCC), the
Coupling Between Object classes (CBO) and the
Response set For Class (RFC) are the metrics with the most identified non-maintainable classes.
For the tuning of the meta-parameters of each SVM One-Class model, we perform a grid search among all possible values of the
and
parameters of the model. The
parameter corresponds to the fraction of training errors and support vectors, while the
parameter is the kernel coefficient that reflects the distance in which a training sample influences new samples under prediction. The final selection of the meta-parameters is based on minimizing the percentage of False-Negative (FN) decisions of the model.
Table 4 depicts the final values of the meta-parameters for each model, along with the percentage of FNs.
The percentages of False-Negative predictions in the static analysis metric models are significantly small, and they appear to have slightly higher values in the models that include only few training samples, e.g., the NOD model. However, all the SVMs One-Class can model the non-maintainability of a class based on a static analysis metric with a quite high accuracy.
The models created for each static analysis metric can evaluate the maintainability degree of a class component from the metric’s point of view and output a score that reflects their prediction on whether the examined class will be dropped. In the next step, we aggregate the decisions of each metric’s model by creating a model for each primary source code property and, specifically, for
complexity,
cohesion,
inheritance and
coupling. Each of these models evaluate the maintainability degree of a component based on the software quality metrics it contains, which are listed in
Table 1. The creation of these models follows exactly the same procedure described above for the metrics models.
Table 5 depicts the number of non-maintainable classes identified per each primary source code property.
The meta-parameters
and
of the SVM One-Class model were once again selected based on grid search and the percentage of False-Negative predictions.
Table 6 depicts the selected meta-parameters and the percentage of FNs for each model for the primary source code properties.
The trained maintainability evaluation models, based on different primary source code properties, appear to have quite low percentages of False-Negatives and are able to identify non-maintainable classes that will be dropped. The complexity model contains three static analysis metrics: NL, NLE and McCC. The selected meta-parameters values for and are and , respectively, and the percentage of false negatives is . The cohesion model includes only the LCOM5 metric, and the meta-parameters and have the values of and , respectively, while the FN percentage is . The inheritance model consists of 5 different software quality metrics, which are DIT, NOC, NOP, NOD and NOA. The percentage of false negatives is , and the values of the meta-parameters are for and for . Finally, the coupling model contains 4 metrics: CBO, NOI, NII and RFC. The selected values for the meta-parameters and are and , respectively, while the percentage of false negatives is .
The last step of our approach involves the aggregation of the maintainability evaluations of the four primary source code properties and the decisions of the respective models into a final maintainability evaluation that reflects the probability of a class to be dropped. The procedure remains the same; each source code property model outputs its score that reflects its prediction on whether the examined class will be dropped based on the quality characteristic under examination. These scores are given as input into the final SVM One-Class model, which models the probability of a class being dropped according to all of the examined static analysis metrics and source code properties.
Table 7 depicts the number of non-maintainable classes that were identified, meeting the requirements set for each metric and property.
A grid search is once again performed in order to select the optimal
and
meta-parameters for the final model based on the optimal number of false positives.
Table 8 depicts the selected meta-parameters and the percentage of false positives for the general model.
The general model aggregates the decisions made by the four primary source code properties models; complexity, cohesion, inheritance and coupling. The selected values for the and parameters are and , respectively, while the percentage of false negatives is .
5. Methodology Evaluation
In this section, we present the assessment of our proposed methodology for evaluating maintainability in software components and identifying non-maintainable classes. The evaluation is performed on two axes. First, we assess the ability of our designed system to evaluate the maintainability degree of classes from various randomly selected projects, as well as the ability to identify the non-maintainable ones from a quality perspective. Consequently, we evaluate the effectiveness of our approach in practice and, specifically, in predicting non-maintainability before it actually happens.
5.1. Maintainability Evaluation
With respect to evaluating the effectiveness of our proposed methodology, we analyze the ability of our system to assess maintainability and identify non-maintainable classes from a quality perspective. To that end, we randomly select a number of classes and extract their static analysis metrics over the weeks the class existed in its project. These metrics are provided as input to our system, which evaluates the maintainability degree of the component based on all metrics and predicts the (non-)maintainability of the examined class.
Table 9 depicts the first class under examination, called
AuthorizationUtil, along with the trend of its metrics, the final value of each metric at the last analyzed week, as well as the predictions of the metrics models and the primary source code properties models. The column
Metric Maintainable refers to the maintainability predictions of each separate metric model (e.g., the
NL model, the
NLE model and the
McCC model), while the column
Category Maintainable depicts the predictions of the aggregated category model (e.g., the
Complexity model). It is obvious that the class is complex, as the
Nesting Level,
Nesting Level Else-If and the
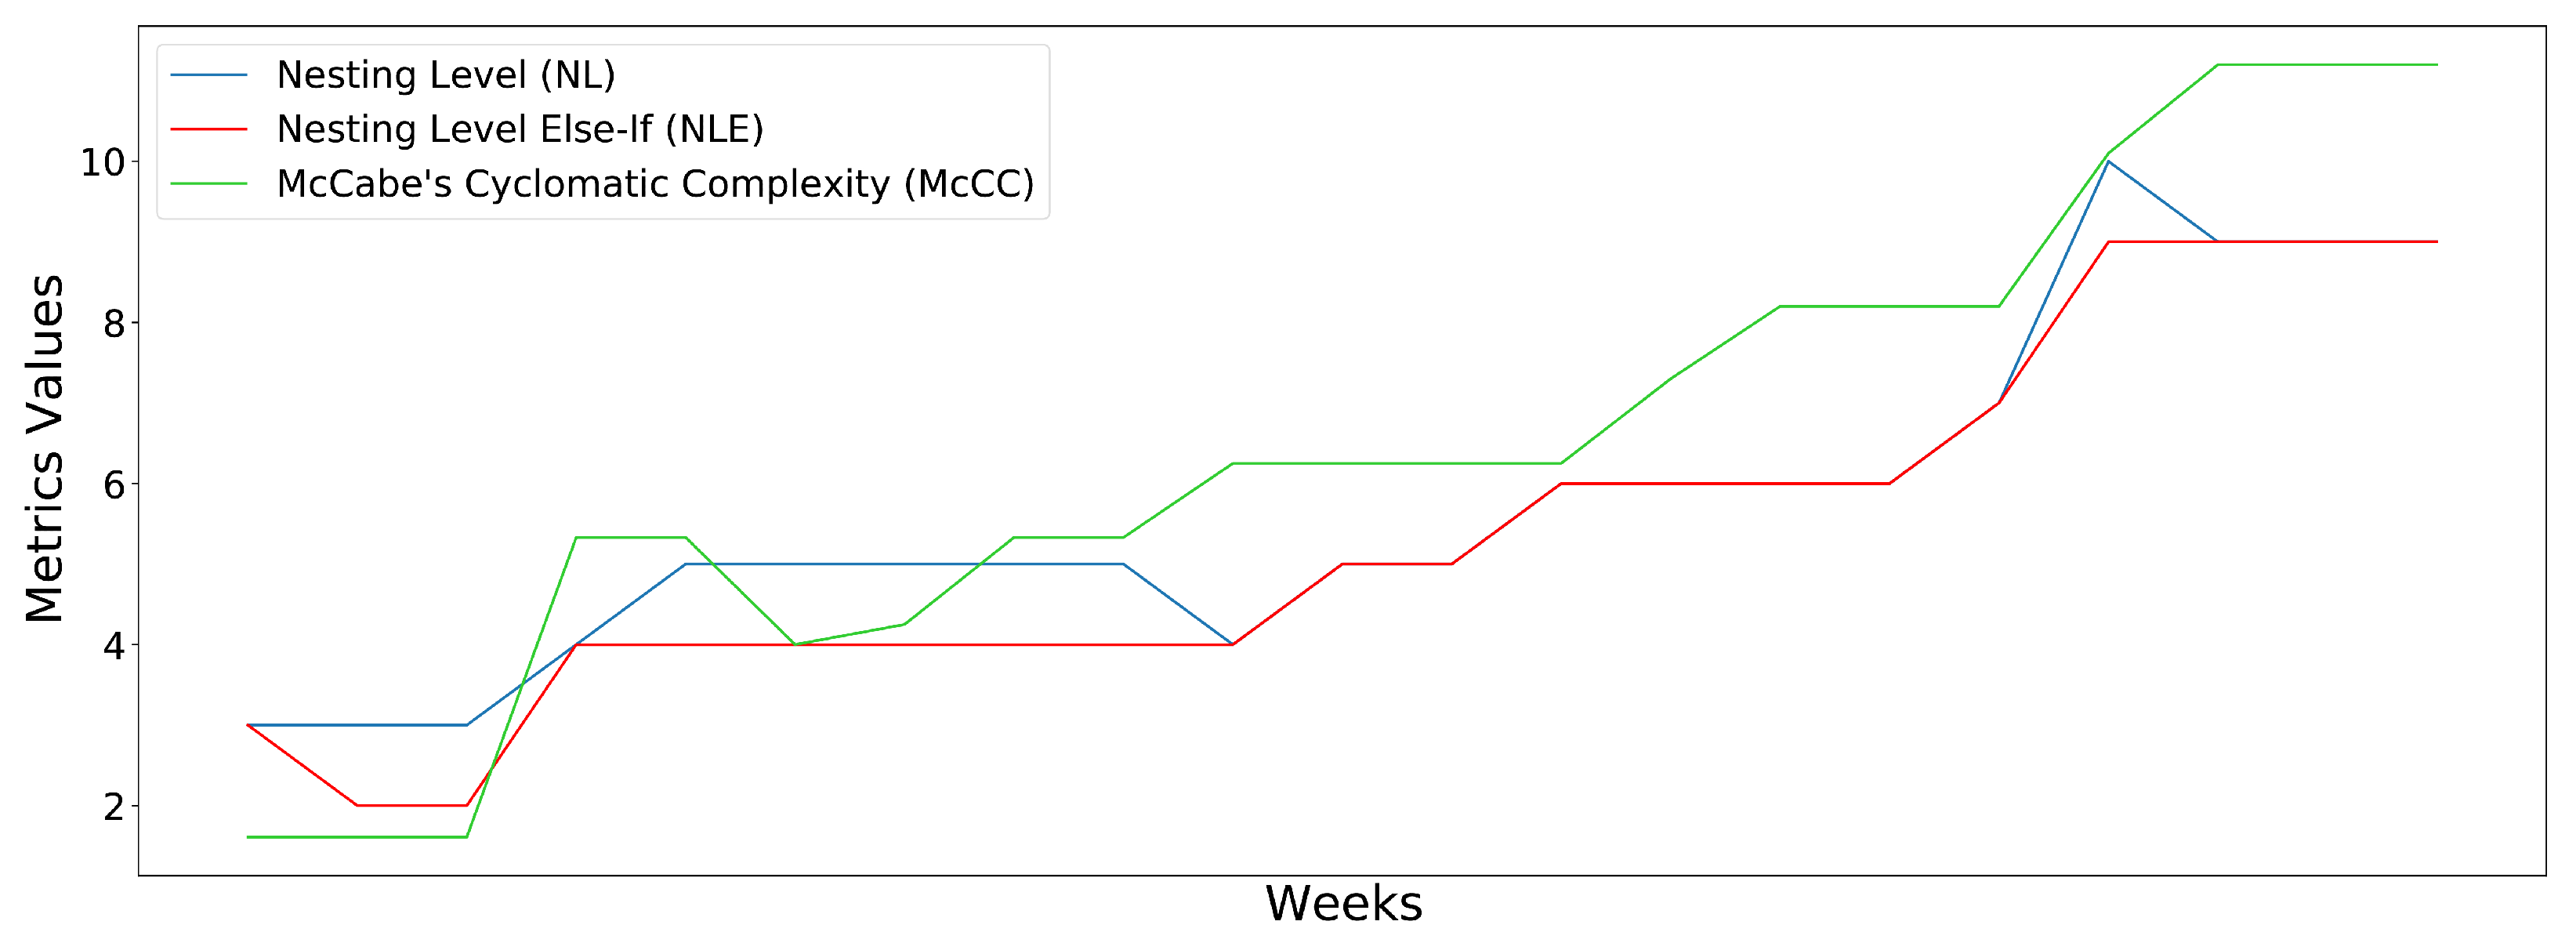
McCabe’s Cyclomatic Complexity metrics have both a high value and an upward trend that negatively affects the complexity over time. Additionally,
Figure 5 illustrates the upward trend of the three quality metrics (NL, NLE and McCC). Upon applying our methodology, each metric’s model identifies the class as non-maintainable, leading to an overall non-maintainability classification from the complexity model. In this example, even though the values of the rest of the metrics are within acceptable limits, the system can alert the developers that the class suffers from high complexity, which will eventually lead to the inability of refactoring and maintaining the component.
Table 10 depicts the results of the examination of another class, called
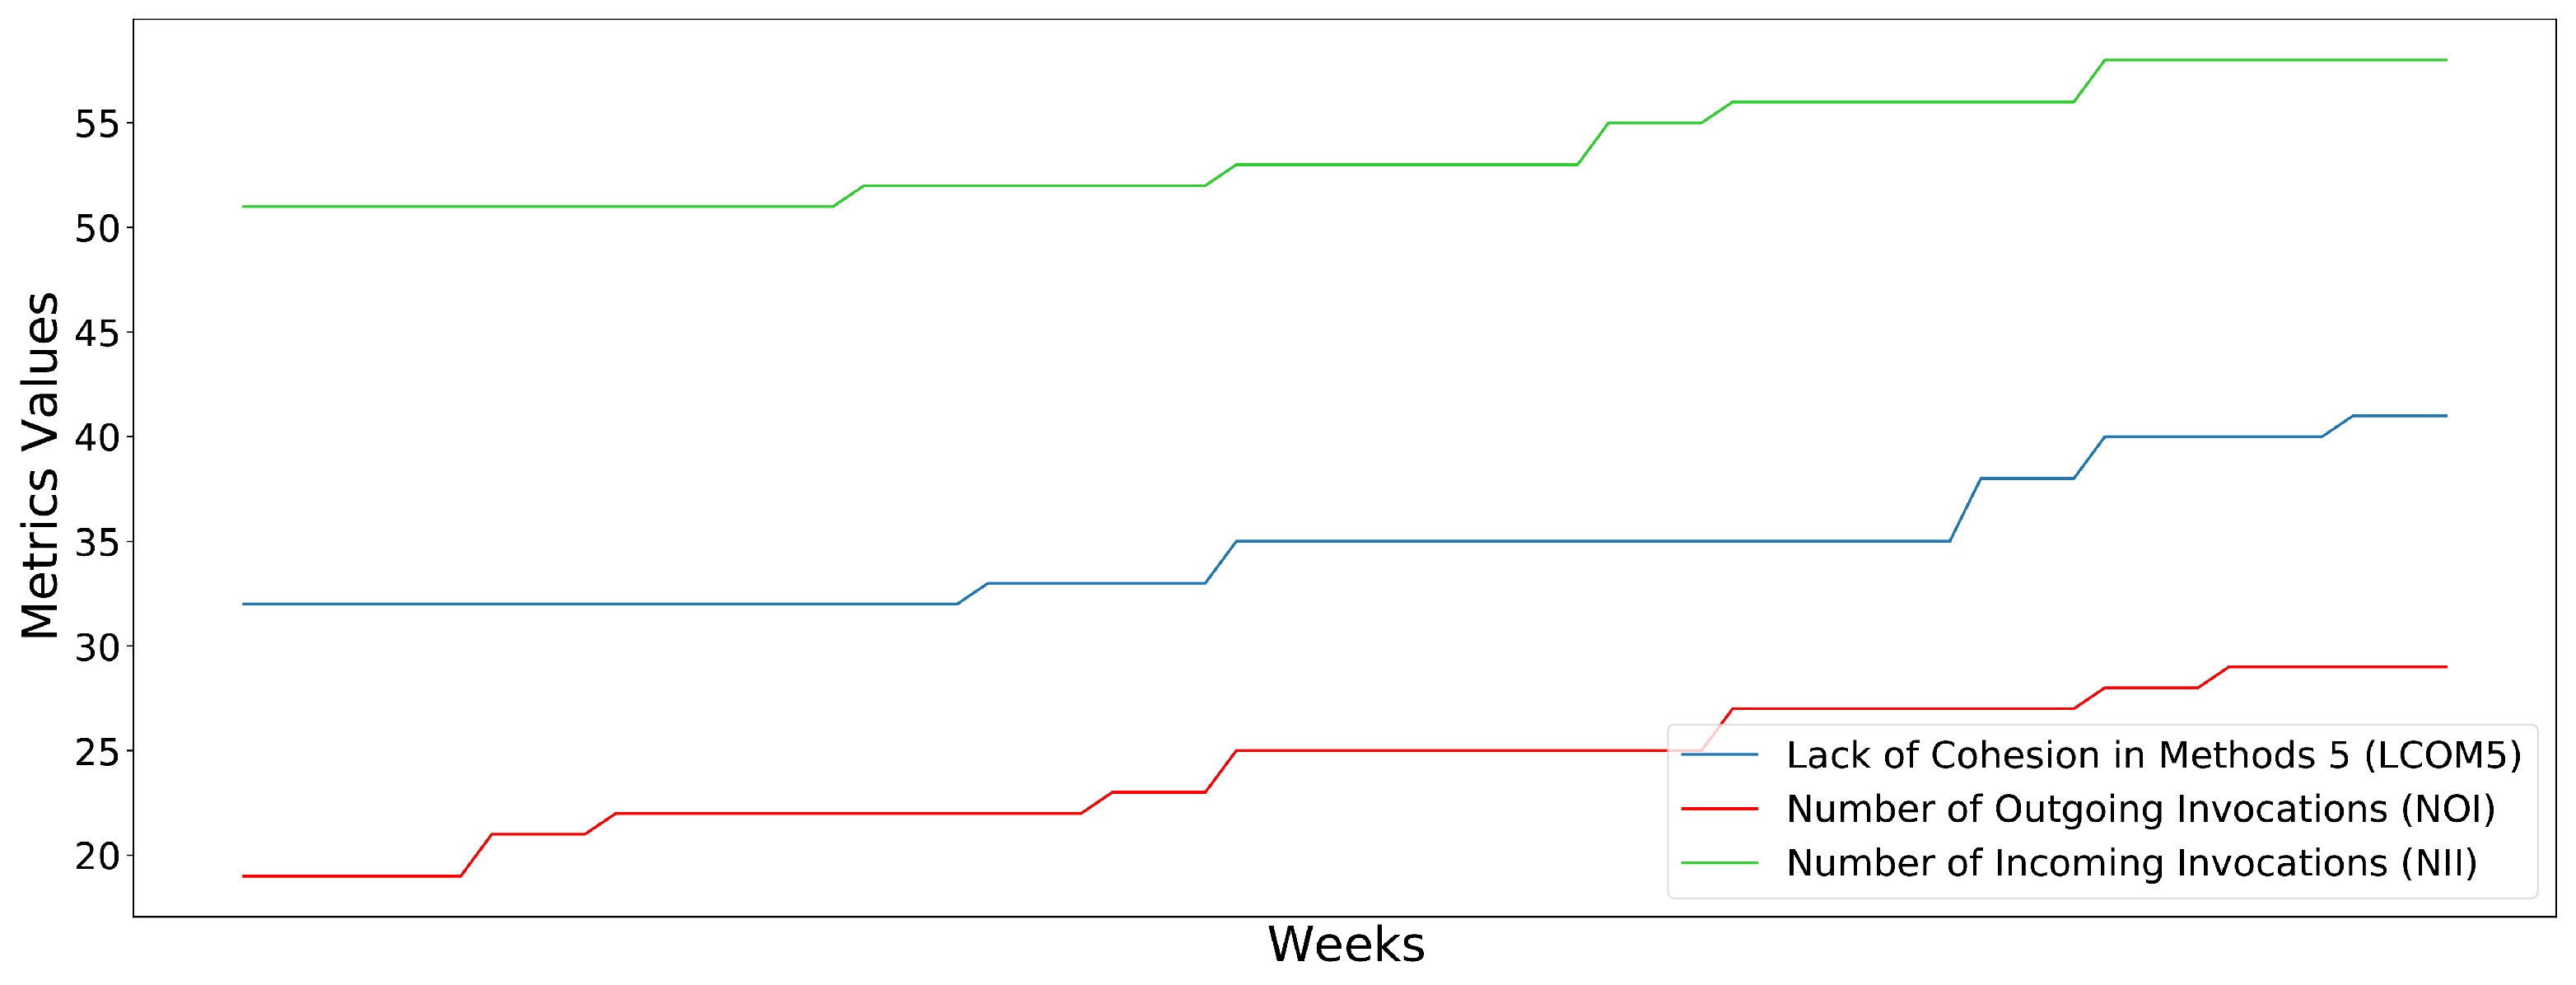
QueueFile. Contrary to the previous example, this class has acceptable values for the complexity metrics. However, the class lacks cohesion (LCOM5), while it appears to have a quite large number of incoming (NII) and outgoing (NOI) invocations. It should be noted here that, even if the tendency of the three metrics is small, the large values the metrics appear to have at the analysis point make the component non-maintainable. In this case, the developers should turn their focus on how to improve these metrics in general and not over time, as they have only a small increase per week.
Figure 6 illustrates the progressing behavior of the LCOM5, NOI and NII metrics, where we can easily notice that the increase per week is relatively small, contrary to the actual value of each metric.
5.2. Early Non-Maintainability Identification
The identification of a non-maintainable component as early as possible is critical, since it directly affects the effort and time needed to refactor the code and improve the quality of the software. We argue that our methodology successfully leads to early identification of non-maintainabilities and provides actionable recommendations to the developers.
To support our claims, we follow the same evaluation approach followed in [
2] in order to examine whether our approach can be effective in identifying components that will become non-maintainable at a latter stage of their life cycle. However, instead of counting the life cycle of a given component in software releases, we have selected the weeks as the basis of a software component’s life. Thus, we aspire to evaluate the number of weeks, expressed as percentage of the life cycle of the component, and our approach can earlier predict the non-maintainability of a given component before it actually happens.
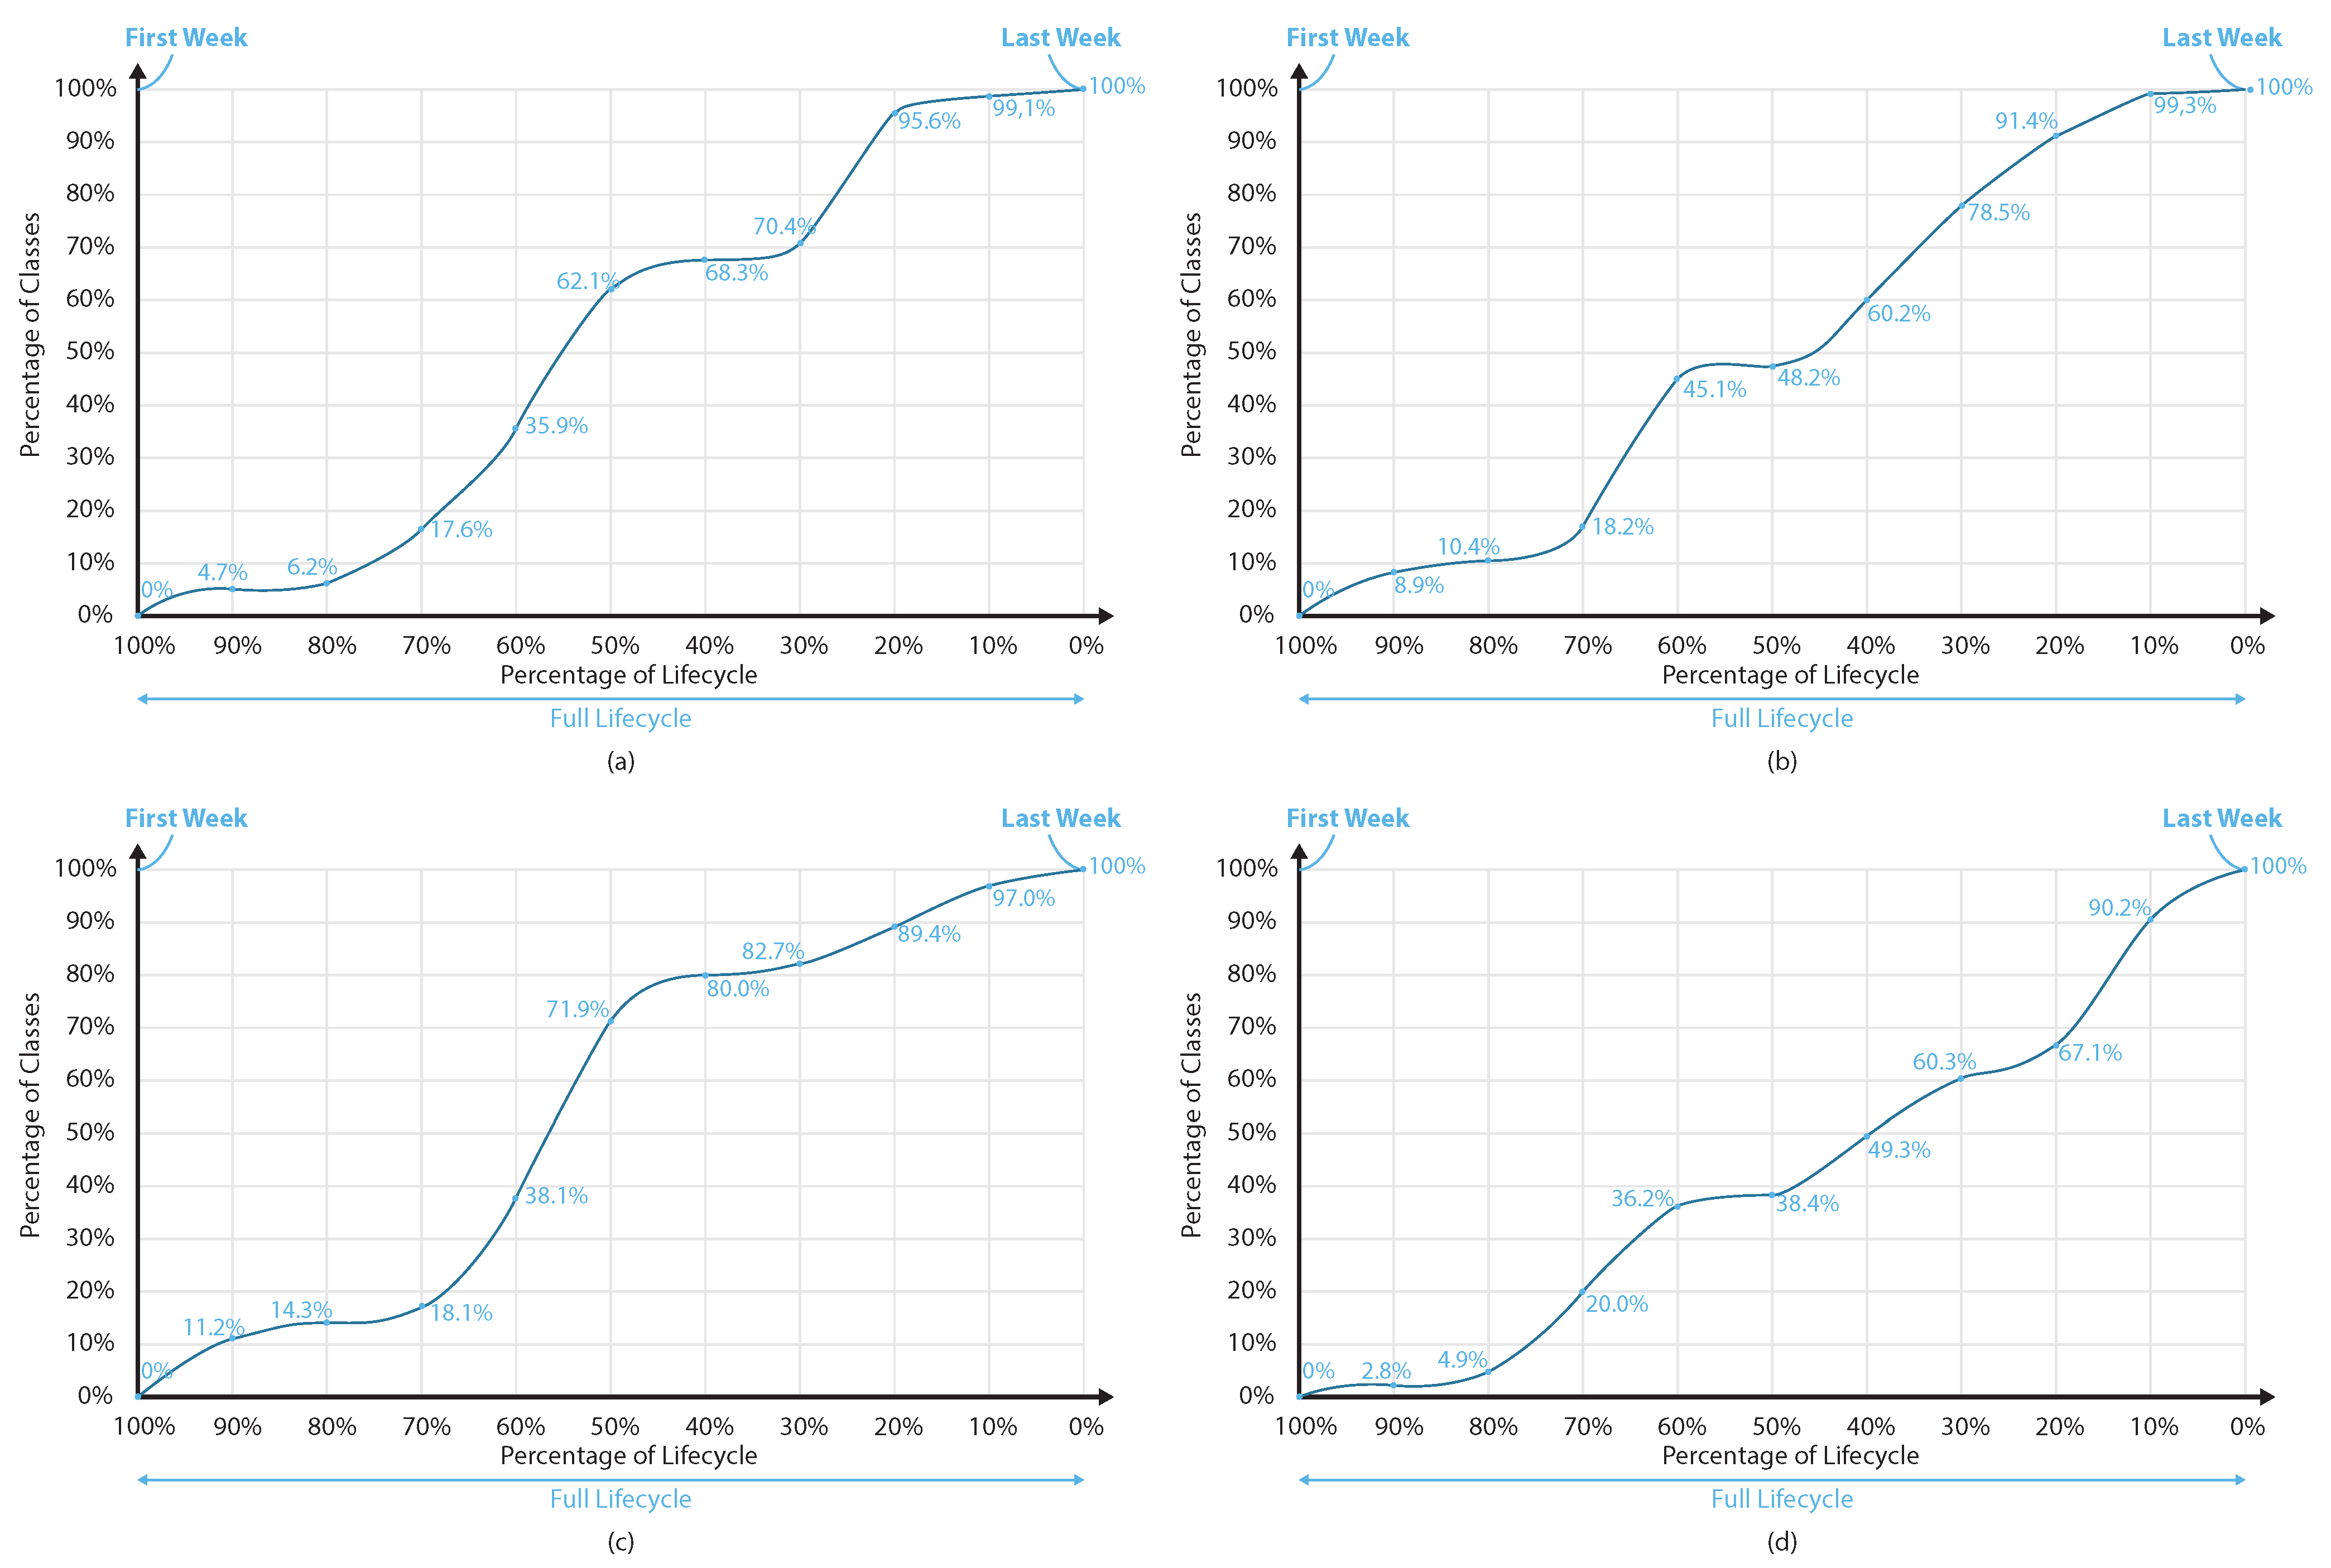
To that end, we make use of the metrics of a given class until the current week under examination and calculate the trend of each metric using only the values of the previous weeks. Given, for instance, a class that exists in its project for 100 weeks until it is dropped, we examine the maintainability degree produced by our system in each week until the last one. At week 50, we employ the static analysis metrics of the class for the 50 first weeks of the life cycle, calculate the trend and predict the maintainability of the component. If the class is predicted as non-maintainable, it means that we were able to identify the non-maintainability ahead of the component’s life cycle. Obviously, the earlier we can identify the non-maintainability, the higher this percentage will be, which reflects early detection.
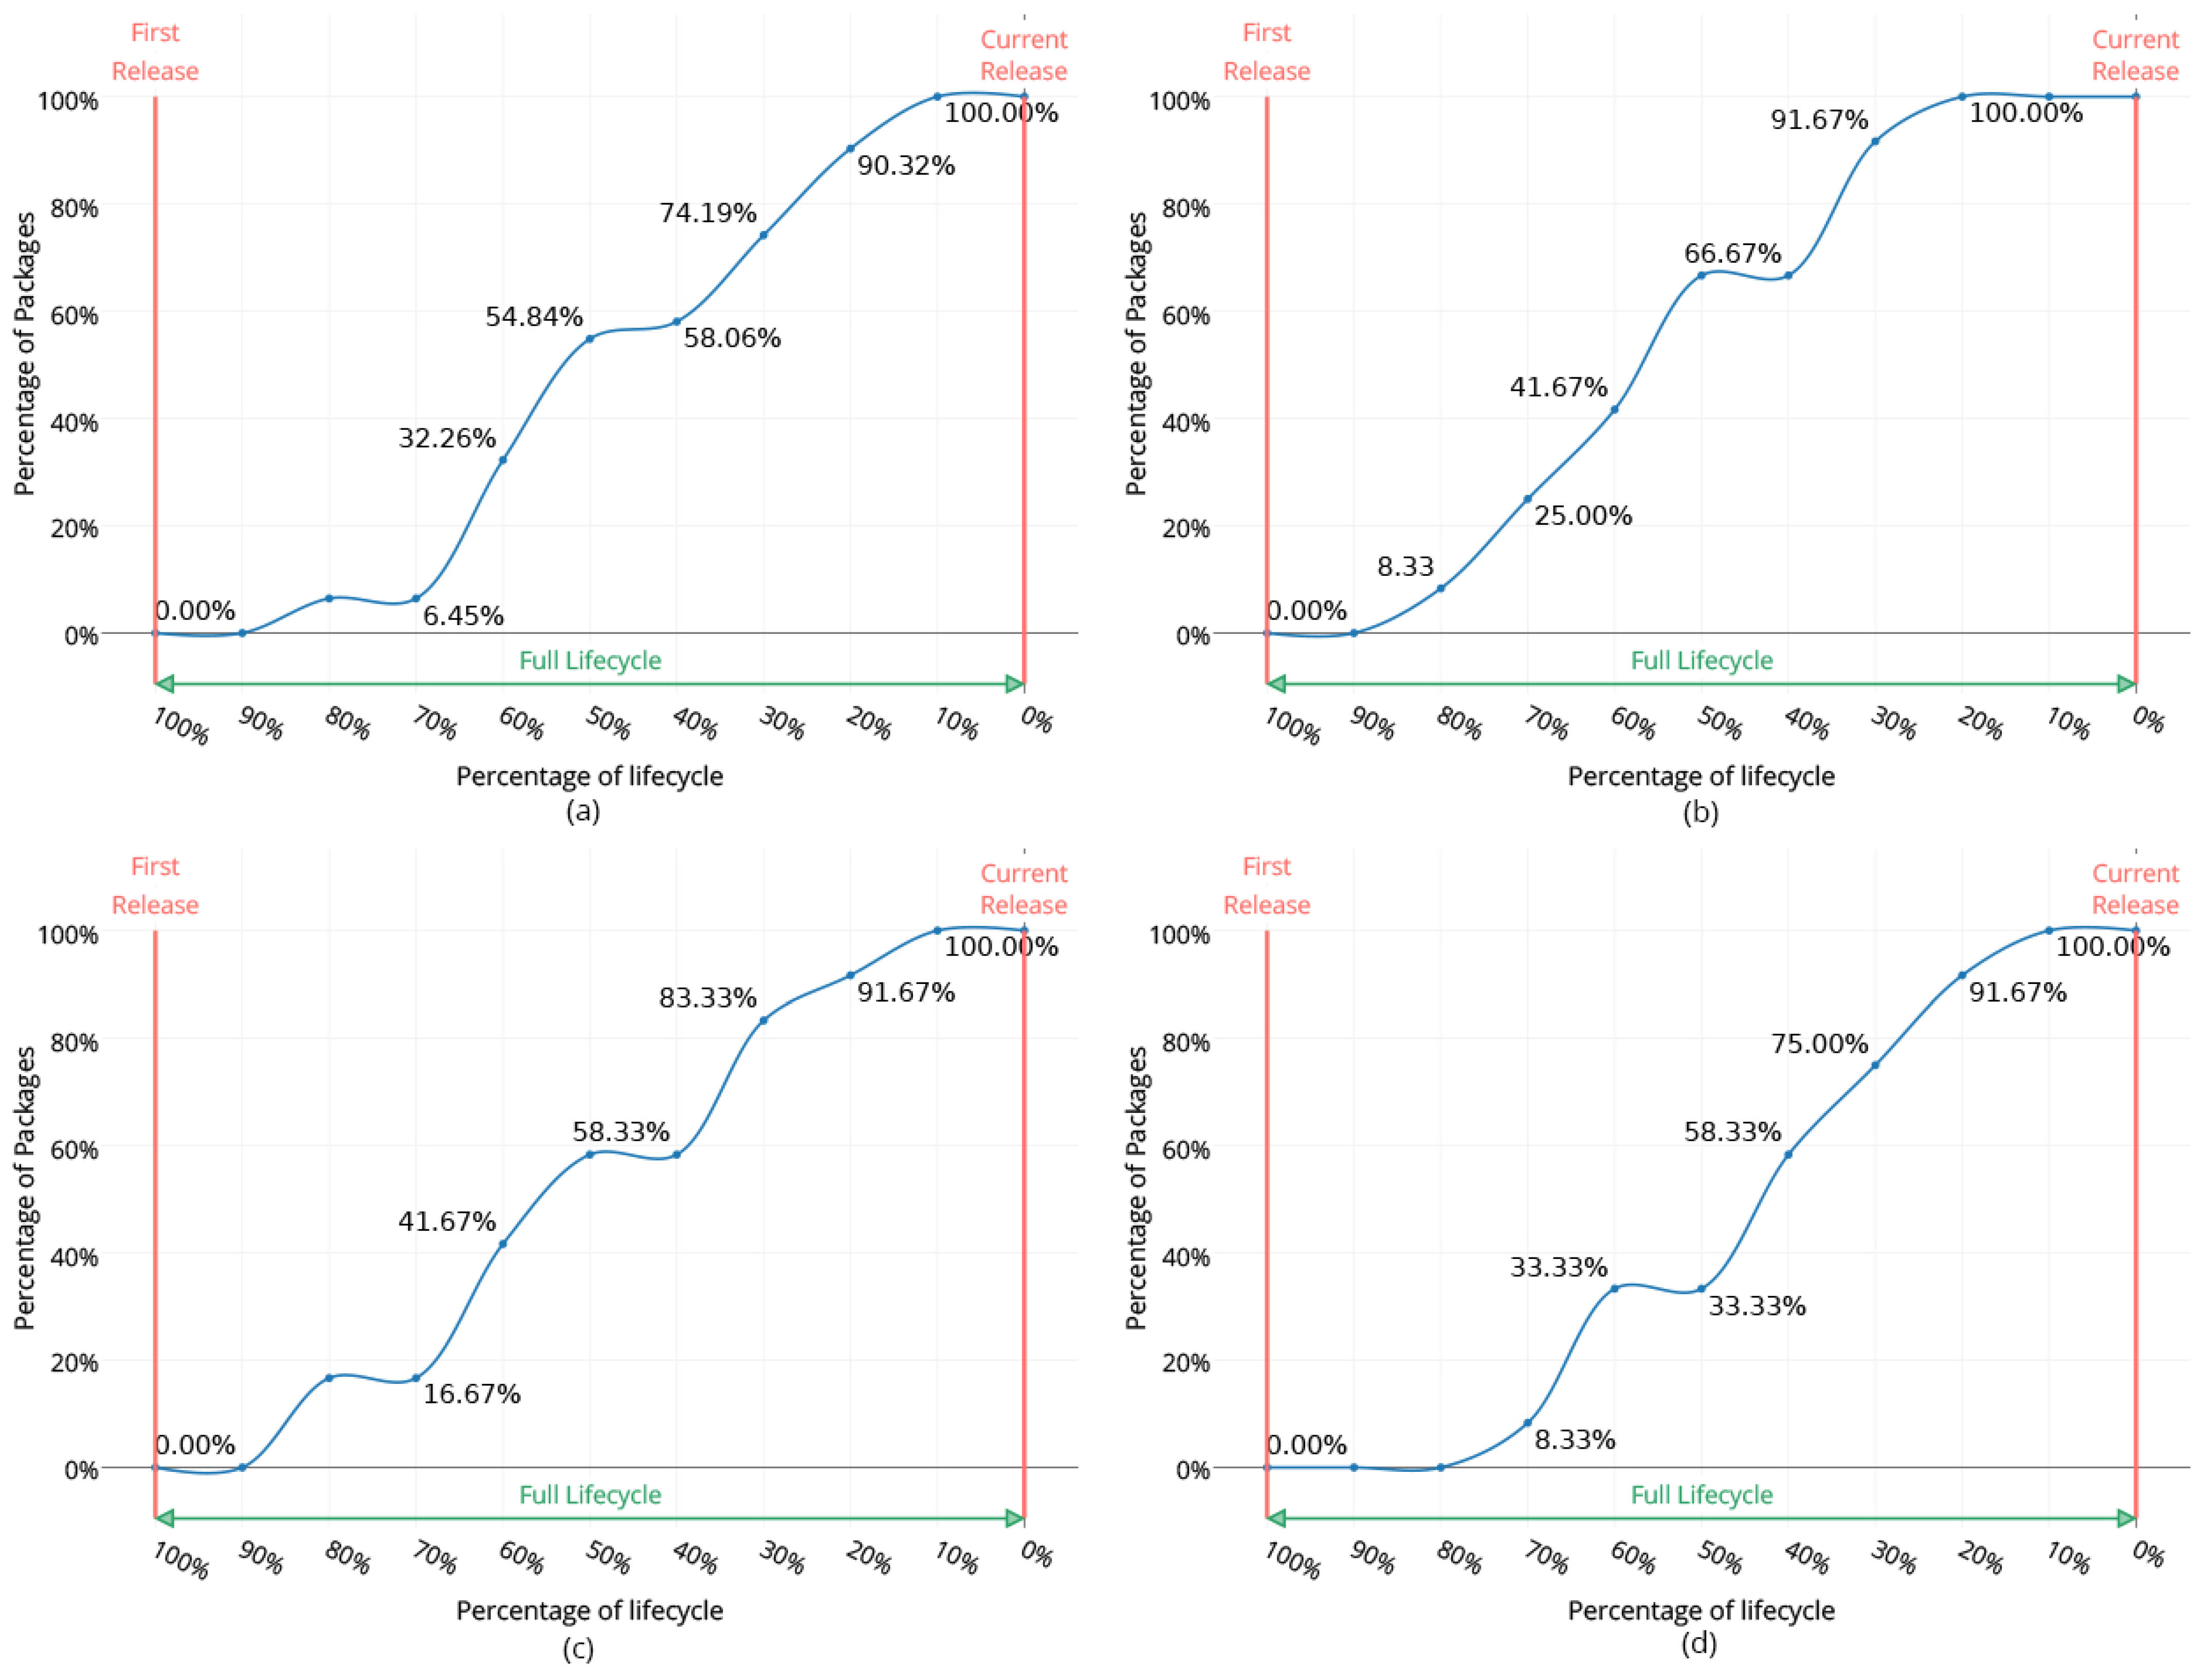
Figure 7 illustrates the ability of the models of the four primary source code properties (
Complexity,
Cohesion,
Inheritance and
Coupling) to identify the non-maintainability of a given class in an early stage in a comparative way to
Figure 8 of [
2], which is illustrated in
Figure 8. The horizontal axis refers to the percentage of the component’s life cycle the non-maintainability has been identified (starting from 100% ahead of the life cycle’s end). It should be noted once again that the life cycle is measured in the number of weeks, contrary to [
2], where it reflects the number of releases. The vertical axis refers to the percentage of the examined classes that have been identified as non-maintainable as opposed to the previous work of [
2], where the non-maintainable components examined are packages. The four figures, i.e.,
Figure 7a–d, refer to the four primary source code properties models, i.e., the
Complexity,
Cohesion,
Inheritance and
Coupling models, respectively.
The results indicate that the four models are able to identify a non-maintainable component at least 40–50% ahead of the week the non-maintainability occurs for almost 60% of the examined classes. The identified non-maintainable components overcome the respective ones from [
2], where 60% of the non-maintainable packages are identified around 40% earlier than the non-maintainability point. At the same time, in almost any point of the percentage of components’ life cycle, the percentage of non-maintainable components identified by our current work (
Figure 7) is quite larger than the respective one from our previous work (
Figure 8).
6. Threats to Validity
In this work, we presented our approach towards evaluating the maintainability degree of a software class and identifying software components that eventually become non-maintainable, based on the primary source code properties and static analysis metrics. Based on the evaluation performed, we argue that our system achieves high internal validity. The only limitation that arises and threatens the internal validity of our system is the inability to evaluate our approach on software components that are not dropped, as we argue that the existence of a software component within a project does not guarantee its maintainability; the component could be recognized as non-maintainable and be dropped in the exact next week of the final analysis.
As far as the external validity of our approach is concerned, one should take into account the following limitations: (1) the use of the classes that were dropped as a non-maintainability indicator and (2) the use of the current value of the static analysis metric as an extra input to the maintainability models.
Our methodology for evaluating maintainability and identifying non-maintainable components is mostly based on the recognition of the classes that were dropped from their projects. We make use of this information as a non-maintainability indicator, upon which our models are built and trained. However, leaving a class out of the project may not be only due to non-maintainability, but it could be based on a set of different reasons, such as changes in functionality or features or even a renaming of the component. In order to cope with this limitation, we applied a series of filters, aspiring to identify only the classes that were dropped due to quality criteria. First, code cloning techniques and manual examination on the classes of the dataset have been performed in order to discard identical classes. In addition, a class is considered dropped and added to our dataset only if there is at least one static analysis metric that seems to negatively affect maintainability over time and, also, only if the component has been existed within the project for at least 4 weeks, thus discarding temporarily used components. That way, we were able to limit the biases that the aforementioned limitation introduces to our models.
Additionally, the prediction of the metrics models was based not only on the trend of the respective metric, but also on the value the static analysis metric has at the time the evaluation takes place. While the extra input to the model may bias the decisions, as the model could be affected, for instance, by quite high values of the respective metric, our evaluation strategy confirmed that the use of this value can help the system improve its sensitivity in identifying non-maintainable components.
7. Conclusions and Future Work
In this work, we proposed a maintainability evaluation approach that depends on a weekly analysis of a software project and, based on the static analysis metrics and their trend over time, identifies non-maintainable components at the class level. Our approach is formulated on the assessment of the maintainability degree of the progressing behavior of four primary source code properties. These primary source code properties are Complexity, Cohesion, Inheritance and Coupling. The maintainability evaluation of these properties breaks down into a lower level by creating a single model for each one of the most important static analysis metrics that each property comprises. The evaluation of our approach in various axes indicates that our system can effectively identify non-maintainable classes by analyzing their trend over time. The results of our modeling approach seem valid both from qualitative and quantitative points of view, and the system can indicate the source code property, as well as the static analysis metric, which are responsible for the non-maintainability of the software component, this way providing actionable and interpretable recommendations to the developers. Additionally, our system is capable of detecting the non-maintainability of a given class almost 50% ahead of the point in time it actually happens, which allows the developers to refactor the code, keep the component maintainable and avoid extra effort, time and costs.
Future work lies in various axes. First, the selection of the components that are dropped from the project they belong to as non-maintainability indicators needs to be further examined in order to eliminate potential false positives in non-maintainable components. Additionally, the calculation of the trend a static analysis metric exhibits over time can be modeled in more detail by adding polynomial or non-linear types that could incorporate more information about the way a metric changes in time. Finally, more projects with various characteristics could be incorporated, in order to examine the effectiveness of our system under different conditions.
Author Contributions
Conceptualization, T.K., M.D.P. and A.L.S.; methodology, T.K., M.D.P. and A.L.S.; software, T.K., M.D.P. and A.L.S.; validation, T.K., M.D.P. and A.L.S.; formal analysis, T.K., M.D.P. and A.L.S.; investigation, T.K., M.D.P. and A.L.S.; resources, T.K., M.D.P. and A.L.S.; data curation, T.K., M.D.P. and A.L.S.; writing—original draft preparation, T.K., M.D.P. and A.L.S.; writing—review and editing, T.K., M.D.P. and A.L.S.; visualization, T.K., M.D.P. and A.L.S.; supervision, T.K., M.D.P. and A.L.S.; project administration, T.K., M.D.P. and A.L.S.; funding acquisition, T.K., M.D.P. and A.L.S. All authors have read and agreed to the published version of the manuscript.
Funding
This research has been co-financed by the European Regional Development Fund of the European Union and Greek national funds through the Operational Program Competitiveness, Entrepreneurship and Innovation, under the call RESEARCH–CREATE–INNOVATE (project code: T2EDK—00550).
![Sustainability 13 12848 i001]()
Institutional Review Board Statement
Not applicable.
Informed Consent Statement
Not applicable.
Data Availability Statement
Conflicts of Interest
The authors declare no conflict of interest. The funders had no role in the design of the study; in the collection, analyses, or interpretation of data; in the writing of the manuscript, or in the decision to publish the results.
References
- ISO/IEC 25010:2011. 2011. Available online: https://www.iso.org/obp/ui#iso:std:iso-iec:25010:ed-1:v1:en (accessed on 19 November 2021).
- Papamichail, M.D.; Symeonidis, A.L. A generic methodology for early identification of non-maintainable source code components through analysis of software releases. Inf. Softw. Technol. 2020, 118, 106218. [Google Scholar] [CrossRef]
- Malhotra, R.; Chug, A. Software Maintainability: Systematic Literature Review and Current Trends. Int. J. Softw. Eng. Knowl. Eng. 2016, 26, 1221–1253. [Google Scholar] [CrossRef]
- Jones, C. The Economics of Software Maintenance in the Twenty First Century; Software Productivity Research, Inc.: Hendersonville, NC, USA, 2006. [Google Scholar]
- Dehaghani, S.M.H.; Hajrahimi, N. Which factors affect software projects maintenance cost more? Acta Inform. Medica 2013, 21, 63. [Google Scholar] [CrossRef] [PubMed] [Green Version]
- Venters, C.; Capilla, R.; Betz, S.; Penzenstadler, B.; Crick, T.; Crouch, S.; Nakagawa, E.; Becker, C.; Carrillo Sánchez, C. Software Sustainability: Research and Practice from a Software Architecture Viewpoint. J. Syst. Softw. 2017, 174–188. [Google Scholar] [CrossRef] [Green Version]
- Aljarallah, S.; Lock, R. A Comparison of Software Quality Characteristics and Software Sustainability Characteristics. In Proceedings of the 2019 3rd International Symposium on Computer Science and Intelligent Control, Amsterdam, The Netherlands, 25–27 September 2019; pp. 1–11. [Google Scholar] [CrossRef]
- Seref, B.; Tanriover, O. Software Code Maintainability: A Literature Review. Int. J. Softw. Eng. Appl. 2016, 7, 69–87. [Google Scholar] [CrossRef]
- Arvinder, K.; Kaur, K.; Malhotra, R. Soft Computing Approaches for Prediction of Software Maintenance Effort. Int. J. Comput. Appl. 2010, 1, 69–75. [Google Scholar] [CrossRef]
- Berns, G.M. Assessing Software Maintainability. Commun. ACM 1984, 27, 14–23. [Google Scholar] [CrossRef]
- Oman, P.; Hagemeister, J. Construction and testing of polynomials predicting software maintainability. J. Syst. Softw. 1994, 24, 251–266. [Google Scholar] [CrossRef]
- Coleman, D.; Ash, D.; Lowther, B.; Oman, P. Using metrics to evaluate software system maintainability. Computer 1994, 27, 44–49. [Google Scholar] [CrossRef]
- Welker, K. Software Maintainability Index Revisited. CrossTalk 2001, 14, 18–21. [Google Scholar]
- Bakota, T.; Hegedüs, P.; Kortvelyesi, P.; Ferenc, R.; Gyimothy, T. A probabilistic software quality model. In Proceedings of the 2011 27th IEEE International Conference on Software Maintenance (ICSM), Williamsburg, VA, USA, 25–30 September 2011; pp. 243–252. [Google Scholar] [CrossRef]
- Correia, J.P.; Visser, J. Benchmarking Technical Quality of Software Products. In Proceedings of the 2008 15th Working Conference on Reverse Engineering, Antwerp, Belgium, 15–18 October 2008; pp. 297–300. [Google Scholar] [CrossRef]
- Baggen, R.; Correia, J.P.; Schill, K.; Visser, J. Standardized code quality benchmarking for improving software maintainability. Softw. Qual. J. 2011, 20, 1–21. [Google Scholar] [CrossRef]
- Oliveira, P.; Valente, M.; Lima, F. Extracting Relative Thresholds for Source Code Metrics. In Proceedings of the 2014 Software Evolution Week-IEEE Conference on Software Maintenance, Reengineering, and Reverse Engineering (CSMR-WCRE), Antwerp, Belgium, 3–6 February 2014; pp. 1–10. [Google Scholar] [CrossRef] [Green Version]
- Papamichail, M.D.; Diamantopoulos, T.; Symeonidis, A.L. Measuring the Reusability of Software Components using Static Analysis Metrics and Reuse Rate Information. J. Syst. Softw. 2019, 158, 110423. [Google Scholar] [CrossRef]
- Ferreira, K.; Bigonha, M.; Bigonha, R.; Mendes, L.; Almeida, H. Identifying thresholds for object-oriented software metrics. J. Syst. Softw. 2012, 85, 244–257. [Google Scholar] [CrossRef]
- Shatnawi, R.; Li, W.; Swain, J.; Newman, T. Finding software metrics threshold values using ROC curves. J. Softw. Maint. 2010, 22, 1–16. [Google Scholar] [CrossRef]
- Foucault, M.; Palyart, M.; Falleri, J.R.; Blanc, X. Computing contextual metric thresholds. In Proceedings of the 29th Annual ACM Symposium on Applied Computing, Gyeongju, Korea, 24–28 March 2014. [Google Scholar]
- Zhou, Y.; Leung, H. Predicting object-oriented software maintainability using multivariate adaptive regression splines. J. Syst. Softw. 2007, 80, 1349–1361. [Google Scholar] [CrossRef]
- Schnappinger, M.; Fietzke, A.; Pretschner, A. Human-Level Ordinal Maintainability Prediction Based on Static Code Metrics; Association for Computing Machinery: New York, NY, USA, 2021. [Google Scholar] [CrossRef]
- Kapllani, G.; Khomyakov, I.; Mirgalimova, R.; Sillitti, A. An Empirical Analysis of the Maintainability Evolution of Open Source Systems; Springer: Cham, Switzerland; Innopolis, Russia, 2020; pp. 78–86. [Google Scholar] [CrossRef]
- Chatzimparmpas, A.; Bibi, S. Maintenance process modeling and dynamic estimations based on Bayesian Networks and Association Rules. J. Softw. Evol. Process. 2019, 31, e2163. [Google Scholar] [CrossRef]
- Duhan, M.; Bhatia, P. Hybrid Maintainability Prediction using Soft Computing Techniques. Int. J. Comput. 2021, 20, 350–356. [Google Scholar] [CrossRef]
- Malhotra, R.; Lata, K. Using Ensembles for Class Imbalance Problem to Predict Maintainability of Open Source Software. Int. J. Reliab. Qual. Saf. Eng. 2020, 27. [Google Scholar] [CrossRef]
- Samoladas, I.; Stamelos, I.; Angelis, L.; Oikonomou, A. Open source software development should strive for even greater code maintainability. Commun. ACM 2004, 47, 83–87. [Google Scholar] [CrossRef]
- Papamichail, M.; Diamantopoulos, T.; Symeonidis, A.L. User-Perceived Source Code Quality Estimation based on Static Analysis Metrics. In Proceedings of the 2016 IEEE International Conference on Software Quality, Reliability and Security (QRS), Vienna, Austria, 1–3 August 2016. [Google Scholar]
- Bass, L.; Clements, P.; Kazman, R. Software Architecture in Practice; SEI Series in Software Engineering; Addison-Wesley: Boston, MA, USA, 2003. [Google Scholar]
- McCabe, T. A Complexity Measure. IEEE Trans. Softw. Eng. 1976, SE-2, 308–320. [Google Scholar] [CrossRef]
Figure 1.
Trend of software quality metrics on per week and per release analyses.
Figure 1.
Trend of software quality metrics on per week and per release analyses.
Figure 2.
System overview.
Figure 2.
System overview.
Figure 3.
Histogram of the life cycle of each class in the dataset.
Figure 3.
Histogram of the life cycle of each class in the dataset.
Figure 4.
Histogram of the life cycle of each class in the dataset.
Figure 4.
Histogram of the life cycle of each class in the dataset.
Figure 5.
The upward trend and high values of the AuthorizationUtil class of the complexity metrics: NL, NLE and McCC.
Figure 5.
The upward trend and high values of the AuthorizationUtil class of the complexity metrics: NL, NLE and McCC.
Figure 6.
The upward trend and high values of the QueueFile class of the complexity metrics: LCOM5, NOI and NII.
Figure 6.
The upward trend and high values of the QueueFile class of the complexity metrics: LCOM5, NOI and NII.
Figure 7.
Prediction of non-maintainability during the life cycle of a class for the (a) complexity model, the (b) cohesion model, the (c) inheritance model and the (d) coupling model.
Figure 7.
Prediction of non-maintainability during the life cycle of a class for the (a) complexity model, the (b) cohesion model, the (c) inheritance model and the (d) coupling model.
Figure 8.
Prediction of non-maintainability during the life cycle of a package for the (a) complexity model, the (b) cohesion model, the (c) inheritance model and the (d) coupling model.
Figure 8.
Prediction of non-maintainability during the life cycle of a package for the (a) complexity model, the (b) cohesion model, the (c) inheritance model and the (d) coupling model.
Table 1.
Primary source code properties and static quality metrics.
Table 1.
Primary source code properties and static quality metrics.
| | Static Analysis Metrics |
|---|
| Source Code Property | Metric Name | Metric Description |
| Complexity
| NL | Nesting Level |
| NLE | Nesting Level Else-If |
| McCC | McCabe’s Cyclomatic Complexity |
| Cohesion | LCOM5 | Lack of Cohesion in Methods 5 |
| Inheritance | DIT | Depth of Inheritance Tree |
| NOC | Number of Children |
| NOP | Number of Parents |
| NOD | Number of Descendants |
| NOA | Number of Ancestors |
| Coupling | CBO | Coupling Between Object classes |
| NOI | Number of Outgoing Invocations |
| NII | Number of Incoming Invocations |
| RFC | Response set For Class |
Table 2.
Selected projects’ statistics.
Table 2.
Selected projects’ statistics.
| Metric | antlr4 | aws-sdk | Grails-Core |
|---|
| Total Lines of Code Analyzed | 13,398,112 | 42,671,286 | 34,387,547 |
| Number of Classes | 2369 | 1168 | 2448 |
| Number of Non-Maintainable Classes | 1207 | 348 | 1864 |
| Number of Contributors | 263 | 6 | 237 |
| Length of Life Cycle (Weeks) | 440 | 434 | 584 |
Table 3.
Number of non-maintainable classes per static analysis metric.
Table 3.
Number of non-maintainable classes per static analysis metric.
| Static Analysis Metric | # Non-Maintainable Classes |
|---|
| NL | 281 |
| NLE | 276 |
| McCC | 777 |
| LCOM5 | 453 |
| DIT | 453 |
| NOC | 265 |
| NOP | 447 |
| NOD | 266 |
| NOA | 453 |
| CBO | 735 |
| NOI | 496 |
| NII | 429 |
| RFC | 776 |
Table 4.
Meta-parameters selection per model.
Table 4.
Meta-parameters selection per model.
| Static Analysis | Meta-Parameters | |
|---|
| Metric Model | Nu | Gamma | FNs |
|---|
| NL | 0.01 | 0.1 | 1.67% |
| NLE | 0.04 | 2.5 | 2.85% |
| McCC | 0.0.01 | 0.1 | 1.67% |
| LCOM5 | 0.02 | 3 | 1.32% |
| DIT | 0.01 | 3.7 | 0.44% |
| NOC | 0.03 | 3.4 | 4.62% |
| NOP | 0.01 | 0.3 | 0.45% |
| NOD | 0.04 | 0.1 | 6.09% |
| NOA | 0.01 | 0.1 | 0.44% |
| CBO | 0.04 | 2.6 | 2.31% |
| NOI | 0.07 | 2.1 | 4.64% |
| NII | 0.01 | 0.3 | 4.66% |
| RFC | 0.09 | 3.6 | 5.03% |
Table 5.
Number of non-maintainable classes per primary source code property.
Table 5.
Number of non-maintainable classes per primary source code property.
| Source Code Property | # Non-Maintainable Classes |
|---|
| Complexity | 245 |
| Cohesion | 453 |
| Inheritance | 210 |
| Coupling | 239 |
Table 6.
Meta-parameters selection per property model.
Table 6.
Meta-parameters selection per property model.
| Source Code | Meta-Parameters | |
|---|
| Property Model | Nu | Gamma | FNs |
|---|
| Complexity | 0.01 | 0.6 | 0.82% |
| Cohesion | 0.01 | 0.45 | 0.22% |
| Inheritance | 0.1 | 0.2 | 2.50% |
| Coupling | 0.01 | 0.95 | 0.84% |
Table 7.
Number of non-maintainable classes.
Table 7.
Number of non-maintainable classes.
| Model | # Non-Maintainable Classes |
|---|
| General | 197 |
Table 8.
Meta-parameters selection for the general model.
Table 8.
Meta-parameters selection for the general model.
| | Meta-Parameters | |
|---|
| Model | Nu | Gamma | FNs |
|---|
| General | 0.01 | 0.1 | 0.67% |
Table 9.
Maintainability evaluation on static analysis metrics of the AuthorizationUtil class.
Table 9.
Maintainability evaluation on static analysis metrics of the AuthorizationUtil class.
| Category | Name | Trend
Slope | Final
Value | Metric
Maintainable | Category
Maintainable |
|---|
| Complexity | NL | 0.3 | 9 | ✗ | ✗ |
| NLE | 0.34 | 9 | ✗ |
| McCC | 0.46 | 11.2 | ✗ |
| Cohesion | LCOM5 | 0.08 | 3 | ✓ | ✓ |
| Inheritance | DIT | 0.05 | 2 | ✓ | ✓ |
| NOC | 0.02 | 1 | ✓ |
| NOP | −0.01 | 2 | ✓ |
| NOD | 0.02 | 7 | ✓ |
| NOA | 0.12 | 4 | ✓ |
| Coupling | CBO | 0.42 | 5 | ✓ | ✓ |
| NOI | 0.00 | 1 | ✓ |
| NII | 0.01 | 7 | ✓ |
| RFC | 0.11 | 3 | ✓ |
Table 10.
Maintainability evaluation on static analysis metrics of the QueueFile class.
Table 10.
Maintainability evaluation on static analysis metrics of the QueueFile class.
| Category | Name | Trend
Slope | Final
Value | Metric
Maintainable | Category
Maintainable |
|---|
| Complexity | NL | 0.1 | 4 | ✓ | ✓ |
| NLE | 0.09 | 4 | ✓ |
| McCC | 0.12 | 3.33 | ✓ |
| Cohesion | LCOM5 | 0.13 | 41 | ✗ | ✗ |
| Inheritance | DIT | 0.06 | 3 | ✓ | ✓ |
| NOC | 0.02 | 6 | ✓ |
| NOP | 0.05 | 2 | ✓ |
| NOD | 0.12 | 3 | ✓ |
| NOA | 0.11 | 2 | ✓ |
| Coupling | CBO | 0.00 | 8 | ✓ | ✗ |
| NOI | 0.15 | 29 | ✗ |
| NII | 0.12 | 58 | ✗ |
| RFC | 0.05 | 11 | ✓ |
| Publisher’s Note: MDPI stays neutral with regard to jurisdictional claims in published maps and institutional affiliations. |
© 2021 by the authors. Licensee MDPI, Basel, Switzerland. This article is an open access article distributed under the terms and conditions of the Creative Commons Attribution (CC BY) license (https://creativecommons.org/licenses/by/4.0/).


