Article

Barriers to Electric Vehicle Adoption in Thailand

by
Chanwit Kongklaew
1,
Khamphe Phoungthong
2,3,
Chanwit Prabpayak
4,
Md. Shahariar Chowdhury
1,2,
Imran Khan
5,
Nuttaya Yuangyai
6,
Chumpol Yuangyai
7 and
Kuaanan Techato
1,2,*
1
Faculty of Environmental Management, Prince of Songkla University (PSU), P.O. Box 50 Kor-Hong, Hatyai, Songklha 90112, Thailand
2
Environmental Assessment and Technology for Hazardous Waste Management Research Center, Faculty of Environmental Management, Prince of Songkla University (PSU), Songkhla 90112, Thailand
3
Center of Excellence on Hazardous Substance Management (HSM), Bangkok 10330, Thailand
4
Faculty of Science and Technology, Rajamangala University of Technology Phra Nakhon, Bangkok 10800, Thailand
5
Department of Electrical and Electronic Engineering, Jashore University of Science and Technology, Jashore 7408, Bangladesh
6
Faculty of Liberal Arts and Management Sciences, Prince of Songkla University (PSU), Surat Thani Campus, Surat Thani 84000, Thailand
7
Department of Industrial Engineering, School of Engineering, King Mongkut’s Institute of Technology Ladkrabang, Bangkok 10520, Thailand
*
Author to whom correspondence should be addressed.
Sustainability 2021, 13(22), 12839; https://doi.org/10.3390/su132212839
Submission received: 8 October 2021 / Revised: 8 November 2021 / Accepted: 15 November 2021 / Published: 19 November 2021

Abstract

:
Electric vehicles (EVs) are considered to be a solution for sustainable transportation. EVs can reduce fossil fuel consumption, greenhouse gas emissions, and the negative impacts of climate change and global warming, as well as help improve air quality. However, EV adoption in Thailand is quite low. Against this backdrop, this study investigates barriers and motivators for EV adoption and their public perception in Thailand. A total of 454 responses were collected through an online questionnaire. The results indicate that the top three concerns of respondents about EVs are public infrastructure and vehicle performance in terms of charge range and battery life. Respondents with more than five years of driving experience in the age range of 26–35 years old could be key targets for early EV adoption.

1. Introduction

The transportation sector is a major contributor to emissions and air pollution in major cities. Transportation consumes approximately one quarter of the total global fossil fuel supply, and a large portion of this supply is consumed by road transport.
With more than 14% of total global emissions, the transportation industry is one of the major contributors to rising GHG emissions [1]. The 2020 International Energy Agency (IEA) report (Tracking Transport 2020) found that transportation is responsible for 24% of direct CO2 emissions from fuel combustion. The main problem is that emissions from this sector are projected to rise over time, up to 70% by 2050 based on a business-as-usual scenario [1]. In the 21st century, electric vehicles have captured the attention of the global automobile industry; according to recent research, three areas hit a 90% sales record in 2019 [2]: the USA, Europe, and China, which sold around 0.326 million, 0.56 million, and 1.06 million electric vehicles, respectively. In 2020, the global electric-car stock exceeded USD 10 million. The region-specific distribution is illustrated in Figure 1 for 2019 and 2020.
In 2019, annual global electric vehicle sales increased by 14%, accounting for 80% in Europe and 43% in Canada, with steady sales in China and the United States. Furthermore, EV adoption has globally increased, including in Norway (39.6%), Hong Kong (10.61%), the United States (3.32%), the United Kingdom (1.94%), and China (2.41%) [3,4]. EVs have various advantages, including fewer GHG emissions, safety, cost savings, and low maintenance, and offer a long-term solution to environmental concerns, as shown by their current acceptance rate and predicted improvement. Thus, EVs are an alternative to internal-combustion engine vehicles (ICEVs), and can provide sustainable transportation [5]. Electric vehicles have the potential to reduced reliance on fossil fuels. There are many varieties of EVs on the market, including hybrid electric vehicles (HEV) and plug-in electric cars.
Although EVs are environmentally friendly, they pose a number of problems for the distribution system, including increased system load due to PEV charging, which reduces substation reserve capacity and feeder load transfer capabilities, EV charging peaks, and traditional distribution loads. The European Union’s (EU) energy laws include a policy for distribution system operators (DSO); the rest of the world is yet to implement such a policy. Furthermore, inconstancy in electric vehicle operating patterns causes consumer preferences to change [6]. The impact of electric vehicle market integration on utility distribution load profiles has also received much attention. Charging an electric vehicle battery may use up to twice as much energy as that of a typical home. This would be quite the challenge to power system management when the adoption of EVs is more widespread [7]. Denmark pursued a project for electric vehicle battery storage in order to facilitate large-scale wind-power integration [8]. The vehicle-to-grid concept allows for EV owners to provide power from a battery to the grid during peak consumption. This concept could ensure grid reliability and flexibility.
In Thailand, the total final energy consumption in 2017 was 80,752 kton. The transport sector’s portion of this consumption constituted about 40.1% [9]. Road transportation activities in Thailand were estimated to be 77.05% of total transport activities. Registered vehicles in Thailand rose from 26.42 million in 2008 to 38.31 million in 2017 [10]. Key challenges of road transport in Thailand include the rapid growth of vehicles, which increases energy demand, thereby contributing to GHG emissions and air pollution as particulate matter (PM2.5). With regard to fuel consumption by fuel type, diesel constituted the highest with 43%, followed by gasoline, jet fuel, natural gas, liquefied petroleum gas (LPG) and fuel oil at 25%, 17%, 7%, 5%, and 3%, respectively. As alternatives, biodiesel, ethanol, natural gas, hydrogen, and electricity are used as fuel for vehicles [5].
The Thai government launched policies to promote EVs in 2015, which marked the beginning of EV policy in Thailand. However, the adoption of EVs is quite low, at 0.32% of the total number of registered vehicles (i.e., 123,967 EVs compared to 38.31 million cars registered with the Department of Land Transportation) [11].
Several EV policies have been launched for widespread EV adoption in the long run. The Energy Efficiency Plan (EEP2015) set a target of 1.2 million EVs by 2036 [12,13]. The National Science and Technology Development Agency (NSTDA) issued a plan for Thailand to be an ASEAN BEV hub, including the capacity to produce 1000 electric buses a year and develop prototype modified EVs [14]. In addition, the customs department and the Board of Investment of Thailand provided EV investments by creating tax incentives for investors, customs deductions for imported EVs, and EV parts and equipment [15]. Therefore, it is more interesting to investigate barriers to EV adoption than ICEVs, as it is essential to help develop innovative policy incentives and the wider adoption of EVs in Thailand.
Country-specific barrier and factor identification towards EV adoption can be found in the literature for countries such as in India [16,17] and Norway [18]. Although this may be true, a recent review compiled a list of countrywide EV-related scientific articles [19] and revealed that no study has been conducted for Thailand; this justifies the novelty of the present work. Therefore, this study investigated the factors that influence EV adoption in Thailand using an online questionnaire survey. Research questions included what the barriers to widespread adoption of EVs are, and whether these factors affect public acceptance of EVs.

2. Literature Review

Numerous studies have explored the benefits of EVs for sustainable transportation. Many studies have explored market penetration by investigating the side of government agencies, investors, and manufacturers. This study focuses on the consumer side in order to identify potential barriers to EV adoption. Numerous studies in the literature have identified many different barriers related to EV adoption. These are discussed in this section, and a summary is presented in Table 1.

2.1. Financial Barriers

High purchase cost, battery cost, the understanding of fuel and maintenance cost, and resale value are financial barriers to EV adoption. Compared with ICEVs, EVs have limited function [31]. As an emerging new technology, EVs are often expensive due to the lack of an economy of scale [29], and consumers must pay a much higher price than that of ICEVs; thus, the high purchase cost of EVs is a major barrier in many consumer surveys [20]. Battery cost is another barrier, and is a significant portion of EV cost [32]. Battery capacity increases with size, purchase cost, and range [33].
However, EVs have advantages in fuel and maintenance costs. The fuel cost of EVs comes from electricity, which is less expensive and produces fewer direct emissions compared to gasoline-fueled vehicles. EV maintenance cost is also less than that of ICEVs due to the reduced complexity of EV motors [15]. However, consumer purchasing decisions depend on several other factors besides technology and utility [32].

2.2. Vehicle Performance Barriers

EV performance barriers include range, engine power, reliability, battery lifespan, charging time, safety, size, and style. Numerous studies revealed that EV performance and range are major barriers to their adoption [23]. Drivers cannot estimate how far they could go or extend a journey on the basis of the remaining battery [33,34]. Therefore, battery depletion occurs while driving. The limited range of EVs is a concern to drivers and results in range anxiety during long journeys [30,35]. Other unsatisfying EV performance issues are charging time [31], safety, and reliability, which are raised by respondents who test-drive EVs. Consumers are also concerned about the limited EV sizes and styles on the market [32].

2.3. Infrastructure Barriers

Given that EV range is a major barrier to adoption, the availability of charging infrastructure is essential in order to support the wide adoption of EVs, as is the case with filling stations for ICEVs [29]. Public charging stations are important for EV demand and competition [36]. Overnight home charging is important to boost consumer convenience and the safety and security of vehicles [37].
Many studies in the literature have explored different barriers to global EV adoption. However, how all these barriers affect EV adoption in Thailand has not been addressed in the literature. Thus, this study analyzes all these barriers in the context of Thailand in order to close this research gap.

3. Methodology

3.1. Questionnaire Design and Survey

An online survey was conducted by using a questionnaire to identify barriers to EV adoption in Thailand. The questionnaire was divided into three sections. Section 1 focused on demographic information, including gender, age, educational background, household income, occupation, family size, car ownership, driving experience, knowledge of EV types, and expectation of EV price. In Section 2, a five-point Likert scales was used to identify barriers to EV adoption. From the literature review, 16 barriers (Table 1) were chosen for the EV adoption survey. Respondents were asked to rate how important the barriers to EV adoption were: 1, not at all important; 2, slightly important; 3, important; 4, fairly important; and 5, strongly important. Section 3 focused on views of public acceptance of EVs, including asking respondents about their willingness to buy an EV, to recommend an EV to others, and to own another EV. Respondents were asked to score as follows: 1, strongly unwilling; 2, slightly unwilling; 3, willing; 4, fairly willing; and 5, strongly willing. An open question was asked at the end of the questionnaire in order to allow for respondents give suggestions and opinions concerning EV adoption.
The questionnaire was online in March 2019 for 15 days. Invalid questionnaires were removed by using the following criteria: respondents had to be an adult and answer questionnaires without repeats or the same score in the variable group of Likert scales. In total, 454 out of 485 questionnaires passed the criteria, at 93.6% of the total responses.
Respondent characteristics are shown in Table 2. Respondents were 59.9% males and 40.1% females. Respondent ages were mostly in the ranges of 26–35 and 36–45 years, at 54.0% and 22.9%, respectively. About 93.4% of respondents had a bachelor’s degree, which enabled them to search for and distinguish the relative technological features and financial and environmental benefits of EVs and ICEVs [12]. Regarding the respondents’ occupation, 43.8% were company employees, employees, self-employed, and merchants, while 26.7% were government officials and state enterprise employees. Of the respondents, 37.7% were living in the capital, while 27.3% were living in the southern and western parts of Thailand; 85.2% of respondents already owned a private car, while 90.1% of respondents had driving licenses, and 74.2% had more than three years of driving experience. The monthly income of respondents was as follows: 26.7% of respondents had an income of THB 15,000–25,000 (USD 1 = THB 33.36), and 24.2% of respondents had a monthly income of more than THB 55,000 per month. Regarding EV expectation price, 31.5% of respondents expected an EV price of THB 700,000–1,000,000, and 31.3% of respondents expected it to be in the range of THB 500,000–700,000.

3.2. Chi-Squared Test

The chi-squared test is a statistical tool that is used to determine statistical relationships between variables through a null hypothesis of no correlation between a set of groups and outcomes of response. The significance level was set at 0.05; if the p value was less than 0.05, then the null hypothesis was rejected. The test statistic was
χ 2 = i = 1 c j = 1 r O i , j E i , j 2 E i , j
and
E i , j = n i n j N
χ2 is Pearson’s cumulative test statistic, which approaches a non-normal distribution with (r − 1) (c − 1). The degree of freedom was the row; column variables were independent. Oi,j is the number of observations in row i and column j. Ei,j is the expected frequency value in row i and column j. N is the total number of observations, and n is the number of cells in the table. The chi-squared test was used in this study to explore the relationship among barriers and personal characteristics on EV adoption.

3.3. Questionnaire Reliability

Cronbach’s alpha was used to evaluate the reliability or internal consistency of the barriers, as shown in Table 3. The Cronbach’s alpha of financial, performance, and infrastructure barriers is recommended to be above 0.70, which implies good reliability [38,39]. Technically, Cronbach’s alpha is a coefficient of reliability that is calculated from the equation as follows:
α = k × c ¯ v + k 1 c ¯ ¯
where α refers to Cronbach’s alpha; k is number of items; c ¯ is an average of all covariance between items; and v ¯ is the average variance of each item.

4. Result and Discussion

Samples were analyzed to explore 454 respondent opinions on EV barriers by using descriptive statistics.

4.1. Descriptive Analysis

The summary of the descriptive analysis results is listed in Table 4. Public infrastructure (BI1) had the highest average score, followed by “range on a charge’ (BP1), battery life (BP4), and safety (BP6) second, third and fourth, respectively. This indicates that most respondents are concerned about EV quality and public infrastructure. The requirements on EV range were not met, such as current battery life, safety issues, and charging time; these bother most consumers and pose potential barriers to EV adoption, even though some companies offer a five to eight year battery warranty and the availability of fast charging technology.
Vehicle performance barriers were the most concerning among respondents for EV adoption. This implied that respondent confidence in EV performance is still low. Respondents were also concerned about charging time and reliability, similarly to battery cost and home infrastructure. EV engine power and vehicle size and style were less important to most respondents by a significant margin than performance barriers. This implies that respondents cared more about performance with the exception of technical details.
The most obstructive factor for EV charging was the lack of available public infrastructure, especially on highways and at homes. The distance between cities is also a major hindrance, coupled with high land prices in the metropolitan area and major cities, thereby making it quite hard to have specific charging stations. Therefore, a public charging infrastructure was chosen by more respondents than home and highway infrastructure was. Workplace infrastructure was less of a barrier to availability, because respondents tend to use vehicles for vacations or longer journeys rather than to drive to work.
Battery cost and EV price were not highly ranked, despite battery cost being considered to be barrier for EV adoption, as described in [30]. However, the battery replacement cost of approximately THB 250,000–400,000 was unacceptable to respondents due to its cost being almost equivalent to the price of a brand-new ecocar.
EV operating cost was the least important to respondents among all barriers. The reason may be that the operating cost of EVs is only the battery charging bill. The maintenance cost of EVs is ranked higher than its operating cost, which could imply that respondents currently have a low understanding of maintenance cost, as EVs have fewer parts and a less complex engine than those of ICEVs. Respondents did not care about resale value. This may be because EVs are a new technology and there is no used-car market for EVs. It may take five to eight years or more for a used car market to appear.

4.2. Respondent Characteristics

Respondents were classified by gender, age, occupation, educational background, family size, driving experience, monthly income, and car ownership, and which individual characteristics significantly impact EV adoption.

4.2.1. Gender, Age, and Educational Background

The identified barriers are listed in Table A1 in the Appendix A, which compares various groups of barriers. Males and females had different views on most barriers. There were statistically significant views that were inconsistent with [40], which found that males and females had the same views on most barriers and purchase intention. Egbue and Long (2013), on the other hand, found that males tended to adopt EVs more than females did [24].
In terms of age, there was a statistically significant difference between groups BF1 (price), BF4 (maintenance cost), and BP5 (charging time). Respondents aged between 26 and 35 were found to be a barrier to EV adoption. These respondents are in the beginning of their family life and are thereby more careful about their finances. Respondents aged over 45 years old had the lowest score. The survey indicated that public EV adoption is more appealing to persons within the age group of 26–35 years old, while a study in Germany by Peter and Dütschke (2014) found that early adopters were middle-aged men who were living with their families [41].
Regarding educational background, there were five barriers which were statistically significant, namely, BF2 (battery cost), BF3 (EV fuel cost), BF5 (resale value), BP1 (range on a charge). and BP4 (battery life). Respondents with a higher education background thought that these barriers were an obstacle to EV adoption. Respondents with higher education showed the highest interest in adopting an EV. This is consistent with Krause et al. (2013), who found that the higher consumer education level was, the more likely they were to adopt an EV [21].

4.2.2. Occupation, Family Size, Car Ownership

Regarding occupation, two barriers were statistically significant, BF5 (resale value of EVs) and BP5 (charging time). Respondents with a stable career thought that BF5 and BP5 were impeditive to EV adoption. However, the development of fast charging technology and overnight charging at home might resolve this problem. This finding is similar to that in [31], where the authors found that charging speed was more important to consumers than available public charging stations were.
Table A1 shows a statistically significant intergroup difference, i.e., BF5 (resale value of EVs). Respondents who had more than three members in their family scored more than those with one or two family members. Respondents with a larger family showed a higher purchase intention, 42.1%, compared to 12.8% for smaller families. This implies that respondents with a large family were more concerned about resale value.
For car ownership, six barriers were statistically significant: BF1 (price), BF2 (battery cost), BF3 (EV fuel cost), BF5 (resale value), BP5 (charging time), and BP6 (safety). Regarding the purchase intention of respondents without a private car, only 5.3% showed interest in adopting an EV. Of respondents who already owned a private car, 49.2% were willing to adopt an EV. This implied that EVs are not the first choice for first car owners, similar to [41], which found that EVs were bought as an additional car in order to receive benefits from related policies.

4.2.3. Driving Experience and Monthly Income

As pertains to driving experience, respondents were divided into three groups: no driving experience; beginners with a driving license and less than three years of experience; and experienced drivers with a driving license and over three years of experience. BF2 (battery cost) and BP5 (charging time) were statistically significant. Experienced respondents thought battery cost was an obstacle to EV adoption. This implied that experienced drivers were more concerned about maintenance cost than about the initial cost. Charging time scored high with experienced drivers; this may be because the EV charging time is longer than the gasoline filling process at a gas station. Experienced drivers showed strong adoption of EVs, at 48.7%.
Regarding monthly income, there were three barriers with statistically significant results: BP2 (engine power), BP4 (battery life), and BI1 (public infrastructure). Purchase intention was statistically significant among groups; respondents with a higher income tend to adopt EVs at 55%, which is consistent with studies in Turkey and South Korea [42,43].

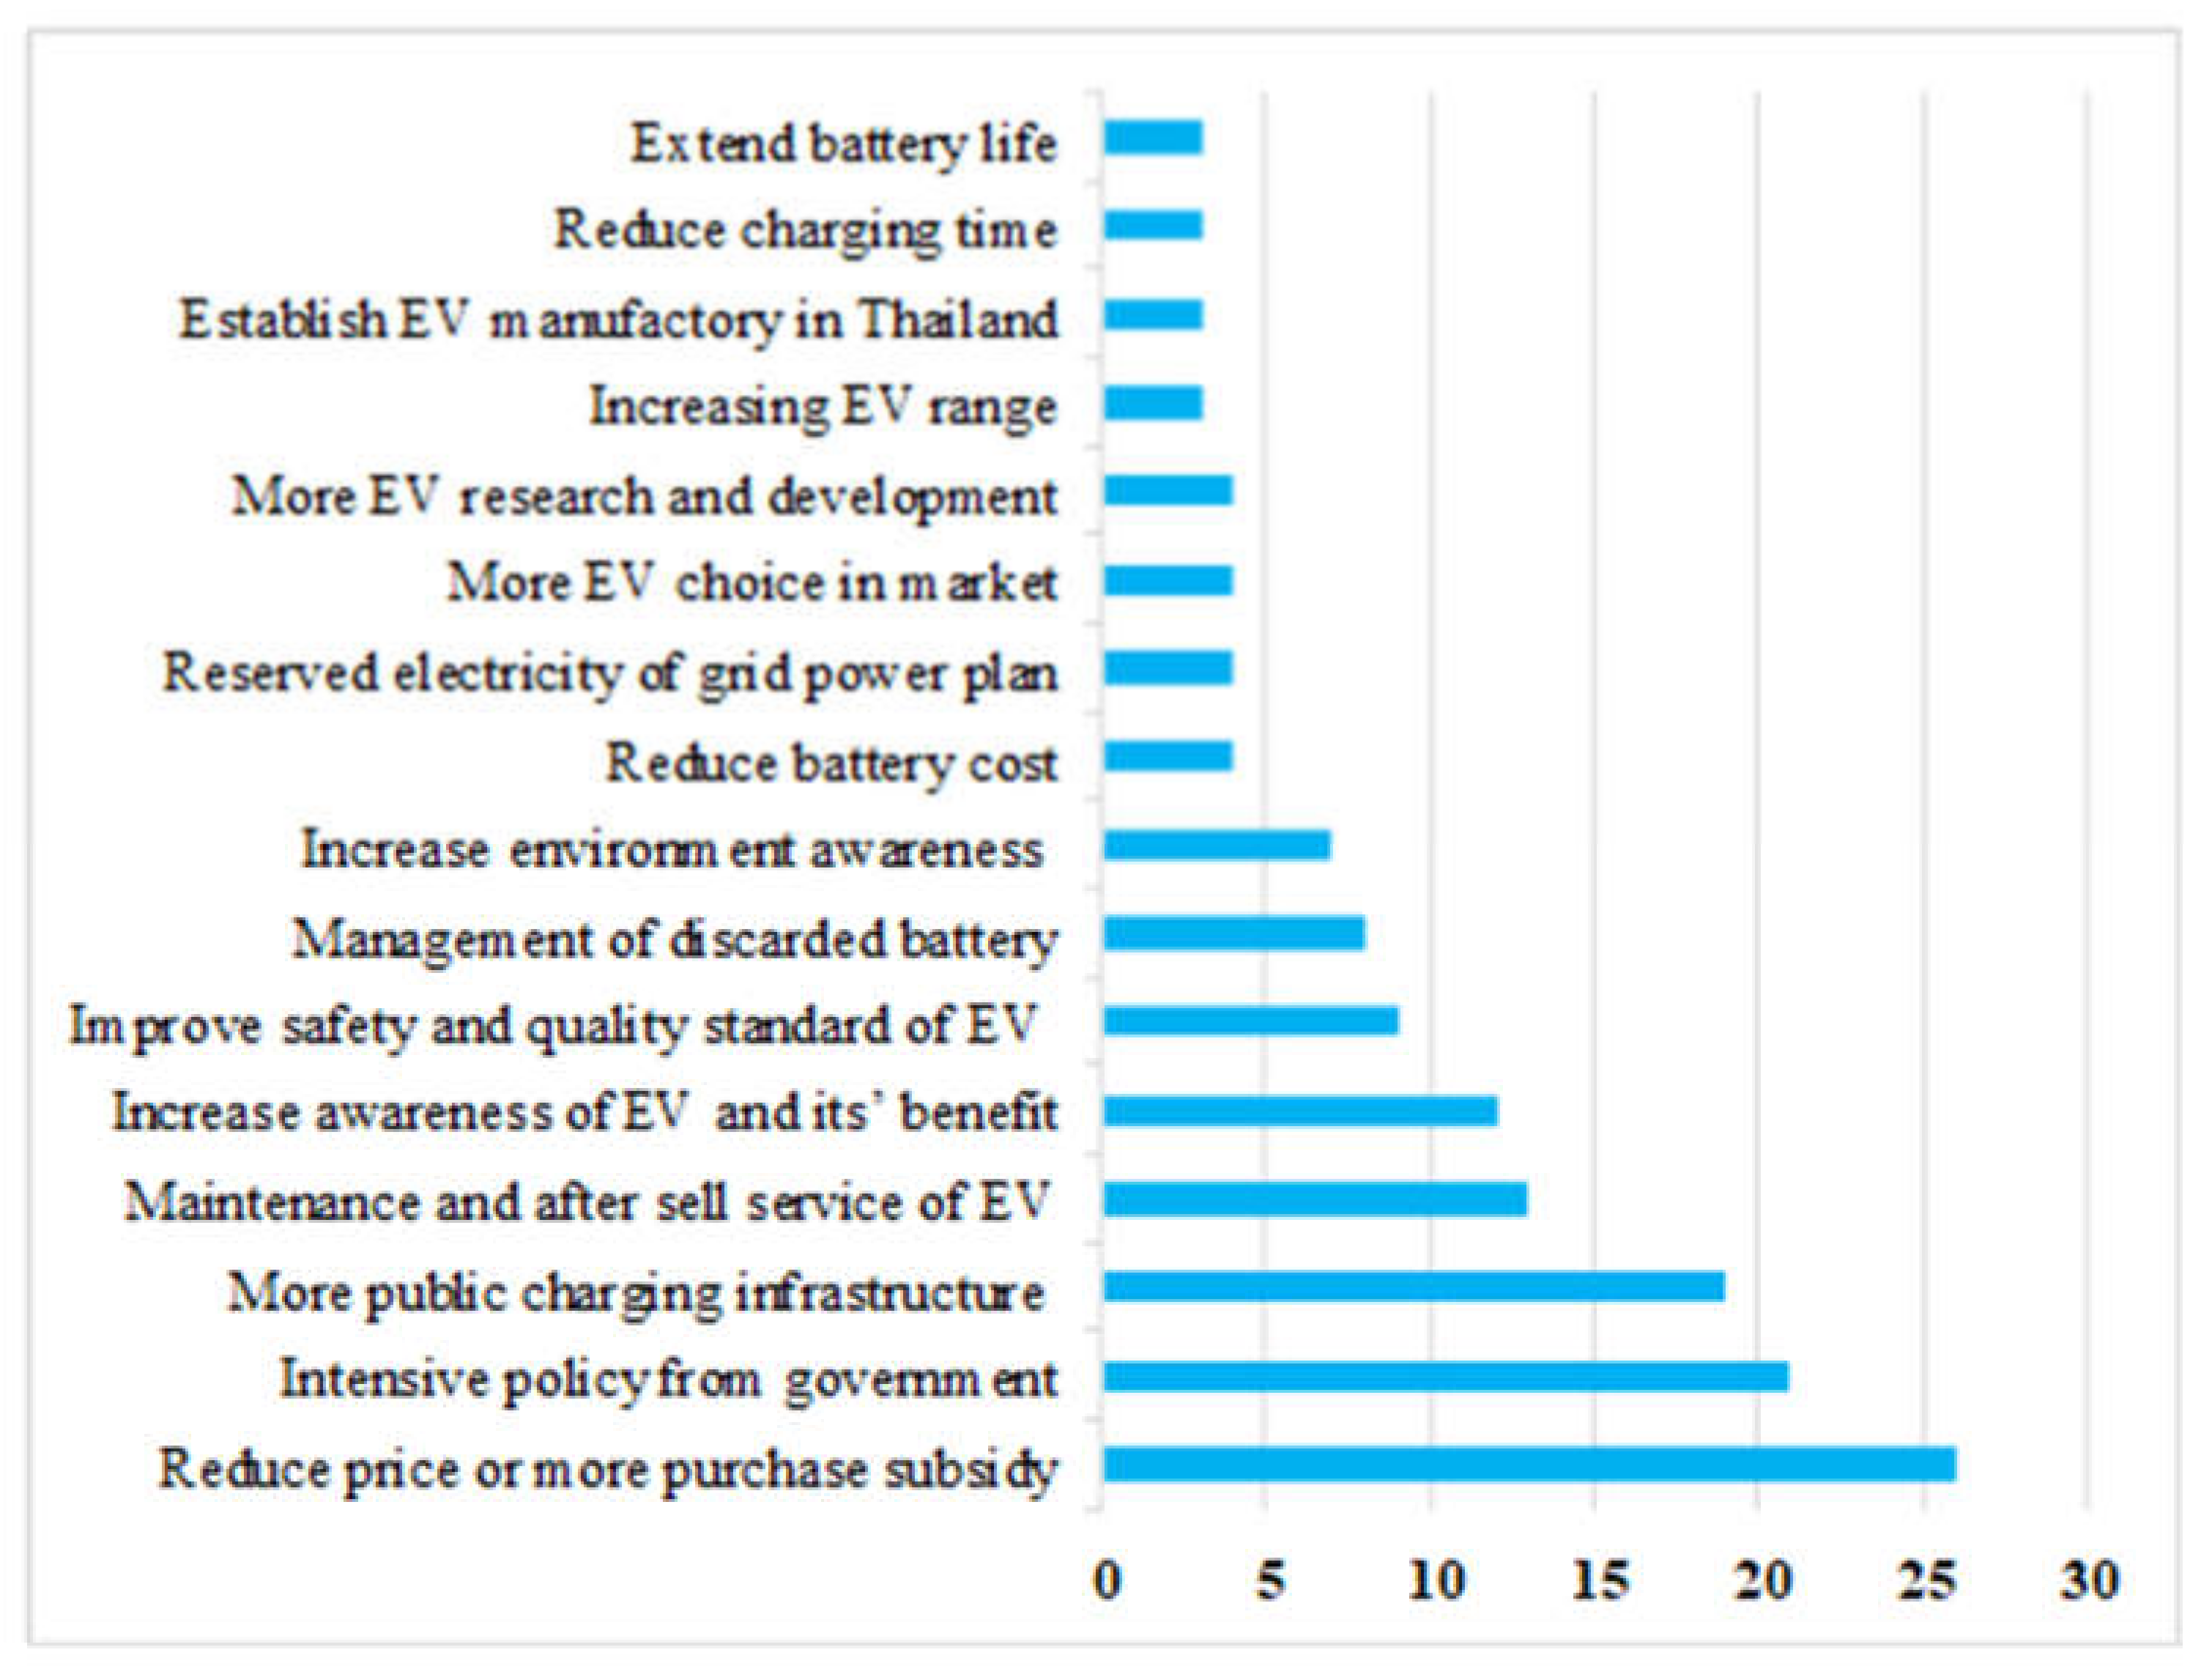
4.2.4. Expectations on Electric Vehicles

Out of 454 respondents, 139 answered an open question at the end of the questionnaire regarding expectations or suggestions on EV adoption, as shown in Figure 2. The top three respondent expectations were “reduction in price or more purchase subsidies”, “intensive policy from government”, and “more public charging stations”, stated by 26, 21 and 19 respondents, respectively. This suggests that EV pricing and subsidy policies are required to motivate consumers to adopt EVs. Clear and intensive policies are very helpful in relieving consumer concerns about EV trends and directions in Thailand, and price and charging infrastructure are important for quality EV services.
Moreover, respondents expected an improvement of EV performance. These include “improve safety and quality standard of EV”, “more EV research and development”, “increasing EV range”, “reduce charging time”, and “extend battery life”, mentioned nine, four, three, three and three times, respectively. This implied that people are unsatisfied with current EV performance.
Financial barriers were mentioned 43 times in total: “reduce price or more purchase subsidies” (26 times), “maintenance and after sell service of EVs” (13 times), “reduce battery cost” (four times). About one third of respondents expressed concern about financial barriers. This implies that EV subsidies are required in the early stages for EV adoption. However, the total cost of ownership might be more attractive than the initial cost in the long term.
Respondents also expressed expectations on environmental awareness. “Increased awareness of EVs and their benefits”, “management of discarded batteries”, and “increased environment awareness” were mentioned by 12, 8, and 7 respondents, respectively. Environmental issues might motivate environmentally aware respondents towards EV acceptance.
In addition, respondents raised suggestions on “reserved electricity of grid power plan”, “more EV choices on the market”, “establishing EV manufacturing plants in Thailand”. Policy makers should pay attention on these points for the next stage of adoption.
Many previous studies found similar results. For instance, Javid and Nejat (2017) found that charging station density is a crucial factor in EV adoption in California, USA [44]. In Sweden, it was found that increasing the number of public charging points resulted in higher adoption of EVs [28]. A similar finding was also observed in Norway [45]. Age significantly influenced EV adoption in Canada [46]. The barriers in this study are also common in India towards EV adoption, as explained in [47]. A study in the USA found that policy incentives for EV adoption play a crucial role [48]. Some barriers identified in this study for Thailand were also common in other studies, such as [11], where the authors considered many different barriers and drivers to global adoption of EVs. In the Nordic region, infrastructure and technical uncertainty were also indicated as the barriers towards EV adoption [49]. In Khan’s research [50], the author highlighted drivers for EV adoption in Austria, which include psychological and sociodemographic factors. Drivers and barriers might be interchangeable depending on context [9,50].

5. Conclusions

A survey of 454 respondents was conducted in order to investigate the barriers to EV adoption in Thailand. Respondents were aware of EVs and their benefits as a sustainable choice for transportation. However, EVs are a new technology that brings a new car market; thus, respondents have a wait-and-watch attitude when reacting to adoption. The main obstacles to adoption are financial, performance, and infrastructure, which challenge governments, policy makers, stakeholders, and the private sector to overcome these barriers. The most concerning EV barrier is public infrastructure, which could imply that currently available infrastructure does not meet public satisfaction. A large network of charging stations is essential for early EV adoption. Thailand has promoted public charging stations as a pilot project in both metropolitan and major cities such as Phuket, Pattaya, and Chiang-Mai. A universal charging type and convenient infrastructure are important for EV adoption. Hence, policy makers should focus on a number of charging stations, locations, infrastructure networks, distribution, and cooperation from private sector with a new technology business model. Vehicle performance, especially range on a charge and battery life, should be more developed, which could be a way to raise consumer interest in EVs. Lastly, experienced drivers aged in the range of 26–35 years could be targeted as early adopters for widespread EVs, as they show strong interest in EV adoption and are ready to purchase a car.
In addition, tax incentives should be provided in the early state of adoption to make EVs economically competitive with ICEVs. Increasing EV technology perception by consumers should raise widespread adoption. A standardized procedure for battery deterioration should be legislated for environmental awareness and sustainable transportation.
A limitation of this study is that while the respondents might know about EVs, they did not have real driving experience in them, as EVs are a new technology in Thailand. Respondents might change their attitudes after a test drive or obtaining real experience [37]. A survey across major cities is necessary for planning of future EV adoption as a pilot area to conveniently support EV adoption.

Author Contributions

Conceptualization, C.K.; methodology, C.K.; software, K.P.; validation, C.P., N.Y.; formal analysis, K.P.; investigation, K.T., C.Y.; resources; C.P.; data curation, K.T.; writing—original draft preparation, C.K., M.S.C.; writing—review and editing, M.S.C., I.K.; visualization, C.P., I.K., N.Y.; supervision, K.T.; project administration, K.T.; funding acquisition, C.Y., K.T. All authors have read and agreed to the published version of the manuscript.

Funding

This work was supported by Scholarship Awards for Thai Ph.D. students under Thailand’s Education Hub for Southern Region of ASEAN Countries and Overseas Thesis Research Scholarship from Prince of Songkla University.

Institutional Review Board Statement

Not applicable.

Informed Consent Statement

Not applicable.

Data Availability Statement

Not Applicable.

Acknowledgments

This research was supported by the grant Number ENV6402012N from Prince of Songkla University, Thailand. Authors also would like to thank Thomas Brudermann (https://homepage.uni-graz.at/de/thomas.brudermann/) and Lamin k. Marong for their constructive suggestion comments and feedback to this paper.

Conflicts of Interest

The authors declare no conflict of interest.

Appendix A

Table A1. Pearson chi-squared test of respondent’s characteristics.
Gender
(df = 4)
Age
(df = 16)
Educational Background (df = 8)Monthly Income
(df = 20)
Family Size
(df = 4)
Driving Experience
(df = 12)
Occupation
(df = 16)
Car ownership
(df = 8)
χ2p-Value χ2p-Value χ2p-Value χ2p-Value χ2p-Value χ2p-Value χ2p-Value χ2p-Value
BF110.8880.028 *29.1390.023 *9.0480.3387.7000.9942.7120.60715.4910.21621.5680.15820.7850.008 **
BF218.2070.001 *14.7970.54021.6330.006 **24.3610.2275.3130.25728.4250.005 **11.8320.75518.1320.020 *
BF334.9280.000 **25.7140.05830.4750.000 **18.9810.5232.6270.62215.6770.20620.7490.18827.4660.001 **
BF415.3230.004 *40.7800.001 **19.0130.015 *20.3410.4376.1840.18611.0850.52224.3260.0839.4500.306
BF526.0460.000 **21.3100.16722.2270.005 **20.5610.42311.1830.025 *9.4320.66630.7960.014 *26.4100.001 **
BP19.1050.05916.0650.44816.6210.034 *29.8870.0724.5880.33223.0230.028 *25.1510.0677.6190.472
BP214.5520.006 **19.4320.2478.7210.36633.2110.032 *1.4370.83813.6460.32414.9350.52911.0230.200
BP38.9400.0639.3000.90114.1920.07721.6870.3582.7780.59616.2980.17822.1810.1379.1860.327
BP419.0010.001 **17.1270.37715.6500.048 *36.1310.015 *3.3300.50425.9900.011 *25.6910.05910.2540.248
BP517.0260.002 **45.7220.000 **14.1900.07725.8950.1692.7890.59429.0130.004 **31.4590.012 *19.5100.012 *
BP64.1900.38121.7800.15010.8340.21126.9850.1364.2790.3706.5170.88824.8080.07318.2130.020 *
BP712.7640.012 *22.0390.1422.8700.94211.0840.9446.6750.1547.7520.80417.2010.37312.4930.131
BP80.6160.96113.1020.6659.3430.31417.6400.6111.3110.8597.2720.83920.3790.2049.8770.274
BI17.7380.10214.1350.5899.4860.30332.1370.042 *1.4660.83311.2980.50417.7160.34110.9230.206
BI210.5680.032 *15.3320.5009.7640.28222.9900.2894.0180.40415.6120.21020.6440.1934.7190.787
BI33.5880.46517.8230.33412.7360.12116.4490.6880.3660.98512.3800.41615.5700.48310.0100.264
BI45.3640.25226.3060.0507.8710.44625.2060.1941.4700.83213.7980.31419.1100.2632.2500.972
(df = 2)(df = 8)(df = 4)(df = 10)(df = 2)(df = 6)(df = 8)(df = 4)
Purchase intention28.6600.000 **15.4350.0512.2870.68337.2000.000 **0.2650.87635.0450.000 **11.3920.18018.4190.001 **
χ2 = Pearson’s chi squared. * p value < 0.05; ** p value < 0.01.

References

  1. Moeletsi, M.E. Socio-Economic Barriers to Adoption of Electric Vehicles in South Africa: Case Study of the Gauteng Province. World Electr. Veh. J. 2021, 12, 167. [Google Scholar] [CrossRef]
  2. IEA. Electric Vehicles 2020c; IEA: Paris, France, 2021. [Google Scholar]
  3. Rietmann, N.; Lieven, T. How policy measures succeeded to promote electric mobility–Worldwide review and outlook. J. Clean. Prod. 2019, 206, 66–75. [Google Scholar] [CrossRef]
  4. Patyal, V.S.; Kumar, R.; Kushwah, S. Modeling barriers to the adoption of electric vehicles: An Indian perspective. Energy 2021, 237, 121554. [Google Scholar] [CrossRef]
  5. Swaraz, A.; Satter, M.A.; Rahman, M.M.; Asad, M.A.; Khan, I.; Amin, M.Z. Bioethanol production potential in Bangladesh from wild date palm (Phoenix sylvestris Roxb.): An experimental proof. Ind. Crops Prod. 2019, 139, 111507. [Google Scholar] [CrossRef]
  6. Galiveeti, H.R.; Goswami, A.K.; Choudhury, N.B.D. Impact of plug-in electric vehicles and distributed generation on reliability of distribution systems. Eng. Sci. Technol. Int. J. 2018, 21, 50–59. [Google Scholar] [CrossRef]
  7. Shalalfeh, L.; AlShalalfeh, A.; Alkaradsheh, K.; Alhamarneh, M.; Bashaireh, A. Electric Vehicles in Jordan: Challenges and Limitations. Sustainability 2021, 13, 3199. [Google Scholar] [CrossRef]
  8. Pillai, J.R.; Bak-Jensen, B. Impacts of electric vehicle loads on power distribution systems. In Proceedings of the 2010 IEEE Vehicle Power and Propulsion Conference, Lille, France, 1–3 September 2010; pp. 1–6. [Google Scholar]
  9. Ministry of Energy. Thailand Energy Consumption Report 2017. 2018. Available online: http://www.eppo.go.th/index.php/en/en-energystatistics/electricity-statistic (accessed on 20 February 2021).
  10. Department of Land Transport. Department of Land Transportation. Total Vehicle Registration Data; 2018. Available online: http://www.dlt.go.th/minisite/m_upload/m_download/singburi/file_7cf81db11863f882ac1e6814fbb16c02.pdf (accessed on 20 February 2021).
  11. Kester, J.; Noel, L.; de Rubens, G.Z.; Sovacool, B.K. Policy mechanisms to accelerate electric vehicle adoption: A qualitative review from the Nordic region. Renew. Sustain. Energy Rev. 2018, 94, 719–731. [Google Scholar] [CrossRef]
  12. Ministry of Energy. Energy Efficiency Plan 2015–2036 (EEP2015); National Energy Policy Council (NEPC): Bangkok, Thailand, 2015. Available online: http://energyefficiency.gov.np/uploads/21_ee_strategy__1449652787.pdf (accessed on 20 February 2021).
  13. Thananusak, T.; Punnakitikashem, P.; Tanthasith, S.; Kongarchapatara, B. The development of electric vehicle charging stations in Thailand: Policies, players, and key issues (2015–2020). World Electr. Veh. J. 2021, 12, 2. [Google Scholar] [CrossRef]
  14. Energy Policy and Planning Office; Ministry of Energy. Project Prepare for Future Use of Electric Vehicles in Thailand. Available online: https://energy.go.th/2015/en/ (accessed on 20 February 2021).
  15. National Metal and Materials Technology Center (MTEC). Assessment of Electric Vehicle Technology Development and Its Implication in Thailand. Available online: https://www.mtec.or.th/en/ (accessed on 15 February 2021). (In Thai)
  16. Tarei, P.K.; Chand, P.; Gupta, H. Barriers to the adoption of electric vehicles: Evidence from India. J. Clean. Prod. 2021, 291, 125847. [Google Scholar] [CrossRef]
  17. Dua, R.; Hardman, S.; Bhatt, Y.; Suneja, D. Enablers and disablers to plug-in electric vehicle adoption in India: Insights from a survey of experts. Energy Rep. 2021, 7, 3171–3188. [Google Scholar] [CrossRef]
  18. Neaimeh, M.; Salisbury, S.D.; Hill, G.A.; Blythe, P.T.; Scoffield, D.R.; Francfort, J.E. Analysing the usage and evidencing the importance of fast chargers for the adoption of battery electric vehicles. Energy Policy 2017, 108, 474–486. [Google Scholar] [CrossRef]
  19. Kumar, R.R.; Alok, K. Adoption of electric vehicle: A literature review and prospects for sustainability. J. Clean. Prod. 2020, 253, 119911. [Google Scholar] [CrossRef]
  20. Jabbari, P.; Chernicoff, W.; MacKenzie, D. Analysis of electric vehicle purchaser satisfaction and rejection reasons. Transp. Res. Rec. 2017, 2628, 110–119. [Google Scholar] [CrossRef]
  21. Krause, R.M.; Carley, S.R.; Lane, B.W.; Graham, J.D. Perception and reality: Public knowledge of plug-in electric vehicles in 21 US cities. Energy Policy 2013, 63, 433–440. [Google Scholar] [CrossRef]
  22. Leontitsis, A.; Pagge, J. A simulation approach on Cronbach’s alpha statistical significance. Math. Comput. Simul. 2007, 73, 336–340. [Google Scholar] [CrossRef]
  23. Lim, M.K.; Mak, H.-Y.; Rong, Y. Toward mass adoption of electric vehicles: Impact of the range and resale anxieties. Manuf. Serv. Oper. Manag. 2015, 17, 101–119. [Google Scholar] [CrossRef]
  24. Egbue, O.; Long, S. Barriers to widespread adoption of electric vehicles: An analysis of consumer attitudes and perceptions. Energy Policy 2012, 48, 717–729. [Google Scholar] [CrossRef]
  25. Cronbach, L.J. Coefficient alpha and the internal structure of tests. Psychometrika 1951, 16, 297–334. [Google Scholar] [CrossRef] [Green Version]
  26. Graham-Rowe, E.; Gardner, B.; Abraham, C.; Skippon, S.; Dittmar, H.; Hutchins, R.; Stannard, J. Mainstream consumers driving plug-in battery-electric and plug-in hybrid electric cars: A qualitative analysis of responses and evaluations. Transp. Res. Part A Policy Pract. 2012, 46, 140–153. [Google Scholar] [CrossRef]
  27. Jensen, A.F.; Cherchi, E.; Mabit, S.L.; Ortúzar, J.d.D. Predicting the potential market for electric vehicles. Transp. Sci. 2017, 51, 427–440. [Google Scholar] [CrossRef] [Green Version]
  28. Zhang, Y.; Qian, Z.S.; Sprei, F.; Li, B. The impact of car specifications, prices and incentives for battery electric vehicles in Norway: Choices of heterogeneous consumers. Transp. Res. Part C Emerg. Technol. 2016, 69, 386–401. [Google Scholar] [CrossRef]
  29. Adner, R. When are technologies disruptive? A demand-based view of the emergence of competition. Strateg. Manag. J. 2002, 23, 667–688. [Google Scholar] [CrossRef]
  30. Illmann, U.; Kluge, J. Public charging infrastructure and the market diffusion of electric vehicles. Transp. Res. Part D Transp. Environ. 2020, 86, 102413. [Google Scholar] [CrossRef]
  31. Weiss, M.; Patel, M.K.; Junginger, M.; Perujo, A.; Bonnel, P.; van Grootveld, G. On the electrification of road transport-Learning rates and price forecasts for hybrid-electric and battery-electric vehicles. Energy Policy 2012, 48, 374–393. [Google Scholar] [CrossRef]
  32. Browne, D.; O’Mahony, M.; Caulfield, B. How should barriers to alternative fuels and vehicles be classified and potential policies to promote innovative technologies be evaluated? J. Clean. Prod. 2012, 35, 140–151. [Google Scholar] [CrossRef]
  33. Bubeck, S.; Tomaschek, J.; Fahl, U. Perspectives of electric mobility: Total cost of ownership of electric vehicles in Germany. Transp. Policy 2016, 50, 63–77. [Google Scholar] [CrossRef]
  34. Priessner, A.; Sposato, R.; Hampl, N. How to Trigger Mass-Market Adoption for Electric Vehicles?—An Analysis of Potential Electric Vehicle Drivers in Austria. Available online: https://www.eeg.tuwien.ac.at/conference/iaee2017/files/presentation/Pr_364_Priessner_Alfons.pdf (accessed on 15 February 2021).
  35. Liao, F.; Molin, E.; van Wee, B. Consumer preferences for electric vehicles: A literature review. Transp. Rev. 2017, 37, 252–275. [Google Scholar] [CrossRef] [Green Version]
  36. Hardman, S.; Jenn, A.; Tal, G.; Axsen, J.; Beard, G.; Daina, N.; Figenbaum, E.; Jakobsson, N.; Jochem, P.; Kinnear, N. A review of consumer preferences of and interactions with electric vehicle charging infrastructure. Transp. Res. Part D Transp. Environ. 2018, 62, 508–523. [Google Scholar] [CrossRef] [Green Version]
  37. Coffman, M.; Bernstein, P.; Wee, S. Electric vehicles revisited: A review of factors that affect adoption. Transp. Rev. 2017, 37, 79–93. [Google Scholar] [CrossRef]
  38. Nicholas, M.A.; Tal, G.; Turrentine, T.S. Advanced Plug-in Electric Vehicle Travel and Charging Behavior Interim Report; Institute of Transportation Studies, University of California: Davis, CA, USA, 2017. [Google Scholar]
  39. Bühne, J.-A.; Gruschwitz, D.; Hölscher, J.; Klötzke, M.; Kugler, U.; Schimeczek, C. How to promote electromobility for European car drivers? Obstacles to overcome for a broad market penetration. Eur. Transp. Res. Rev. 2015, 7, 1–9. [Google Scholar] [CrossRef] [Green Version]
  40. Peters, A.; Dütschke, E. How do consumers perceive electric vehicles? A comparison of German consumer groups. J. Environ. Policy Plan. 2014, 16, 359–377. [Google Scholar] [CrossRef]
  41. Kim, J.H.; Lee, G.; Park, J.Y.; Hong, J.; Park, J. Consumer intentions to purchase battery electric vehicles in Korea. Energy Policy 2019, 132, 736–743. [Google Scholar] [CrossRef]
  42. Erdem, C.; Şentürk, İ.; Şimşek, T. Identifying the factors affecting the willingness to pay for fuel-efficient vehicles in Turkey: A case of hybrids. Energy Policy 2010, 38, 3038–3043. [Google Scholar] [CrossRef]
  43. Javid, R.J.; Nejat, A. A comprehensive model of regional electric vehicle adoption and penetration. Transp. Policy 2017, 54, 30–42. [Google Scholar] [CrossRef]
  44. Egnér, F.; Trosvik, L. Electric vehicle adoption in Sweden and the impact of local policy instruments. Energy Policy 2018, 121, 584–596. [Google Scholar] [CrossRef] [Green Version]
  45. Mohamed, M.; Higgins, C.; Ferguson, M.; Kanaroglou, P. Identifying and characterizing potential electric vehicle adopters in Canada: A two-stage modelling approach. Transp. Policy 2016, 52, 100–112. [Google Scholar] [CrossRef]
  46. Goel, S.; Sharma, R.; Rathore, A.K. A Review on Barrier and Challenges of Electric Vehicle in India and Vehicle to Grid Optimisation. Transp. Eng. 2021, 4, 100057. [Google Scholar] [CrossRef]
  47. Wee, S.; Coffman, M.; La Croix, S. Do electric vehicle incentives matter? Evidence from the 50 US states. Res. Policy 2018, 47, 1601–1610. [Google Scholar] [CrossRef]
  48. Haddadian, G.; Khodayar, M.; Shahidehpour, M. Accelerating the global adoption of electric vehicles: Barriers and drivers. Electr. J. 2015, 28, 53–68. [Google Scholar] [CrossRef]
  49. Priessner, A.; Sposato, R.; Hampl, N. Predictors of electric vehicle adoption: An analysis of potential electric vehicle drivers in Austria. Energy Policy 2018, 122, 701–714. [Google Scholar] [CrossRef]
  50. Khan, I. Drivers, enablers, and barriers to prosumerism in Bangladesh: A sustainable solution to energy poverty? Energy Res. Soc. Sci. 2019, 55, 82–92. [Google Scholar] [CrossRef]
Figure 1. Global electric passenger car stock for 2019 and 2020. BEV: battery electric vehicles; PHEV: plug-in hybrid electric vehicles. Data source: IEA, Global EV Outlook 2021.
Sustainability 13 12839 g001
Figure 2. Respondent expectations on EVs.
Sustainability 13 12839 g002
Table 1. EV barriers selected from the literature for analysis.
Barrier TypeCodeActual BarrierExplanationSources
Financial barrierBF1EV priceEV price in market without purchase subsidy.[20]
BF2Battery costBattery replacement cost when it reaches end of life.[21]
BF3EV fuel costElectricity cost of driving EVs.[22]
BF4EV maintenance costRoutine maintenance cost of EVs except repair costs due to accidents.[22]
BF5EV resale valueResale value of EVs once sold as used cars.[23]
Vehicle performance barrierBP1Range on a chargeLongest range of driving per one full charge.[23]
BP2Engine powerMaximal speed and acceleration of EVs.[24]
BP3ReliabilityQuality and stability of EVs.[25]
BP4Battery lifeBattery lifespan caused by degradation.[25]
BP5Charging timeTime usage to fully charge an EVs.[26]
BP6SafetyFeelling safe while driving EVs.[23]
BP7Size and stylesAvailable size and styles of EVs in market.[20,27]
Infrastructure barrierBI1Public infrastructure availabilityPublic charging stations or spot services.[28]
BI2Infrastructure availability at homeCharging condition in residence communities.[29,30]
BI3Workplace infrastructure availabilityCharging condition at the workplace, e.g., office buildings.[24]
BI4Highway infrastructure availabilityCharging conditions in highway stations.[24]
Table 2. Respondent demographics.
DemographicItemPercentage
GenderMale59.9%
Female40.1%
AgeUnder 25 years7.0%
26–35 years54.0%
36–45 years22.9%
46–55 years12.1%
Over 56 years4.0%
Education backgroundDiploma/college6.6%
Bachelor61.7%
Master and higher31.7%
OccupationGovernment official/state enterprise employee26.7%
Company employee/employee43.8%
Self-employed/merchant18.3%
Student6.6%
Others4.6%
Family size1–2 person(s)24.2%
Over 3 persons75.8%
Car ownershipNone14.8%
1–2 cars70.7%
Over 3 cars14.5%
Driving experienceNo experience9.9%
0–3 years15.9%
3–5 years11.0%
Over 5 years63.2
EV expectation priceunder THB 500,00017.0%
THB 500,001–700,00031.3%
THB 700,001–1,000,00031.5%
THB 1,000,001–1,300,00012.1%
over THB 1,300,0018.1%
Monthly household incomeunder THB 15,00010.6%
THB 15,000–25,00026.7%
THB 25,001–35,00017.2%
THB 35,001–45,00010.8%
THB 45,001–55,00010.6%
over THB 55,00124.2%
N = 454
Note: THB, Thai baht.
Table 3. Reliability of questionnaires among barriers and motivator variables.
VariablesItemsCronbach’s Alpha
Financial barrierBF1, BF2, BF3, BF4, BF50.752
Vehicle performance barrierBP1, BP2, BP3, BP4, BP5, BP6, BP70.844
Infrastructure barrierBI1, BI2, BI3, BI40.861
Table 4. Descriptive analysis of barriers to EV adoption.
BarrierMinMaxMean ± SDRankBarrierMinMaxMean ± SDRank
BI1154.22 ± 1.0251BF2153.97 ± 1.0609
BP1154.18 ± 1.0082BF1153.94 ± 1.06410
BP4154.16 ± 0.9853BI3153.90 ± 1.15511
BP6154.16 ± 1.0464BF4153.74 ± 1.26512
BI4154.14 ± 1.0875BP2153.67 ± 1.08413
BP5154.06 ± 1.0786BP7153.63 ± 0.95614
BP3154.02 ± 1.0167BF5153.53 ± 1.14615
BI2154.02 ±1.1278BF3153.24 ± 1.29016
Publisher’s Note: MDPI stays neutral with regard to jurisdictional claims in published maps and institutional affiliations.

