Article

Mapping Tourists’ Destination (Dis)Satisfaction Attributes with User-Generated Content

1
Department of Consumer Science, College of Commerce and Public Affairs, Incheon National University, Incheon 22012, Korea
2
Department of Business Administration, College of Business Administration, Inha University, Incheon 22012, Korea
3
Department of Food Nutrition, College of BioNano Technology, Gachon University, Seongnam 13120, Korea
*
Authors to whom correspondence should be addressed.
Sustainability 2021, 13(22), 12650; https://doi.org/10.3390/su132212650
Submission received: 1 September 2021 / Revised: 11 November 2021 / Accepted: 12 November 2021 / Published: 16 November 2021
(This article belongs to the Special Issue Product Development for Sustainable Tourism)

Abstract

:
Although the tourism industry has increasingly used social media, there has been little empirical research in terms of the attributes of tourist satisfaction and dissatisfaction with user-generated contents. The purpose of this study is to explore the attributes of tourist satisfaction and dissatisfaction through user-generated contents. We collected data from online review platforms. Our data include historical online reviews, names of reviewers, ratings, location, helpful votes, date of visits, and contributions. In terms of results, the study found 30 key topics related to tourist satisfaction and dissatisfaction. Additionally, we found three clusters (i.e., holiday experience, attractions and facilities, and food experience). Lastly, we that suggested rating levels are different based on the type of tourists (i.e., domestic and international). This study provides discussions and implications for tourism research and industry practices.

1. Introduction

The advent of social media has increasingly altered the hospitality and tourism landscape and now plays a critical role in promotion, advertising, and marketing [1]. The use of social media is already a mainstream practice in the tourism industry, and it has already become a topic of recent study within the tourism industry [2,3]. Typically, these reviews are composed of textual data, which accrues into “big data” motherlodes of information—so much information that longstanding statistical methods are often incapable of analyzing it [3]. In order to investigate such big data, today’s academics have to use, in addition to traditional statistics, advanced techniques such as web crawling, computational linguistics, and text mining [4].
The dimensions of tourist satisfaction and dissatisfaction in a destination are oft-studied topics in the literature, but few of these studies have been conducted using user-generated content. For example, Park, et al. [5] examined dimensions of customers’ revisiting behavior in the hotel industry using textual data. Moro, et al. [6] suggested dimensions of guest satisfaction using textual data in the hotel industry. Few researchers, however, have traced tourist (dis)satisfaction through online textual reviews written by authentic customers [7], and the lack of such studies within the tourism and destination contexts is clear.
Therefore, the purpose of this study is to explore the attributes of tourist satisfaction and dissatisfaction with user-generated content. More specifically, the objectives of this study are twofold: (1) to explore the attributes of tourist satisfaction and dissatisfaction based on user-generated content, and (2) the relationship among attributes of satisfaction and dissatisfaction, rating, and tourist type.
The scope of this research is the set of attractions located in Incheon, South Korea. Incheon is the second largest port city in Korea and was the main gateway to commercial and cultural exchange in the late 19th century. Moreover, it is now home to Incheon International Airport and hosts Korea’s best music festivals and concerts. As such, Incheon is rapidly developing into a modern cultural capital.

2. Literature Review

2.1. Customer Satisfaction and Dissatisfaction

An organization’s prior, current, and potential success are all embodied in its degrees of customer satisfaction [8]. Customer-satisfaction levels reflect such critical consumption concepts as attitude change, repeat purchasing, and consumer loyalty [9]. Satisfaction’s criticality is amplified by the fact that dissatisfied customers complain and demand reparative action in compensation for their disappointed expectations [10].
In the tourism and hospitality context, Herzberg’s two-factor theory has been used in a variety of research settings to assess each attribute’s disparate impact that contributes to individual satisfaction and dissatisfaction [11]. Even though customer satisfaction and dissatisfaction have been commonly investigated in the relevant hospitality and tourism context (e.g., [12,13]), limited studies have considered them separately [14], in spite of the fact that individuals’ dissatisfaction and satisfaction are different constructs [15]. This tendency to amalgamate is a critical error, as customer satisfaction and dissatisfaction need to be conceptually different [15]. For example, previous research has often employed overall satisfaction scores to examine customer satisfaction, failing, in the process, to distinguish low satisfaction from dissatisfaction. However, as the two-factor theory reveals, satisfaction and dissatisfaction are not mutually exclusive and may both be present in a customer’s experience [16]: certain aspects of a service encounter may produce satisfaction while others simultaneously lead to dissatisfaction [17]. Finally, few hospitality-industry studies discuss customer dissatisfaction compared with satisfaction [18], leaving this vital construct underexamined.

2.2. Attributes as Determinants of Customer (Dis)Satisfaction in Hospitality and Tourism Research

A plethora of dimensions are known to influence customer (dis)satisfaction [10]. Most relevant researchers have indicated that hotel and restaurant attributes are causes of tourist satisfaction and dissatisfaction. Such studies (e.g., [18,19]) have shown that customer (dis)satisfaction toward hotels derives from numerous factors. These can include infrastructure elements (Wi-Fi, parking, room conditions), services (transportation, food and beverages, housekeeping and cleanliness), intangibles (quality of management, attitude of staff, peacefulness), and more. Sezgen, et al. [20] indicated that, in the airline industry, friendliness and helpfulness of staff, product value, and low price were the major elements driving satisfaction. Correspondingly, they also showed that service attributes such as seat comfort and legroom, luggage care, flight disruptions, and staff behaviors were the major factors behind passengers’ dissatisfaction. Furthermore, previous research [21] has shown that in restaurants, different dimensions—such as food, environment, service, interpersonal interaction, and diner motivation—decide customer (dis)satisfaction.
One complication in tourism research is that both tangible and intangible features exist in and define a destination [22]. These multiple attributes of a tourism destination are major factors driving tourist satisfaction. Prior research ([23]) has focused on destination attributes ranging from tourism activities (cultural attractions, recreational facilities, shopping, restaurant culture) to local amenities (hospitality infrastructure, natural environment, climate, security and safety, and quality of accommodations) to grasp tourists’ perceptions of their destination visits. Similarly, relevant research has revealed the key dimensions of the typical cruise experience, such as staff, entertainment, and value [24].
The hospitality and tourism industries aim to manage tourist ‘experiences’ to maximize customer satisfaction [25]. Overall, tourist satisfaction is chiefly decided by travelers’ evaluations of a tourism destination’s various attributes; customer (dis)satisfaction results from travelers’ perceptions of all of the elements that add up to create the trip experience [26]. Xiang, Schwartz, Gerdes and Uysal [7], using a text-analytical approach, dissected hotel guests’ reviews to document the connection between guests’ experiences and their satisfaction levels.
Previous studies ([10]) have examined significant differences in tourism destination elements by different travel characteristics (i.e., domestic versus international travel destinations). Studies (e.g., [27]) have demonstrated differences between the travel behaviors and satisfaction evaluations of domestic and international travelers. Magnini et al. [28] also stated that customer satisfaction could be affected by customers’ origins or the nature of their travel, showing differences between domestic and international hotel guests. Li, et al. [29] also separated domestic and international guests to indicate different patterns in customer-satisfaction ratings.

2.3. Examining Online Reviews

Online review platforms attract reviews and experience reports in large numbers from both satisfied and dissatisfied customers [30]. For that reason, online reviews can take researchers directly to the heart of the customer experience [31], with positive reviews detailing satisfaction and negative reviews encapsulating dissatisfaction [18]. In today’s marketplace, online reviews substantially affect how destinations are perceived by potential consumers, making them remarkably important to industry operators [32]. Tourism and hospitality organizations now routinely turn to online reviews to improve their service deliveries and product sets with insights from actual customers [33,34]. Online reviews have now been used to investigate travelers’ opinions on hotels, airlines, restaurants, and attractions, where most previous studies had employed reviews from this platform only to investigate tourists’ hotel and dining preferences [35]. The academic evaluation of online reviews is still a young field, and so far most of the literature conceives hotels and restaurants as homogenous hospitality settings—often focusing on the hotel aspect (e.g., [7,36]). Hotel-stay satisfaction is one of the hospitality dimensions most clearly documented in online customer reviews, and academia has taken notice.
The online reviews describe tourists’ experiences with products/services/destinations, and they reflect tourists’ assessments and satisfaction based on staying experience [37]. Because of the popularity of using online reviews, relevant studies have investigated individuals’ (dis)satisfaction from online reviews. Nonetheless, the researchers call for more research.

2.4. Social Media Analytics and Topic Modeling
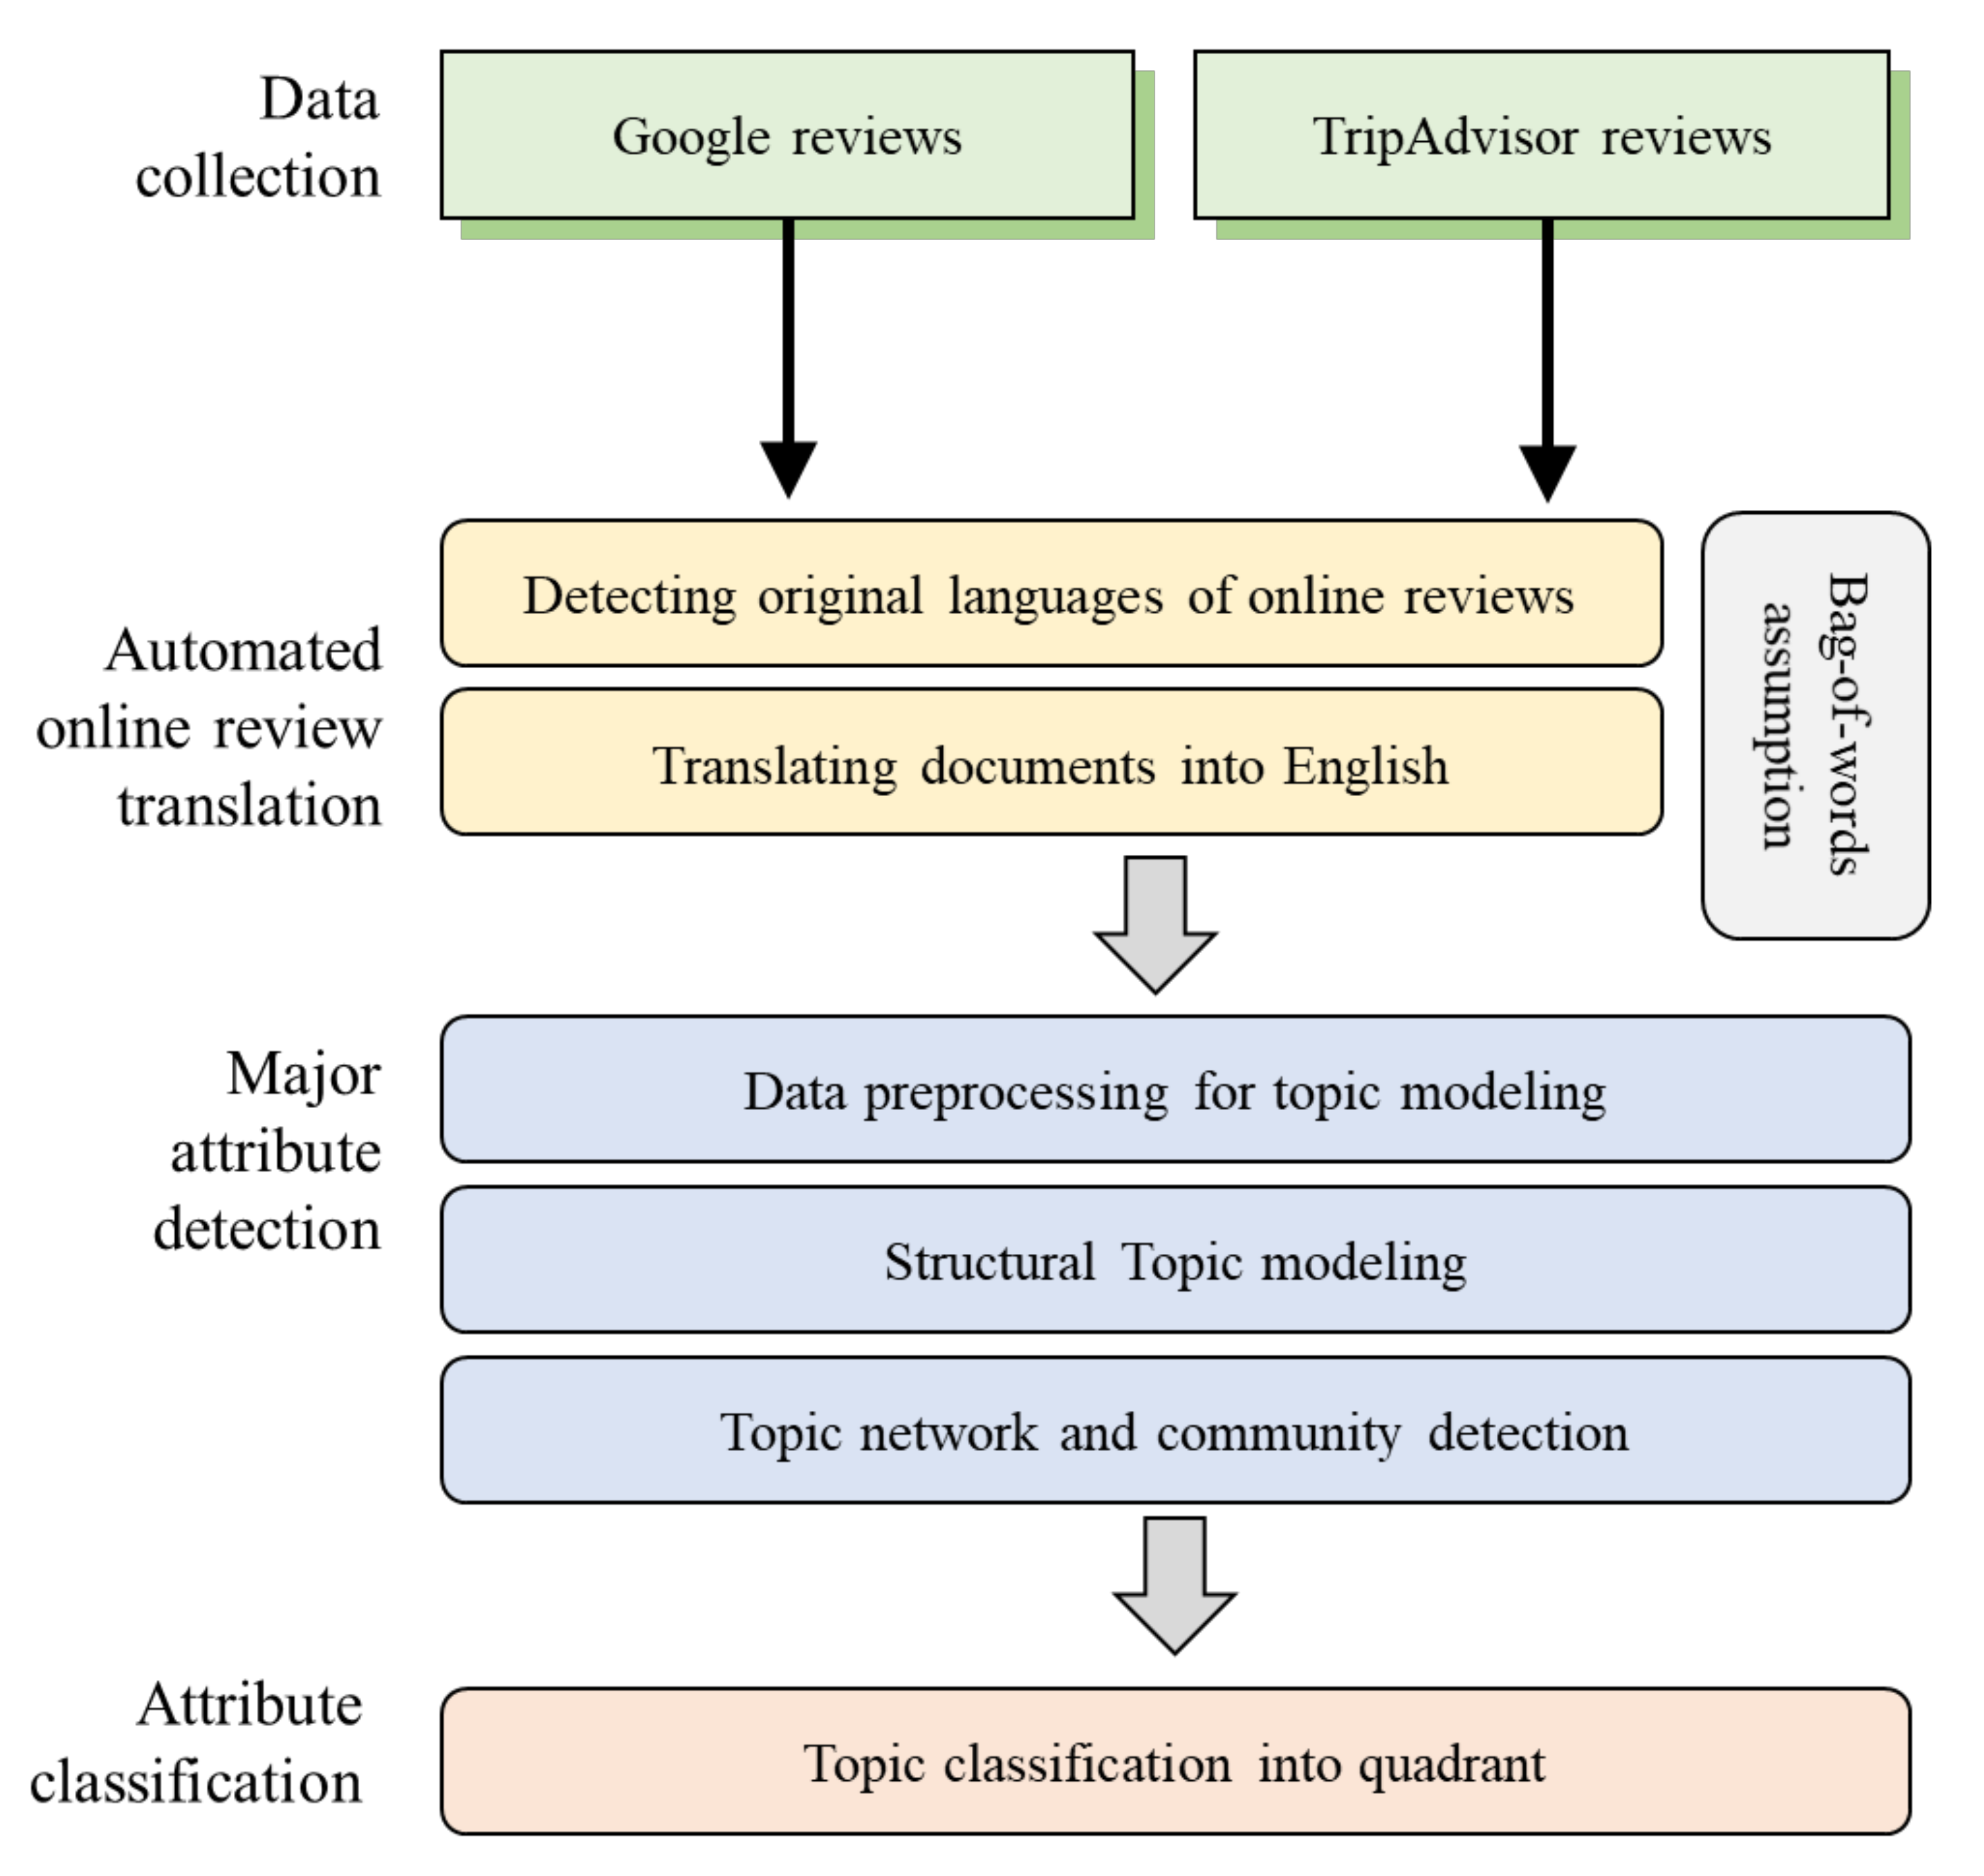
Social media produces massive troves of structured and unstructured data. Analyzing this data has required the development of novel techniques, culminating in the new interdisciplinary field of social-media analytics [38]. Relevant research has explored methods such as web crawling, data mining, and machine learning to gather, investigate, and understand textual data for meaningful insights [39]. Specifically, topic modeling—which is capable of discovering topics hidden in textual data—is frequently employed. One of these big-data analytic tools, topic modeling, has been employed in different fields (e.g., [40]). Researchers have identified latent topics from a large body of content (e.g., unstructured texts) [41]. Within the hospitality and tourism context, topic modeling has been employed for different purposes such as examining different types of reviews, analysis of multiple online review platforms, tourist-satisfaction analysis of visitors of hospitality and tourism-related organizations, consumer perceptions of hospitality and tourism-related products and services, investigating the posting of reviews in social media to document travelers’ experiences, and service-quality attributes from online reviews (e.g., [3,42]). Table 1 provides a summary of recent studies on topic modeling in the hospitality and tourism industry.
Structural topic modeling—or STM—a recent development in text analysis, has already proved itself in political science and linguistic studies, but it has not become typical in hospitality and tourism studies [46]. Even though customer-(dis)satisfaction investigations have been conducted using online reviews (e.g., [7]), scholarship utilizing STM within the tourism context is still paltry. Table 2 shows customer (dis)satisfaction-related research using (non)text analysis of online reviews.

3. Methods

3.1. Data Collection

To examine tourists’ perceptions, online reviews from two major online review platforms, i.e., Google and TripAdvisor, were collected with Python-based crawlers in July 2019. The following seven most popular attractions in Incheon were used as keywords to search online reviews: Incheon China town, fairytale town, Wolmido, the memorial hall for Incheon landing operation, Incheon Jayu park, and Sinpo international market. As a result, 6822 online reviews were collected. In addition to online reviews, the date the online reviews were written, name of reviewers, ratings, location (if available), helpful votes (if available), date of visits (if available), and contributions (if available) were collected.

3.2. Online Review Translation

One of the challenges of using user-generated content is the limited amount of metadata publicly available from which researchers can infer different patterns of tourist behavior by demographics or personal traits, which leads to another quest for researchers: discerning metadata from available information. We found Google reviews to have limited metadata compared to dedicated online review platforms (e.g., TripAdvisor and Yelp). However, due to their growing popularity among tourists around the globe, Google reviews have quite a large volume of reviews written in multiple languages. Similarly, TripAdvisor is one of the most popular review sites that lists a vast number of travel destinations throughout the world. Since we targeted the popular tourism destinations in Incheon, South Korea, most of the implicated online reviews were composed in foreign languages. Instead of selecting online reviews written in one language, different languages were identified to create new metadata: the apparent “nationality” of tourists. Due to the large number of data, this study adopted automated translation by using the R package “googleLanguageR.” Although human translation is optimal to capture the nuance of the sentence and intended meaning, the use of machine translation has been found to be suitable for topic modeling [51]. Grounded on the bag-of-words assumption, topic modeling ignores the order of vocabularies within a document [52]. Thus, topic modeling performs well regardless of the differences in language structures from multiple languages [51].
The following steps were followed to translate reviews. First, the original language of the online reviews was automatically detected. As a result, we found the online reviews were written in 13 different languages (e.g., Korean, English, and Chinese). Based on these language detection results, online reviews written in the same language were combined to create separate files, and each of these data files was used as an input to be translated into English. De Vries et al. [53] confirmed that machine translations using Google Translate can produce highly similar topic-modeling results to human translations. Still, to ensure the quality of translation and topic modeling results, two researchers whose first language is Korean and who are fluent in English reviewed the machine-generated Korean–English translation, and both researchers agreed on the adequacy of the machine translation. After removing online reviews whose language the machine process failed to detect, 6439 English-language online reviews remained for further data preprocessing.

3.3. Data Preprocessing and Structural Topic Modeling

Python was used for data preprocessing before text mining. All reviews were lowercased, and non-English characters, special characters, and common words (i.e., NLTK stop words) were removed. Based on the discussion of researchers, the list of additional stop words was created, and they were used for data cleaning. Python package “Gensim” was used to create bigrams and trigrams and lemmatize data. Data cleaning resulted in 210 short reviews, and finally, 6229 online reviews were used for text mining.
R-based probabilistic topic modeling, a form of structural topic modeling (STM), was performed to extract the latent themes from the online reviews [54]. Due to the probabilistic nature of topic modeling, the machine process generates different topics and values at each run. To ensure the reliability of the results, researchers set seeds in the line to make consistent results possible. Based on STM-generated indices, 30 topics were selected to build the model. Two researchers manually reviewed the top words and actual online reviews and discussed them to label the topics. Unlike in classification models or Latent Semantic Analysis where each document belongs to only one category, the probabilistic topic model (including STM) generates the probabilistic distribution of each document to all topics. Therefore, this approach can discover the associations of each document with multiple topics.
To examine associations among topics, the topic network was explored with a cutoff point of 10%. Additionally, eigenvector centrality scores were calculated for each topic node [55]. After comparing modularity scores of community detection algorithms, Greedy community detection was applied to identify clusters within topic correlation. Ratings and tourist types were used as metadata to estimate the effects of metadata on topic proportions. Based on the languages used for reviews, tourists were categorized as domestic tourists and international tourists. Specifically, all reviews written in Korean were recoded as “1 (domestic tourist),” and reviews in other languages were recoded as “0 (international tourists)”. To simplify the estimation with ratings, a new dummy variable was created with original rating scores ranging from 1 to 5; high rating scores (4 or 5) were converted to 0, and low rating scores (1, 2, or 3) were converted to 1. The implemented methodology is summarized in Figure 1.

4. Results

The majority of online reviews were written in 2018 (43.3%) and 2019 (35.8%). Nearly 70% of reviewers had four- or five-star rating scores, and Korean reviews accounted for the highest proportion among the reviews. Table 3 provides descriptive statistics of samples.

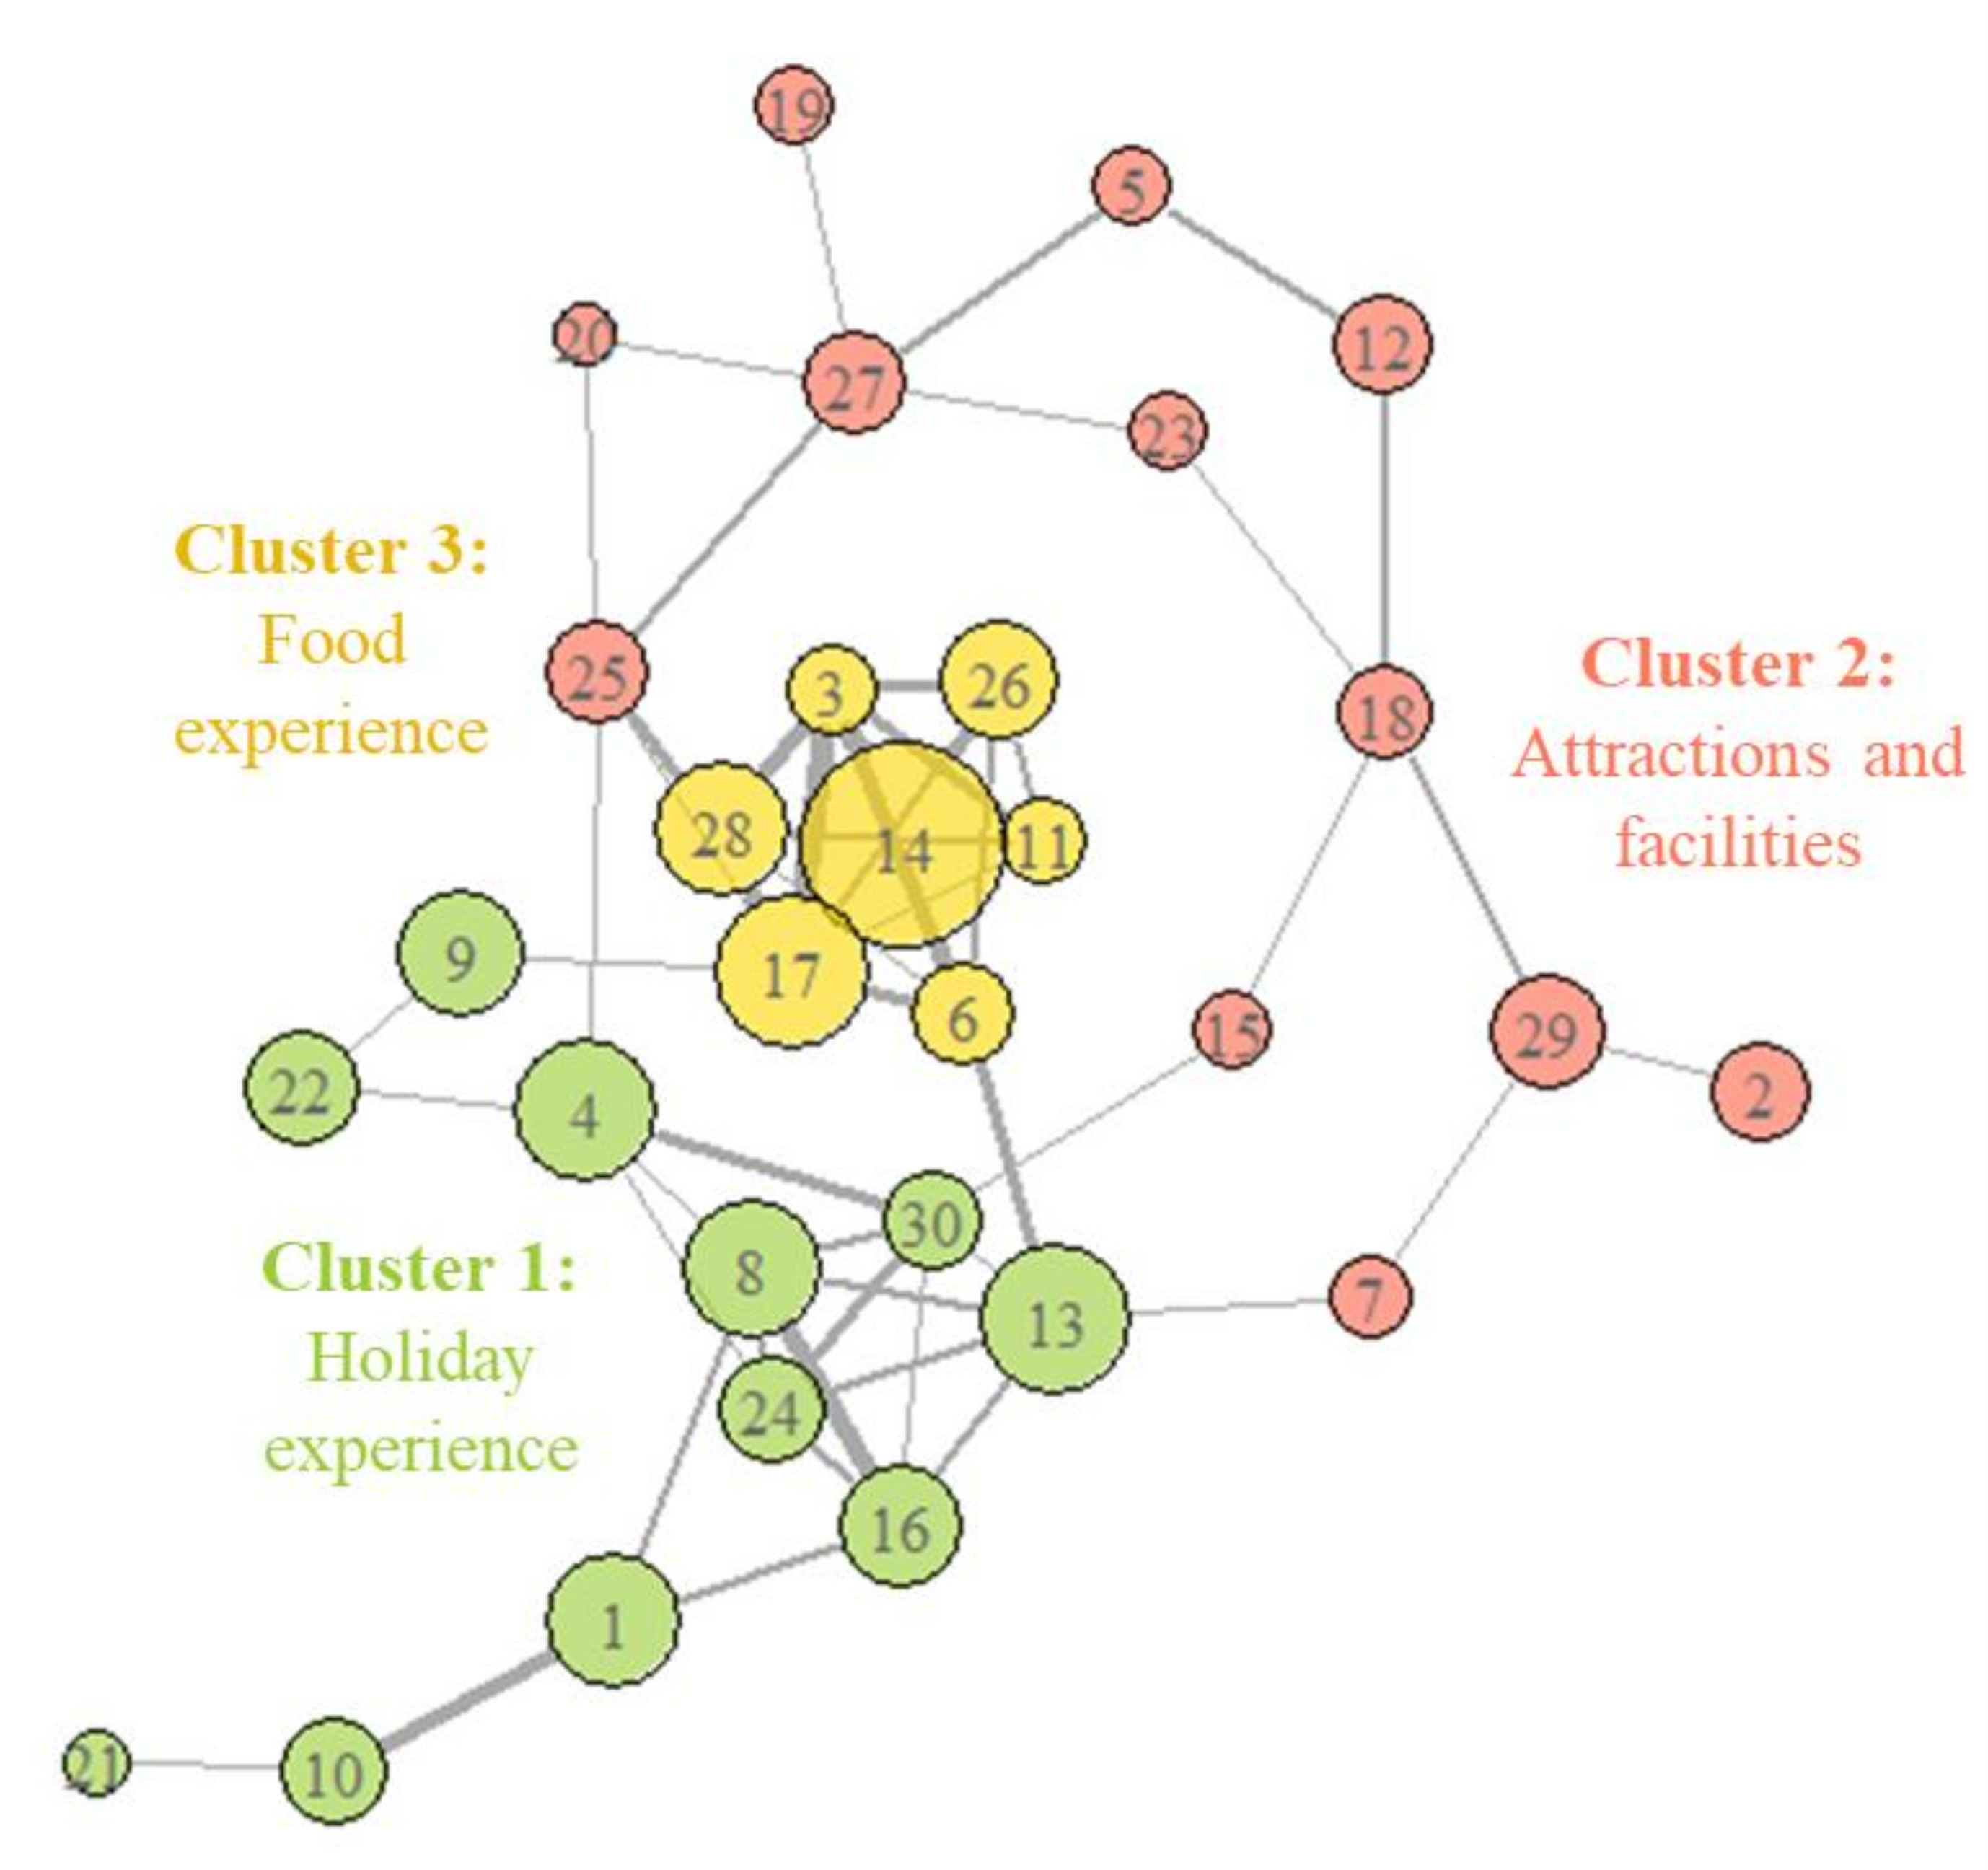
4.1. Identifying Salient Attributes

By applying STM, the 30 most salient topics were identified. Average topic weights represent the popularity of the topics. For the topics with high topic weights, travelers mentioned them more frequently than other topics with low topic weights. Topic 14, related to a special Korean dish called Chicken Ganjeong, was the most popular, accounting for about 6.2% of the total topic weight. Topic 17, regarding a variety of restaurant options, had the second-highest topic weight, accounting for nearly 4.7% of the total topic weight. The eigenvector centrality score indicates how strongly each topic is related to others. Topics related to food and restaurants, such as topics 17 (restaurant variety), 28 (food experience), and 14 (chicken dish), had high eigenvector centrality scores. Table 4 illustrates an overview of the 30 topics.
As a result of community detection, three clusters were discovered among the 30 topics (Figure 2). Topics that share common themes and have similar keywords are tightly connected in the topic network and thus more likely to be in the same cluster. Therefore, the tight topic correlation implies that these topics have overlapping keywords, or they were mentioned by the same person. Based on the 30 topics, 11 topics were grouped together in cluster 1. Twelve topics were included in cluster 2, and seven topics were classified together in cluster 3. Figure 1 shows the topic network. The clusters are as follows:
  • Cluster 1. A group of holiday experiences;
  • Cluster 2. A group of attractions and facilities;
  • Cluster 3. A group of food tourism.
Cluster 1 (e.g., holiday experiences) is mostly about tourists’ emotional expression (e.g., topic 13: positive experience) and behavior intention (e.g., topic 24: recommendation) while they are spending leisure time in the destinations. Topics that belonged to cluster 2 are more related to infrastructure and tangible facilities (e.g., topic 2: museum, topic 29: park). While clusters 1 and 2 are typical topics that can be found in many destinations, it is worth noting that one cluster is mostly about tourists’ experiences related to food.
Based on the topic network, centrality scores of topics were calculated to identify the most influential topics in the network, more specifically, a topic that has more dense connections with other topics. Among topics with the highest centrality scores, many of them belonged to cluster 3, such as topic 17 (Restaurant, centrality: 1.00), topic 28 (food experience, centrality: 0.83), and topic 14 (chicken dish, centrality: 0.77). Since these topics are tightly connected with other topics, they are more likely to be mentioned or recalled together with such other topics. Particularly, topic 14 (chicken dish) had the highest topic weight. More specifically, this is related to the characteristics of Incheon as a destination. Since the representative food of Incheon is a chicken dish which has appeared in the media frequently, tourists have mentioned it a lot, and it has served as a hub for Incheon tourism.
Some topics serve as a bridge to connect clusters because these topics have overlapping attributes among the clusters. For example, topic 4 (China town) of cluster 1 is connected to topic 25 (restaurants in China town) in cluster 2. After reviewing both top words and online reviews closely related to topic 4 and topic 25, researchers found that topic 4 is more related to tourists’ expression of their experiences in China town whereas topic 25 merely introduces the restaurants located in the destination. Similarly, topic 5 (tourist attraction) in cluster 2 is connected to topic 28 (food experience) in cluster 3. Topic 5 was mostly written by travelers who visited the famous tourist restaurants that have almost turned into touristic destinations, which explains why topic 5 and topic 28 are connected. Topic modeling results demonstrate that the same word (e.g., “china_town”) can have different intentions and meanings in different contexts. Therefore, it is helpful to create higher units by applying community detection so that topics can be comprehended based on the broader context.

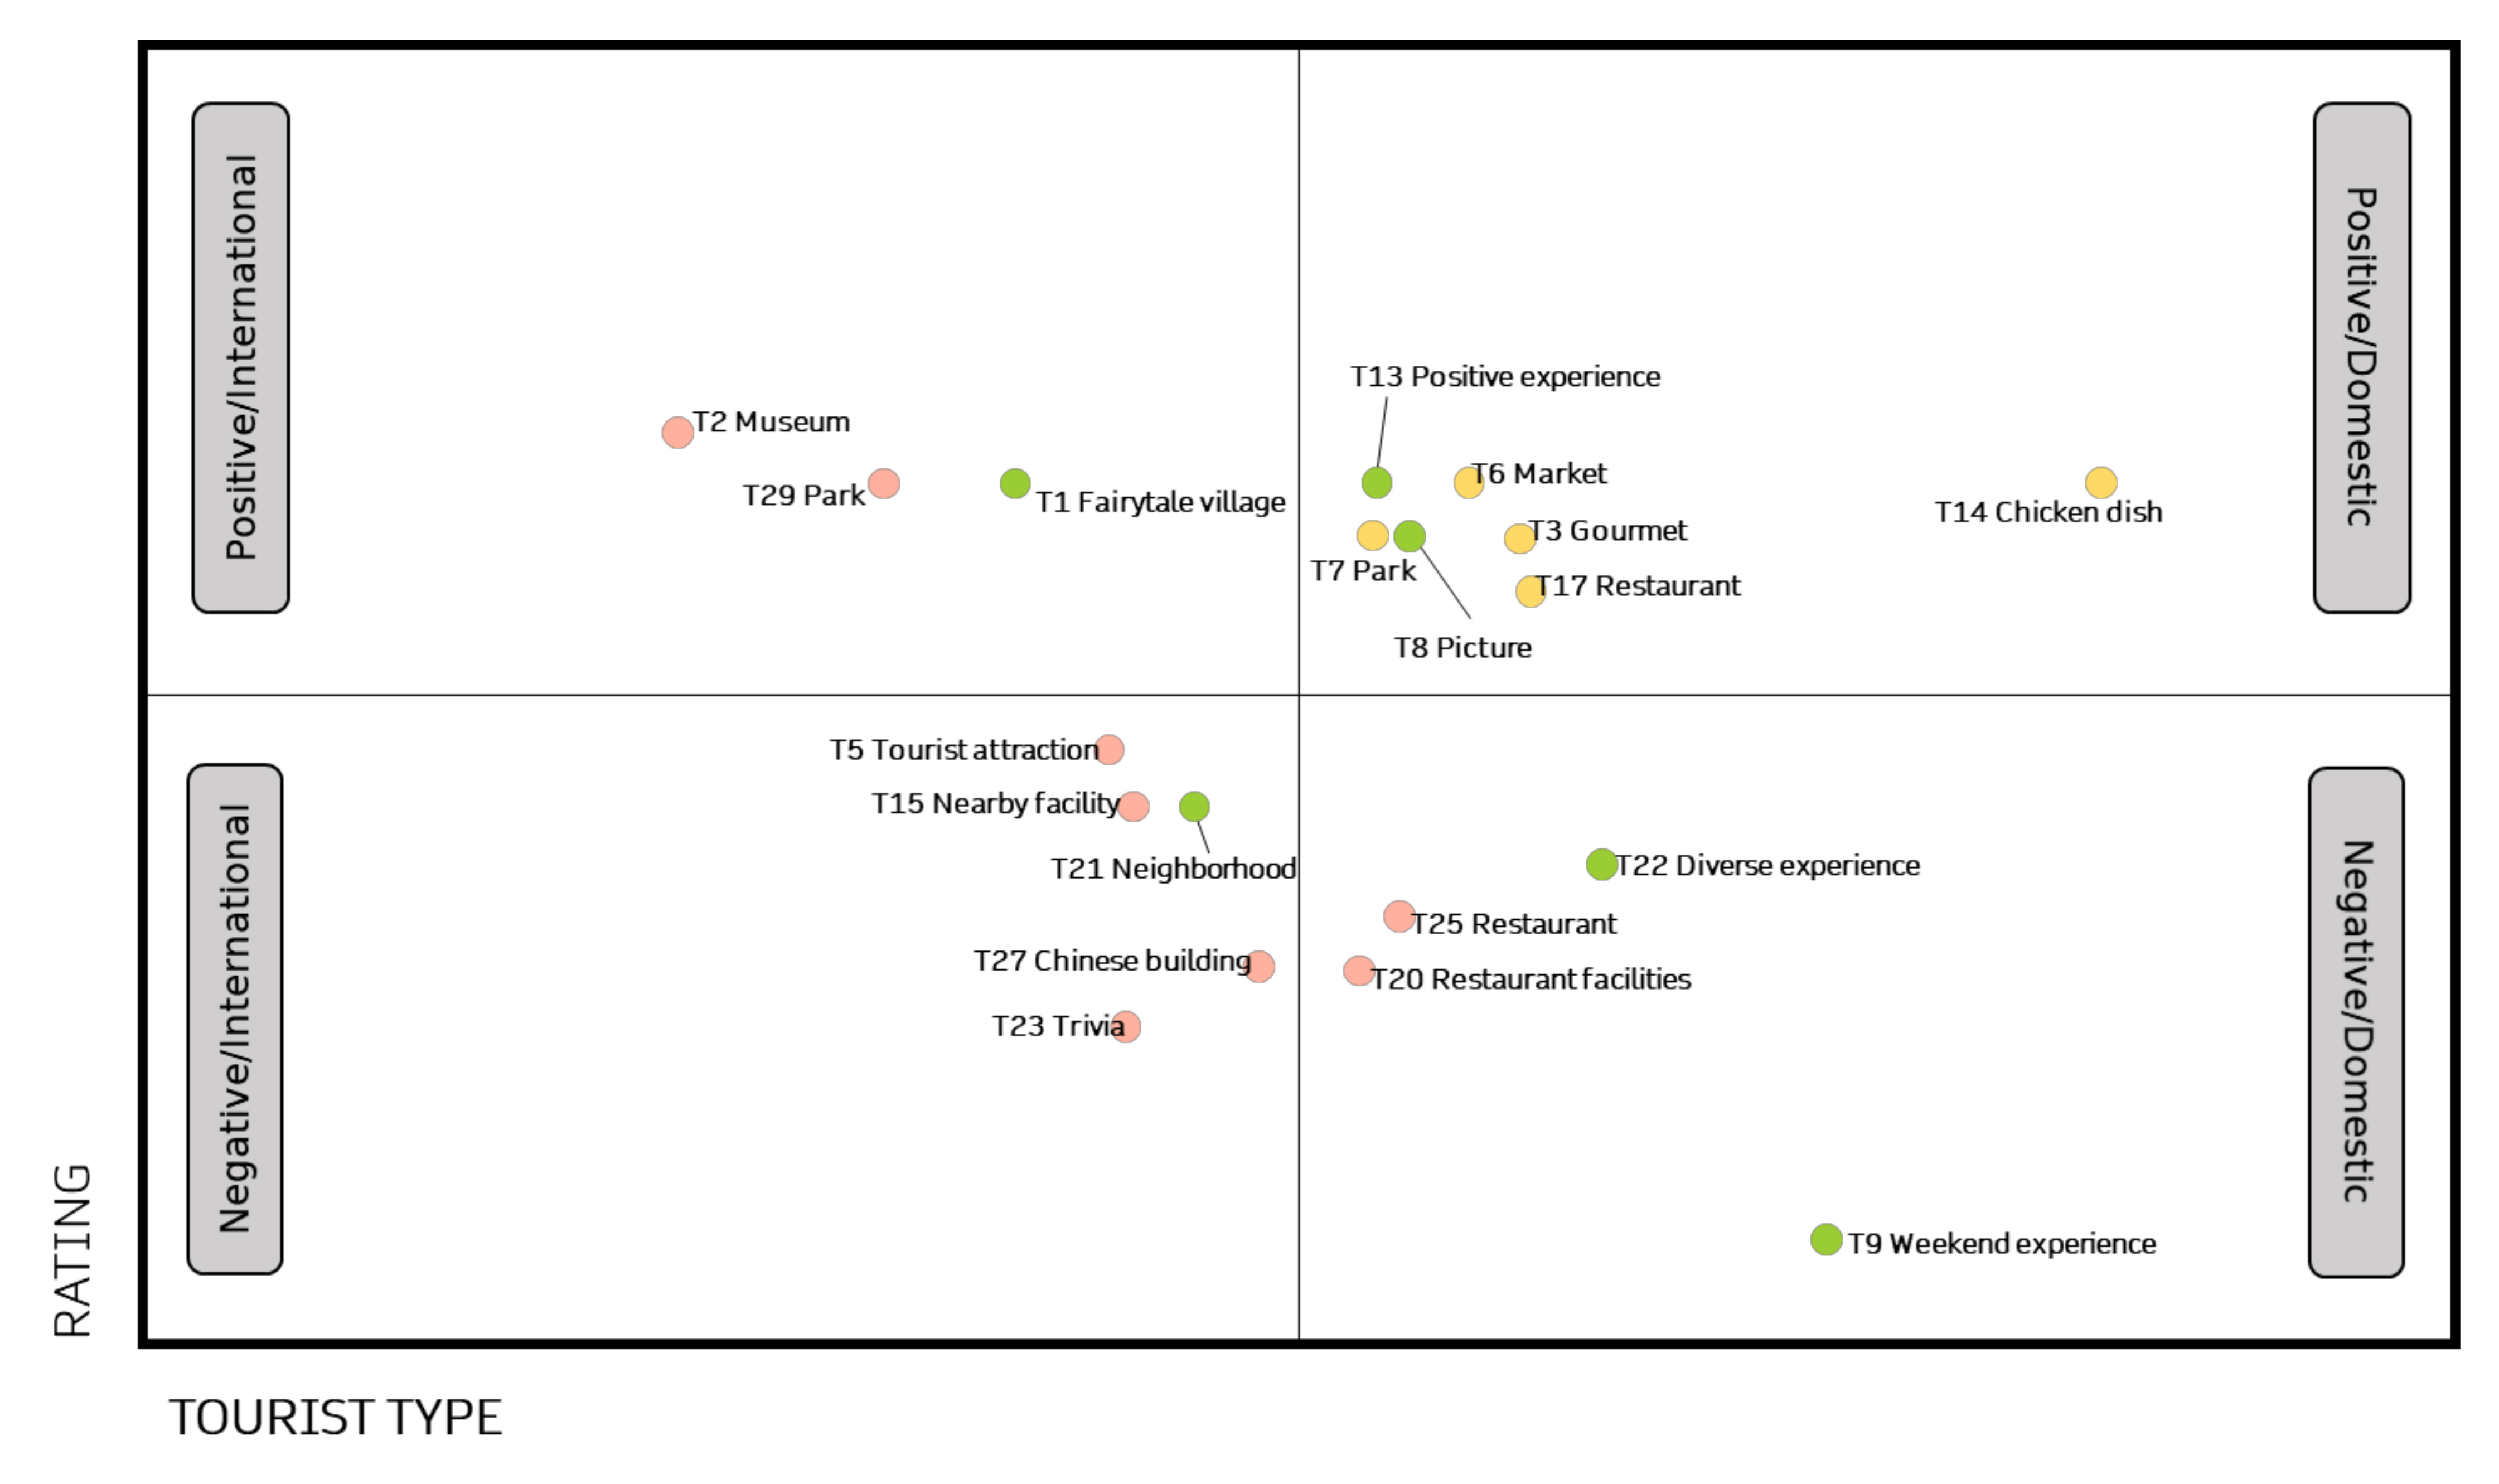
4.2. Classification of Attributes by Rating and Tourist Types

We investigated the difference between rating and tourist types. Topic weights were compared by ratings and tourist types (Table 5). In comparison to topic weights based on the rating dummy variable, positive coefficients demonstrated the number of reviews with high ratings (4 or 5) that surpassed low ratings (1, 2, or 3) for the particular topic. For example, topic 1 (fairytale village) had a positive coefficient in the rating comparison, meaning among tourists who mentioned the fairytale village, more people gave high star rating scores than low. In other words, tourists who visited the fairytale village were more likely to be satisfied with their past experiences. Therefore, the rating coefficient can demonstrate the positive or negative emotional state of a tourist, derived from the topic-related experience. A comparison of topic weights by tourist type demonstrated whether domestic or international tourists mentioned a specific topic more frequently. If domestic travelers mentioned a topic more often than international travelers, the topic had a positive coefficient and vice versa.
More specifically, in the group of holiday experiences, regarding the rating, topics with a positive coefficient for rating were fairytale village (topic 1), picture (topic 8), positive experience (topic 13), and child (topic 16), implying that tourists who had children and visited the fairytale village were more likely to be satisfied. They were also satisfied because there were many places to take pictures. However, tourists who went to the places during the weekend (topic 9) and expected more diverse experience (topic 22), and interesting neighborhood (topic 21) and diverse experience (topic 22) were dissatisfied. The comparison of topic weight by tourist type indicated most of the topics in a group of holiday experiences (e.g., topic 8: picture, topic 9: weekend experience) were more popular among domestic travelers, except for the neighborhood topic (topic 21). Therefore, within the group of holiday experience, we were able to isolate the difference between rating and tourist type.
In the group of attractions and facilities, topics related to parks and museums (topics 2, 7, and 29) had positive coefficients for rating, indicating reviews related to these topics had more high ratings than low ratings. However, six topics (e.g., topic 15: nearby facility, topic 20: restaurant) had negative coefficients for rating estimation. Specifically, domestic customers were more likely to be dissatisfied with restaurants near the attractions, whereas international customers were dissatisfied with the attractions themselves, such as a park or nearby facilities. Both domestic and international travelers were dissatisfied with Chinese buildings (topic 27) and evaluated their experiences as nothing special (topic 19). International travelers mentioned public transportation (topic 18) and local shops (topic 12) more frequently than domestic travelers. However, reviews related to these two topics had mixed ratings, and thus, the differences in topic weights by ratings were not significant.
All topics in the group of food tourism were related to foods, and domestic travelers mentioned them more frequently than international travelers. Domestic customers were satisfied because they had delicious foods (topic 3) and a variety of options (topic 17). Among topics that domestic travelers mentioned more than international travelers, the topic related to the special Korean chicken dish (topic 14), chicken gangjeong, had the greatest difference in topic weight between domestic and international travelers. Not only did domestic travelers frequently mention the chicken dish, but also, they were satisfied with their experiences and had high ratings.
Figure 3 shows the classifications of topics by satisfaction and tourist type. Domestic travelers mentioned the topics belonging to cluster 3 (food experience) more frequently than did international tourists, indicating they had greater interest in food experiences. Additionally, these food experiences tended to be evaluated positively. On the other hand, international tourists were more interested in destination attributes related to physical facilities and attractions. In particular, fairytale village, museum, and freedom park had a positive relationship with the overall satisfaction score. Both domestic and international tourists were dissatisfied with the physical building and facilities related to cluster 2. While domestic tourists were concerned about and dissatisfied with the quality of experience and intangible attributes of tourism products, international tourists were more dissatisfied with tangible attributes, such as the surrounding facilities or neighborhoods.

5. Discussion and Conclusions

Although the tourism industry has increasingly adopted user-generated content as a source of data on customer experiences, there have been few empirical studies identifying the dimensions of tourist satisfaction and dissatisfaction using user-generated content [13,47]. This study explored text mining as a means of identifying the key aspects shared by tourists in their online reviews. First, we found key topics such as topics 17 (restaurant variety), 28 (food experience), and 14 (chicken dish) from user-generated content. This finding is aligned with that of previous studies [56]. Second, based on the topic-correlation results, three clusters of topics frequently mentioned by travelers were identified (i.e., holiday experience, attractions and facilities, and food experience). This finding is related to some previous studies [57]. This may suggest that the group of holiday experiences was satisfied regarding family, pictures, and positive experience. In the group of food tourism, they were satisfied with the restaurant variety and food experience. Third, by comparing the topic proportion between the high- and low-rating reviews, the satisfying and dissatisfying aspects were discovered. This study compared topic proportions between domestic and international travelers to see whether they have different interests or expectations in various aspects.
In terms of implications, first, we found hidden key topics and three clusters from user-generated content. In other words, this study provides a new market segmentation approach based on user-generated content. Most previous studies have focused on market segmentation based on traditional methods (e.g., surveys). However, this research provides new insights regarding market-segmentation approaches [58]. More specifically, marketers can obtain user-generated content and hidden topics from consumers’ perceptions as revealed in online reviews. For instance, this approach could provide market segmentation effectively in order to identify existing tourists and potential tourists based on real data. This implies that destination marketing organizations (DMOs) and governmental tourist agencies might consider these topics in order to attract more potential tourists to their destinations [59]. For example, destination marketing plans can be divided into three groups (e.g., holiday experience, attractions and facilities, and food experience) for future marketing plans; this concept is directly related to market segmentation [57]. Thus, in order to satisfy consumer needs and wants, marketers might provide specific attractions and services based on their needs by analyzing data [60]. For example, marketers could consider focusing on positive experiences for the group of the holiday experience. For a group of attractions and facilities, marketers might provide more tourism destinations. In terms of the group of food experiences, marketers could consider providing more of a variety of food experiences for them.
Second, destination marketing organizations could consider personalization based on the nationalities of tourists (i.e., domestic tourists and international tourists) [61]. Personalization is, overall, already mainstream in the tourism industry. Destination marketers could consider the cultural background of tourists as these backgrounds can influence their tourism selections [61]. For instance, in terms of the group of the holiday experience, international tourists might require a more authentic travel experience compared to domestic tourists. Therefore, the destination marketing organization could consider preparing an authentic travel experience for international tourists.
Third, marketers might consider using and developing guidelines to connect customer relationship management (CRM). There are some prior research projects that have investigated the relationship between impacts of user-generated content and customer relationship management (i.e., online customer reviews) in the context of the tourism industry [13]. This is because customer-relationship management can affect firm performance. Typically, customer-relationship management presents two issues: management response and proactivity. For instance, marketers can respond to customers’ needs and wants by monitoring and verifying social media proactively. In addition, marketers might track textual data to predict emerging issues related to the destination [62].
Lastly, there is still a lack of scholarship identifying the attributes of user-generated content [32]. This study used user-generated data for analyzing text-based content in a tourism destination. Advanced text-mining techniques could complement traditional methods [63]. In other words, adopting user-generated-content approaches has some benefits compared with traditional methods for data collection and data analysis [64]. This implies that this study might contribute to filling the absence of utility among tourism destinations and user-generated content. Thus, this approach provides benefits to researchers for capturing the most commonly emerging and important topics and determining how these are changing and evolving in different areas [65].
Although there are advantages in adopting and analyzing big data using user-generated content, this study has some limitations. First of all, this study focuses on a specific destination, so a generalization of the findings should be approached with prudence. Future studies might consider extending this study’s approach to other cities or countries or other opinion-gathering websites and platforms. This is because the utilization of textual data could encompass cultural information (e.g., locations). In addition, although this study encompassed, in the form of more than 6800 online reviews, travelers’ natural reactions to their destination visits, this study’s methods did not sample travelers who did not write online reviews. Therefore, future research could consider leveraging mixed methods (e.g., interviews, surveys) to understand more detailed responses and behavioral intentions in relation to the overall destination experience.

Author Contributions

Data curation, S.-B.K.; formal analysis, W.K.; investigation, E.P. All authors have read and agreed to the published version of the manuscript.

Funding

This work was supported by Incheon National University Research Grant in 2020.

Institutional Review Board Statement

Not applicable.

Informed Consent Statement

Not applicable.

Data Availability Statement

Not applicable.

Conflicts of Interest

The authors declare no conflict of interest.

References

  1. Hou, Z.; Cui, F.; Meng, Y.; Lian, T.; Yu, C. Opinion mining from online travel reviews: A comparative analysis of Chinese major OTAs using semantic association analysis. Tour. Manag. 2019, 74, 276–289. [Google Scholar] [CrossRef]
  2. González-Rodríguez, R.; Martínez-Torres, R.; Toral, S. Post-visit and pre-visit tourist destination image through eWOM sentiment analysis and perceived helpfulness. Int. J. Contemp. Hosp. Manag. 2016, 28, 2609–2627. [Google Scholar] [CrossRef]
  3. Guo, Y.; Barnes, S.; Jia, Q. Mining meaning from online ratings and reviews: Tourist satisfaction analysis using latent dirichlet allocation. Tour. Manag. 2017, 59, 467–483. [Google Scholar] [CrossRef] [Green Version]
  4. Berger, J.; Humphreys, A.; Ludwig, S.; Moe, W.W.; Netzer, O.; Schweidel, D.A. Uniting the Tribes: Using Text for Marketing Insight. J. Mark. 2019, 84, 1–25. [Google Scholar] [CrossRef]
  5. Park, E.; Kang, J.; Choi, D.; Han, J. Understanding customers’ hotel revisiting behaviour: A sentiment analysis of online feedback reviews. Curr. Issues Tour. 2018, 23, 605–611. [Google Scholar] [CrossRef]
  6. Moro, S.; Batista, F.; Rita, P.; Oliveira, C.; Ribeiro, R. Are the States United? An Analysis of U.S. Hotels’ Offers Through TripAdvisor’s Eyes. J. Hosp. Tour. Res. 2019, 43, 1112–1129. [Google Scholar] [CrossRef]
  7. Xiang, Z.; Schwartz, Z.; Gerdes, J.H.; Uysal, M. What can big data and text analytics tell us about hotel guest experience and satisfaction?. Int. J. Hosp. Manag. 2015, 44, 120–130. [Google Scholar] [CrossRef]
  8. Oliver, R.L. Whence Consumer Loyalty? J. Mark. 1999, 63, 33–44. [Google Scholar] [CrossRef]
  9. Fornell, C. A National Customer Satisfaction Barometer: The Swedish Experience. J. Mark. 1992, 56, 6–21. [Google Scholar] [CrossRef]
  10. Kim, W.-H.; Lee, C.; Kim, S. The Influence of Hallyu on Africans’ Perceptions of Korea: The Moderating Role of Service Quality. Sustainability 2020, 12, 3245. [Google Scholar] [CrossRef] [Green Version]
  11. Herzberg, F.M.; Mausner, B.; Snyderman, B.B. The Motivation to Work, 2nd ed.; John Wiley and Sons Inc.: New York, NY, USA, 1959. [Google Scholar]
  12. Gu, B.; Ye, Q. First Step in Social Media: Measuring the Influence of Online Management Responses on Customer Satisfaction. Prod. Oper. Manag. 2013, 23, 570–582. [Google Scholar] [CrossRef]
  13. Kim, W.-H.; Chae, B. Understanding the relationship among resources, social media use and hotel performance. Int. J. Contemp. Hosp. Manag. 2018, 30, 2888–2907. [Google Scholar] [CrossRef]
  14. Zhou, L.; Ye, S.; Pearce, P.; Wu, M.-Y. Refreshing hotel satisfaction studies by reconfiguring customer review data. Int. J. Hosp. Manag. 2014, 38, 1–10. [Google Scholar] [CrossRef]
  15. Chowdhary, N.; Prakash, M. Service Quality: Revisiting the Two Factors Theory. J. Serv. Res. 2005, 5, 61–75. [Google Scholar]
  16. Matzler, K.; Sauerwein, E. The factor structure of customer satisfaction. Int. J. Serv. Ind. Manag. 2002, 13, 314–332. [Google Scholar] [CrossRef]
  17. Mittal, V.; Ross, J.W.T.; Baldasare, P.M. The Asymmetric Impact of Negative and Positive Attribute-Level Performance on Overall Satisfaction and Repurchase Intentions. J. Mark. 1998, 62, 33–47. [Google Scholar] [CrossRef] [Green Version]
  18. Xu, X.; Li, Y. The antecedents of customer satisfaction and dissatisfaction toward various types of hotels: A text mining approach. Int. J. Hosp. Manag. 2016, 55, 57–69. [Google Scholar] [CrossRef]
  19. Li, H.; Ye, Q.; Law, C.H.R. Determinants of Customer Satisfaction in the Hotel Industry: An Application of Online Review Analysis. Asia Pac. J. Tour. Res. 2013, 18, 784–802. [Google Scholar] [CrossRef]
  20. Sezgen, E.; Mason, K.J.; Mayer, R. Voice of airline passenger: A text mining approach to understand customer satisfaction. J. Air Transp. Manag. 2019, 77, 65–74. [Google Scholar] [CrossRef]
  21. Vu, H.Q.; Li, G.; Law, C.H.R.; Zhang, Y. Exploring Tourist Dining Preferences Based on Restaurant Reviews. J. Travel Res. 2017, 58, 149–167. [Google Scholar] [CrossRef] [Green Version]
  22. Kim, W.-H.; Lee, S.-H.; Kim, K.-S. Effects of sensory marketing on customer satisfaction and revisit intention in the hotel industry: The moderating roles of customers’ prior experience and gender. Anatolia 2020, 31, 523–535. [Google Scholar] [CrossRef]
  23. Moon, H.; Han, H. Destination attributes influencing Chinese travelers’ perceptions of experience quality and intentions for island tourism: A case of Jeju Island. Tour. Manag. Perspect. 2018, 28, 71–82. [Google Scholar] [CrossRef]
  24. Tao, S.; Kim, H.-S. Cruising in Asia: What can we dig from online cruiser reviews to understand their experience and satisfaction. Asia Pac. J. Tour. Res. 2019, 24, 514–528. [Google Scholar] [CrossRef]
  25. Chen, C.-F.; Chen, F.-S. Experience quality, perceived value, satisfaction and behavioral intentions for heritage tourists. Tour. Manag. 2010, 31, 29–35. [Google Scholar] [CrossRef]
  26. Bianchi, C. Solo Holiday Travellers: Motivators and Drivers of Satisfaction and Dissatisfaction. Int. J. Tour. Res. 2015, 18, 197–208. [Google Scholar] [CrossRef]
  27. Muñoz, L.; Hausner, V.; Brown, G.; Runge, C.; Fauchald, P. Identifying spatial overlap in the values of locals, domestic- and international tourists to protected areas. Tour. Manag. 2018, 71, 259–271. [Google Scholar] [CrossRef]
  28. Magnini, V.P.; Crotts, J.C.; Zehrer, A. Understanding Customer Delight. J. Travel Res. 2011, 50, 535–545. [Google Scholar] [CrossRef]
  29. Li, H.; Wang, C.; Meng, F.; Zhang, Z. Making restaurant reviews useful and/or enjoyable? The impacts of temporal, explanatory, and sensory cues. Int. J. Hosp. Manag. 2018, 83, 257–265. [Google Scholar] [CrossRef]
  30. Litvin, S.W.; Goldsmith, R.E.; Pan, B. Electronic word-of-mouth in hospitality and tourism management. Tour. Manag. 2008, 29, 458–468. [Google Scholar] [CrossRef]
  31. Park, E.; Kim, W.-H.; Kim, S.-B. Tracking tourism and hospitality employees’ real-time perceptions and emotions in an online community during the COVID-19 pandemic. Curr. Issues Tour. 2020, 1–5. [Google Scholar] [CrossRef]
  32. Toral, S.L.; Martínez-Torres, M.R.; González-Rodríguez, R. Identification of the Unique Attributes of Tourist Destinations from Online Reviews. J. Travel Res. 2017, 57, 908–919. [Google Scholar] [CrossRef]
  33. Phillips, P.; Barnes, S.; Zigan, K.; Schegg, R. Understanding the Impact of Online Reviews on Hotel Performance. J. Travel Res. 2016, 56, 235–249. [Google Scholar] [CrossRef] [Green Version]
  34. Schuckert, M.; Liu, X.; Law, C.H.R. Hospitality and Tourism Online Reviews: Recent Trends and Future Directions. J. Travel Tour. Mark. 2015, 32, 608–621. [Google Scholar] [CrossRef]
  35. Luo, J.M.; Vu, H.Q.; Li, G.; Law, R. Topic modelling for theme park online reviews: Analysis of Disneyland. J. Travel Tour. Mark. 2020, 37, 272–285. [Google Scholar] [CrossRef]
  36. Berezina, K.; Bilgihan, A.; Cobanoglu, C.; Okumus, F. Understanding Satisfied and Dissatisfied Hotel Customers: Text Mining of Online Hotel Reviews. J. Hosp. Mark. Manag. 2015, 25, 1–24. [Google Scholar] [CrossRef]
  37. Sánchez-Franco, M.J.; Navarro-García, A.; Rondán-Cataluña, F.J. A naive Bayes strategy for classifying customer satisfaction: A study based on online reviews of hospitality services. J. Bus. Res. 2018, 101, 499–506. [Google Scholar] [CrossRef]
  38. Mirzaalian, F.; Halpenny, E. Social media analytics in hospitality and tourism. J. Hosp. Tour. Technology. 2019, 10, 764–790. [Google Scholar] [CrossRef]
  39. Xiang, Z.; Du, Q.; Ma, Y.; Fan, W. A comparative analysis of major online review platforms: Implications for social media analytics in hospitality and tourism. Tour. Manag. 2017, 58, 51–65. [Google Scholar] [CrossRef]
  40. Reisenbichler, M.; Reutterer, T. Topic modeling in marketing: Recent advances and research opportunities. J. Bus. Econ. 2018, 89, 327–356. [Google Scholar] [CrossRef] [Green Version]
  41. Kaplan, S.; Vakili, K. The double-edged sword of recombination in breakthrough innovation. Strat. Manag. J. 2014, 36, 1435–1457. [Google Scholar] [CrossRef]
  42. Korfiatis, N.; Stamolampros, P.; Kourouthanassis, P.; Sagiadinos, V. Measuring service quality from unstructured data: A topic modeling application on airline passengers’ online reviews. Expert Syst. Appl. 2018, 116, 472–486. [Google Scholar] [CrossRef] [Green Version]
  43. Kirilenko, A.P.; Stepchenkova, S.O.; Dai, X. Automated topic modeling of tourist reviews: Does the Anna Karenina principle apply? Tour. Manag. 2020, 83, 104241. [Google Scholar] [CrossRef]
  44. Wen, H.; Park, E.; Tao, C.-W.; Chae, B.; Li, X.; Kwon, J. Exploring user-generated content related to dining experiences of consumers with food allergies. Int. J. Hosp. Manag. 2019, 85, 102357. [Google Scholar] [CrossRef]
  45. Chatterjee, S. Drivers of helpfulness of online hotel reviews: A sentiment and emotion mining approach. Int. J. Hosp. Manag. 2020, 85. [Google Scholar] [CrossRef]
  46. Hu, N.; Zhang, T.; Gao, B.; Bose, I. What do hotel customers complain about? Text analysis using structural topic model. Tour. Manag. 2019, 72, 417–426. [Google Scholar] [CrossRef]
  47. Park, E.; Kim, W.-H.; Kwon, J. Understanding the relationship between green restaurant certification programs and a green restaurant image: The case of TripAdvisor reviews. Kybernetes 2020, 50, 1689–1703. [Google Scholar] [CrossRef]
  48. Boo, S.; Busser, J.A. Tourists’ hotel event experience and satisfaction: An integrative approach. J. Travel Tour. Mark. 2018, 35, 895–908. [Google Scholar] [CrossRef]
  49. Büschken, J.; Allenby, G. Sentence-Based Text Analysis for Customer Reviews. Mark. Sci. 2016, 35, 953–975. [Google Scholar] [CrossRef] [Green Version]
  50. Mankad, S.; Han, H.; Goh, J.; Gavirneni, S. Understanding Online Hotel Reviews Through Automated Text Analysis. Serv. Sci. 2016, 8, 124–138. [Google Scholar] [CrossRef]
  51. Lucas, C.; Nielsen, R.A.; Roberts, M.E.; Stewart, B.M.; Storer, A.; Tingley, D. Computer-Assisted Text Analysis for Comparative Politics. Political Anal. 2015, 23, 254–277. [Google Scholar] [CrossRef] [Green Version]
  52. Blei, D.M. Probabilistic topic models. Commun. ACM 2012, 55, 77–84. [Google Scholar] [CrossRef] [Green Version]
  53. De Vries, E.; Schoonvelde, M.; Schumacher, G. No longer lost in translation: Evidence that Google Translate works for comparative bag-of-words text applications. Political Anal. 2018, 26, 417–430. [Google Scholar] [CrossRef] [Green Version]
  54. Roberts, M.E.; Stewart, B.M.; Tingley, D.; Lucas, C.; Leder-Luis, J.; Gadarian, S.K.; Albertson, B.; Rand, D.G. Structural Topic Models for Open-Ended Survey Responses. Am. J. Political Sci. 2014, 58, 1064–1082. [Google Scholar] [CrossRef] [Green Version]
  55. Wang, Y.; Li, X.; Lai, K. A Meeting of the Minds: Exploring the Core–Periphery Structure and Retrieval Paths of Destination Image Using Social Network Analysis. J. Travel Res. 2017, 57, 612–626. [Google Scholar] [CrossRef]
  56. Park, E.; Chae, B.; Kwon, J. Toward understanding the topical structure of hospitality literature. Int. J. Contemp. Hosp. Manag. 2018, 30, 3386–3411. [Google Scholar] [CrossRef]
  57. Kim, W.-H.; Cho, J.-L.; Kim, K.-S. The relationships of wine promotion, customer satisfaction, and behavioral intention: The moderating roles of customers’ gender and age. J. Hosp. Tour. Manag. 2019, 39, 212–218. [Google Scholar] [CrossRef]
  58. Ahani, A.; Nilashi, M.; Ibrahim, O.; Sanzogni, L.; Weaven, S. Market segmentation and travel choice prediction in Spa hotels through TripAdvisor’s online reviews. Int. J. Hosp. Manag. 2019, 80, 52–77. [Google Scholar] [CrossRef]
  59. Kim, W.; Malek, K. Effects of self-congruity and destination image on destination loyalty: The role of cultural differences. Anatolia 2016, 28, 1–13. [Google Scholar] [CrossRef]
  60. Kim, W.-H.; Malek, K.; Roberts, K.R. The effectiveness of green advertising in the convention industry: An application of a dual coding approach and the norm activation model. J. Hosp. Tour. Manag. 2019, 39, 185–192. [Google Scholar] [CrossRef]
  61. Kim, W.; Malek, K.; Kim, N.; Kim, S. Destination Personality, Destination Image, and Intent to Recommend: The Role of Gender, Age, Cultural Background, and Prior Experiences. Sustainability 2017, 10, 87. [Google Scholar] [CrossRef] [Green Version]
  62. Zhong, N.; Schweidel, D.A. Capturing Changes in Social Media Content: A Multiple Latent Changepoint Topic Model. Mark. Sci. 2020, 39, 827–846. [Google Scholar] [CrossRef]
  63. Moro, S.; Esmerado, J.; Ramos, P.; Alturas, B. Evaluating a guest satisfaction model through data mining. Int. J. Contemp. Hosp. Manag. 2019, 32, 1523–1538. [Google Scholar] [CrossRef]
  64. Siroosi, H.; Heshmati, G.; Salmanmahiny, A. Can empirically based model results be fed into mathematical models? MICE for neural network and logistic regression in tourism landscape planning. Environ. Dev. Sustain. 2020, 4, 3701–3722. [Google Scholar] [CrossRef]
  65. Chapman, C. Commentary: Mind Your Text in Marketing Practice. J. Mark. 2019, 84, 26–31. [Google Scholar] [CrossRef]
Figure 1. Summary of data analysis.
Sustainability 13 12650 g001
Figure 2. Topic network (Node size represents topic weight and edge thickness represents topic correlation degree).
Sustainability 13 12650 g002
Figure 3. Classifications of topics by satisfaction and tourist type (green dots: cluster 1 (holiday experience), light red dots: cluster 2 (attractions and facilities), yellow dots: cluster 3 (food experience)).
Sustainability 13 12650 g003
Table 1. Summary of recent studies of topic modeling in the hospitality and tourism industry.
Author(s), Publication YearDescriptionData SourceMethods UsedContext
Kirilenko et al. [43] (in press)Traveler satisfactionTripAdvisorTopic modelingTourism
Wen et al. [44]User-generated reviews and consumer perceptionsTripAdvisorTopic modeling and content analysisRestaurant
Chatterjee [45] Helpfulness of online hotel reviews (i.e., TripAdvisor)TripAdvisorSentiment and emotion mining approachHotel
Luo et al. [35]Theme park and online reviewTripAdvisorTopic modelingTourism
Vu et al. [21]Data mining, travel itineraryTwitterTopic modelingTourism
Li et al. [29]Impacts of temporal, explanatory, and sensory cues on customers’ perceived usefulness and enjoyment toward restaurant online reviewsYelp.comText mining approach and econometric analysisRestaurant
Table 2. Consumer (dis)satisfaction-related research using text-analysis methods.
Related StudyData SourceMethods Setting
Hu et al. [43]TripAdvisorTopic modeling (Structural Topic Model)Hotel
Park et al. [47]Yelp.comTopic modeling (Structural Topic Model)Restaurant
Boo and Busser [48]Online reviews of hotelsLeximancer tool with manual workHotel
Guo et al. [3]Online reviews of hotelsLDAHotel
Xu and Li [18]Customer reviewLSA topic model, dissatisfaction with airline serviceAirline
Büschken and Allenby [49]Hotel reviewLDAHotel
Mankad et al. [50]Hotel reviewLDAHotel
Table 3. Descriptive statistics of samples.
VariableFrequency%
Year
2019 (As of July)223235.83
2018269643.28
20175879.42
20163305.3
Prior to 20153846.16
Rating
1-star1752.81
2-star2964.75
3-star146323.49
4-star226536.36
5-star203032.59
Language
Korean483977.69
English66710.71
Chinese3515.63
Japanese1792.87
Russian641.03
Thai460.74
German210.34
Spanish190.31
Indonesian150.24
French130.21
Vietnamese80.13
Portuguese70.11
Table 4. Overview of 30 topics.
ClusterTopic Number & LabelEigenvector CentralityAverage WeightTop Five Words
1: Holiday experienceT13 Positive experience0.1920.046good, time, day, quiet, spend
T4 China town0.1510.044china_town, china, great, love, first
T8 Picture0.1950.043nice, its_good, take_picture, picture, pretty
T1 Fairytale village0.0840.041fairytale, village, beautiful, wall, character
T9 Weekend experience0.0440.039weekend, many_people, parking, car, enough
T16 Child0.1830.038child, photo, walk, great place, it’s great
T22 Diverse experience0.3410.035see, close, dont, many_thing, many_place
T24 Recommendation0.0710.033visit, recommend, want, good_place, weekday
T10 Mural0.0650.032street, mural, well, dong, way
T30 Place0.3550.030place, come, little, normal, develop
T21 Neighborhood0.5610.020the neighborhood, expect, next, shopping, something
2: Attractions and facilitiesT29 Park0.1050.035park, view, course, macarthur, tour
T25 Restaurants in China town0.5470.032restaurant, town, chinese_restaurant, jajangmyeon, incheon_china
T27 Chinese building0.1340.032Chinese, people, building, style, change
T2 Museum0.0010.030museum, history, memorial, Incheon_lande, operation
T12 Local shops0.0370.030shop, area, local, try, store
T18 Public transportation0.0010.029walk, station, interesting, Seoul, hour
T7 Freedom park0.1730.025freedom_park, cherry_blossom, cheap, watch, high
T15 Nearby facility 0.0530.024look, nearby, worth, bad, hill
T5 Tourist attraction0.0070.024tourist, make, noodle, attraction, spot
T23 Trivia0.0120.024small, price, japanese, easy, compare
T19 Mediocre experience0.0140.024feel, atmosphere, nothing, exotic, special
T20 Restaurant facilities0.2240.019sell, big, lunch, meal, business
3: Food experienceT14 Chicken dish0.7740.063eat, chicken_gangjeong, famous, gangjeong, line
T17 Restaurant variety1.0000.047food, lot, snack, crowd, many_restaurant
T28 Food experience0.8340.041taste, fun, chinese_food, enjoy, expensive
T26 Traditional market0.4030.037old, house, alley, bread, traditional_market
T6 Market0.2250.031market, family, memory, play, taking_picture
T3 Gourmet0.6810.027delicious, thing, clean, around, gourmet
T11 Chinese foods0.7140.027jjajangmyeon, dumpling, sinpo_market, jjajang, cake
Table 5. Effects of metadata on topic proportions.
ClustersTopicsRating (Low vs. High)Tourist Type (Domestic vs. International)
EstimateStd.ErrorCi.LowerCi.UpperEstimateStd.ErrorCi.LowerCi.Upper
1: Holiday experienceT1 Fairytale village0.004−0.0010.0060.002−0.019−0.003−0.013−0.025
T4 Chinatown0.001−0.0010.0020.0000.000−0.0010.003−0.003
T8 Picture0.003−0.0010.0050.0020.008−0.0020.0120.004
T9 Weekend experience−0.010−0.001−0.008−0.0130.036−0.0020.0400.032
T10 Mural0.001−0.0010.002−0.001−0.011−0.002−0.007−0.015
T13 Positive experience0.004−0.0010.0050.0020.005−0.0020.0080.002
T16 Child0.003−0.0010.0050.0010.001−0.0020.005−0.004
T21 Neighborhood−0.002−0.001−0.001−0.003−0.007−0.002−0.004−0.011
T22 Diverse experience−0.003−0.001−0.002−0.0040.021−0.0020.0250.018
T24 Recommendation0.000−0.0010.001−0.0010.000−0.0020.003−0.003
T30 Place0.0010.0000.0020.000−0.001−0.0010.001−0.003
2: Attractions and facilitiesT2 Museum0.005−0.0010.0080.002−0.043−0.005−0.034−0.052
T5 Tourist attraction−0.001−0.0010.000−0.003−0.013−0.001−0.011−0.016
T7 Park0.003−0.0010.0050.0020.006−0.0020.0100.001
T12 Local shops−0.001−0.0010.001−0.002−0.049−0.002−0.045−0.053
T15 Nearby facility−0.002−0.001−0.001−0.003−0.012−0.001−0.009−0.014
T18 Public transportation0.001−0.0010.003−0.001−0.069−0.003−0.063−0.075
T19 Mediocre experience−0.005−0.001−0.004−0.0070.002−0.0020.005−0.001
T20 Restaurant−0.005−0.001−0.003−0.0060.004−0.0020.0080.001
T23 Trivia−0.006−0.001−0.004−0.007−0.012−0.002−0.008−0.015
T25 Restaurant−0.004−0.001−0.003−0.0050.007−0.0010.0100.004
T27 Chinese building−0.005−0.001−0.003−0.007−0.003−0.0020.000−0.007
T29 Park0.004−0.0010.0060.002−0.029−0.003−0.023−0.035
3: Food experienceT3 Gourmet0.0030.0000.0040.0020.015−0.0010.0170.013
T6 Market0.004−0.0010.0050.0030.012−0.0010.0150.010
T11 Chinese foods0.000−0.0010.002−0.0020.033−0.0020.0380.029
T14 Chicken dish0.004−0.0020.0070.0010.055−0.0030.0600.049
T17 Restaurant0.002−0.0010.0040.0010.016−0.0010.0190.013
T26 Traditional market0.001−0.0010.003−0.0010.027−0.0020.0310.024
T28 Food experience0.000−0.0010.001−0.0010.020−0.0020.0240.017
Publisher’s Note: MDPI stays neutral with regard to jurisdictional claims in published maps and institutional affiliations.

