Abstract
Poverty is a chronic problem all over the world. Since the 18th National Congress of the Communist Party of China was held in 2012, the Chinese government has continuously increased its poverty alleviation efforts. In addition, absolute poverty in China was eliminated by the end of 2020. Tourism has played an important role in poverty alleviation. To explore the role of the tourism industry in reducing poverty, this paper takes the Liupan Mountain area of Gansu Province in western China, as a case site. An input–output evaluation index system was constructed, and a Super-SBM model was used to evaluate the tourism poverty alleviation efficiency in 40 districts and counties in the Liupan Mountain area from 2009 to 2018. The results show that the overall starting point of tourism poverty alleviation efficiency in the study area was high, which needed to be further optimized. The difference in tourism poverty alleviation efficiency among districts and counties tended to decrease in the time series. The restrictive factors were the lack of technological progress and lack of innovation. The spatial distribution of tourism poverty alleviation efficiency in the study area presented a pattern of high in the east and low in the west, high in the north and low in the south. In the future, the tourism poverty alleviation efficiency in the concentrated and contiguous destitute areas of the Liupan Mountain area in Gansu Province could be improved by cultivating the tourism industry, strengthening technological innovation, cultivating core growth poles, and exerting radiation effects.
1. Introduction
The problem of poverty affects the survival and development of humanity. At the end of the 20th century, as the tourism industry has shown a good social development driving effect [1,2,3], more and more countries have adopted a combination of tourism and poverty alleviation to promote poverty-stricken areas out of poverty. Pro-poor tourism (PPT) and sustainable tourism for eliminating poverty (ST-EP) are two models that have been proposed. In the process of tourism poverty alleviation, despite the rich resources in poverty-stricken areas, there is often a misalignment of tourism resources and tourism economic space [4,5]. “Tourism poverty alleviation” is a new term and new field that China has produced in the context of the combination of tourism industry and poverty alleviation strategy [6]. In countries such as China [6], Tanzania [7], Bangladesh [8], and Vietnam [9], tourism development can provide poor households with more jobs, improve the living conditions of residents, and revitalize idle resources. The tourism industry has the advantage of one industry to promote the development of all industries, and the effect of poverty alleviation is remarkable. It has the characteristics of “blood-making” poverty alleviation, “intellectual” poverty alleviation, and “popular” poverty alleviation. It is considered to be the main engine of economic growth and a catalyst for poverty eradication. Tourism poverty alleviation not only plays an important role in poverty alleviation but also has important potential value in consolidating poverty alleviation achievements and curbing poverty return. It will play an important role in promoting the endogenous development of poverty alleviation areas and is a strong guarantee for realizing regional sustainable development. However, the practice of poverty alleviation by tourism also faces many problems and challenges. On the one hand, there are problems of uneven and inadequate development in the process of tourism poverty alleviation. Due to the impact of time series and regional differences, relative poverty still exists, and there is a risk of returning to poverty in some areas. On the other hand, how tourism development can promote the effective connection of poverty alleviation to rural revitalization in underdeveloped areas is also worthy of further reflection.
Most of the research on tourism poverty alleviation focuses on the mode [10,11,12,13], effect [14,15,16,17,18], countermeasures [19,20,21], and other thematic studies [22]. Researchers from outside of China tend to begin with the micro perspective of residents’ perceptions and community participation and to discuss the effectiveness of tourism in poverty alleviation in different regions [23,24,25], and most of the research methods are statistical methods [26,27]. Chinese scholars have carried out a great deal of macro-level and micro-level research. Some scholars discussed the relationship between residents’ social responsibility and the economic performance of local tourism development [28] from the perspective of destination social responsibility [29,30,31]. In 2014, the Chinese government first proposed “tourism targeted poverty alleviation”, which set a stricter requirement for the allocation efficiency of tourism in the process of reducing poverty. The use of tourism to eradicate poverty has also become a priority of the Chinese government and academia. In order to achieve the general requirements of China’s rural revitalization strategy and reduce the risk of residents returning to poverty, the sustainability of tourism poverty alleviation has become an important aspect of academic research. It is necessary to study and evaluate the performance of tourism poverty alleviation in the previous stage.
Tourism poverty alleviation efficiency refers to the maximum possible output that can be achieved by the invested tourism resources under the established technical conditions—that is, the allocation efficiency of tourism resources in the reduction of poverty [32,33]. The research on tourism poverty alleviation efficiency in China mostly focuses on the efficiency measurement of different objects, temporal and spatial differentiation, and influencing factors. Data envelopment analysis (DEA) is the most common measurement method, and further research has been conducted in combination with the Malmuquist index [34,35]. As research continues, scholars have commented on some drawbacks of traditional DEA models and gradually innovated and modified their research methods. Bootstrap DEA [36], the three-stage DEA model [37], DEA window analysis [38], and the super-SBM model [39] were some responses to researchers’ needs. Regarding the establishment of the indicator system, most scholars focus on the economic benefits of tourism poverty alleviation. The multidimensional poverty ideological system has not yet been established, and the analysis framework and method application have not been standardized in research. Scholars lack a certain degree of in-depth research on the comprehensive effects of tourism in society, education, and medical treatment. In terms of temporal and spatial differentiation, the relevant literature shows that effective and ineffective attempts at tourism poverty alleviation are spatially related and the poverty reduction effect has a spatial diffusion trend. Therefore, the establishment of concentrated and contiguous poverty alleviation areas is in line with the actual situation [40].
The Liupan Mountain area is one of the main battlefields in China’s poverty alleviation and development, with a dense distribution of villages targeted for poverty alleviation through tourism [41]. There are 40 counties (cities and districts) in the Liupan Mountain area of Gansu Province. They have chronic poverty, but they have excellent tourism resources and strong momentum for tourism development. Gansu’s provincial government has prioritized the eradication of poverty in the area [42] and has adopted special plans that have shown good results. By 2020, there was no poverty in the area’s districts and counties. Therefore, the text adopts the Liupan Mountain area as a case site, measuring tourism poverty alleviation efficiency from the perspective of multi-dimensional poverty and conducting temporal and spatial differentiation research, which has certain theoretical and practical significance for the positioning of tourism poverty alleviation in the area and the optimization of the spatial pattern of tourism poverty alleviation. At the same time, by clarifying the development characteristics and problems of tourism poverty alleviation efficiency in the area, this study can also provide reference for further consolidation of the achievement of poverty alleviation and promotion of regional development.
2. Research Area and Research Methods
2.1. Overview of the Study Area
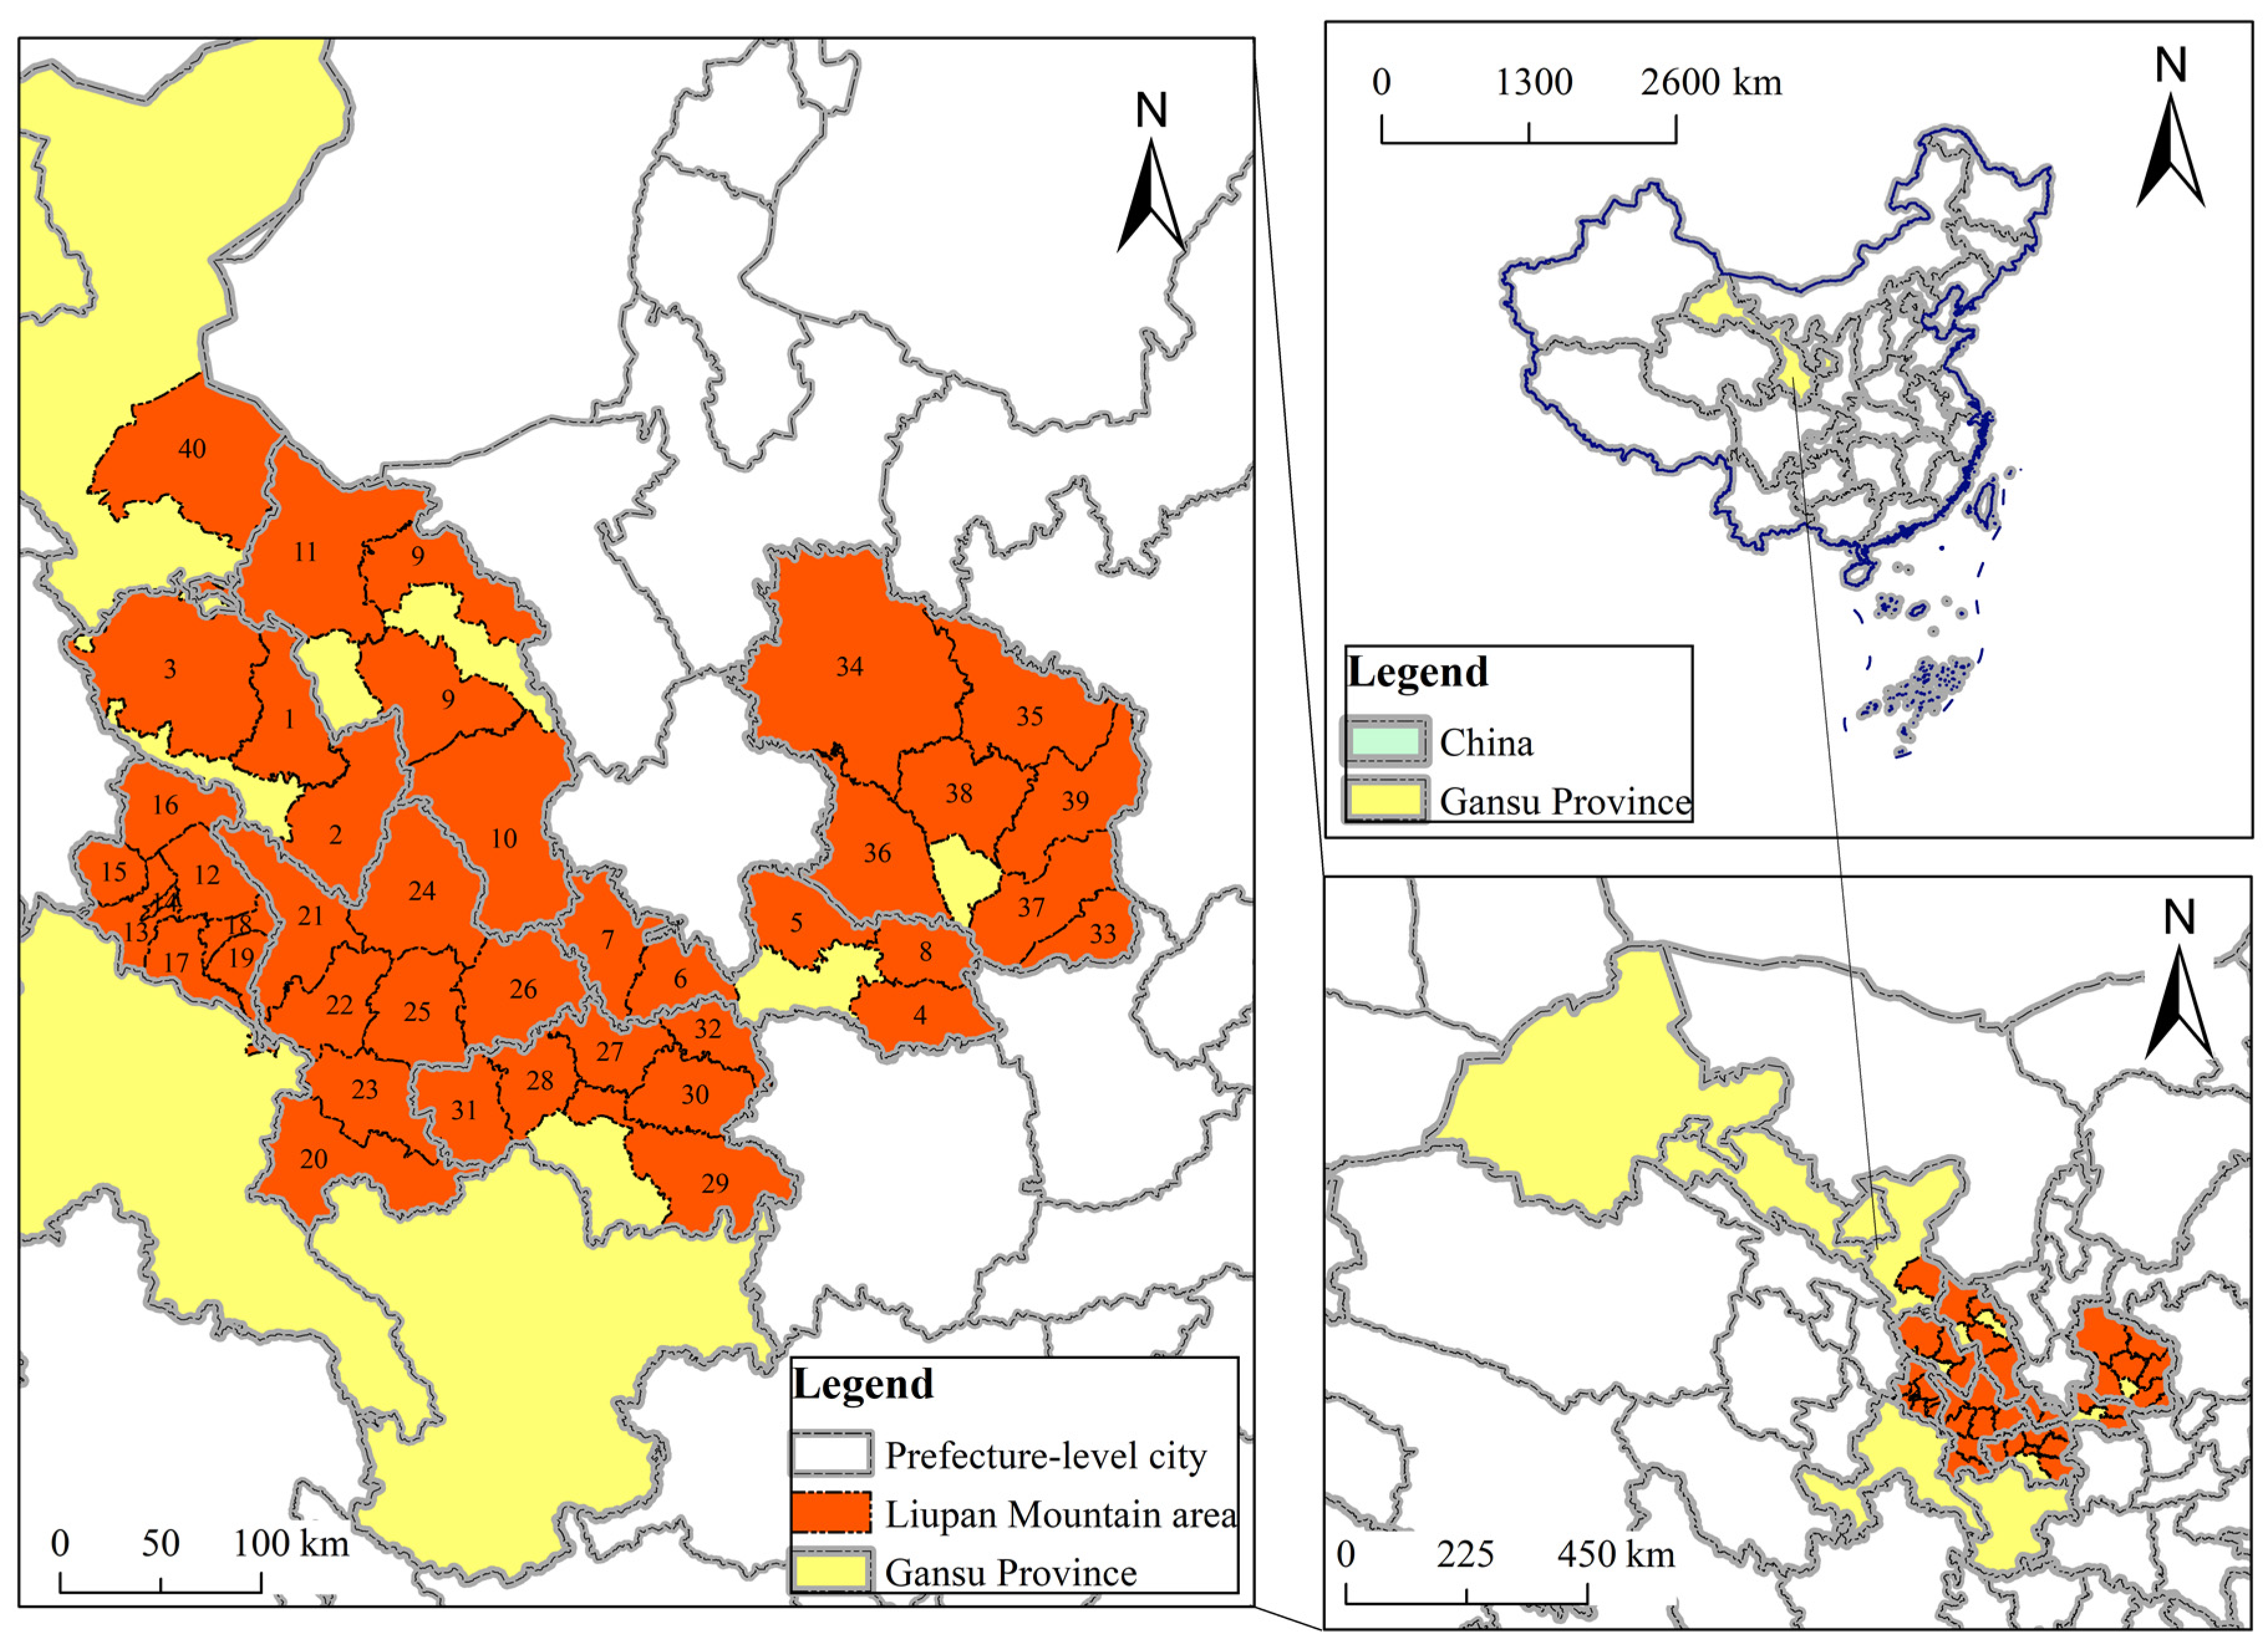
The Liupan Mountain area is one of 14 contiguous areas with special poverty mentioned in the “China Rural Poverty Alleviation and Development Program (2011–2020)”. The 14 contiguous areas consist of Shaanxi, Gansu, Qinghai, and Ningxia provinces and their 61 counties and districts. The Liupan Mountain area in Gansu Province consists of eight cities and prefectures, with 40 districts and counties (Table 1), mainly distributed in the southeastern part of the province (Figure 1). The Liupan Mountain area is the main battlefield for poverty alleviation in Gansu Province, including 30 national counties targeted for poverty alleviation and five provincial key counties for poverty alleviation and economic development. In 2011, there were nearly 6 million poor people in 40 districts and counties in the Liupan Mountain area, and nearly half of the population lived below or well below the poverty line.

Table 1.
Impoverished Counties of the Liupan Mountain area in Gansu Province.
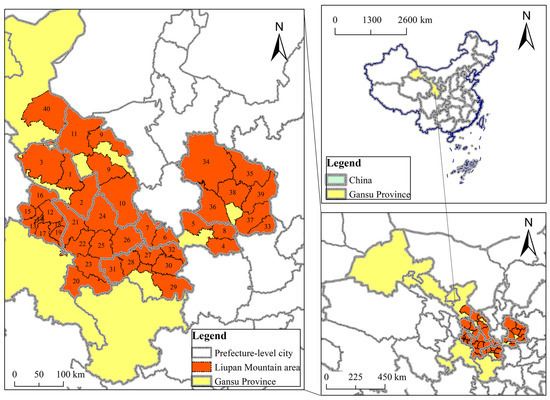
Figure 1.
Administrative zoning map of the Liupan Mountain area in Gansu Province. Remarks: 1. Gaolan County; 2. Yuzhong County; 3. Yongdeng County; 4. Lingtai County; 5. Kongtong District; 6. Zhuanglang County; 7. Jingning County; 8. Jingchuan County; 9. Jingyuan County; 10. Huining County; 11. Jingtai County; 12. Dongxiang Autonomous County; 13. Linxia County; 14. Linxia City; 15. Jishishan Bao’an Dongxiang Sala Autonomy County; 16. Yongjing County; 17. Hezheng County; 18. Guanghe County; 19. Kangle County; 20. Min County; 21. Lintao County; 22. Weiyuan County; 23. Zhang County; 24. Anding Distrct; 25. Longxi County; 26. Tongwei County; 27. Qinan County; 28. Gangu County; 29. Maiji Distrct; 30. Qingshui County; 31. Wushan County; 32. Zhangjiachuan Hui Autonomy County; 33. Zhengning County; 34. Huan County; 35. Huachi County; 36. Zhenyuan County; 37. Ning County; 38. Qingcheng County; 39. Heshui County; 40. Gulang County.
Gansu Province is a major cultural and tourism province, with abundant resources. The topography and terrain of the Liupan Mountain area are complex and diverse. Liupan Mountain Nature Reserve has extensive vegetation, biological species, a superior ecological environment, and four seasons, all of which are notable advantages for tourism. The Hui and Han people with their distinctive local cultures share the area. The area is home to terrace culture, red revolution culture, Loess Plateau culture, and Silk Road culture, creating an inclusive and open cultural atmosphere that is conducive to tourism. At the same time, the Liupan Mountain area is located at the intersection of three major tourist areas: the Loess Plateau tourist area in eastern Gansu, the cultural tourist area on the western line of Shaanxi, and the Yellow River desert tourist area in southern Ningxia. Through years of development, the surrounding areas of the three major tourist areas have also accumulated a certain amount of passenger flow, which is conducive to the Liupan Mountain area, allowing it to derive advantages, share the market, and obtain long-term development. The spatial distribution of tourism resources and poverty-stricken areas is consistent, and many high-quality tourist attractions have been built in the area. The Liupanshan area has also achieved great results since tourism poverty alleviation. For example, the Kongtong District of Pingliang City has carried out the “rural tourism +” model, absorbing more than 300 poor laborers through various scenic spots, and the average monthly income of residents is more than CNY 2000. The total number of poor people in the region who have extricated themselves from poverty by relying on the tourism industry has reached 6788. With the Liupan Mountain area as a case, this paper explores the problems in poverty alleviation, in the hope that tourism development can assist in consolidating the results of poverty alleviation.
2.2. Research Methods
2.2.1. Super-SBM Model
Compared with the traditional DEA model, the super efficiency model has advantages in the number of effective units and efficiency differentiation. It not only can peel off the impact of environmental relaxation and make the measurement value more accurate and reliable but also can solve the problem of comparison and ranking of effective DMU and can analyze the efficiency of tourism poverty alleviation. Since the efficiency of poverty alleviation is based on both input and output, this paper adopts the non-oriented super-SBM model and used DEA-SOLVER Pro5.0 software (SaiTech, Inc. Bethesda, Fremont, MD, USA).
The model equation is as follows:
In the equation, xmk represents the m-th input of the k-th poor district and county; ymk represents the n-th output of the k-th poor county; λj represents the weight of each element in the reference set.
2.2.2. Coefficient of Variation
The coefficient of variation is used to evaluate changes in the attribute value of the research object. This paper uses the coefficient of variation to reveal the fluctuation degree of tourism poverty alleviation efficiency in 40 districts and counties in the Liupan Mountain area of Gansu Province from 2009 to 2018.
The equation is as follows:
In the equation, CV is the coefficient of variation, indicating the degree of difference; S is the standard deviation of each indicator in each district and county; is the average value. When CV ≥ 100%, it is a strong variation; when 10% < CV < 100%, it is a medium variation; when CV ≤ 10%, it is a weak variation.
2.2.3. Malmquist Index
The Malmquist index (MI) is a method of studying dynamic changes in efficiency, and it reflects the growth rate of total factor productivity. It can be decomposed to discuss the effect of technical efficiency and technological progress on changes in productivity. The MI expression is as follows:
In Equation (3), if M > 1, the total factor productivity of period t + 1 has increased relative to period t; if M < 1, the total factor productivity of period t + 1 has been reduced relative to period t; if M = 1, the total factor productivity of the two periods is unchanged.
In the case of constant returns to scale, the MI can be decomposed into an index of technological change (effch) and an index of technological progress (techch). The technological change index (effch) can be decomposed into the product of the pure technological efficiency change index (pech) and the scale efficiency change index (sech). Therefore, the Malmquist index, the total factor productivity change index, can be expressed as:
In Equation (4), tfpch reflects the utilization of input elements in the process of tourism poverty alleviation; effch reflects the impact of policy and institutional factors on the improvement of total factor productivity, such as the degree of marketization and government participation; techch is the degree of change in the total factor productivity of tourism poverty alleviation caused by technological progress and innovation; pech is the impact of pure technical efficiency, such as management and technology on the total factor productivity of poverty alleviation; sech is the change in total factor productivity caused by industrial development. If pech > 1, the improvement in DMU management level will increase the total factor productivity of poverty alleviation; otherwise, it will reduce it. If sech > 1, increasing the scale input of the decision-making unit can improve total factor productivity; otherwise, the scale input is excessive, and the scale should be reduced. If techch > 1, technological progress has increased the total factor productivity of poverty alleviation, otherwise technology has regressed.
2.2.4. Spatial Trend Surface Analysis
Trend surface is the approximate value of the actual surface, which can semi-quantitatively analyze the geospatial attribute data and simulate the spatial distribution law of geographical elements. This paper uses the trend surface to explore the overall spatial differentiation trend pattern of tourism poverty alleviation efficiency. It is assumed that is the tourism poverty alleviation efficiency of the i-th poor district and county, and is the spatial plane coordinate.
According to the definition of trend surface:
In Equation (5), is the fitted value of the trend surface in a large range; is the autocorrelation random disturbance term, which is the error between the real value and trend value of tourism poverty alleviation efficiency in the i-th poor district and county. This paper uses a second-order polynomial to calculate the trend value of tourism poverty alleviation efficiency in poverty-stricken areas and counties in the Liupan Mountain area in Gansu Province. The trend function can be expressed as:
In the equation, x and y are the geographical coordinates of observation points; x2 and y2 indicate that the geographic coordinates are quadratic polynomials with the highest degree of 2; is the coefficient of the polynomial.
2.2.5. Spatial Autocorrelation Analysis
- (1)
- Global spatial autocorrelation analysis
Global spatial autocorrelation is used to describe whether some characteristics of regional units are spatially related to other units. The paper uses Moran’s I index to determine whether or not there is spatial distribution and mutual dependence of tourism poverty alleviation efficiency among districts and counties in the Liupan Mountain area in Gansu Province. The calculation equation is:
Wij is an element in the i-th row and j-th column of the spatial weight matrix, which is used to measure the distance between region i and region j; xi and xj are the efficiency values on the space unit; and i ≠ j. n represents the total number of counties in the region. The I value represents the degree of agglomeration of the poverty alleviation efficiency values of tourism in each district and county, and the I value is between −1 and 1. If I < 0, the efficiency values of the districts and counties are negatively correlated, showing a discrete distribution in space. The absolute value of I is close to 1, indicating the greater the degree of dispersion. Conversely, when I > 0, the more I value tends to 1, the more concentrated the distribution. When I value is close to 0, the distribution characteristics are not significant and tend to be a random distribution.
- (2)
- Local spatial autocorrelation analysis
The global spatial autocorrelation assumes spatial stationarity, and there is presumably only one tendency among agglomeration, dispersion, or random distribution in the region. This method may conceal the local spatial agglomeration and local instability of the observations. Therefore, local spatial agglomeration analysis must be used to calculate the degree of spatial correlation between each spatial object in the analysis area and its neighbors, calculate and analyze the local feature differences in the distribution of spatial objects, and explore the relationship between efficiency values in local areas. The local Moran’s I index can be calculated as follows:
In the equation, ; ; i and j respectively represent the geographically adjacent districts and counties, and n is the total number of districts and counties in the area. If I > 0, there is a positive correlation between the efficiency values of a certain district and neighboring districts and counties (high–high value agglomeration or low–low value agglomeration). Among them, H–H agglomeration indicates a high–high aggregation, and L–L agglomeration indicates a low–low aggregation. If I < 0, there is a negative correlation between the efficiency of a certain district and the surrounding districts and counties. Among them, H–L aggregation means that high efficiency values are surrounded by low efficiency values, and L–H aggregation means that low values are surrounded by high values.
2.3. Construction of Indicators System
Scientific selection of input and output indicators is a prerequisite for accurate evaluation results. Considering the availability of indicator data, scholars often use alternative indicators. In terms of input indicators, the article selected per capita tourism income and per capita number of tourists to reflect the effectiveness of tourism development and the radiation effect of tourism. In terms of output indicators, according to the Global Multidimensional Poverty Index (MPI) published by the United Nations Development Program in 2019, the Multidimensional Poverty Index not only considers economic income but also considers health, education, and living standards. It can be used to ascertain whether or not individuals and families are in poverty. Based on this, the paper selected four indicators (economy, education, health, and life) to measure personal behavioral and regional sustainable development capabilities. The economic dimension is represented by GDP per capita, net income per capita of rural residents, and disposable income of urban residents. Education is represented by the number of middle school students. Health is represented by the number of beds in hospitals and health centers. Living is measured by the number of internet users (Table 2).
Table 2.
Evaluation indicators system of tourism poverty alleviation efficiency in the Liupan Mountain area in Gansu Province.
2.4. Data Sources
The research data in this article are derived from the 2010–2019 Gansu Provincial Statistical Yearbook, Gansu Development Yearbook, Gansu Rural Yearbook, and the statistical bulletin on the Liupan Mountain area in Gansu Province from 2010 to 2019. Since the yearbooks and bulletins were not available for all years, there was a small amount of missing data. Therefore, the paper referred to the values of the years before and after, and supplemented by a trend function. Due to missing data in the yearbook, the actual data for 2009–2018 was obtained.
3. Results and Analysis
3.1. Measurement of the Tourism Poverty Alleviation Efficiency
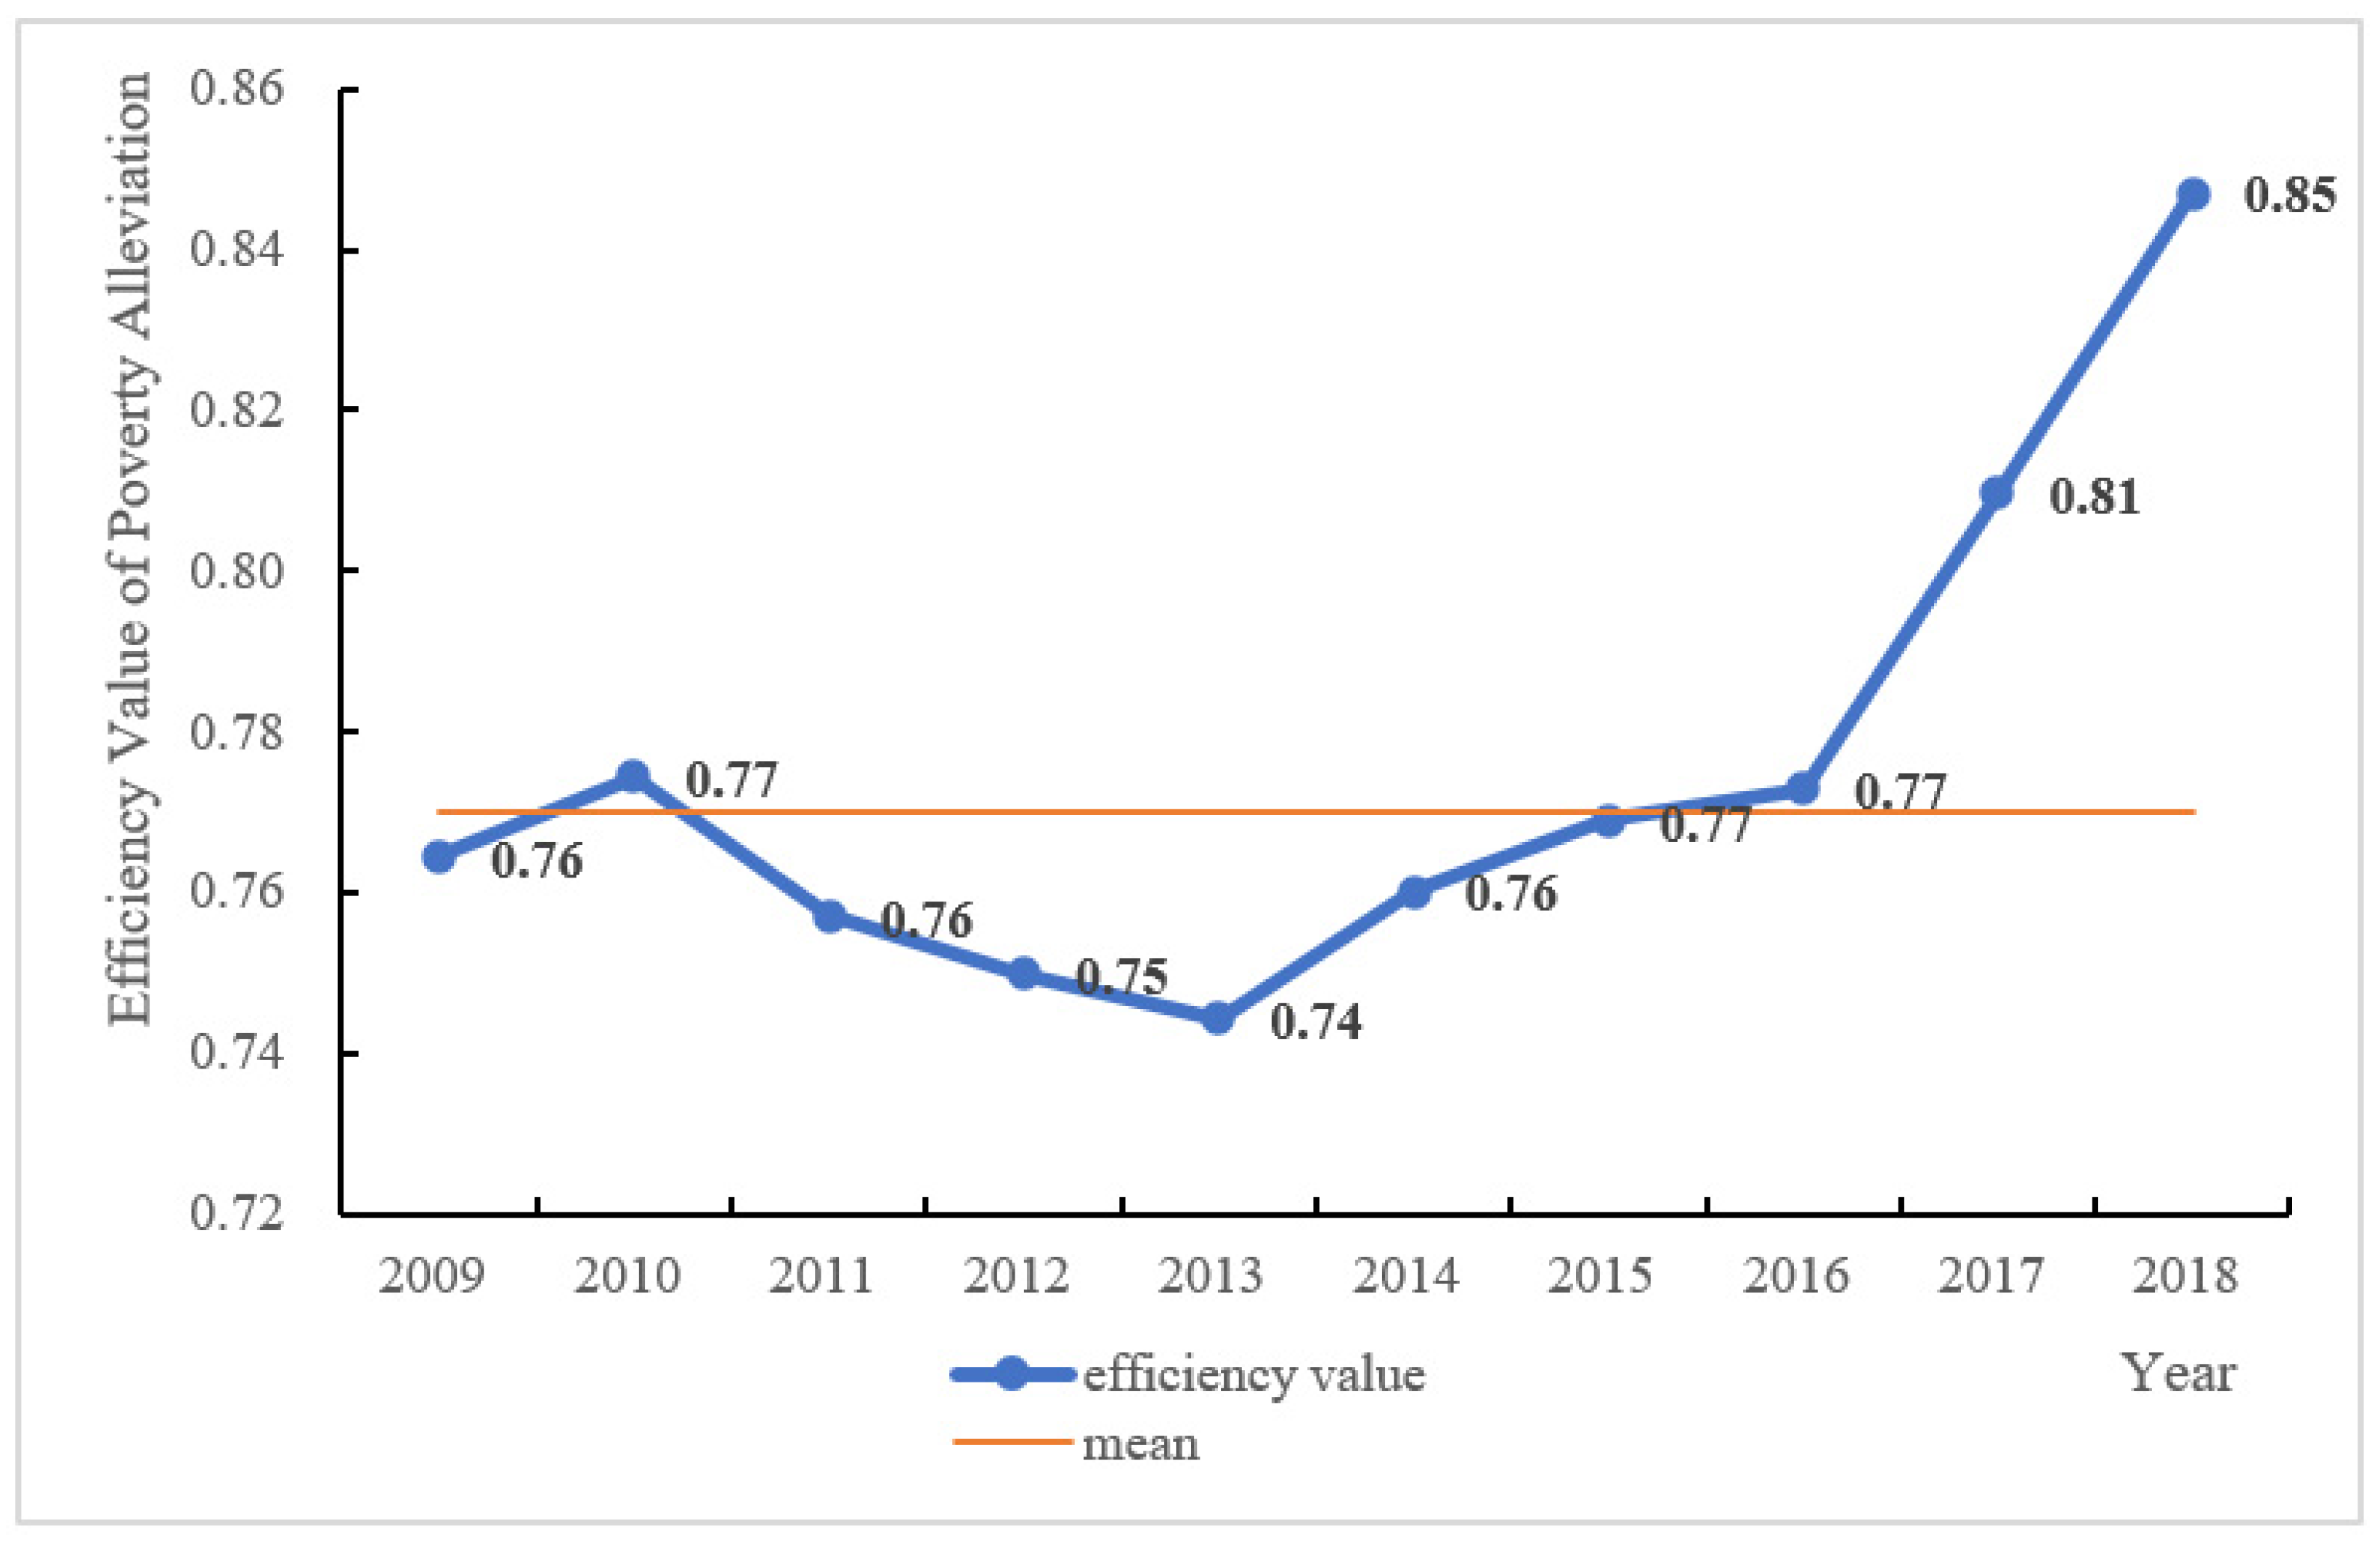
DEA-SOLVER Pro5.0 software was used to calculate the tourism poverty alleviation efficiency in the Liupan Mountain area in Gansu Province from 2009 to 2018. Figure 2 shows the average value of each year.

Figure 2.
Average value of tourism poverty alleviation efficiency in the Liupan Mountain area, Gansu Province from 2009 to 2018.
According to Figure 2, the effect of tourism on local development in the Liupan Mountain area from 2009 to 2018 had a high starting point. The lowest value of tourism poverty alleviation efficiency was 0.74, and it was maintained at the upper-middle level and rose steadily, with an average value of 0.77. From 2009 to 2013, the value of tourism poverty alleviation efficiency decreased from 0.76 to 0.74, showing a downward trend. It indicates that the utilization rate of production factors of tourism poverty alleviation inputs in the 40 districts and counties at this stage had declined. It may be related to the implementation of the China Rural Poverty Alleviation and Development Outline (2011–2020) and the Liupan Mountain Area Regional Development and Poverty Alleviation Plan (2011–2020). Despite the support of favorable policies, elements, resources, and market players in the region, competition among districts and counties led to inefficient resource allocation. Since 2013, the tourism poverty alleviation efficiency has been gradually improving. On the one hand, some timely policies have proven effective. On the other hand, local and national governments have compensated for the weaknesses of the infrastructure, and skills training has improved the participation of low-income residents so that poverty has been somewhat ameliorated. In 2016, the value of the tourism poverty alleviation efficiency exceeded the average value and continued to improve year by year, with a faster growth rate. The improvement was related to the 13th Five-Year Plan of Gansu Province. At the same time, the standard deviation of tourism poverty alleviation efficiency dropped from 0.65 in 2009 to 0.41 in 2018, indicating that the difference in tourism poverty alleviation efficiency among districts and counties was shrinking.
3.2. Time Series Evolution
3.2.1. The Difference in the Efficiency of Tourism Poverty Alleviation
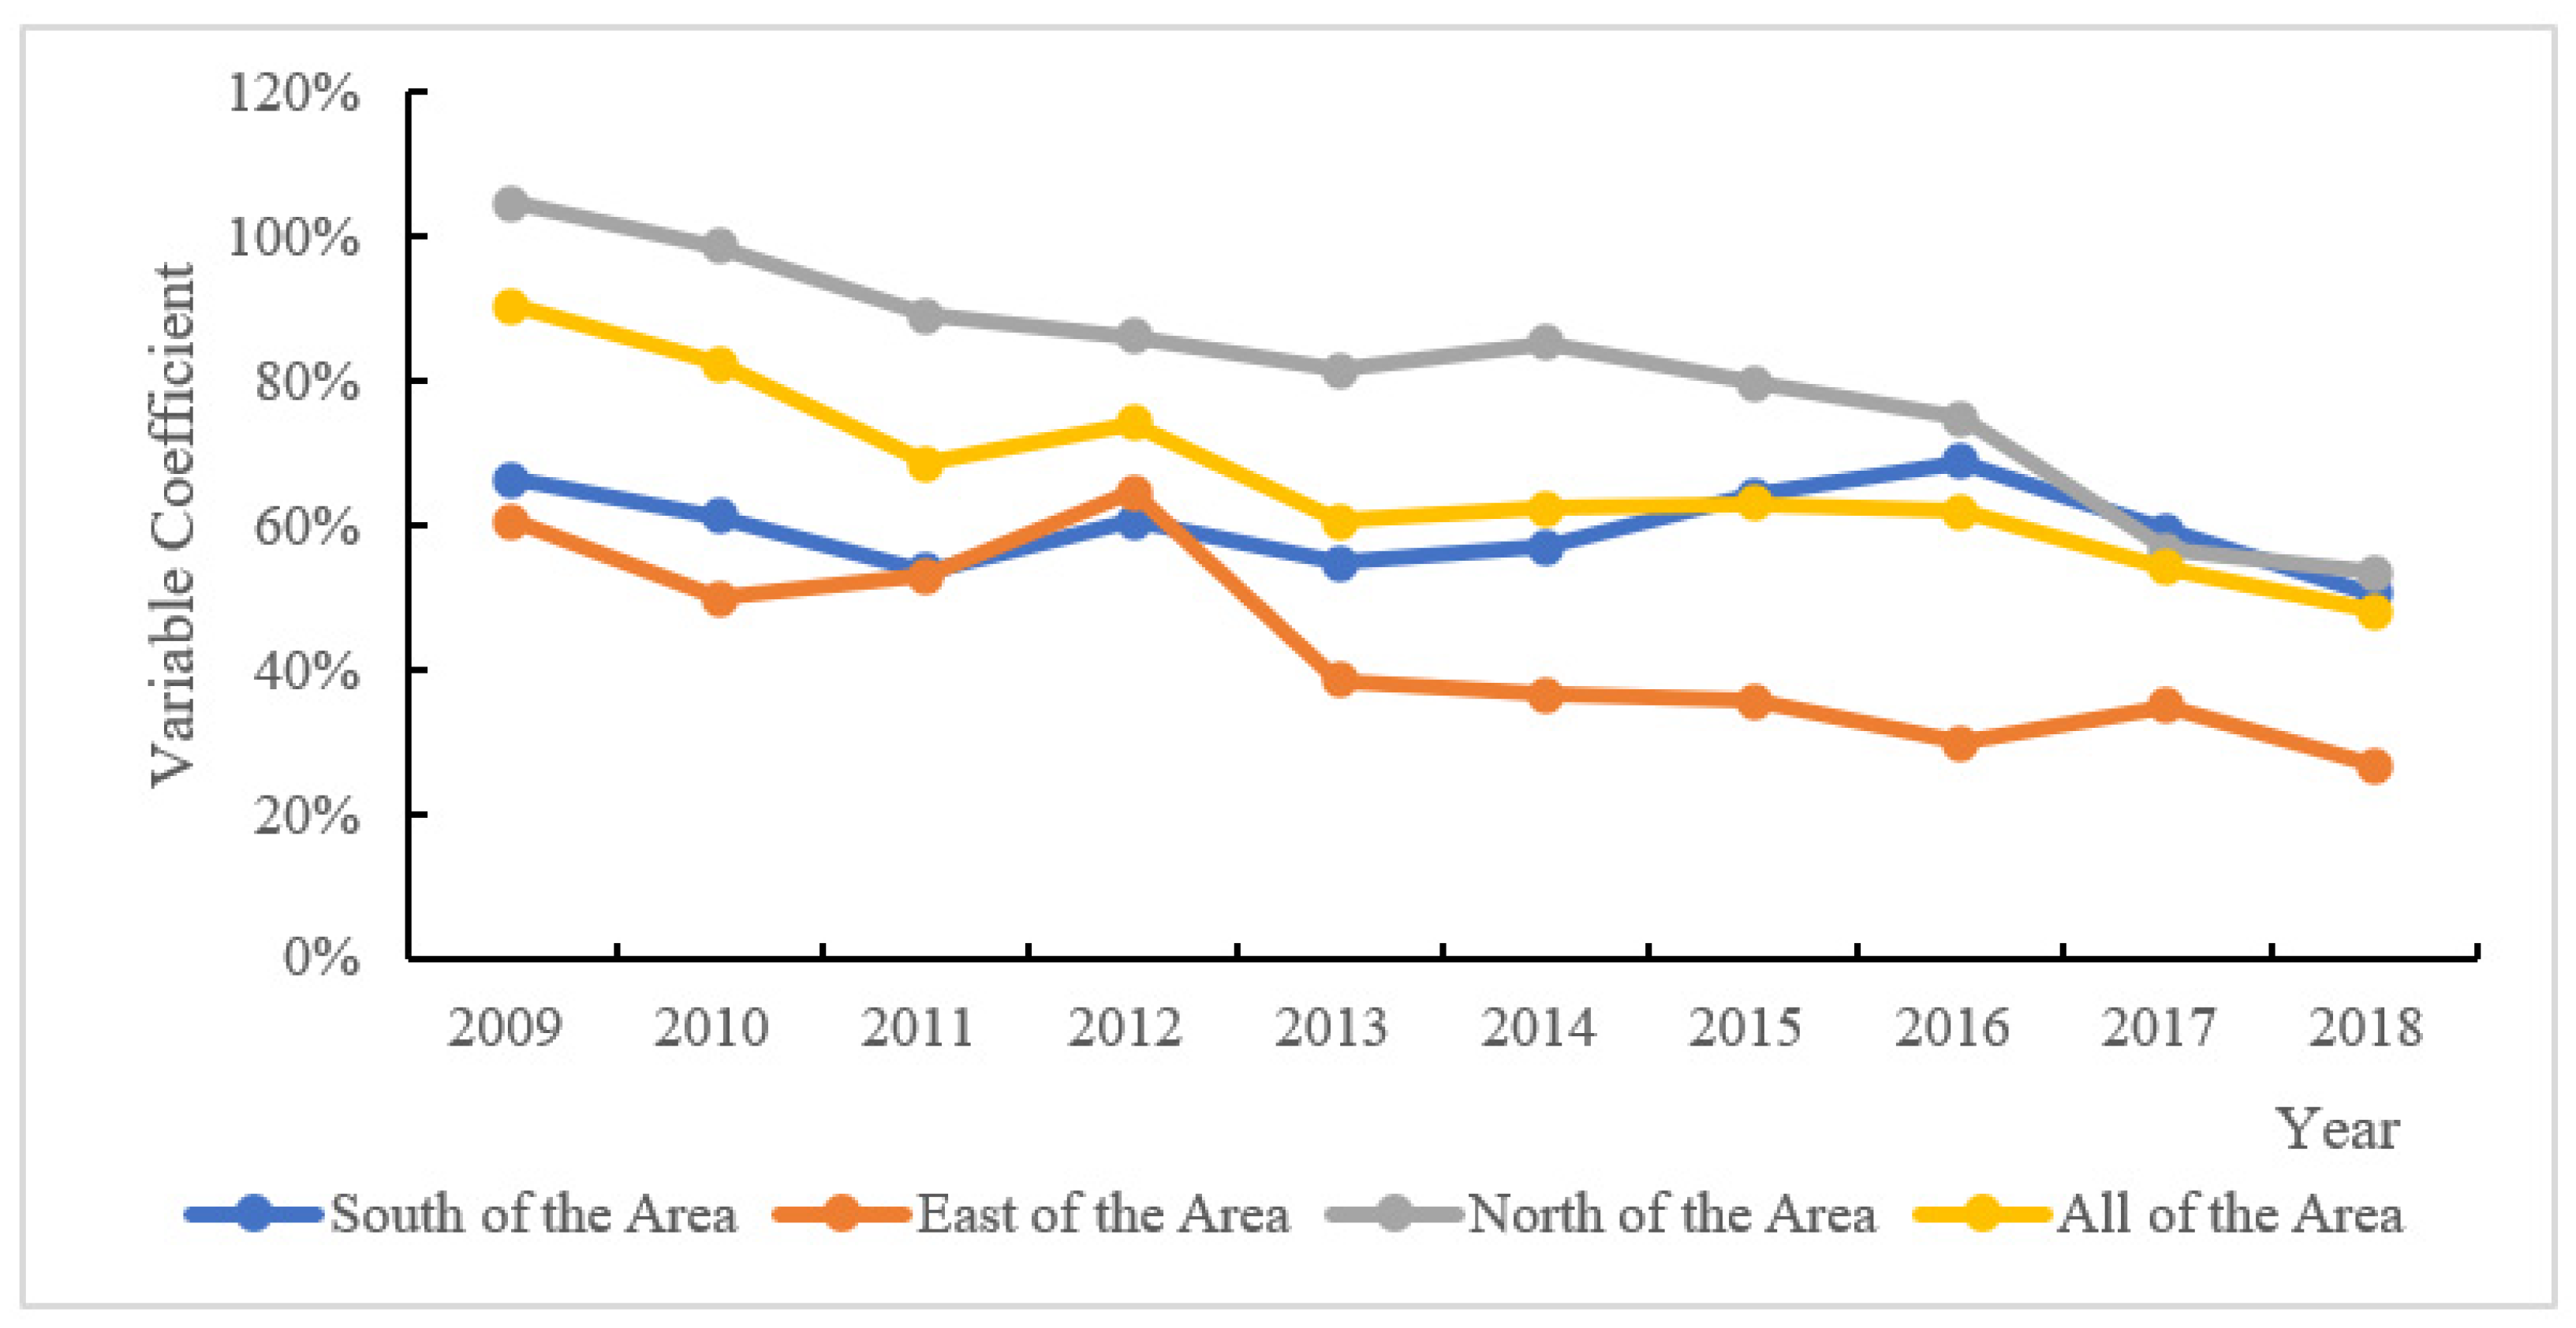
From the value of the coefficient of variation of the tourism poverty alleviation efficiency in 40 districts and counties in the Liupan Mountain area (Figure 3) from 2009 to 2018, the average value of the coefficient of variation of the tourism poverty alleviation efficiency was 56.30%, which was a moderate variation. That is, the difference in the efficiency of tourism poverty alleviation is large. The time series of the coefficient of variation showed a downward trend, indicating that the difference in efficiency of tourism poverty alleviation tended to decrease.
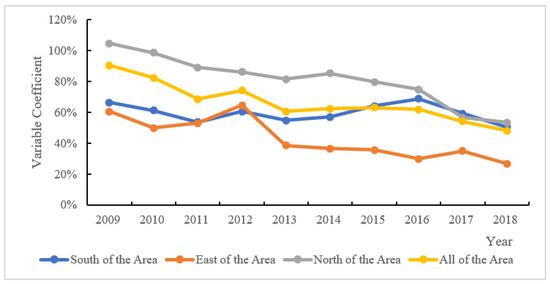
Figure 3.
Change in the coefficient of variation of tourism poverty alleviation efficiency in 40 districts and counties in the Liupan Mountain area, Gansu Province.
Based on their location, the poverty-stricken areas and counties in the Liupan Mountain area in Gansu Province are divided into those in the east, the north, and the south. The eastern part of the area consists of Huan County, Huachi County, Qingcheng County, Zhenyuan County, Ning County and Zhengning County of Qingyang City, Kongtong District, Jingchuan County and Lingtai County of Pingliang City. The northern part includes Gulang County in Wuwei City; Jingtai County, Jingyuan County, and Huining County in Baiyin City; Yongdeng County, Gaolan County, Yuzhong County in Lanzhou City; and eight districts and counties in Linxia Prefecture. The southern part includes Lintao County, Anding District, Tongwei County, Weiyuan County, Longxi County, Zhang County, Min County in Dingxi City; Wushan County, Gangu County, Qin’an County, Zhangjiachuan County, Qingshui County, Maiji District in Tianshui City; and Jingning County and Zhuanglang County in Pingliang City. These three areas represent three different spatial distributions. The northern area surrounds the provincial capital city and has a strong polarization effect; the southern area is close to the Gannan Tibetan area, with increased instability in the marginal counties; most of the eastern area falls into the same administrative division, and the development is stable.
From a regional perspective, the average values of the coefficients of variation of the eastern, northern, and southern regions were 34.31%, 74.86%, and 50.44%, respectively, indicating that the differences in tourism poverty alleviation efficiency in different regions presented a trend of northern region > southern > eastern region. This showed that the difference in tourism poverty alleviation efficiency was the largest in the north, followed by the south, and the smallest in the east. Specifically, the coefficient of variation in the northern part of the area showed an evolutionary annual decline, and evolved from a strong variation in 2009 to a medium variation. The tourism poverty alleviation efficiency in the southern part of the area showed a decrease-increase-decrease trend, with a value of 50.44%, and the coefficient of variation fluctuated at a moderate level. The coefficient of variation of tourism poverty alleviation efficiency in the eastern part of the region took 2012 as an inflection point. It underwent a process of first increasing and then decreasing. The coefficient of variation in the eastern was the lowest among the three regions, indicating that the difference was the smallest and that the internal development of the region was stable. This showed that the administrative barriers in the area had a greater impact on the tourism poverty alleviation.
3.2.2. MI and Its Dynamic Analysis
The MI measures the change in the total factor productivity of a DMU in period t + 1 by using all DMU construction production frontiers in period t. The calculation results obtained by the DEAP software showed that in the nine time periods from 2009 to 2018, the total factor productivity change index (tfpch) of tourism poverty alleviation in the Liupan Mountain area in Gansu Province was always less than 1, and the average value was 0.846. It showed that the total factor productivity of tourism poverty alleviation in the Liupan Mountain area continues to decline. Only Lingtai County and Heshui County had an average MIs greater than 1, which were 1.037 and 1.015, respectively, indicating that the total factor productivity of tourism poverty alleviation in these two counties was improving. In many districts and counties, the production efficiency of poverty alleviation through tourism declined and input and output were not maximized, indicating that there is still room for improvement.
After decomposing the MI as shown in Table 3, the technical efficiency change index is less than 1 only in 2009–2010 and 2015–2016, and its average value is 1.091, for an average annual increase of 9.1%. It shows that the management level in all aspects has been improved, which has a positive impact on the improvement of the total factor productivity of tourism poverty alleviation in the district. Decomposing the technical efficiency change index, it can be seen that the pure technical efficiency change index (pech) is only less than 1 in 2010–2011 and 2011–2012, with an overall average value of 1.023 and an average annual increase of 2.3%. The scale efficiency change index (sech) has five time periods greater than 1, with an average value of 1.067 and an average annual increase of 6.7%. It shows that the pure technical efficiency change index and the scale efficiency change index both have a positive impact on the total factor productivity of tourism poverty alleviation in the Liupan Mountain area in Gansu Province. The technological level change index (techch) was greater than 1 in 2009–2010 and was less than 1 in other years, indicating that the total factor productivity of tourism poverty alleviation in the Liupan Mountain area of Gansu Province has a widespread problem of technological decline. It means that technological development issues have had a serious effect on the increase in total factor productivity of tourism poverty alleviation in the region. In other words, the main factors restricting the improvement of tourism poverty alleviation efficiency in the 40 districts and counties are the decline of technology and the lack of innovation.
Table 3.
Changes in tourism poverty alleviation MI and decomposition efficiency in the Liupan Mountain Area in Gansu Province.
3.3. Evolution of Space Sequence
3.3.1. Spatial Distribution of Tourism Poverty Alleviation Efficiency
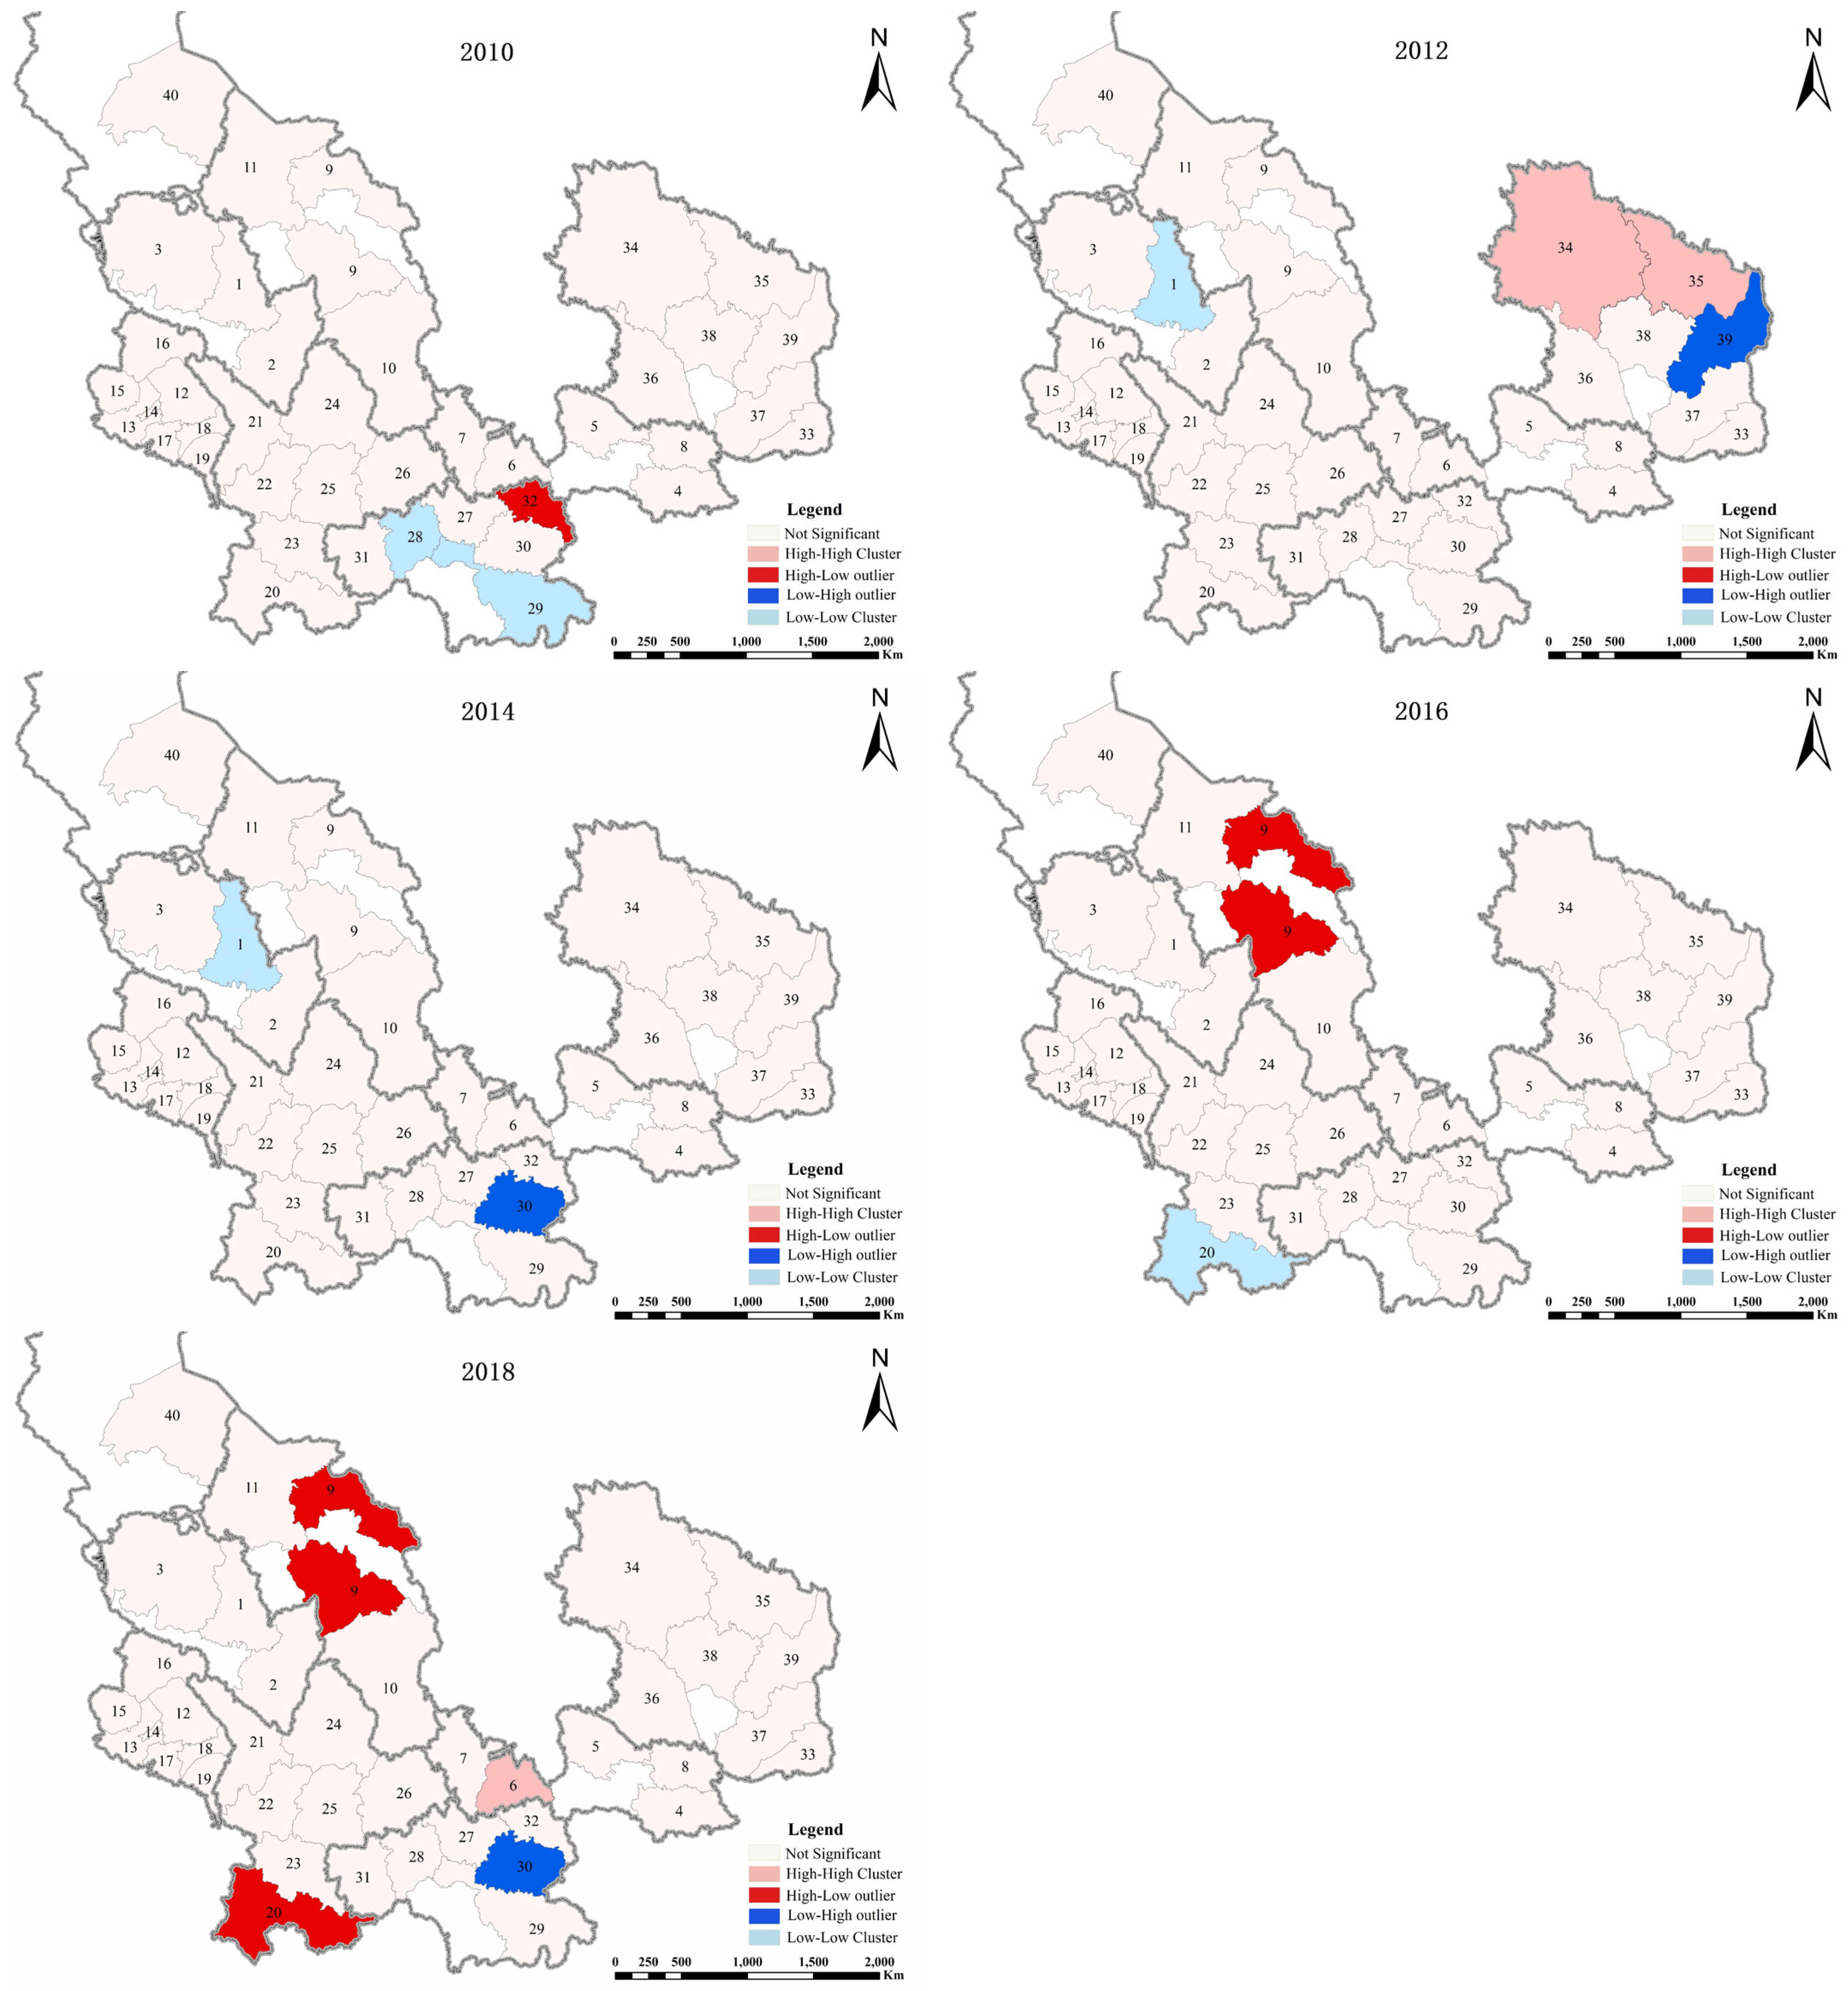
In order to reveal the characteristics of the spatial pattern of tourism poverty alleviation efficiency in 40 poverty-stricken districts and counties in the Liupan Mountain area in Gansu Province, five time-nodes in 2010, 2012, 2014, 2016, and 2018 were selected. Using the natural fracture method in ArcGIS 10.5, the tourism poverty alleviation efficiency was divided into five levels: very high efficiency, high efficiency, general efficiency, low efficiency, and very low efficiency.
Figure 4 shows that the tourism poverty alleviation efficiency in poverty-stricken areas and counties in the Liupan Mountain area in Gansu Province has undergone major changes. The number of very low efficiency zones and low efficiency zones has been significantly reduced and transformed into general efficiency zones and high efficiency zones; and the number of very high efficiency zones has also increased. The tourism poverty alleviation efficiency in 2009 has significant spatial differentiation, showing a spatial trend of eastern area > western area, and there is a spatial convergence.
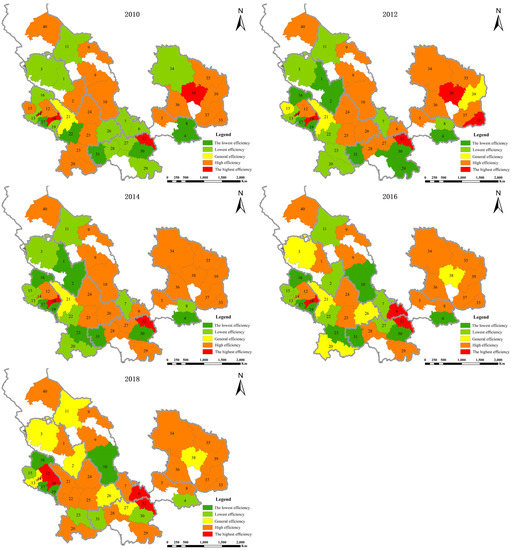
Figure 4.
Spatial distribution evolution of tourism poverty alleviation efficiency in the Liupan Mountain area in Gansu Province.
In the past ten years, the very high efficiency areas were distributed in Zhangjiahe County, Guanghe County, and the neighboring districts and counties of the two counties. The reason is that Linxia City is the seat of the Linxia Hui Autonomous Prefecture Prefectural Committee and State Government, and the political, economic, and cultural center of the prefecture. Linxia City belongs to the one-hour economic circle of Lanzhou and is susceptible to tourism’s “trickle-down effect”. Guanghe County is adjacent to and positively influenced by Linxia City. Zhangjiachuan County borders Shaanxi Province, with Longxian Natural Park in Shaanxi Province to the east, Maijishan Grottoes Scenic Area to the south, Qin’an Dadiwan Site to the west, and Kongtong Mountain to Pingliang to the north. The superior geographical location of Zhangjiachuan county is conducive to the tourism development of the area. The very low efficiency areas of tourism poverty alleviation include Yongjing County, Hezheng County, and Kangle County in Linxia Prefecture, and Qingshui County in Tianshui City. The tourism poverty alleviation efficiency in these areas is less than 0.25. The low level of tourism resources, economic backwardness, and prominent transportation infrastructure bottlenecks are important reasons that make it difficult for tourism element inputs to reach the production frontier.
3.3.2. Analysis of the Spatial Trend of Tourism Poverty Alleviation Efficiency
The trend surface analysis in ArcGIS clearly shows the spatial distribution and evolution trend of the value of tourism poverty alleviation efficiency. Because the trend analysis needs to be presented in the form of point elements, counties are represented by the location of the administrative center of each district and county. The Geostatistical Analyst in ArcGIS toolbar was used for the trend analysis. The latitude and longitude coordinates of the administrative center of each district and county were set as the value of the horizontal and vertical coordinates of the plane, and the efficiency value of each district and county was used as the spatial Z axis. Finally, the spatial trend surface analysis of tourism poverty alleviation efficiency in the Liupan Mountain area in Gansu Province in 2010, 2012, 2014, 2016, and 2018 was carried out, and a two-order polynomial fitting scatter plot was generated to reveal the law of the trend evolution of tourism poverty alleviation efficiency. Figure 5 shows the result.
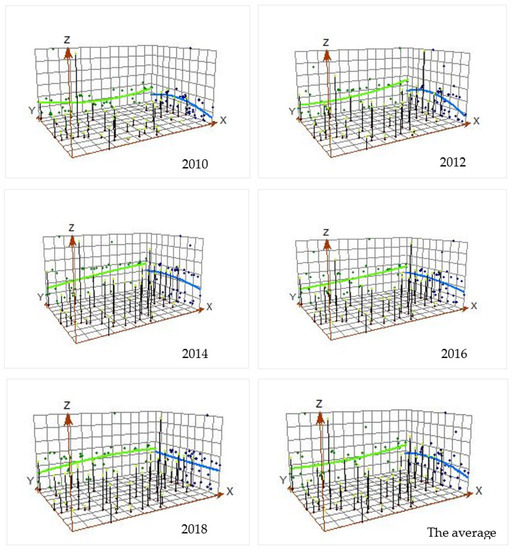
Figure 5.
Spatial fitting analysis of tourism poverty alleviation efficiency in the Liupan Mountain area of Gansu Province.
Figure 5 shows that the tourism poverty alleviation efficiency in the Liupan Mountain area in Gansu Province has the following characteristics:
- (1)
- From 2009 to 2018, the poverty alleviation efficiency in the Liupan Mountain area showed a spatial trend pattern of high in the east and low in the west, high in the north and low in the south. In the east–west and the north–south directions, the trend surface transitions from steep to gentle indicate that the difference of tourism poverty alleviation efficiency is gradually shrinking. It is consistent with the analysis results of the coefficient of variation.
- (2)
- In the east–west direction, from 2009 to 2018, the distribution pattern of tourism poverty alleviation efficiency gradually evolved from high at both ends and low in the middle to low at both ends and high in the middle. In the north–south direction, from 2009 to 2018, the tourism poverty alleviation efficiency of the Liupan Mountain area has gradually evolved from an inverted U-shaped pattern of low in the north and south and high in the middle to a linear distribution pattern with narrowing differences between the north and the south.
3.3.3. Spatial Correlation Analysis of Tourism Poverty Alleviation Efficiency
ArcGIS10.5 software was used to calculate the global spatial autocorrelation coefficient of tourism poverty alleviation efficiency in the Liupan Mountain area in Gansu Province. Spatial correlation analysis was carried out for the years 2010, 2012, 2014, 2016, and 2018. The global Moran’s I index does not show a significant positive spatial autocorrelation relationship. That is to say, the degree of spatial agglomeration of tourism poverty alleviation efficiency in the Liupan Mountain area in Gansu Province is not high, and the regional relevance is low. To explore the relationship between efficiency values in different regions, ArcGIS10.5 software (Environmental Systems Research Institute, Inc., Redlands, CA, USA) was used for local autocorrelation analysis. The heterogeneous distribution characteristics of tourism poverty alleviation efficiency in the Liupan Mountain area in Gansu Province are shown in Figure 6.

Figure 6.
Local autocorrelation distribution in the Liupan Mountain area of Gansu Province.
According to Figure 6 and Table 4, from 2009 to 2018, when the global spatial autocorrelation of the region is not significant, there are some masked local spatial autocorrelation regions; while the distribution of heterogeneous regions shows great randomness. Table 4 shows that the positive correlation of districts and counties decreased from 5% to 2.5%, while the negative correlation of districts and counties increased from 2.5% to 7.5%, showing that the spatial heterogeneity of poverty alleviation efficiency tended to strengthen and may have become a growth pole driving regional development. The high–high clusters in the Liupan Mountain area (Huanxian and Huachi County in Qingyang City, and Zhuanglang County in Pingliang City) and the high–low clusters (Zhangjiachuan County, Jingyuan County, Min County) can be used as growth poles to drive the development of surrounding tourism industries and improve the efficiency of tourism poverty alleviation.
Table 4.
Mathematical statistical table of local autocorrelation of tourism poverty alleviation efficiency.
4. Conclusions and Enlightenment
4.1. Conclusions
This paper took 40 poverty-stricken districts and counties in the Liupan Mountain area of Gansu Province as the research object, and established a multidimensional poverty-based evaluation index system of tourism poverty alleviation efficiency. This paper used the Super-SBM model to calculate the tourism poverty alleviation efficiency value of each district and county, and used the coefficient of variation and Malmquist Index to analyze the temporal evolution of the regional tourism poverty alleviation efficiency. This paper used ArcGIS to visualize the space of the value of tourism poverty alleviation efficiency, used spatial trend analysis tools to explore the spatial distribution of tourism poverty alleviation efficiency, and used autocorrelation to explore the spatial distribution correlation. The main conclusions are as follows.
- (1)
- The efficiency of tourism in the alleviation of poverty in poverty-stricken areas and counties in the Liupan Mountain area of Gansu Province had a high starting point and the average value rose from 0.76 in 2009 to 0.85 in 2018. Tourism development promoted the alleviation of poverty, but there is still room for improvement in most areas.
- (2)
- The time evolution of tourism poverty alleviation efficiency of districts and counties in the Liupan Mountain area of Gansu Province has a certain law. The coefficient of variation showed a gradual downward trend, indicating that the difference in tourism poverty alleviation efficiency started to diminish. The difference in tourism poverty alleviation efficiency in different regions showed a trend of northern area > south area > eastern area. The MI was less than 1, indicating that the change in factor productivity in the Liupan Mountain area of Gansu Province continues to decline. The decomposition efficiency analysis of MI showed that the main constraints on the improvement of tourism poverty alleviation efficiency were the lack of technological progress and lack of innovation.
- (3)
- The spatial distribution law of tourism poverty alleviation efficiency in Liupan Mountain area of Gansu Province shows that the spatial differentiation of tourism poverty alleviation efficiency from 2009 to 2018 presents a spatial trend of east area > west area and shows some continuity and spatial inertia. The trend analysis shows that the tourism poverty alleviation efficiency of poor areas and counties presents a spatial trend pattern of high in the east and low in the west, high in the north and low in the south. The east and north areas are the advantageous areas of tourism poverty alleviation efficiency. The spatial autocorrelation of tourism poverty alleviation efficiency is not significant, indicating the lack of a growth pole leading role and insufficient regional linkage. The local heterogeneity of H–H, L–L, H–L, L–H agglomeration shows a certain trend of core development.
This conclusion is consistent with Williamson’s inverted U-shaped theory. Early in economic development, all regions are on the same starting line, with slight differences. In the mid-stage of development, the advantages of some regions have emerged, and regional differences have expanded. In the later period, the disadvantaged regions have caught up, and the regional differences are less pronounced, but all regions are more developed. Taken as a whole, regional polarization is the only way, but the regional differences will disappear as development advances.
Based on the research results of this article, the following suggestions are made for the region:
- (1)
- In terms of improving the efficiency of tourism poverty alleviation, new tourism formats can be cultivated and related industries can be promoted. The government should give full play to its comprehensive leading role in tourism poverty alleviation and should guide multiple subjects to participate in tourism development. All districts and counties should seize the opportunities of the times of tourism development, dig deep into background resources, scientifically formulate tourism development plans, and cultivate new forms of business suitable for the local area.
- (2)
- In terms of improving the level of technology, new technologies should be fully utilized, and industry changes should be carried out. Tourism practitioners must strengthen technological innovation, increase the use of network virtual technologies and multi-functional travel apps, promote the efficient development of the tourism industry, and bring tourists a more comfortable travel experience.
- (3)
- In terms of solving the imbalance in regional development, the core growth pole should be cultivated, and regional cooperation should be strengthened. When formulating tourism industry policies, local governments should pay attention to strengthening regional exchanges and collaborations, coordinating tourism resources and tourist attractions, and maximizing spatial spillover effects. Counties with low tourism poverty alleviation efficiency should learn from the useful experience of advanced counties and should carry out more in-depth and all-round exchanges and cooperation with advanced counties. Administrative barriers should be broken, true centralized contiguous development should be realized, and industrial upgrading should be promoted. Multiple measures should be taken to improve the efficiency of tourism poverty alleviation in the concentrated and contiguous areas of the Liupan Mountain area in Gansu Province so as to solve the overall regional poverty, reduce the rate of return to poverty, and achieve the goal of common prosperity.
4.2. Enlightenment
Gansu Province has withdrawn from the poverty sequence, but the task of poverty alleviation is not over. Problems of poverty and returning to poverty are still restricting the economic and social development of the concentrated and contiguous poverty-stricken areas in Gansu Province. Studying the temporal and spatial evolution of regional tourism poverty alleviation efficiency will help to understand the constraints of efficiency improvement and provide a reference for follow-up poverty alleviation policies. The following shortcomings in the study could be improved.
- (1)
- The selection of indicators needs to be improved. The measurement of the efficiency of tourism poverty alleviation is complicated. When selecting input and output indicators, this article considered the availability of data and selected some alternative indicators, which may have led to deviations in the results. Factors such as the endowment of tourism resources and the local government’s emphasis on tourism development will affect the development of the local tourism industry and the improvement of tourism poverty alleviation efficiency. In the future, the construction of the index system can be improved.
- (2)
- The research content needs to be expanded. In this paper, the tourism poverty alleviation efficiency was measured by yearbook data and analyzed from a macro perspective. There was a lack of research on the real beneficiaries of tourism poverty alleviation. At the same time, researchers should study the mechanism of the temporal and spatial evolution of regional tourism poverty alleviation efficiency and the underlying factors behind it. Such studies will provide a more practical theoretical reference for policymaking.
Author Contributions
Conceptualization, Y.W.; data curation, Y.S. and S.H.; formal analysis, Y.S.; funding acquisition, Y.W.; investigation, G.C., S.H., M.W. and Y.P.; methodology, Y.W.; project administration, Y.W.; resources, Y.S., G.C., S.H. and Y.P.; software, G.C.; supervision, Y.W.; validation, M.W.; visualization, Y.S.; writing—original draft, Y.W.; writing—review and editing, M.W. All authors have read and agreed to the published version of the manuscript.
Funding
This research was funded by the National Natural Science Foundation of China, grant number (41661107); the Natural Science Foundation of Gansu Province, grant number [20JR5RA524]; the Social Science Foundation of Gansu Province, grant number [YB038]; the Key talent project of Gansu Province, grant number (2021RCXM061).
Institutional Review Board Statement
Not applicable.
Informed Consent Statement
Not applicable.
Data Availability Statement
The data in the paper is public.
Conflicts of Interest
The authors declare no conflict of interest.
References
- Wan, H.; Shi, W.; Yin, R.; Mao, N.; He, R.; Wang, Z. A Comparative Study on the Contributions of Tourism Economy of the Five Major Tourist Cities in Gansu Province. Econ. Geogr. 2020, 40, 221–229. [Google Scholar]
- Sifolo, P.P.S.; Molefe, L.P.; Henama, U.S.; Tauoatsoala, P.; Manavhela, P. Investigating the supply chain drivers and barriers in the tourism industry in Pretoria. J. Transp. Supply Chain. Manag. 2019, 13, 1–8. [Google Scholar] [CrossRef]
- Kozák, T. The Regional Multiplier Effect of Pilgrim Tourism. FIP—Financije i Pravo 2018, 6, 29–40. [Google Scholar]
- Zhang, Q. Research on the Spatial Dislocation of Henan Tourism Resources and Tourism Economy. Stat. Theory Pract. 2020, 4, 60–65. [Google Scholar]
- Zheng, Y.; Zhu, Y. Spatial Dislocation Analysis of Tourism Economy and Its Influencing Factors in Jiangsu Province. J. Econ. Sci. Res. 2021, 4, 1. [Google Scholar] [CrossRef]
- Bowden, J. Pro-poor tourism and the Chinese experience. Asia Pac. J. Tour. Res. 2005, 10, 379–398. [Google Scholar] [CrossRef]
- Slocum, S.L.; Backman, K.F. Understanding Government Capacity in Tourism Development as a Poverty Alleviation Tool: A Case Study of Tanzanian Policy-Makers. Tour. Plan. Dev. 2011, 8, 281–296. [Google Scholar] [CrossRef]
- Islam, F.; Carlsen, J. Tourism in Rural Bangladesh: Unlocking Opportunities for Poverty Alleviation? Tour. Recreat. Res. 2012, 37, 37–45. [Google Scholar] [CrossRef]
- Truong, V.D. Tourism, poverty alleviation, and the informal economy: The street vendors of Hanoi, Vietnam. Tour. Recreat. Res. 2018, 43, 52–67. [Google Scholar] [CrossRef]
- Yang, Z.; Ma, H.; Wang, H.; Zhang, X. A review of research on poverty alleviation by tourism in China: 1996–2020. Agric. Sci. Res. 2021, 42, 60–65, 92. [Google Scholar]
- Lee, B.; Graefe, A. Promotion of Family Recreation for a Nature-Based Destination. J. China Tour. Res. 2010, 6, 50–60. [Google Scholar] [CrossRef]
- Poyya, M.G. Promotion of peace and sustainability by community based heritage eco-cultural tourism in India. Int. J. Humanit. Peace 2003, 19, 40–45. [Google Scholar]
- Di, M.; Zheng, F.; Xu, N.; Wu, X. Selection of suitable models for poverty alleviation by tourism in poverty-stricken counties around Beijing and Tianjin in Hebei Province. Geogr. Geo-Inf. Sci. 2015, 31, 123–126. [Google Scholar]
- Spenceley, A.; Goodwin, H. Nature-based tourism and poverty alleviation: Impacts of private sector and parastatal enterprises in and around Kruger National Park, South Africa. Curr. Issues Tour. 2007, 10, 255–277. [Google Scholar] [CrossRef]
- Lepp, A. Residents’ attitudes towards tourism in Bigodi Village, Uganda. Tour. Manag. 2007, 28, 876–885. [Google Scholar] [CrossRef]
- Mbaiwa, J. The effects of tourism development on the sustainable utilisation of natural resources in the Okavango Delta, Botswana. Curr. Issues Tour. 2011, 14, 251–273. [Google Scholar] [CrossRef]
- Deng, X. Analysis of the Benefits of Rural Tourism Poverty Alleviation in Wulingshan Area; Jishou University: Jishou, China, 2018. [Google Scholar]
- Li, H.; Li, X.; Hou, L. Research on the perception of poverty alleviation effects of tourism in the fragile ecological environment of the Loess Plateau——Taking Guzui Village, Luochuan County, Shaanxi Province as an example. Tour. Res. 2012, 4, 1–6. [Google Scholar]
- Schmidt, J.; Uriely, N. Tourism development and the empowerment of local communities: The case of Mitzpe Ramon, a peripheral town in the Israeli Negev Desert. J. Sustain. Tour. 2019, 27, 805–825. [Google Scholar] [CrossRef]
- Fan, X.-Q.; Lu, Z.-L.; Wu, H.-X. Current Situation of Rural Residents’ Tourism: A Case Study in Zhejiang ovince in China. Asia Pac. J. Tour. Res. 2014, 19, 1191–1206. [Google Scholar] [CrossRef]
- Guo, Q. Problems and countermeasures in the development of tourism poverty alleviation. Econ. Geogr. 2003, 23, 558–560. [Google Scholar]
- Özlem, G.; Rüya, E.; Chris, R. The Success Factors of wine tourism entrepreneurship for rural area: A thematic biographical narrative analysis in Turkey. J. Rural. Stud. 2021, 84, 230–239. [Google Scholar]
- Ashley, C.; Roe, D. Making tourism work for the poor: Strategies and challenges in southern Africa. Dev. South. Afr. 2002, 19, 61–82. [Google Scholar] [CrossRef]
- Hasrina, H. The Potential of Pro-Poor Tourism (PPT) Strategies as a Vehicle for Reducing Poverty in Langkawi Island, Kedah Darul Aman; Universiti Utara Malaysia: Kedah, Malaysia, 2004. [Google Scholar]
- Haretsebe, M.; Farai, M. Poverty Alleviation through Pro-Poor Tourism: The Role of Botswana Forest Reserves. Sustainability 2014, 6, 5697–5713. [Google Scholar]
- Kimaro, M.E.; Ndlovu, J. Evaluating the Role of Small Private Tourism Businesses in Poverty Alleviation: A Corporate Social Responsibility Approach in Namibia. J. Hum. Ecol. 2017, 58, 132–145. [Google Scholar] [CrossRef]
- Tchouamou, N.E.; Neelu, S. Tourism Contribution to Poverty Alleviation in Kenya: A Dynamic Computable General Equilibrium Analysis. J. Travel Res. 2018, 57, 513–524. [Google Scholar]
- Su, L.; Wang, L.; Law, R.; Chen, X.; Fong, D. Influences of destination social responsibility on the relationship quality with residents and destination economic performance. J. Travel Tour. Mark. 2017, 15, 488–502. [Google Scholar] [CrossRef]
- Su, L.; Swanson, S.R. The effect of destination social responsibility on tourist environmentally responsible behavior: Compared analysis of first-time and repeat tourists. Tour. Manag. 2017, 60, 308–321. [Google Scholar] [CrossRef]
- Su, L.; Hsu, M.K.; Boostrom, R.E. From recreation to responsibility: Increasing environmentally responsible behavior in tourism. J. Bus. Res. 2020, 109, 557–573. [Google Scholar] [CrossRef]
- Su, L.; Swanson, S.R.; He, X. A scale to measure residents perceptions of destination social responsibility. J. Sustain. Tour. 2020, 28, 873–897. [Google Scholar] [CrossRef]
- Xu, L.; Deng, X.; Jiang, Q.; Ma, F. Research on the identification and poverty alleviation path of multidimensional poverty and relative poverty in Chinese counties. Acta Geogr. Sin. 2021, 76, 1455–1470. [Google Scholar]
- Zeng, B.; Ryan, C. Assisting the poor in China through tourism development: A review of research. Tour. Manag. 2012, 33, 239–248. [Google Scholar] [CrossRef]
- Long, Z.; Du, Q.; Zhou, T. The temporal evolution and spatial differentiation of the efficiency of tourism poverty alleviation in Wuling Mountain. Econ. Geogr. 2015, 35, 210–217. [Google Scholar]
- Wang, S.; Guo, Y. Construction and Empirical Research on the Evaluation Model of Tourism Poverty Alleviation Efficiency—Empirical Evidence from China. Soc. Sci. 2018, 6, 88–97. [Google Scholar]
- Huang, Y. Evaluation of Tourism Poverty Alleviation Efficiency in Contiguous Destitute Areas and Spatial and Temporal Differentiation—Taking 20 counties (cities, districts) in the southern part of Wuling Mountain as an example. Econ. Geogr. 2017, 37, 229–235. [Google Scholar]
- Cao, Y.; Ma, L. Evaluation of the efficiency of tourism poverty alleviation in ethnic areas in my country based on three-stage DEA. East China Econ. Manag. 2017, 31, 91–97. [Google Scholar]
- Li, Y. The Efficiency of China’s Tourism Poverty Alleviation: A Study Based on DEA Window Analysis and Nonlinear Threshold Effect; Guangxi University: Nanning, China, 2018. [Google Scholar]
- Yin, J.; Luo, Q.; Gan, C.; Xiong, Y.; Zheng, S. Analysis of the efficiency of tourism poverty alleviation and the spatial characteristics of tourism economic intensity in concentrated contiguous destitute areas—Based on the Super-SBM model and social network analysis method. Res. Agric. Mod. 2020, 41, 872–881. [Google Scholar]
- Zhong, S.; He, Z. Research on the Measurement and Spatiotemporal Evolution of China’s National Poor County Development Efficiency Based on DEA and ESDA. China Popul. Resour. Environ. 2016, 26, 130–136. [Google Scholar]
- Guo, N.; Qian, L. Analysis of influencing factors on the efficiency of precision poverty alleviation in concentrated contiguous destitute areas. J. Yancheng Inst. Technol. (Soc. Sci. Ed.) 2019, 32, 51–57. [Google Scholar]
- Implementation Plan for Regional Development and Poverty Alleviation in Liupanshan Area of Gansu Province (2016–2020); General Office of the People’s Government of Gansu Province. Available online: http://www.gsei.com.cn/html/1275/2017-05-31/content-180550.html (accessed on 1 November 2021).


Publisher’s Note: MDPI stays neutral with regard to jurisdictional claims in published maps and institutional affiliations. |
© 2021 by the authors. Licensee MDPI, Basel, Switzerland. This article is an open access article distributed under the terms and conditions of the Creative Commons Attribution (CC BY) license (https://creativecommons.org/licenses/by/4.0/).