Article

Cost-Effective Inspection of Rebar Spacing and Clearance Using RGB-D Sensors

1
Center for Advanced Research and Computing, University of New Mexico, Albuquerque, NM 87131, USA
2
Department of Civil, Construction and Environmental Engineering, University of New Mexico, Albuquerque, NM 87131, USA
*
Author to whom correspondence should be addressed.
Sustainability 2021, 13(22), 12509; https://doi.org/10.3390/su132212509
Submission received: 19 October 2021 / Revised: 9 November 2021 / Accepted: 9 November 2021 / Published: 12 November 2021
(This article belongs to the Collection Structural Sensing and Sustainable Infrastructure Maintenance)

Abstract

:
The quality assurance of constructing reinforced concrete (RC) structures in compliance with their design plays a key role in the durability, serviceability, and sustainability of the built RC elements. One area of concern in the quality control of constructing RC structures is examining the position and dimension of the rebars before pouring fresh concrete. Currently, this is accomplished by visual inspection and individually by hand with limited time available between construction stages. Over the past decades, structural health and monitoring during the construction period has applied remote sensing technologies. However, little research has focused on the use of such technologies to inspect and evaluate rebar placement prior to concrete pouring as quality control. In this study we develop an algorithm that facilitates inspecting the positions of rebars and the cover of concrete using a new-generation low-cost RGB-D sensor to find incorrect rebar placement. The proposed method is evaluated using a typical 5 × 5 two-layer rebar cage in the laboratory by comparing the proposed technique with traditional inspection methods. The results show that the RGB-D sensor can achieve cost-effective inspection for rebar spacing and clearance with an acceptable tolerance. The evaluation of rebar spacing results shows that the maximum standard deviation for rebar spacing is 0.34 inch (8.64 mm) between longitudinal rebar 2 and 3, which is the same as the rebar construction and traditional tape measurement results. The concrete cover estimation results show that the maximum standard deviation for rebar cage concrete cover is 0.19 inch (4.83 mm) for longitudinal rebar 3. The issues of new RGB-D sensor scan settings and the test results will be helpful for practitioners in improving construction quality.

1. Introduction

The damage caused by rebar corrosion to reinforced concrete (RC) structures is a serious problem. Rebar placement quality control is vital for improving productivity, safety, and sustainability in construction projects [1]. The inspection of rebar placement is one important quality control process for the construction in ensuring structural performance and sustainability. The quality control of rebar placement of an RC element is expertise-dependent and tedious work [2]. Typically, the checklists for rebar inspection before concrete pour include rebar spacing, rebar elevation, rebar size, and concrete cover [3]. It is necessary to check whether the rebar placement meets the design drawings before placing fresh concrete since the location of rebars dictates the strength and durability of the RC element. The error between the rebar construction and rebar design drawing should not exceed the tolerance. The incorrect rebar placement and correct cover can lead to reduced durability due to possible cracks, spalling, and rebar corrosion. The consequences of low-quality rebar construction will result in the short service life of structures and the possibility of safety issues such as collapses. Additionally, the rebars must be appropriately surrounded by the concrete; thus, spacing between the rebars should be large enough for the gravel in concrete and the vibrator to pass among them. Therefore, rebar placement inspection could impact structural performance, serviceability, safety, and future maintenance cost [4].
Currently, the most common way to inspect rebar elements is manually measuring them by tape measurement. The transitional monitoring method takes a long time, requires more than one inspector to double-check, and cannot obtain a permanent digital record [5]. In addition, inspectors need to stand on the rebar mat during measuring a large-scale construction site, which creates safety issues for the inspectors and potential damage to the fabricate of the rebar cages [6]. Therefore, an automatic and non-contact rebar inspection technique is needed. The automatic rebar placement inspection can make sure the as-built rebar mat meets the requirements or specifications in an effective way to maintain the durability and sustainability of the structures. Automated rebar inspection methods may be a promising solution to the current labor-intensive construction monitoring industry and increase productivity. Therefore, this research aims to develop a rebar detection algorithm that uses low-cost RGB-D sensors to automatically check the spacing and elevation of rebar and concrete cover to detect any unacceptable differences before concrete pouring.
This paper describes the development and implementation of an algorithm that automatically inspects the positions of rebars with the data obtained from a new-generation Azure Kinect RGB-D low-cost sensor. The automatic estimation algorithm finds spacing differences before pouring the concrete. In this paper we also investigate whether the Azure Kinect sensor could be used to create digital twins of rebar models. Azure Kinect’s depth sensor captures and processes a 3D digital dataset that is displayed for the inspector. We developed a new rebar recognition algorithm to detect the rebar location in a typical rebar cage. The case study results are presented with sufficient detail, highlighting the advantages and disadvantages of the new approach, which will improve with the continuing development of technology.

2. Research Background

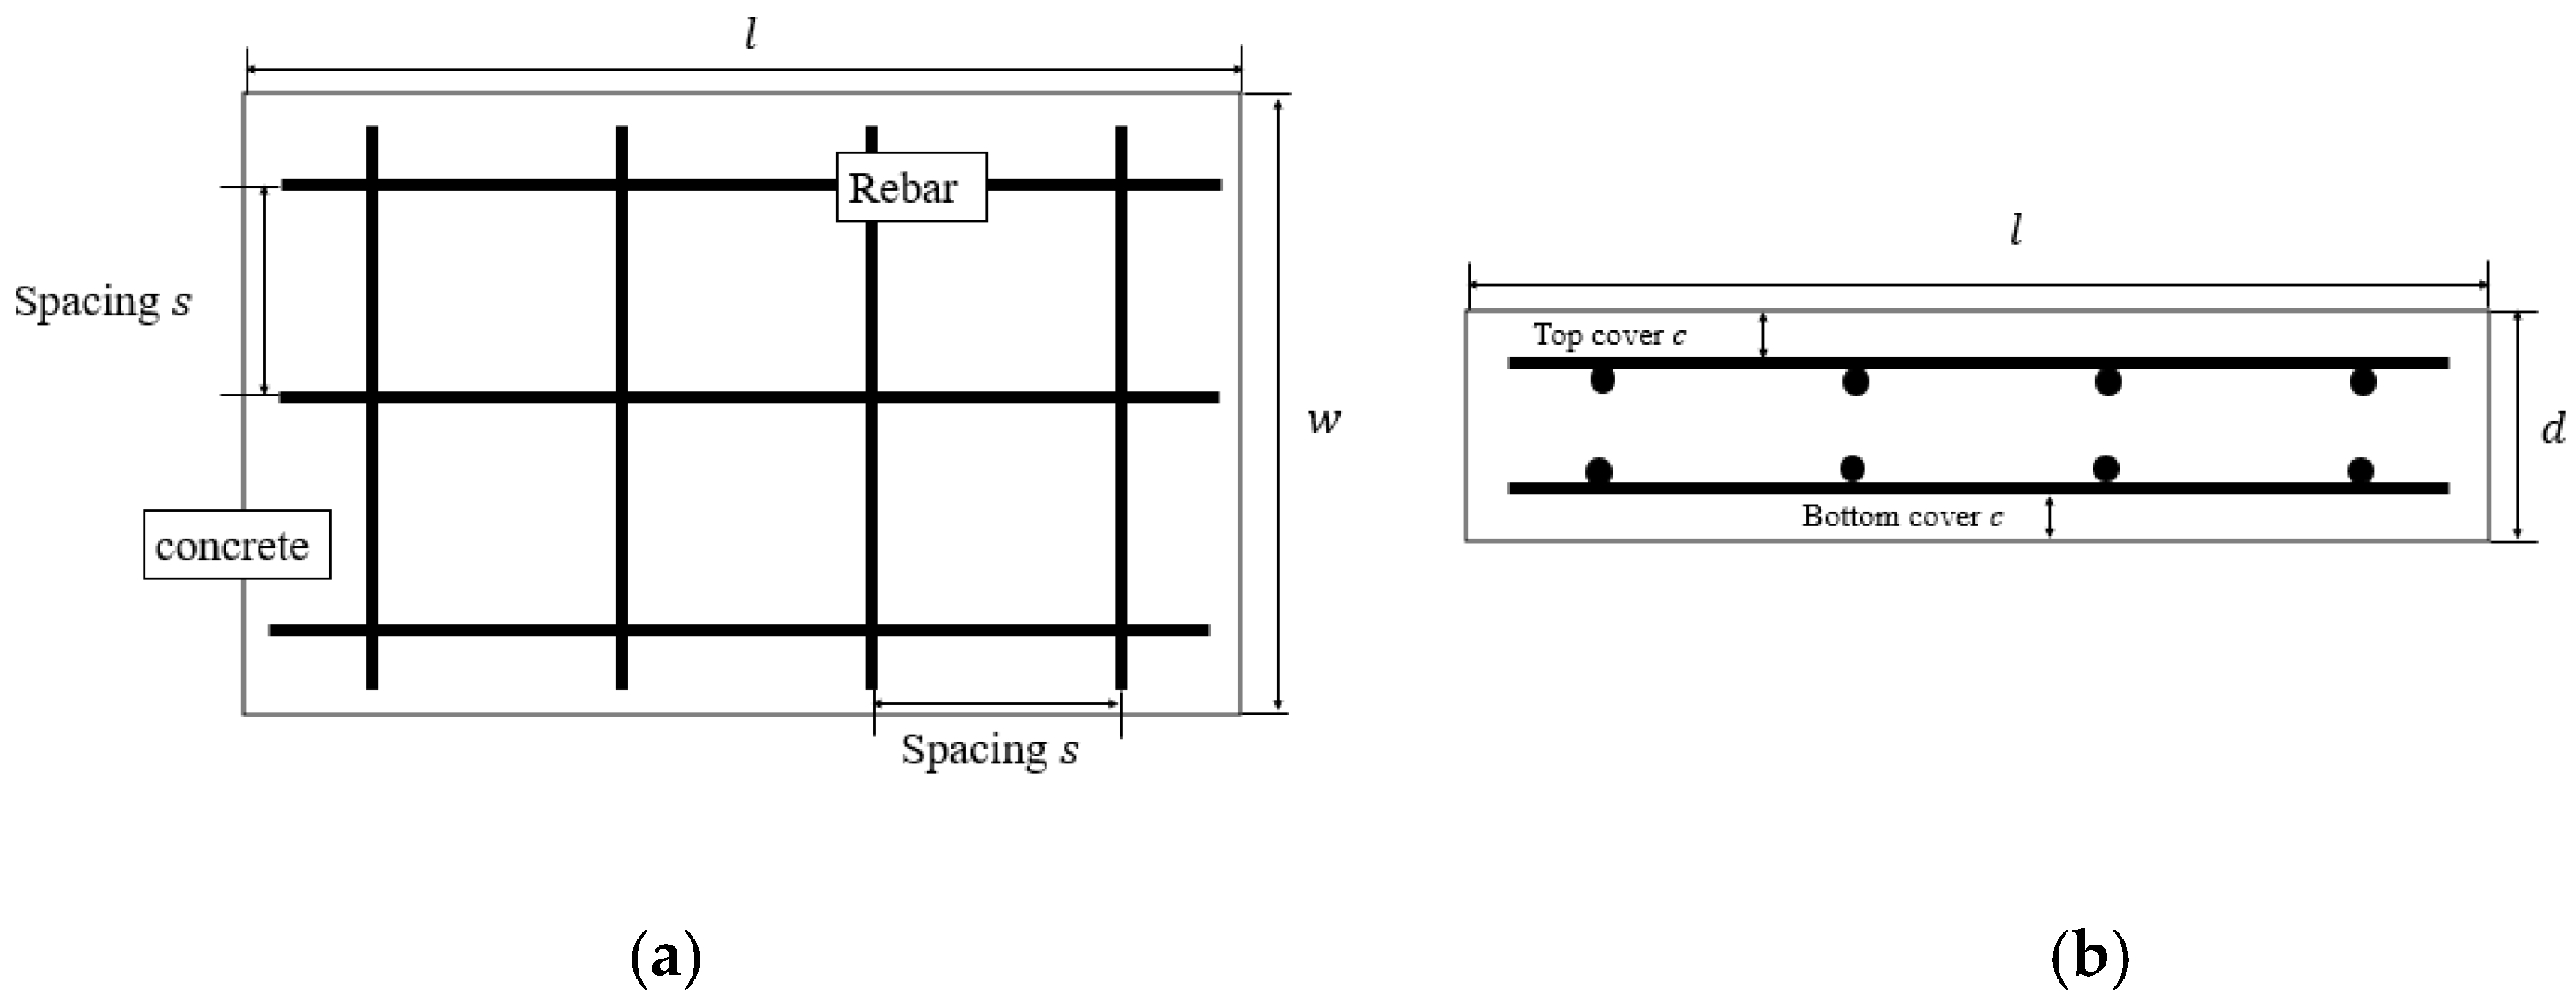
2.1. Specifications for Rebar Inspection, Concrete Cover

Concrete is a brittle material and possesses a low tensile strength (i.e., less than 10 percent of compressive strength), which causes the occurrence and propagation of cracks due to load [7]. Steel rebar is the most common reinforcement strategy to withstand tensile stresses and avoid brittle failure of concrete structures. The installation process involves placing the required rebars computed according to the design specifications, such as ACI-318, inside the formwork, then pouring fresh concrete to embed the reinforcement. After vibration, a strong interface bond is formed between rebar and concrete. Correct rebar placement will impact the RC element strength and durability crucially. According to ACI 318, the maximum spacing for rebars is 18 inches for flexure or shrinkage. In addition, the minimum clear spacing between rebars must be at least equal to the largest of a 1 inch nominal diameter of the longitudinal reinforcing bars, or 4/3 the nominal maximum size of coarse aggregate in the concrete mix. Table 1 summarizes specification documents of construction tolerance for a typical RC element according to ACI 117 [8], including rebar spacing, rebar elevation, and concrete cover. Figure 1 also illustrates the schematic definition of tolerances for rebar spacing and concrete cover. According to ACI 117, the allowable tolerance for the position of longitudinal rebars is ±0.5 inch for an RC structure depth smaller than 12 inches. The allowable tolerance for concrete cover with a depth <12 inches is ±3/8 inch. The tolerance for rebars needs to comply with the engineering blueprint drawing and related specifications [8,9].

2.2. Literature Review

Over the past decade, automated data collection methods have utilized different technologies; for example, 3D laser scanners, photogrammetry, and 2D cameras have been explored to automate the inspection of RC elements. LiDAR and depth cameras are the most popular remote sensing technologies in the non-contact inspection area. Researchers have used LiDAR scanners and different data processing algorithms to inspect RC structures. Kim Min-Koo et al. worked on the rebar behavior inspection of a sustainable RC slab using LiDAR. They developed a machine-learning-based algorithm to detect the rebar position and formwork dimension [10]. The limitation of their study is that they only focus on the top layer of the rebar mat. Qian Wang et al. conducted a study on dimensional quality assessment for formwork and rebar using colored laser scan data in 2020 [11]. However, their algorithm can only determine the average position of the side rebar, which hides the internal rebar placement errors. X Yuan et al. developed a recognition algorithm that automatically identifies the rebar position using LiDAR in 2021 [12]. The experimental results can detect the rebar location for each bay, which is done with high accuracy but needs a large-scaled field validation. These studies focus on RC component inspection, all using LiDAR scanners. Other researchers proposed reliability estimation of reinforced slopes and the critical risks method (CRM) to prioritize the sustainability of critical RC infrastructures, which are promising RC component inspection and management technologies [13,14,15].
Given that laser scanners are relatively expensive, the use of low-cost RGB-D sensors has been increasing due to the ability of these sensors to capture depth and color images from the scene simultaneously. A wide variety of inspection tasks in civil engineering have been approached using RGB-D data. Ahmadreza et al. [16] measured pavement surface characteristics using a Kinect RGB-D sensor and demonstrated their ability to reconstruct the 3D pavement surface with acceptable accuracy using an RGN-D sensor. Zhu, Z. and Donia, S. [17] studied the potential of RGB-D cameras in as-built indoor environment modeling. Their studies show that the RGB-D camera can provide a stream of mild-accurate sensing data in real-time. They indicated that a high degree of automation could be achieved by combining spatial and visual data from the camera when modeling the as-built conditions in building indoor environments. Recently, Kim, Hema., et al. [18] proposed a crack identification strategy using a combination of RGB-D and high-resolution digital cameras to measure cracks accurately regardless of the angle of view. The measurement accuracy of the RGB-D approach was validated on an actual concrete structure. Koppula et al. [19] used a graphical model to capture various features and contextual relations for object recognition in indoor scenes using a Kinect RGB-D sensor. There are barely any studies using depth sensors for rebar identification. Rebar inspection is especially challenging due to rebar’s relatively narrow spacing, the congested cages of rebar hooks, tie hooks, and overlapped longitudinal rebars, particularly in the beam-column joints, and the presence of several layers of rebars [20]. The hardware improvements of the Azure Kinect sensor provide a promising solution for rebar inspection for its greater and more powerful spatial data simultaneous localization and mapping.

3. Methodology

In this research we designed a new RC field inspection methodology that involves using the RGB-D sensor to address the limitations and difficulties faced by engineers during a visual inspection. Figure 2 shows the flowchart of the proposed RC component inspection process, which includes three modules. The first module is a preparation module; the authors set up the Azure Kinect RGB-D sensor, test and calibrate the sensor, and design and build the rebar mat model. The second step is the inspection module; this module includes experimental set-up, rebar spacing measurement by tape, and rebar mat data collection by RGB-D sensor. The RC element can be scanned and RC element point cloud data can be collected by one scan per its size. The last step is the data processing module. The raw data are preprocessed by removing background noise and outliers. After removing the noise, the remaining scan data are used for the detection of rebars by applying the developed algorithm. Finally, the rebar spacing and concrete cover estimation are performed.

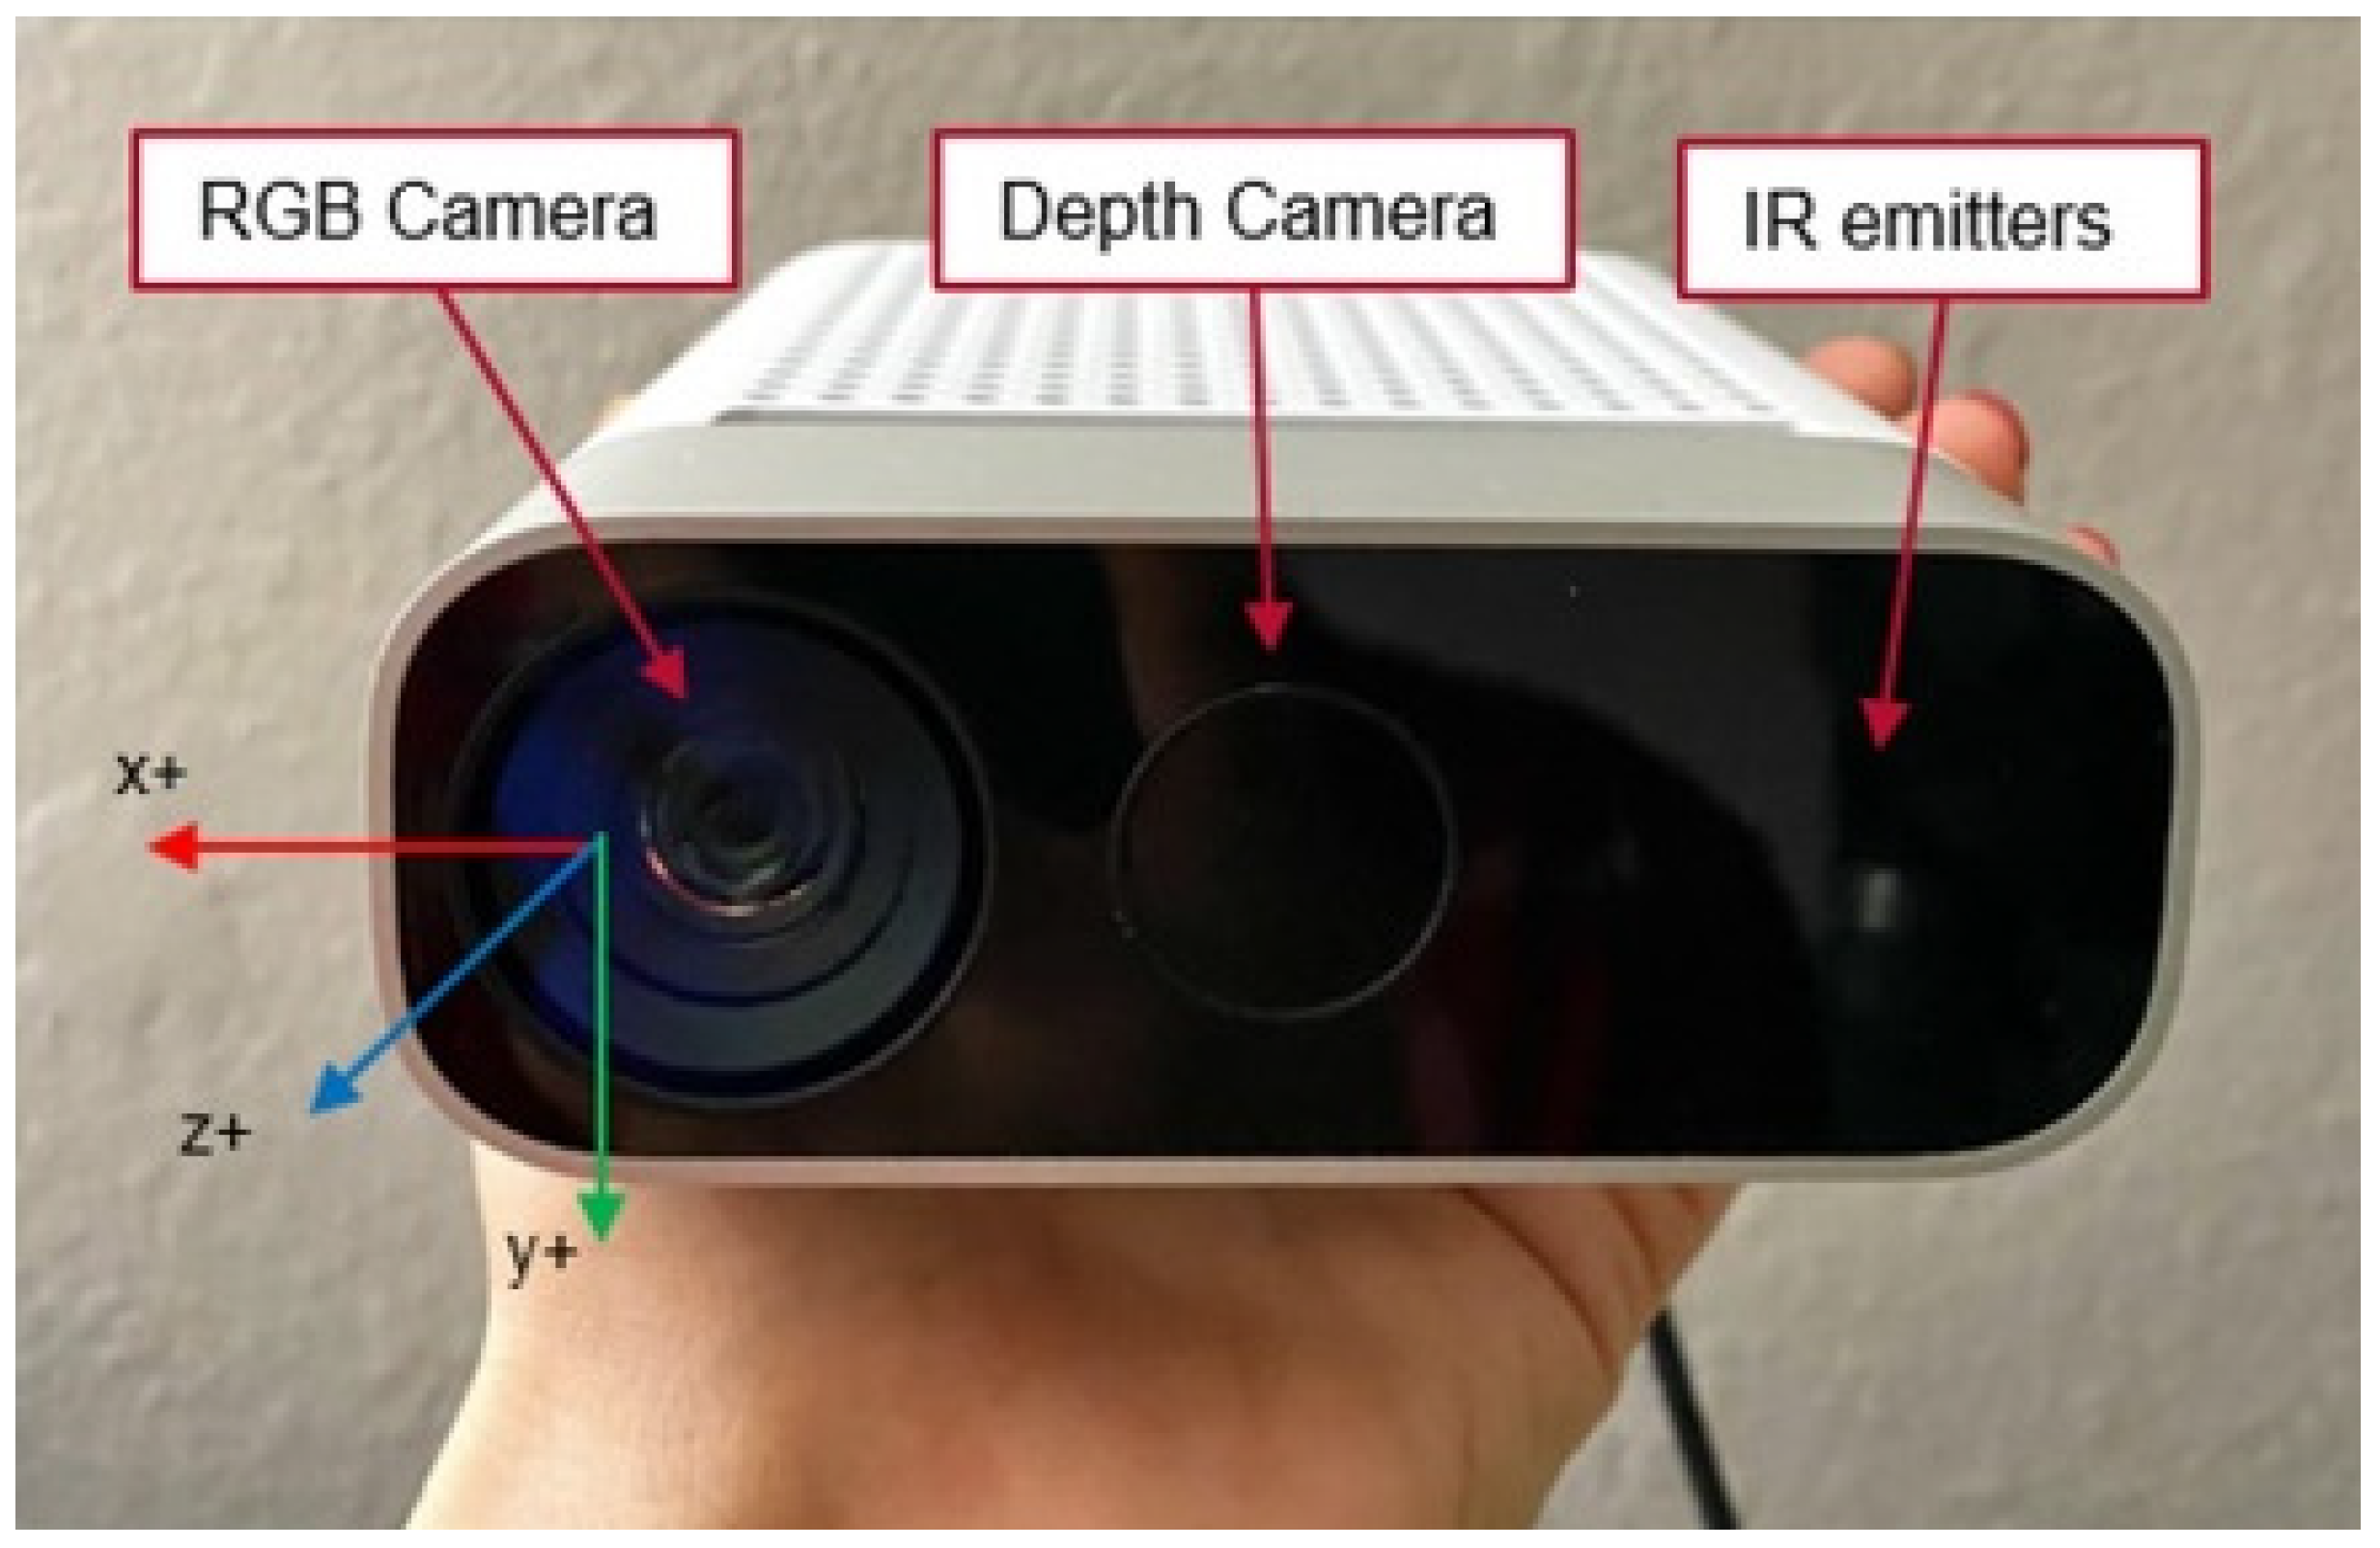
3.1. Data Acquisition

The raw scan data are acquired by a low-cost RGB-D sensor known as Azure Kinect from Microsoft [21]. Microsoft released it as a cost-effective alternative for acquiring 3D point-cloud data. The Azure Kinect uses time-of-flight measurement, is less sensitive to interference with other sensors, and provides a higher resolution [21]. Figure 3 shows the incorporated sensors of Azure Kinect: a 12-megapixel RGB color camera; a 1-megapixel amplitude modulated continuous wave time-of-flight depth camera with a bandwidth of 850–862 nm; and an IR emitter [22]. Azure Kinect is a developer kit with advanced AI sensors for sophisticated computer vision. RGB-D sensors combine RGB color information with per-pixel depth information. The output of this sensor is a point cloud: a collection of points in 3D space, where each point can have additional features associated with it. The depth provided outside of the indicated range depends on object reflectivity. The output of the data format is colorized point cloud data. A depth map is a set of Z-coordinate values for every pixel of the image, measured in units of millimeters.
Rebar layout design may vary considerably for different construction components. Construction components in which rebars are positioned in a two-way arrangement in vertical and horizontal directions entail high rebar consumption. Real-time, high-quality, 3D scanning of rebar inspection is key to the automatic construction quality control process. In this study we aim to automatically detect the rebar placement quality using a new algorithm based on the Azure Kinect RGB-D sensor on a slab. The flowchart of the methodology is shown in Figure 4.
Data collection using RGB-D sensors can be conducted by creating a recording of the scanning using k4arecorder.exe. Then we can use the Azure Kinect Viewer to play back a recording. To be specific, we launch k4aviewer.exe first, then Unfold the Open Recording tab and open the recording. The recording of the dataset will be shown as below.

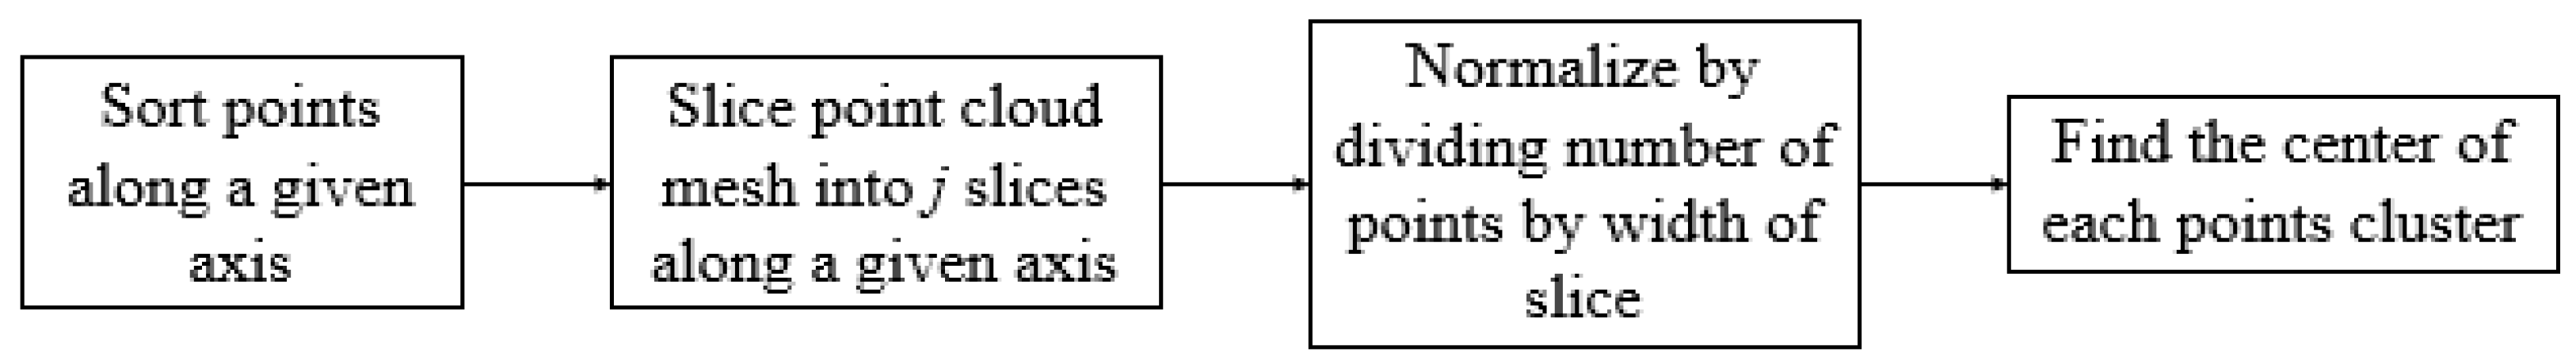
3.2. Data Processing

The first step for data processing is to remove background noise and outliers. The raw point cloud data scanned by the RGB-D sensor are implemented and segmented in the top and bottom rebar mat, the stirrup, and the outlier using CloudCompare filter [23]. After denoising, the next step is to detect the rebar position from the clean data. For the task of rebar position detection using an RGB-D sensor, the authors developed a slicing algorithm to detect the rebar object from raw point-cloud data.
The algorithm procedure is summarized in the flow diagram shown in Figure 5 below. Rebar location estimation procedure: first, every individual rebar detected as a subsection in each bay for transverse rebar; second, detect the sliced rebar subsection center as elevation value; third, each rebar detected in each bay as sub-section for longitudinal rebar; fourth, detect the sliced rebar subsection center as an elevation value. The cluster represents the rebar with the most points from the point-cloud model. A clustering algorithm is applied to determine the center of clusters with the most points, which are the location of rebars. The clusters’ areas are windowed by a moving bin. The width of the moving bin is determined by the size of the cluster and the whole structure. The size of the bin is critical to obtain an accurate rebar position. Ideally, if the bin’s width is too small, the total computation time is high, but if the width of the bin is too large, the accuracy of the recognition is low.

3.3. Rebar Spacing and Concrete Cover Estimation

This step is going to discuss the sustainability of the RC structure based on the quality of rebar placement. Once the rebar center point is detected, rear spacing and concrete cover are estimated. First, rebar spacing is defined as the distance between the center points of the adjacent two rebars. If the quality of rebar placement is good, rebar spacing between each subsection should be the same, as shown below, S 1 = S 2 = S 3 = S 4 . If the two adjacent rebars have the wrong placement, the spacing value between each subsection will have a considerable standard deviation. The larger the variability in the spacing values, the worse the quality of the fabrication [24]. In addition, the angle can indicate the placement quality. The larger the angle, the worse the placement quality. Figure 6 below is the illustration of rebar spacing estimation.
Another practical inspection of RC structure during construction is the top and bottom concrete cover. Typically, the spacer and ground can limit the bottom concrete cover; therefore, in this study we will focus on the cover inspection. The top concrete cover is computed as the distance between the outer rebar surface and the top concrete surface. The placement quality of rebar may result in the lack of concrete cover, or even if the concrete cover is enough, the deviation of concrete cover value will lead to uneven structural strength distribution, which is the main reason for cracks and defects in RC structures [25]. Figure 7 below shows the illustration of the top cover for good- and bad-quality rebar placement.

4. Experiment Validation

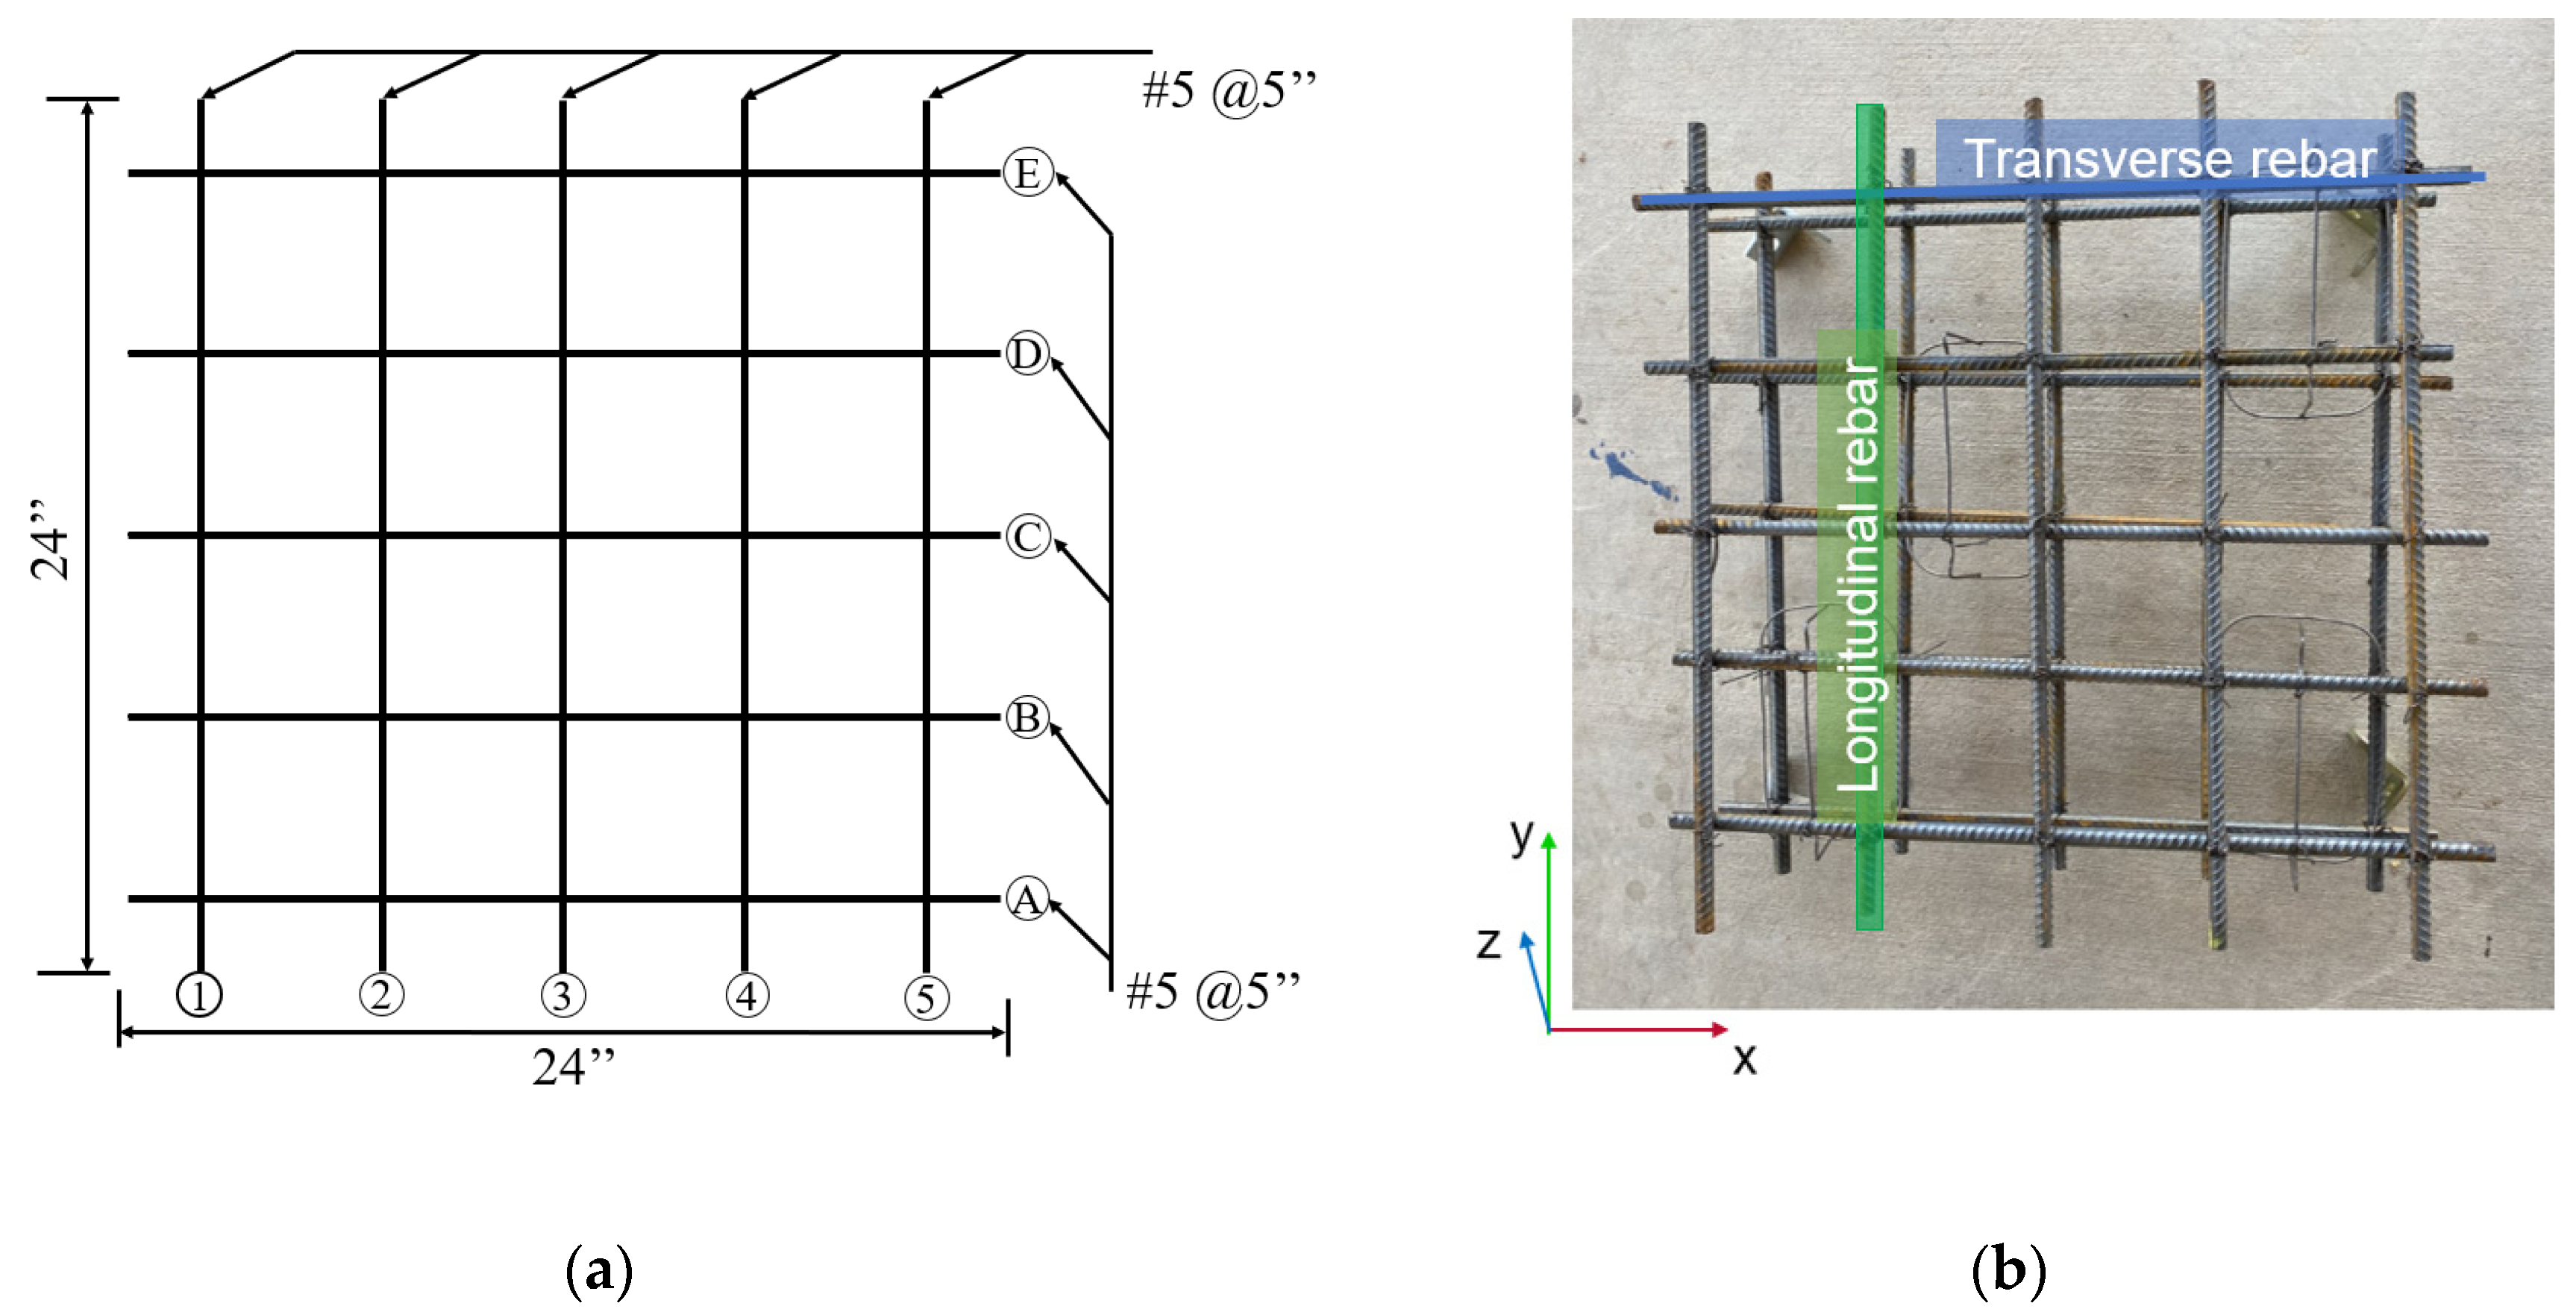
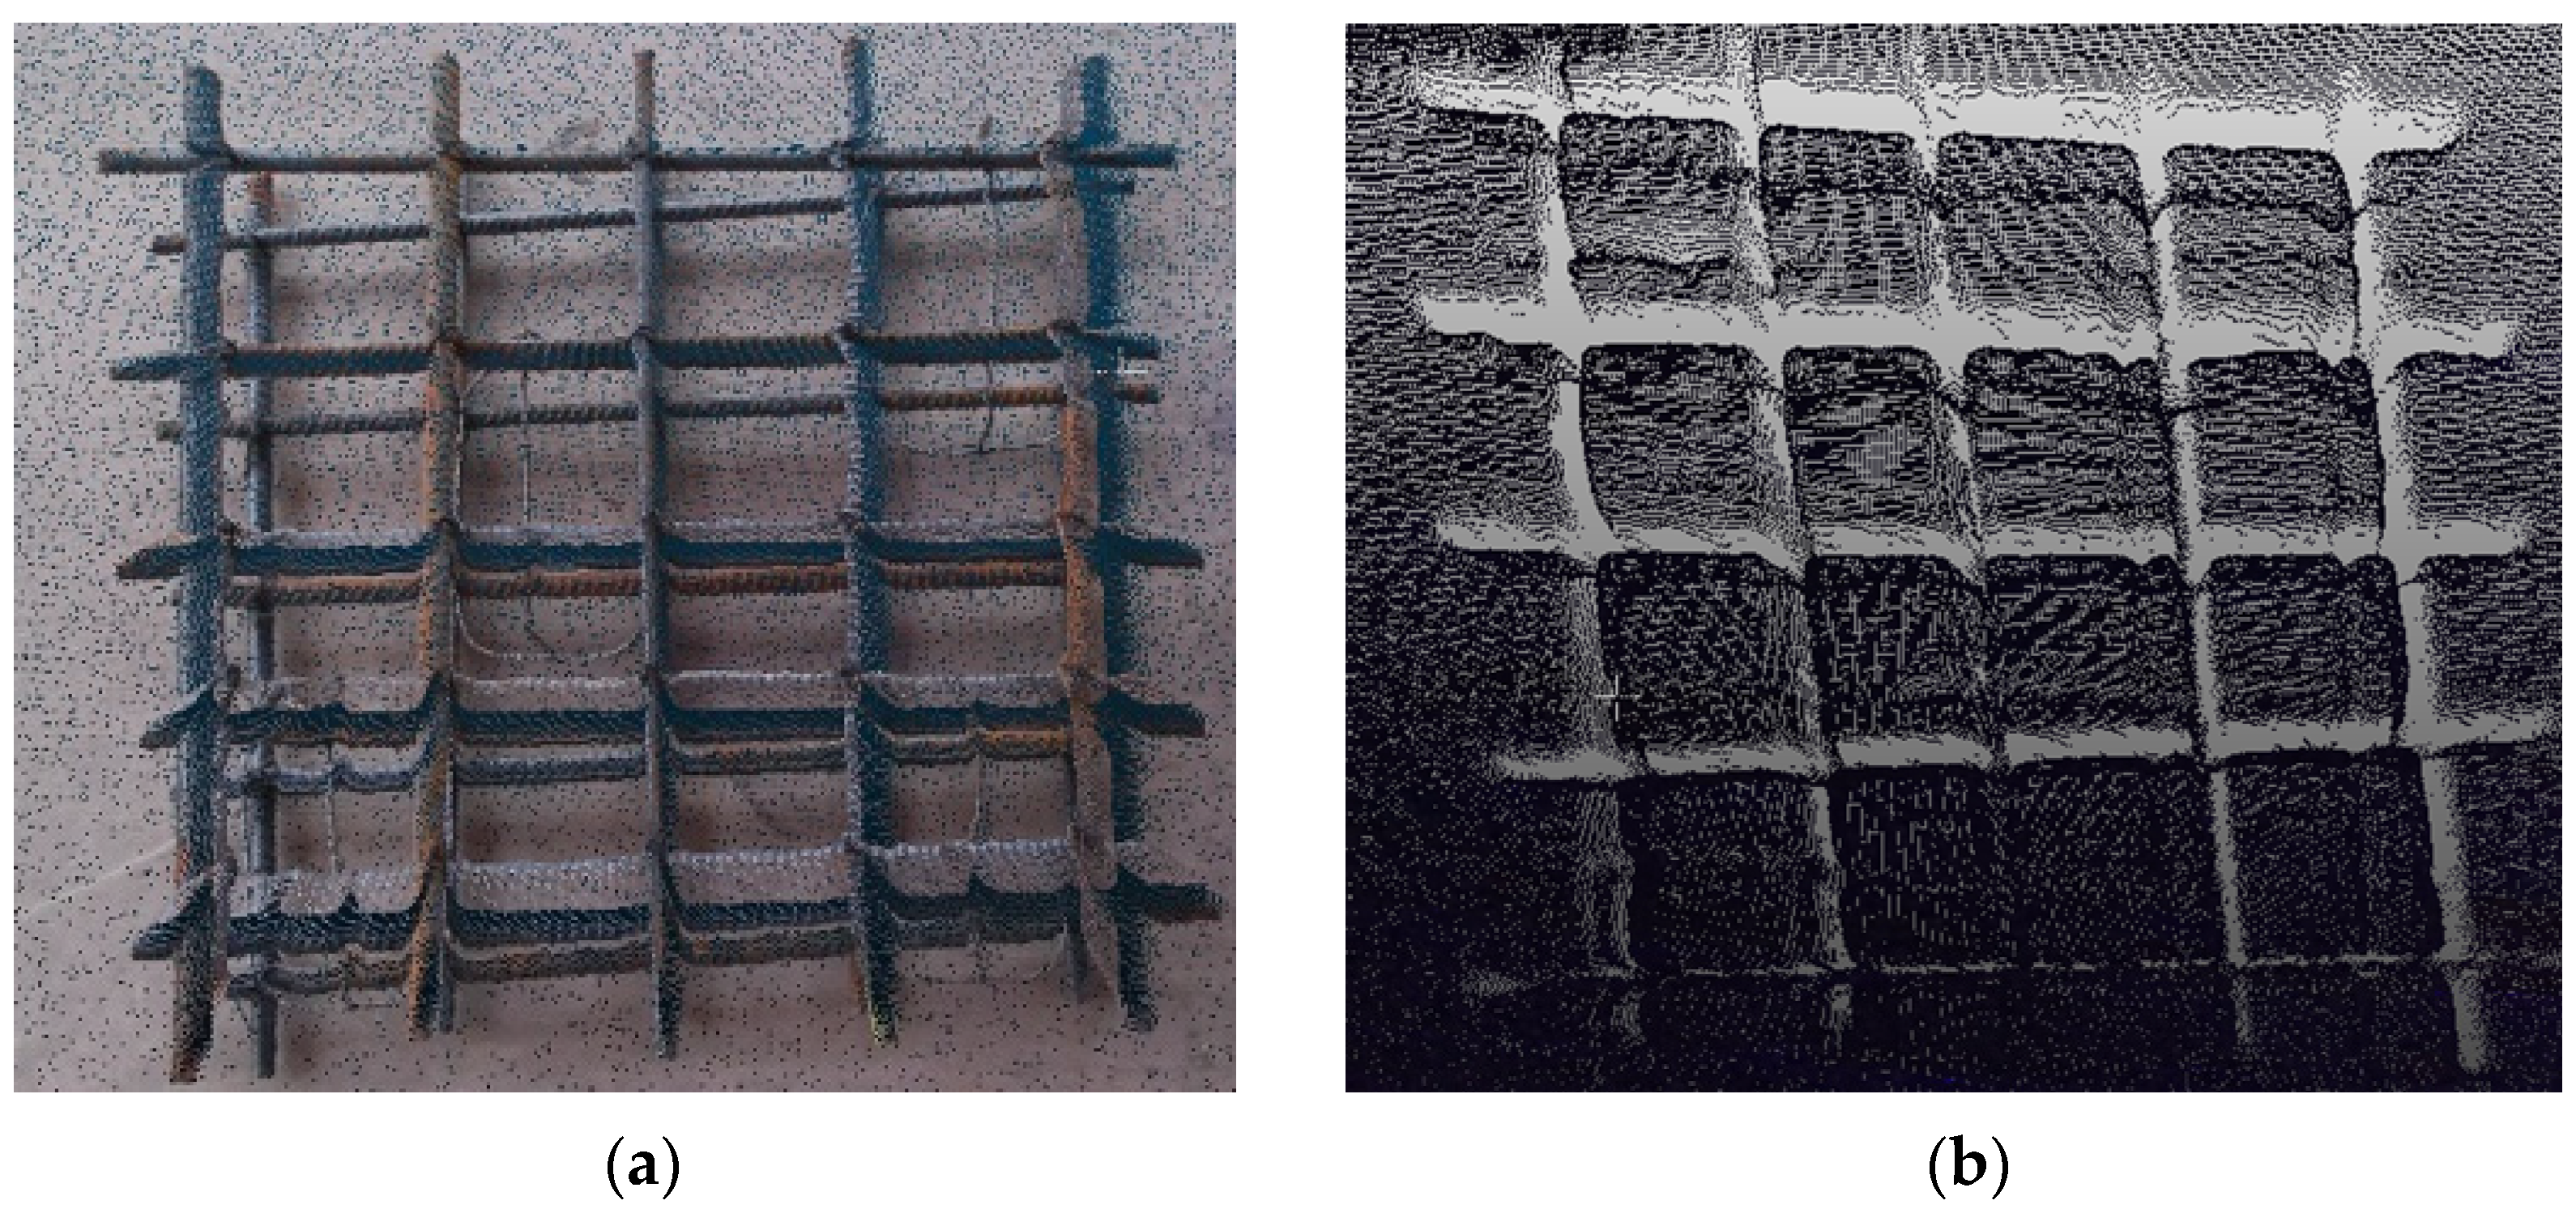
4.1. Rebar Specimen Description

To validate the proposed rebar detection and the performance of the RGB-D sensor, a two-layer rebar mat was constructed in the laboratory to simulate the actual structural construction setting in the field. The testbed was designed to simulate an RC structure with the dimensions of 27 inches (685.8 mm) × 27 inches (685.8 mm) × 9 inches (228.6 mm). The rebar cage inside the RC structure has a size of 24 inches (609.6 mm) (length) × 24 inches (609.6 mm) (width) × 5 inches (127 mm) (height), as shown in Figure 8. Figure 8 (a) is the blueprint of the simulated rebar cage. The spacing for all bays for both layers of the #5 rebar is 5 inches (127 mm). Figure 8 (b) shows the finished rebar cage.
The experimental setup is shown below. The spacemen are a two-layer rebar cage; the data acquisition devices are the Azure Kinect and a laptop. A light meter was used during the experiment to test the light conditions.
The scan range of the Azure Kinect is based on the setting, as shown in the table below. In this study we evaluated the rebar location information holding the device 50 cm away from the rebar cage. RGB-D images were captured and then depth images transferred to point cloud data that contains x, y, z coordinates, and RGB color values. To compare the RGB-D sensor detection ability with traditional manual tape measurement, the reference measurements of the rebar spacing of each bay were measured manually with steel tape. Table 2 below is the operation ranges for the RGB-D sensor used in this study. Depth camera of RGB-D sensor supports 4 operating modes: NFOV unbinned, NFOV 2 × 2 Binned, WFOV 2 × 2 Binned, and WFOV unbinned. Since the object of this study is a rebar mat which has wider view and low elevation value, we choose WFOV unbinned mode for high resolution.
Figure 9 shows the key elements for the rebar inspection using RGB-D sensor in the experimental setup: rebar cage as the testing specimen; Azure Kinect RGB-D as the sensor; laptop for controlling the data collection using the Azure Kinect RGB-D sensor (required); and light meter to explore the effect of different light condition.
The authors experimented in an outdoor environment to evaluate the performance of the RGB-D sensor for close-range targets. The image acquisition process was repeated three times in various lighting conditions. Researchers measured the luminous flux using the light meter from URCERI. The result shows the indoor light condition has the best quality because of no shadow. Because of the IR emitter, this device can also work at night and obtain the point-cloud model of the rebar cage. Figure 10 below shows the point-cloud model of the rebar cage under indoor light and night.
The authors chose the rebar model under the indoor light condition for less noise and higher accuracy as the data for further analysis. The RGB-D frame was converted from a video format to the point-cloud model by the transformation example from Azure Kinect. We read the point-cloud model in CloudCompare software, filtered the data by the nearest neighbor method, and segmented the rebar model manually to the top and bottom layers. Before estimating rebar spacing, top layer rebar and bottom layer rebar point clouds were cleaned using the ‘pcdenoise’ function and we then implemented the rebar detection algorithm. Figure 11 and Figure 12 show the denoised rebar point-cloud model of the top and bottom rebar layers. Since the bottom layer was farther away from the RGB-D sensor, the bottom rear model has fewer points than the top layer.

4.2. Test Results

4.2.1. Rebar Spacing Estimation

Rebar cage point-cloud models were extracted from the recorded video files using the ‘k4a transformation depth image to point cloud’ function provided by Microsoft as part of the Azure Kinect developer tools [22]. This function operates by first manually defining the timestamp where frames are pulled from the color and depth channels. For each corresponding pair of depth and RGB images, the depth map was transformed to the geometry of the color camera, producing a single RGB-D frame.

Spacing Index

The slicing algorithm can capture the center of each cluster along a given axis of the point cloud, as shown in Figure 13. Figure 13a shows the rebar detection result along the X-axis for the top rebar layer. The five black dots represent the location of each transverse rebar. The black dots represent the center of each blue cluster inside the grey bin. This means in the slice 5–6-inch bin, the black dots are the locations of rebar A, B, C, D, and E in this slice. The deviation between each black dot demonstrates the spacing between two adjacent rebars, for the case shown in the Figure 13 below, spacing between A and B, B and C, C and D, and D and E will be calculated by the difference in the Y value of each black dot. In addition, each black dot has (x, y, z) 3D value; the z value is the average height of rebar A, B, C, D, and E. Similarly, in Figure 13b, we can obtain the (x, y, z) value of rebar 1, 2, 3, 4, and 5. The results show that the developed algorithm can automatically and rapidly obtain a comparable measurement to tape measurement using the portable, low-cost RGB-D sensor.
According to the results of the slicing algorithm, we can determine the spacing of rebars for each bay. Figure 14 shows the name of rebars and the name of bays to represent the subsection of each rebar for spacing measurement.
The RGB-D sensor calculated the spacing value compared with the designed value. The standard deviation of each subsection spacing was calculated using the equation below. The error E1 was calculated as the error between the RGB-D sensor measurement and each design spacing along the X-axis for the longitudinal rebars.
s t d = ( x i x ¯ ) 2 N 1
Table 3 shows the comparison of spacing between the RGB-D sensor measurement and the designed spacing. E1 is the spacing error for each bay. Since the point-cloud data around 3B4C and 4B5C are sparse and uneven, the rebar detection black dots are lower rather than in the middle of the rebar clouds. That is the reason why rebar spacing error E1 has a jump at 3A4B. The maximum E1 value is −1.10 inches (−27.96 mm), spacing between rebar B and C in bay 4B5C. The standard deviation for each rebar spacing shows the variation in rebar placement. The worst condition is rebar A to B with the standard deviation value of 0.19 inch (4.83 mm).
Similarly, Table 4 shows the spacing comparison of the RGB-D sensor measurement with the designed spacing along the Y-axis for longitudinal rebars. The maximum E2 is 0.53 inch (13.46 mm), located at bay 1D2E for rebar 1 and rebar 2. The standard deviation for each rebar spacing shows the rebar placement quality. The worst condition is rebar 2 and 3 with the value of 0.34 inch (8.64 mm). The spacing between rebar 2 and rebar 3 has more error than the designed spacing than other rebars; these uneven distributions of rebar placement will deduct the strength of the RC element.

Angle Index

The angle of rebar placement is another index for rebar quality, as we discussed in Section 3.3 The rebar incline angle problem can be evaluated as shown in Figure 15. The larger the angle α is, the greater the inclination of the rebar. When the spacing error for S 4 is the tolerance spacing error 0.5 inch, the tolerance angle α would be 1.19°. Therefore, if the angle is larger than 1.19° the rebar placement quality is not as good as required. The angle index can illustrate the quality condition of rebar placement.
Table 5 below contains the incline angle for each rebar. The positive angle is defined as rebar incline to up and right, and the negative angle is defined as the rebar decline to left and bottom. We can see the largest α for the transverse rebar is 2.99° for rebar B, incline to the top; the largest α for longitudinal rebar is 1.43° for rebar 2, incline to the right; and −2.60° for rebar 5, incline to the left. The incline conditions of rebar B, rebar 2, and rebar 5 make the spacing deviate more than the others.

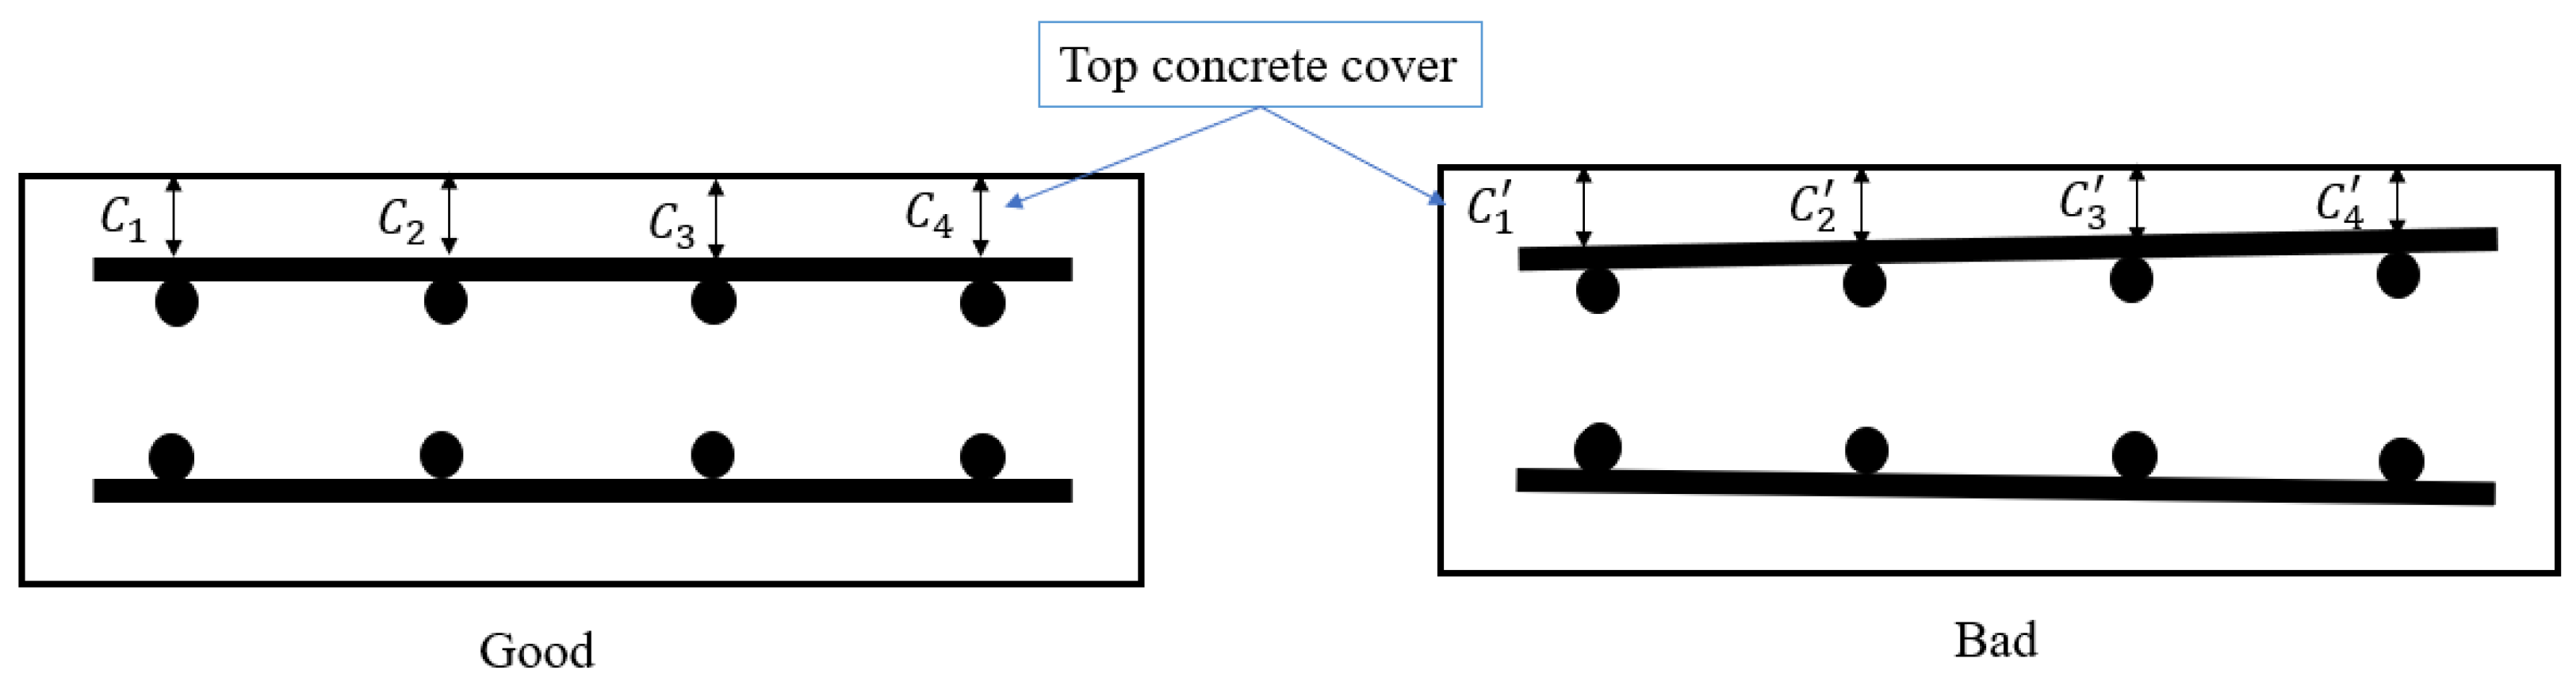
4.2.2. Concrete Cover Estimation

Concrete Cover Index

Rebar should be positioned low enough in the RC element because shrinkage and temperature cracks originate at the surface of the concrete. The testbed in this study is a slab with a concrete cover design of 1.5 inches (38.10 mm). In this study, the longitudinal rebar is on the outside of the top layer. Therefore, the top concrete cover is the difference between the designed concrete cover and longitudinal rebar outer surface, as Equation (2) shows.
Top concrete cover = 9 inch − longitudinal rebar outer surface
Figure 16 shows the rebar 3D elevation surface plot and Figure 17 shows the same rebar data in a 2D view.
Table 6 shows the comparison of concrete cover for the longitudinal rebar of the top layer. For each rebar, we read the z value of A, B, C, D, and E node and if the error is positive, it means the testbed has a higher concrete cover than designed; if the error is negative, then the testbed has a lack of concrete cover. According to Table 1, the concrete cover tolerance for the slab depth smaller than 12 inch is ± 3 8 inch, so all the errors larger than that mean bad quality. The maximum for concrete cover error is 0.38 inch, located at rebar 3 node E.

Concrete Cover Angle Index

If the uneven distribution of concrete cover is caused by the rebar vertical incline, there is a need to look at the vertical rebar incline angle β , as shown in Figure 18.
Table 7 below shows the angle of each rebar. If the elevation error for one rebar is the tolerance value 0.375 inch, the rebar is 24 inches, and the calculated elevation maximum acceptable angle would be 0.90°. Therefore, if the elevation angle absolute is larger than 0.90°, the quality for elevation placement does not match the specifications. Consequently, we can obtain the angle as a quality index, as shown in Table 7. The maximum angle for the transverse rebar is 0.93°, larger than the tolerance, so here is a dangerous point. The maximum angle for longitudinal rebar is 0.31°, which is smaller than the tolerance, so the longitudinal rebars have good placement quality for the elevation concrete cover.

4.3. Discussion

This section describes the experimental validation of the RGB-D sensor for rebar scanning and rebar detection. For practical considerations, researchers measured the experimental light conditions using the light meter from URCERI. The different experimental results show that the Azure Kinect has better precision and repeatability performance under a 153-lux lighting condition. This light and acceptable data collection range could be a limitation for using Azure Kinect for large-scale field rebar inspection. The effect of distance and lighting conditions when using the Azure Kinect sensor is recommended as being no longer than 3 m and use indoors or in an evenly light outdoor environment is also recommended. The advantages of using the Azure Kinect RGB-D sensor are that it is cost-effective, lightweight, and portable compared to the most common point-cloud data collection tool, LiDAR. The RGB-D sensor needs to warm up for 60 min to obtain a stable output. The results were processed on a standard desktop computer (Intel i7 6700k, 4.00 GHz CPU, 16 GB RAM, and 500 GB SSD [26]). The processing time required varied for different scan sizes. Approximate ranges of time requirements for each step are shown in Table 8 below. All the time can be thought of as the “worst-case” as there is a potential for computational speed improvements at various steps. The total time needed for the data collection and processing will be around 80.08 min to 165.5 min, which is less than 3 h.

5. Conclusions

In this study we assessed the effect of a low-cost RGB-D sensor for rebar location identification. We studied the rebar spacing and elevation position quality inspection, and future work will include rebar diameter inspection. Firstly, the authors conducted four experiments to evaluate the new Azure Kinect RGB-D sensor thoroughly. Then, a slicing algorithm was developed to detect the location of the rebar from the digital twin’s model. Finally, researchers compared the measurement results collected by the RGB-D sensor with the rebar spacing as a designed value. The comparison results between the RGB-D sensor have a maximum standard deviation of 0.19 inch for the X-axis and a maximum standard deviation of 0.34 inch for the Y-axis, which shows the placement quality and sustainability of rebar placement. In summary, this paper demonstrates an automatic rebar detection algorithm using the Azure Kinect RGB-D sensor. The developed automated rebar detection technology using Azure Kinect is a promising tool to detect and post-process RC structure inspection in a manner that is cost-effective, non-defective, and safe.

Author Contributions

Conceptualization, F.M., M.H. and X.Y.; methodology, F.M. and X.Y.; software, validation, analysis, X.Y.; investigation, resources, data curation, writing—original draft preparation, F.M. and X.Y.; writing—review and editing, visualization, F.M. and M.H.; supervision, project administration, funding acquisition, F.M. All authors have read and agreed to the published version of the manuscript.

Funding

The authors of this paper acknowledge the support from the Department of Civil, Construction, and Environmental Engineering of the University of New Mexico; the Transportation Consortium of South-Central States (Tran-SET, grant ID: 2RKR3-2KR327); the New Mexico Consortium Grand Award No. 2SG80; and the New Mexico Department of Transportation (NMDOT) for providing funding to graduate students to conduct this research.

Institutional Review Board Statement

Not applicable.

Informed Consent Statement

Not applicable.

Data Availability Statement

Some or all data, models or code that support the findings of this study are available from the corresponding author upon reasonable request.

Acknowledgments

The authors would like to give thanks for the resources from the Center for Advanced Research and Computing (CARC) of the University of New Mexico. Additionally, the authors of this paper acknowledge the comments and suggestions from Richard Payne and Sreenivas Alampalli (Stantec).

Conflicts of Interest

The authors declare no conflict of interest.

References

  1. Lee, H.-M.; Lee, H.-S.; Min, S.-H.; Lim, S.; Singh, J.K. Carbonation-Induced Corrosion Initiation Probability of Rebars in Concrete With/Without Finishing Materials. Sustainability 2018, 10, 3814. [Google Scholar] [CrossRef] [Green Version]
  2. Gordon, C.; Akinci, B. Technology and process assessment of using LADAR and embedded sensing for construction quality control. In Proceedings of the Construction Research Congress 2005: Broadening Perspectives, San Diego, CA, USA, 5–7 April 2005; pp. 1–10. [Google Scholar]
  3. Li, F.; Kim, M.-K.; Lee, D.-E. Geometrical model based scan planning approach for the classification of rebar diameters. Autom. Constr. 2021, 130, 103848. [Google Scholar] [CrossRef]
  4. Frangopol, D.M.; Liu, M. Maintenance and management of civil infrastructure based on condition, safety, optimization, and life-cycle cost∗. Struct. Infrastruct. Eng. 2007, 3, 29–41. [Google Scholar] [CrossRef]
  5. Kwon, K.; Kim, D.; Kim, S. Cutting Waste Minimization of Rebar for Sustainable Structural Work: A Systematic Literature Review. Sustainability 2021, 13, 5929. [Google Scholar] [CrossRef]
  6. Han, K.; Gwak, J.; Golparvar-Fard, M.; Saidi, K.; Cheok, G.; Franaszek, M.; Lipman, R. Vision-based field inspection of concrete reinforcing bars. In Proceedings of the 13th International Conference on Construction Applications of Virtual Reality, London, UK, 30–31 October 2013. [Google Scholar]
  7. Li, V. Engineered Cementitious Composites (ECC): Bendable Concrete for Sustainable and Resilient Infrastructure; Springer: Berlin, Germany, 2019; pp. 2–14. [Google Scholar]
  8. American Concrete Institute. ACI 117-10: Specification for Tolerances for Concrete Construction and Materials; American Concrete Institute: Farmington Hills, MI, USA, 2015. [Google Scholar]
  9. Reinforcing Steel Placing Tolerance. Available online: https://www.irebar.com/USPlacingTolerances.html (accessed on 10 November 2021).
  10. Kim, M.-K.; Thedja, J.P.P.; Wang, Q. Automated dimensional quality assessment for formwork and rebar of reinforced concrete components using 3D point cloud data. Autom. Constr. 2020, 112, 103077. [Google Scholar] [CrossRef]
  11. Wang, Q.; Cheng, J.C.; Sohn, H. Automated estimation of reinforced precast concrete rebar positions using col-ored laser scan data. Comput.–Aided Civ. Infrastruct. Eng. 2017, 32, 787–802. [Google Scholar] [CrossRef]
  12. Yuan, X.; Smith, A.; Sarlo, R.; Lippitt, C.D.; Moreu, F. Automatic evaluation of rebar spacing using LiDAR data. Autom. Constr. 2021, 131, 103890. [Google Scholar] [CrossRef]
  13. BahooToroody, F.; Khalaj, S.; Leoni, L.; De Carlo, F.; Di Bona, G.; Forcina, A. Reliability Estimation of Reinforced Slopes to Prioritize Maintenance Actions. Int. J. Environ. Res. Public Health 2021, 18, 373. [Google Scholar] [CrossRef]
  14. Di Bona, G.; Forcina, A.; Falcone, D.; Silvestri, L. Critical Risks Method (CRM): A New Safety Allocation Approach for a Critical Infrastructure. Sustainability 2020, 12, 4949. [Google Scholar] [CrossRef]
  15. Feng, C.W.; Chen, C.W. Using BIM and MR to improve the process of job site construction and inspection. WIT Trans. Built Environ. 2019, 192, 21–32. [Google Scholar]
  16. Yi, T.; Li, H.; Gu, M. Full-scale measurements of dynamic response of suspension bridge subjected to environmental loads using GPS technology. Sci. China Ser. E Technol. Sci. 2010, 53, 469–479. [Google Scholar] [CrossRef]
  17. Mahmoudzadeh, A.; Yeganeh, S.F.; Arezoomand, S.; Golroo, A. 3D Pavement Surface Reconstruction Using An RGB-D Sensor. Proceedings 2019, 42, 47. [Google Scholar] [CrossRef] [Green Version]
  18. Zhu, Z.; Donia, S. Potentials of RGB-D Cameras in As-Built Indoor Environment Modeling. Comput. Civil Eng. 2013, 605–612. [Google Scholar] [CrossRef]
  19. Kim, H.; Lee, S.; Ahn, E.; Shin, M.; Sim, S.H. Crack identification method for concrete structures considering angle of view using RGB-D cam-era-based sensor fusion. Struct. Health Monit. 2021, 20, 500–512. [Google Scholar] [CrossRef]
  20. Koppula, H.S.; Anand, A.; Joachims, T.; Saxena, A. Semantic labeling of 3d point clouds for indoor scenes. Advances in neural information processing systems. Nips 2011, 2, 6. [Google Scholar]
  21. Kinect, D.K.A. Microsoft, Redmond, WA, US. Documentation Microsoft Docs. (n.d.) Available online: https://docs.microsoft.com/en-us/azure/kinect-dk/ (accessed on 14 June 2021).
  22. Bassier, M.; Van Genechten, B.; Vergauwen, M. Classification of sensor independent point cloud data of building objects using random forests. J. Build. Eng. 2019, 21, 468–477. [Google Scholar] [CrossRef]
  23. Tölgyessy, M.; Dekan, M.; Chovanec, Ľ.; Hubinský, P. Evaluation of the Azure Kinect and Its Comparison to Kinect V1 and Kinect V. Sensors 2021, 21, 413. [Google Scholar] [CrossRef] [PubMed]
  24. Chen, S.; Truong-Hong, L.; O’Keeffe, E.; Laefer, D.F.; Mangina, E. Outlier detection of point clouds generating from low-cost UAVs for bridge inspection. In Proceedings of the Life-Cycle Analysis and Assessment in Civil Engineering, Ghent, Belgium, 28–31 October 2018. [Google Scholar]
  25. Bossio, A.; Lignola, G.P.; Fabbrocino, F.; Monetta, T.; Prota, A.; Bellucci, F.; Manfredi, G. Nondestructive assessment of corrosion of reinforcing bars through surface concrete cracks. Struct. Concr. 2017, 18, 104–117. [Google Scholar] [CrossRef]
  26. Intel Corporation (intel.com), Santa Clara, CA, US. Available online: https://www.intel.com/content/www/us/en/homepage.html (accessed on 10 November 2021).
Figure 1. Illustration of the reinforcement concrete structure: (a) rebar spacing; (b) concrete cover.
Sustainability 13 12509 g001
Figure 2. Flowchart of proposed formwork.
Sustainability 13 12509 g002
Figure 3. RGB-D sensor (Azure Kinect) and origin position of x+, y+, and z+ axis, from where the data points are defined.
Sustainability 13 12509 g003
Figure 4. Azure Kinect sensor playback view of data acquisition procedure.
Sustainability 13 12509 g004
Figure 5. Rebar detection algorithm procedure.
Sustainability 13 12509 g005
Figure 6. Illustration of rebar spacing and angle inconsistencies: (a) illustration of good placement of rebar with consistent spacing; (b) illustration of good placement of rebar with zero angle; (c) illustration of bad placement of rebar showing inconsistent spacing; (d) illustration of bad rebar placement showing non-zero angle.
Sustainability 13 12509 g006
Figure 7. Illustration of concrete cover estimation.
Sustainability 13 12509 g007
Figure 8. Experimental configuration: (a) rebar cage design and (b) assembled rebar cage.
Sustainability 13 12509 g008
Figure 9. Experimental data collection setup.
Sustainability 13 12509 g009
Figure 10. Rebar cage point-cloud model: (a) indoor light (153 lux); (b) night scan (0 lux).
Sustainability 13 12509 g010
Figure 11. Top layer rebar model in Matlab.
Sustainability 13 12509 g011
Figure 12. Bottom layer rebar model in Matlab.
Sustainability 13 12509 g012
Figure 13. Rebar detection results of top layer: (a) along X-axis; (b) along Y-axis.
Sustainability 13 12509 g013
Figure 14. Rebar and subsection spacing nomination.
Sustainability 13 12509 g014
Figure 15. Rebar incline angle calculation.
Sustainability 13 12509 g015
Figure 16. Rebar 3D elevation surface plot of rebar cage.
Sustainability 13 12509 g016
Figure 17. Rebar 2D view of elevation surface plot of rebar cage.
Sustainability 13 12509 g017
Figure 18. Rebar vertical clearance.
Sustainability 13 12509 g018
Table 1. Reinforcement concrete structure inspection allowable checklists [8].
ItemsSymbolAllowable Tolerance
Rebar spacings±0.5 inch (±12.7 mm)
Concrete coverc±3/8 inch (±9.5 mm) for concrete slab depth ≤12 inch (304.8 mm)
±1/2 inch (±12.7 mm) for concrete slab depth >12 inch (304.8 mm)
Table 2. RGB-D sensor operating ranges.
ModeNFOV
Unbinned
NFOV
2 × 2 Binned
WFOV
2 × 2 Binned
WFOV
Unbinned
Operating range (m)0.5–3.860.5–5.460.25–2.880.25–2.21
NFOV: narrow field of view; WFOV: wide field of view.
Table 3. Comparison of the RGB-D sensor measurement with the designed spacing along the X-axis.
Transverse
Rebar
SpacingSensor
(inch)
Designed
(inch)
Error (E1)
(inch)
A–B1A2B4.845.00−0.16
2A3B4.765.00−0.24
3A4B4.405.00−0.60
4A5B4.645.00−0.36
std0.1900.19
B–C1B2C4.095.00−0.91
2B3C4.065.00−0.94
3B4C4.045.00−0.96
4B5C3.905.00−1.10
std0.0800.08
C–D1C2D4.695.00−0.31
2C3D4.815.00−0.19
3C4D4.965.00−0.04
4C5D4.935.00−0.07
std0.1200.12
D–E1D2E4.985.00−0.02
2D3E4.785.00−0.22
3D4E4.615.00−0.39
4D5E4.705.00−0.30
std0.1600.16
Table 4. Comparison of the RGB-D sensor measurement with the designed spacing along the Y-axis.
Longitudinal RebarSpacingSensor
(inch)
Designed
(inch)
E2
(inch)
1–21A2B5.095.000.09
1B2C5.175.000.17
1C2D5.405.000.40
1D2E5.535.000.53
std0.2000.20
2–32A3B5.225.000.22
2B3C4.785.00−0.22
2C3D4.645.00−0.36
2D3E4.425.00−0.58
std0.3400.34
3–43A4B4.655.00−0.35
3B4C4.665.00−0.34
3C4D4.735.00−0.27
3D4E4.775.00−0.23
std0.0600.06
4–54A5B5.365.000.36
4B5C5.385.000.38
4C5D5.405.000.40
4D5E5.415.000.41
std0.0200.02
Table 5. Incline angle of each rebar.
Transverse Rebar α (°)Longitudinal Rebar α (°)
A1.6411.09
B2.9921.43
C2.733−1.12
D1.914−1.67
E2.455−2.60
Table 6. Comparison of concrete cover between sensor measured value and designed value.
Rebar C t _ s e n s o r
(inch)
C t
(inch)
E c t
(inch)
Rebar C t _ s e n s o r
(inch)
C t o
(inch)
E c t
(inch)
1A1.571.50−0.074A1.441.500.06
B1.531.50−0.03B1.491.500.01
C1.431.500.07C1.421.500.08
D1.451.500.05D1.141.500.36
E1.491.500.01E1.151.500.35
std0.0600.06      std0.1700.17
2A1.531.50−0.035A1.541.50−0.04
B1.501.500.00B1.551.50−0.05
C1.421.500.08C1.531.50−0.03
D1.371.500.13D1.581.50−0.08
E1.321.500.18E1.611.50−0.11
std0.0900.09      std0.0300.03
3A1.511.50-0.01
B1.351.500.15
C1.131.500.37
D1.171.500.33
E1.121.500.38
std0.1700.17
Table 7. Elevation incline angle of each rebar.
Transverse Rebar β (°)Longitudinal Rebar β (°)
10.19A−0.07
20.50B0.05
30.93C0.24
40.69D0.31
5−0.17E0.29
Table 8. Computational time requirements.
Rebar Scanning5–30 s
Point-cloud data format transformation10–15 min
Point-cloud data preprocessing1–2 h
Rebar detection10–30 min
Total time80.08–165.5 min
Publisher’s Note: MDPI stays neutral with regard to jurisdictional claims in published maps and institutional affiliations.

