Article

Health Risk Assessment, Pore Water Chemistry, and Assessment of Trace Metals Transfer from Two Untreated Sewage Sludge Types to Tomato Crop (Lycopersicon esculentum) at Different Application Levels

1
Institute of Soil and Environmental Sciences, University of Agriculture Faisalabad, Faisalabad 38000, Pakistan
2
Soil and Water Testing Laboratory for Research, Bahawalpur 63100, Pakistan
3
Department of Environmental Sciences, Government College University, Faisalabad 38000, Pakistan
4
College of Plant Science and Technology, Huazhong Agricultural University, Wuhan 430070, China
5
Department of Marine Biology, Faculty of Marine Sciences, King Abdualaziz University, Jeddah 21589, Saudi Arabia
6
Biology Department, Faculty of Science, Tabuk University, Tabuk 71421, Saudi Arabia
7
Department of Biological Sciences and Technology, China Medical University, Taichung 40402, Taiwan
*
Authors to whom correspondence should be addressed.
Sustainability 2021, 13(22), 12394; https://doi.org/10.3390/su132212394
Submission received: 27 September 2021 / Revised: 30 October 2021 / Accepted: 4 November 2021 / Published: 10 November 2021

Abstract

:
The application of untreated sewage sludge to cropland in water-deficient areas is common practice. A study was conducted to investigate the transfer of trace elements from sewage sludge to tomato crop and the potential health risk to humans. Two types of sewage sludge, ISS (I-9 Sector wastewater treatment plant, Islamabad) and WSS (Water and Sanitation Authority wastewater treatment plant, Faisalabad), were applied at 0.5%, 1.0%, and 1.5% w/w and compared with control (without any amendment). The test crop was tomato (Lycopersicon esculentum). Results revealed that the ECe of soil was increased by these treatments with respect to all application levels. The levels of Pb (lead) and Zn (Zinc) solubility in soil were increased about 46- and 28-fold by the application of ISS at 1.5% and 16- and 22-fold by the application of WSS at 1.5%, respectively. The highest shoot biomass was recorded with 0.5% level of WSS, while higher rates (1.0% and 1.5%) of both ISS and WSS showed significant (p < 0.001) decline in shoot biomass production, and the lowest SFW was recorded with the addition of ISS at 1.5% application rate (a significant reduction of 44%) compared to control. The pore water analysis and correlation depicted that dissolved organic carbon (DOC) controlled the release of Zn and Pb. The PLI (value < 1) indicated that the overall pollution of trace metals in the investigated samples was absent, but the Igeo and CF showed the contamination potential for Cd, Cu, and Ni was moderate to strong. DIM and HRI analysis suggested that the tomato was safe for human consumption. The HRI values for all trace metals were below the permissible limit (HRI = 1) described by USEPA-IRIS. It was concluded that a lower rate of both sewage sludge types produces more biomass and less accumulation of trace metals in the test crop.

1. Introduction

Disposal of wastes and pollutants generated by human activities directly into the environment is posing a serious threat to the ecosystem. For instance, domestic waste, sewage treatment plants, the production of crude matter, general services, and many other human activities are polluting various environmental compartments. Therefore, it has become imperative for researchers to tackle this problem since many of the chemical and biological properties of these wastes can result in serious risks to human health, croplands, and the environment [1]. Recycling and reusing the waste materials is arguably an environmentally and economically sustainable option. However, investigations of environmental implications of a particular waste prior to its recycling/reusing are of critical importance.
Sewage sludge (SS) is known to be rich in essential nutrients (nitrogen and phosphorus), organic matter [2,3,4], and trace elements that are beneficial for plant growth and better yield [5,6]. Moreover, the study of using sewage sludge in agriculture ought to identify its role in reducing the costs of production and improving the environment and the impact on the quality of life of the communities involved. However, some trace elements that are present in high amounts in SS could be dangerous to the food web and human health [7]. Pakistan is a developing country and has no functional secondary and tertiary SS treatment plants. Farmers are applying primary sewage sludge without authenticated doses and rates, and this problem is increasing rapidly as the amount of daily sewage sludge generation is increasing due to the increase in urbanization and industrialization through the China–Pakistan Economic Corridor (CPEC) [8]. The release of trace elements from SS is dependent on many factors such as solution pH, dissolved organic matter, metal fraction, and redox potential. Under certain conditions, such as the alteration of pH with the addition of sewage sludge, these trace elements may accumulate to toxic concentration levels, which may lead to ecological damage [9]. Methods used to evaluate the ecological risk posed by trace elements in plants and humans include calculation of the index of geoaccumulation [10], the daily intake of metals (DIM), and the potential health risk index (HRI) [11].
Tomato (Lycopersicon esculentum) is one of the most important vegetable crops and grown and consumed worldwide. Tomatoes are consumed fresh and in cooked form. Tomato crops require nitrogen, phosphorus, and potassium nutrients for their growth. Many studies have been performed on the evaluation of the land application of sewage sludge considering a single metal, but there is a need to study the accumulation of different trace metals in tomato crops as a result of the effect of sewage sludge. Therefore, the present study was designed to assess the effect of two locally generated sewage sludges from different sources in Pakistan on the release and transfer of different trace elements from the sludge–soil–plant system and to evaluate the health risk assessment using different health risk indices.

2. Materials and Methods

2.1. Soil and Sewage Sludge Collection and Characterization

The soil in bulk (upper 30 cm) was collected from the field area of the Institute of Soil and Environmental Sciences, University of Agriculture Faisalabad (UAF). The soil was air-dried, ground, appropriately mixed, and passed through a 2 mm sieve. The soil was analyzed in Soil and Water Chemistry Laboratory, Institute of Soil and Environmental Sciences, UAF, for electrical conductivity (ECe); pHs; cation exchange capacity (CEC); textural classification; and soluble Ca2+ + Mg2+, CO32−, HCO3, and Cl at the start of the experiment. The sewage sludge samples were collected from the I-9 Sector wastewater treatment plant, Islamabad (ISS), and the Faisalabad Water and Sanitation Authority wastewater treatment plant (WSS). The samples of sewage sludge were dried, ground, and subjected to physicochemical analyses.

2.2. Experimental Setup

The experiment was conducted in the polyethylene tunnel at the Institute of Horticultural Sciences, UAF, from December 2014 to April 2015 in earthen pots of 30 cm diameter and 30 cm depth. Three levels of application of both types of sewage sludge (0.5%, 1.0%, and 1.5% w/w) were applied and compared to the control (without any amendment). The sewage sludge was mixed in the soils thoroughly to make a homogenized mixture. The hybrid “Sahel” tomato (Syngenta Seeds Inc., Hennepin County, MI, USA) was selected owing to its high-yielding and late-bolting properties. The seedlings of the aforementioned tomato plants were established in the nursery beds. Seedlings 15–25 cm tall with 3–5 true leaves were transplanted into the earthen pots. Before transplanting, the seedlings were hardened by gradually reducing the frequency of irrigation and exposing the seedlings to strong sunlight. The seedlings were watered on the day before transplanting, and transplantation was performed late in the afternoon to curtail the transpiration of the seedlings. The soil around the roots of the shifted plants was well pressed to ensure good contact with the roots, and the plants were irrigated immediately. The recommended dose of chemical fertilizer (NPK: 46–60–25 kg acre−1) was applied. For better results, the full quantity of P and half quantities of N and K were applied before the transplanting of seedlings. The remaining N and K were applied 6–8 weeks after transplanting. The harvesting of tomato fruits was done three times during the crop growth period.

2.3. Plant Harvesting and Analyses

Root and shoot lengths were measured with a calibrated meter rod. For analysis of trace elements in roots, shoots, and fruits, samples were air-dried, crushed, and passed through a sieve of 2 mm mesh size. A 1 g air-dried sample of each was digested in 25 mL of the di-acid mixture (HNO3:HClO4, 3:1) following the method described by [12]. After complete digestion, the solution was filtered, and the filtrate was analyzed separately for trace metals using an atomic absorption spectrophotometer (Thermo Electron AA, Solar-Series, Waltham, MA, USA).
After the harvest, soil samples collected separately from control, 0.5%, 1.0%, and 1.5% sewage sludge amended pots were air-dried, crushed, passed through a sieve of 2 mm mesh size, and then stored separately for further analyses. Soil samples were analyzed for ECe; pHs; and soluble Ca2+ + Mg2+, CI, CO32−, and HCO3 by following the methods described by [12]. For analysis of trace elements in soil samples, a similar method as described for root, shoot, and fruit analysis was performed. The data collected were subjected to one-way analysis of variance (ANOVA) using SPSS software.

2.4. Daily Intake of Metals (DIM)

The DIM was calculated using the following equation:
DIM = C metal × C factor × D foodintake B average   weight
where Cmetal, CFactor, Dfood intake, and Baverage weight are concentrations of trace metals in tomato (mg kg−1), conversion factor, daily intake of tomato, and average body weight, respectively. The conversion factor used to convert fresh green vegetable weight to dry weight was 0.085, as described by [13,14]. The average vegetable consumption as recommended by WHO is 0.4 kg person−1 day−1 [15]. The average body weight of individuals in Pakistan is 54.40 kg [16].

2.5. Potential Health Risk Index (HRI)

The HRI is a measure of health risk level associated with exposure to toxic trace metals. The estimated potential health risk due to the ingestion of tomato was calculated using the United States Environmental Protection Agency (USEPA) hazard quotient. HRI < 1 means the exposed population is assumed to be safe.
HRI = DIM R f D
where DIM and RfD represent daily intake of metal through the vegetables (kg/day) and oral reference dose for the metal (mg/kg of body weight/day), respectively. Reference oral doses for Cd, Cu, Pb, and Zn are 0.001, 0.04, 0.004, and 0.33, respectively [17].

2.6. Pore Water Collection and Analyses

Pore water testers with a pore size less than 0.2 μm were buried in every pot at 10 cm above the bottom of the pot. These sample collectors were composed of a hydrophilic polymer (porous) tube (typical pore diameter 0.1 μm) attached to a polyvinyl chloride tube [1,18,19]. The pore water was collected at the time 0 and then after at 20, 40, 60, 80, 100, and 120 days to determine dissolved organic carbon (DOC) [20], pH, EC, Cd, Cu, Pb, and Zn.

2.7. Geoaccumulation Index (Igeo)

The Igeo, introduced by [21], enables the assessment of environmental contamination induced by anthropogenic activity. The equation was originally developed for sediments, but this has been extended for agricultural soils [22]. In this study, Igeo for SS application activity was computed using the following equation:
I g e o = l o g 2 ( C n 1.5 B n )
where Cn is the measured concentration of each trace metal found in the soil of each treatment (mg/kg) and Bn is the geochemical background value of the trace metals found in the soil (mg/kg), which is adopted by [23]. The constant 1.5 is used due to potential variations in the baseline data [24].

2.8. Contamination Factor (CF)

The CF is a quantification of the degree of contamination relative to either the average crustal composition of a respective metal or to the measured background values from geologically similar and uncontaminated areas. The CF reflects the anthropogenic input of a single element in soil [25].
C F = C m B m
where Cm is the mean concentration, while Bm is the background concentration of metal either from literature (average crustal abundance) or directly determined from a geologically similar area [26].

2.9. Pollution Load Index (PLI)

The pollution load index (PLI) for a set of n polluting elements is defined as a value calculated from the geometric mean of the contamination factors of those elements. PLI is calculated by the following expression given by [27]:
P L I = [ π n i ( C f ) ] 1 n
where CF is the contamination factor of each metal obtained by the ratio of the concentration of each metal in soil to that of the metal in background soil or groundwater, π is the geometrical mean operator, and n is the number of metals investigated in each sample

2.10. Quality Assurance

All chemicals used in this study were chromatographically pure (purity of about 99.5%). All laboratory consumables and centrifuge tubes were dipped in 20% nitric acid solution that was prepared with ultrapure water overnight and then flushed thoroughly with ultrapure water. All determinations were performed at controlled room temperature. A reference sample was run along with all samples to control the quality of results on the atomic absorption spectrophotometer (Solar S-100 Thermo electron, Middlesex County, MA, USA). The detection limit of the atomic absorption spectrophotometer was 0.01–16 ppm.

2.11. Statistical Analysis

The experiment was a completely randomized design (CRD) with treatment combinations arranged in a factorial manner with three replications. The applied treatment combination effects were estimated using a two-way analysis of variance [28]. The least significant difference test (p ≤ 0.005) was used for comparison among treatment means.

3. Results

3.1. Soil and Sewage Sludge Characterization

The physiochemical characteristics of the soil and sewage sludge used in this study are presented in Table 1. The EC of the soil was 3.67 dS m−1, while that of ISS and WSS was 6.46 and 5.08 dS m−1, respectively. Soil and WSS were slightly alkaline, while ISS was slightly acidic. Both of the sewage sludge types were rich in total organic carbon (17.29–18.58%), whereas the soil was severely deficient. The N, P, and K contents in soil were 0.08%, 0.67%, and 0.89%, respectively. The N, P, and K contents were 103%, 0.24%, and 0.27% in ISS and 0.41%, 0.15%, and 0.16% in WSS, respectively. Among the available trace metals, Cu and Zn were in the highest concentration in soil (61.60 mg kg−1), followed by Ni, Pb, and Cd. The contents of Zn in ISS and WSS were 831 and 203 mg kg−1, respectively, whereas the Ni contents were 123 and 187 mg kg−1, respectively. These results suggest that soil was contaminated with Cu, Zn, and Ni, while the sewage sludge samples were contaminated with Zn and Ni.

3.2. Changes in Physicochemical Properties of Experimental Soil

The physicochemical properties of postharvest soil are listed in Table 2. With respect to the control treatment, the application of both sewage sludges increased the values of pHs, ECe, and soil organic matter (SOM). In the case of WSS, the highest ECe (6.84 dS m−1) was recorded at the 1.0% level of application, whereas ISS at 0.5% presented the highest EC (6.81 dS m−1) as compared to control treatment. It was observed with both kinds of SS that soil pHs significantly (p < 0.05) increased with the increase in SS application rate (Table 2). The SOM contents of postharvest soil with the addition of WSS ranged from 0.43 to 0.65%, which gradually increased with increasing levels; with ISS application, SOM contents ranged from 0.32 to 0.73%. The maximum SOM (0.73%) was found with ISS at a high level (1.5%) as compared to the control treatment.

3.3. Trace Element Concentration in Postharvest Soils

The concentrations of trace elements in postharvest soil are shown in Table 3. There was a remarkable increase in concentrations of trace elements (Cu, Cd, Ni, Pb, and Zn) with the application of WSS as compared to ISS. With WSS, the highest concentration (5.27 mg kg−1) of total soil Cu (Cu) in postharvest soil was detected at 1.5% level as compared to control; in the case of ISS, maximum accumulation (6.89 mg kg−1) occurred at 1.5%. Addition of ISS significantly (p ≤ 0.005) promoted the concentration of Cd in the soil as compared to WSS. The maximum concentration of total Cd in postharvest soil was 3.65 and 0.88 mg kg−1 with the application of 1.5% ISS and WSS, respectively. The highest concentration of total Ni (5.43 mg kg−1) in postharvest soil was recorded with ISS at 1.5% level with respect to control; with WSS, Ni concentration ranged from 1.21 to 3.54 mg kg−1. Soil Pb concentration ranged from 0.55 to 1.57 mg kg−1 with the addition of WSS, whereas with ISS application, it ranged from 2.32 to 3.22 mg kg−1. The uppermost concentration (13.54 mg kg−1) of total Zn in postharvest soil was detected with ISS at 1.5% level as compared to control; on the other hand, with WSS application, the maximum concentration of Zn observed was 9.65 mg kg−1. Cu, Cd, Cu, Ni, Pb, and Zn concentrations in postharvest soils were significantly proportional to sludge levels.

3.4. Correlation Analyses

Correlations between the trace elements present in pore water solution and the DOC and solution pH were determined. Dissolved organic C showed a positive correlation with all trace elements under consideration (Cu, Cd, Pb, Ni, and Zn) and exhibited a strong positive correlation with Pb and Zn (R2 = 0.89 and 0.88). The relationships of trace metals (Cu, Cd, Pb, and Ni) with solution pH were negative but very weak (R2 = 0.18, 0.11, 0.31, and 0.21, respectively). Zn had a positive correlation with solution pH, but this was also a weak relation (R2 = 0.18).
The analyses of the correlations between the soil trace metals and the DOC and soil pH are presented in Table 4. DOC exhibited positive correlations with all the soil trace metals, whereas the solution pH showed negative correlations (with exception of Zn). Based on the R2 values, Pb and Zn showed significant positive correlations (R2 = 0.89 and 0.88, respectively) with DOC, while the rest of the trace metals did not correlate significantly. In contrast, the correlation of the solution pH with the soil trace metals was nonsignificant (R2 < 0.31).

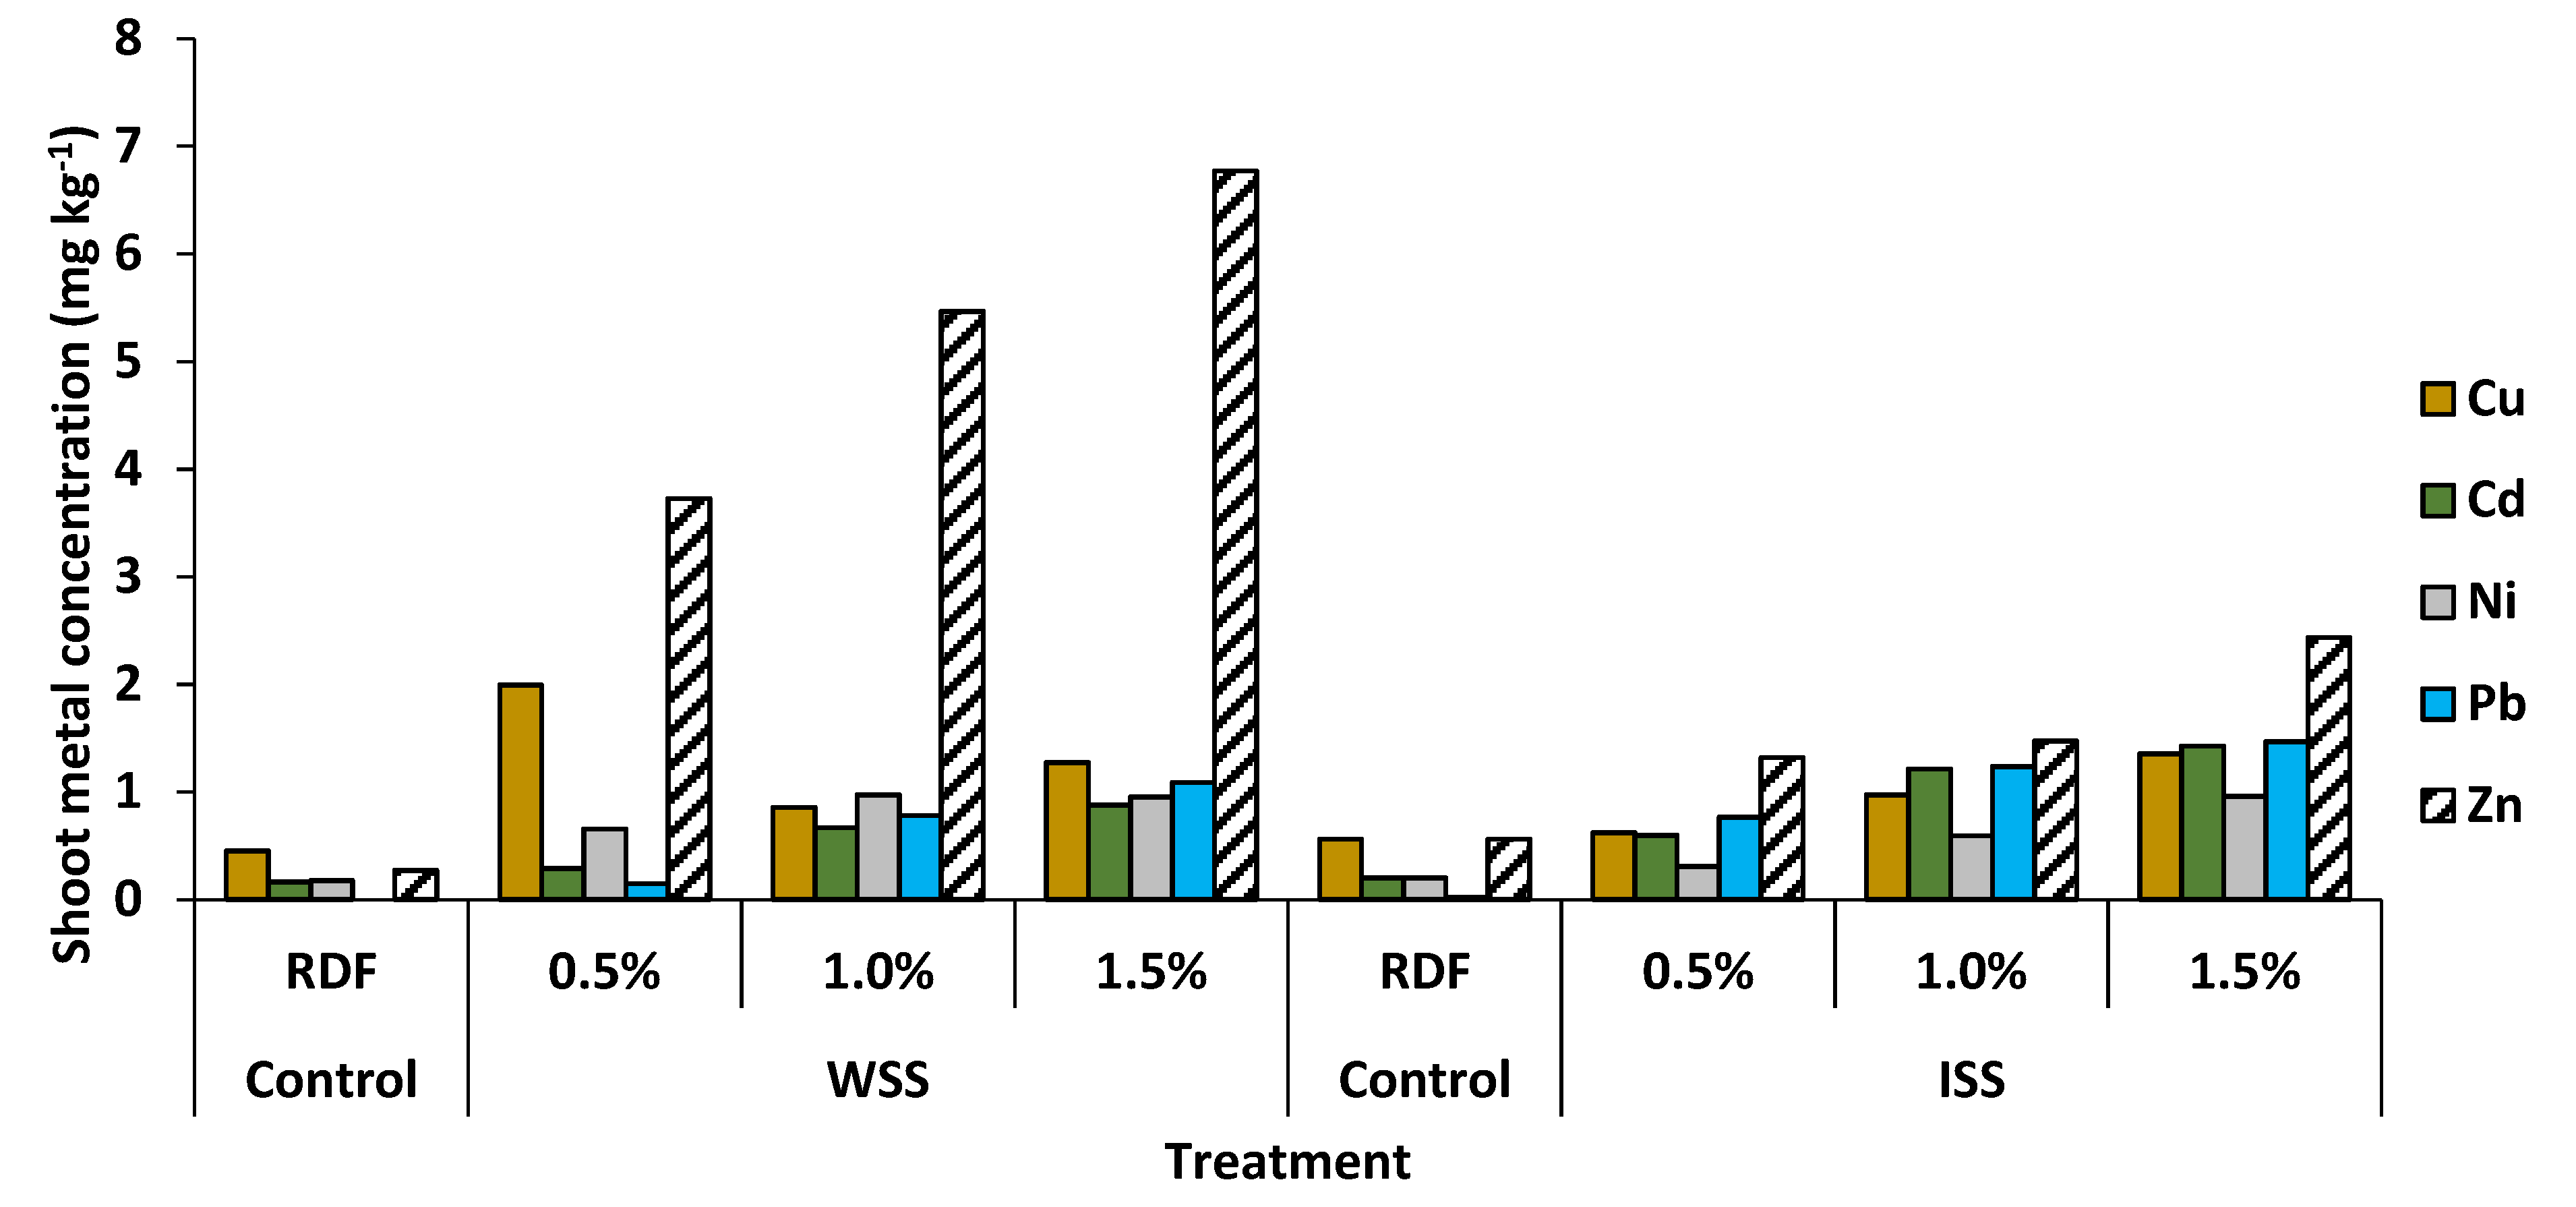
3.5. Accumulation of Trace Elements in Tomato Shoots

The concentrations of trace elements (Cd, Cu, Ni, Pb, and Zn) in the shoots are shown in Figure 1. The concentrations of mentioned trace elements in tomato shoots were significantly (p ≤ 0.05) higher in sewage-sludge-treated pots compared to unamended pots (control) and an increment in trace concentration was observed with increasing levels of both sewage sludges. It was noticed that both types of sludge applications increased the metal contents in the tomato plants as compared to the control. Moreover, the contents of trace metals in shoots increased with the increase in application rate. Overall, the WSS application exhibited the highest contents of shoot trace metals as compared to control and ISS application. Specifically, Zn contents were the highest with 1.5% WSS application compared with the rest of the amendments.
The addition of WSS to soil led to the accumulation of Cd, Cu, Ni, Pb, and Zn ranging from 0.29 to 0.88 mg kg−1, 0.86 to 1.99 mg kg−1, 0.66 to 0.97 mg kg−1, 0.15 to 1.09 mg kg−1, and 3.37 to 6.77 mg kg−1, respectively, whereas, in the case of ISS, these metal concentrations ranged from 0.60 to 1.43 mg kg−1, 0.62 to 1.35 mg kg−1, 0.31 to 0.96 mg kg−1, 0.77 to 1.47 mg kg−1, and 1.32 to 2.44 mg kg−1, respectively. With ISS application, 63%, 6%, 0.7%, and 34% increases in Cd, Cu, Ni, and Pb shoot concentrations, respectively, were recorded compared to WSS. However, Zn concentration was 178% higher in WSS than in ISS at the highest dose (1.5%).

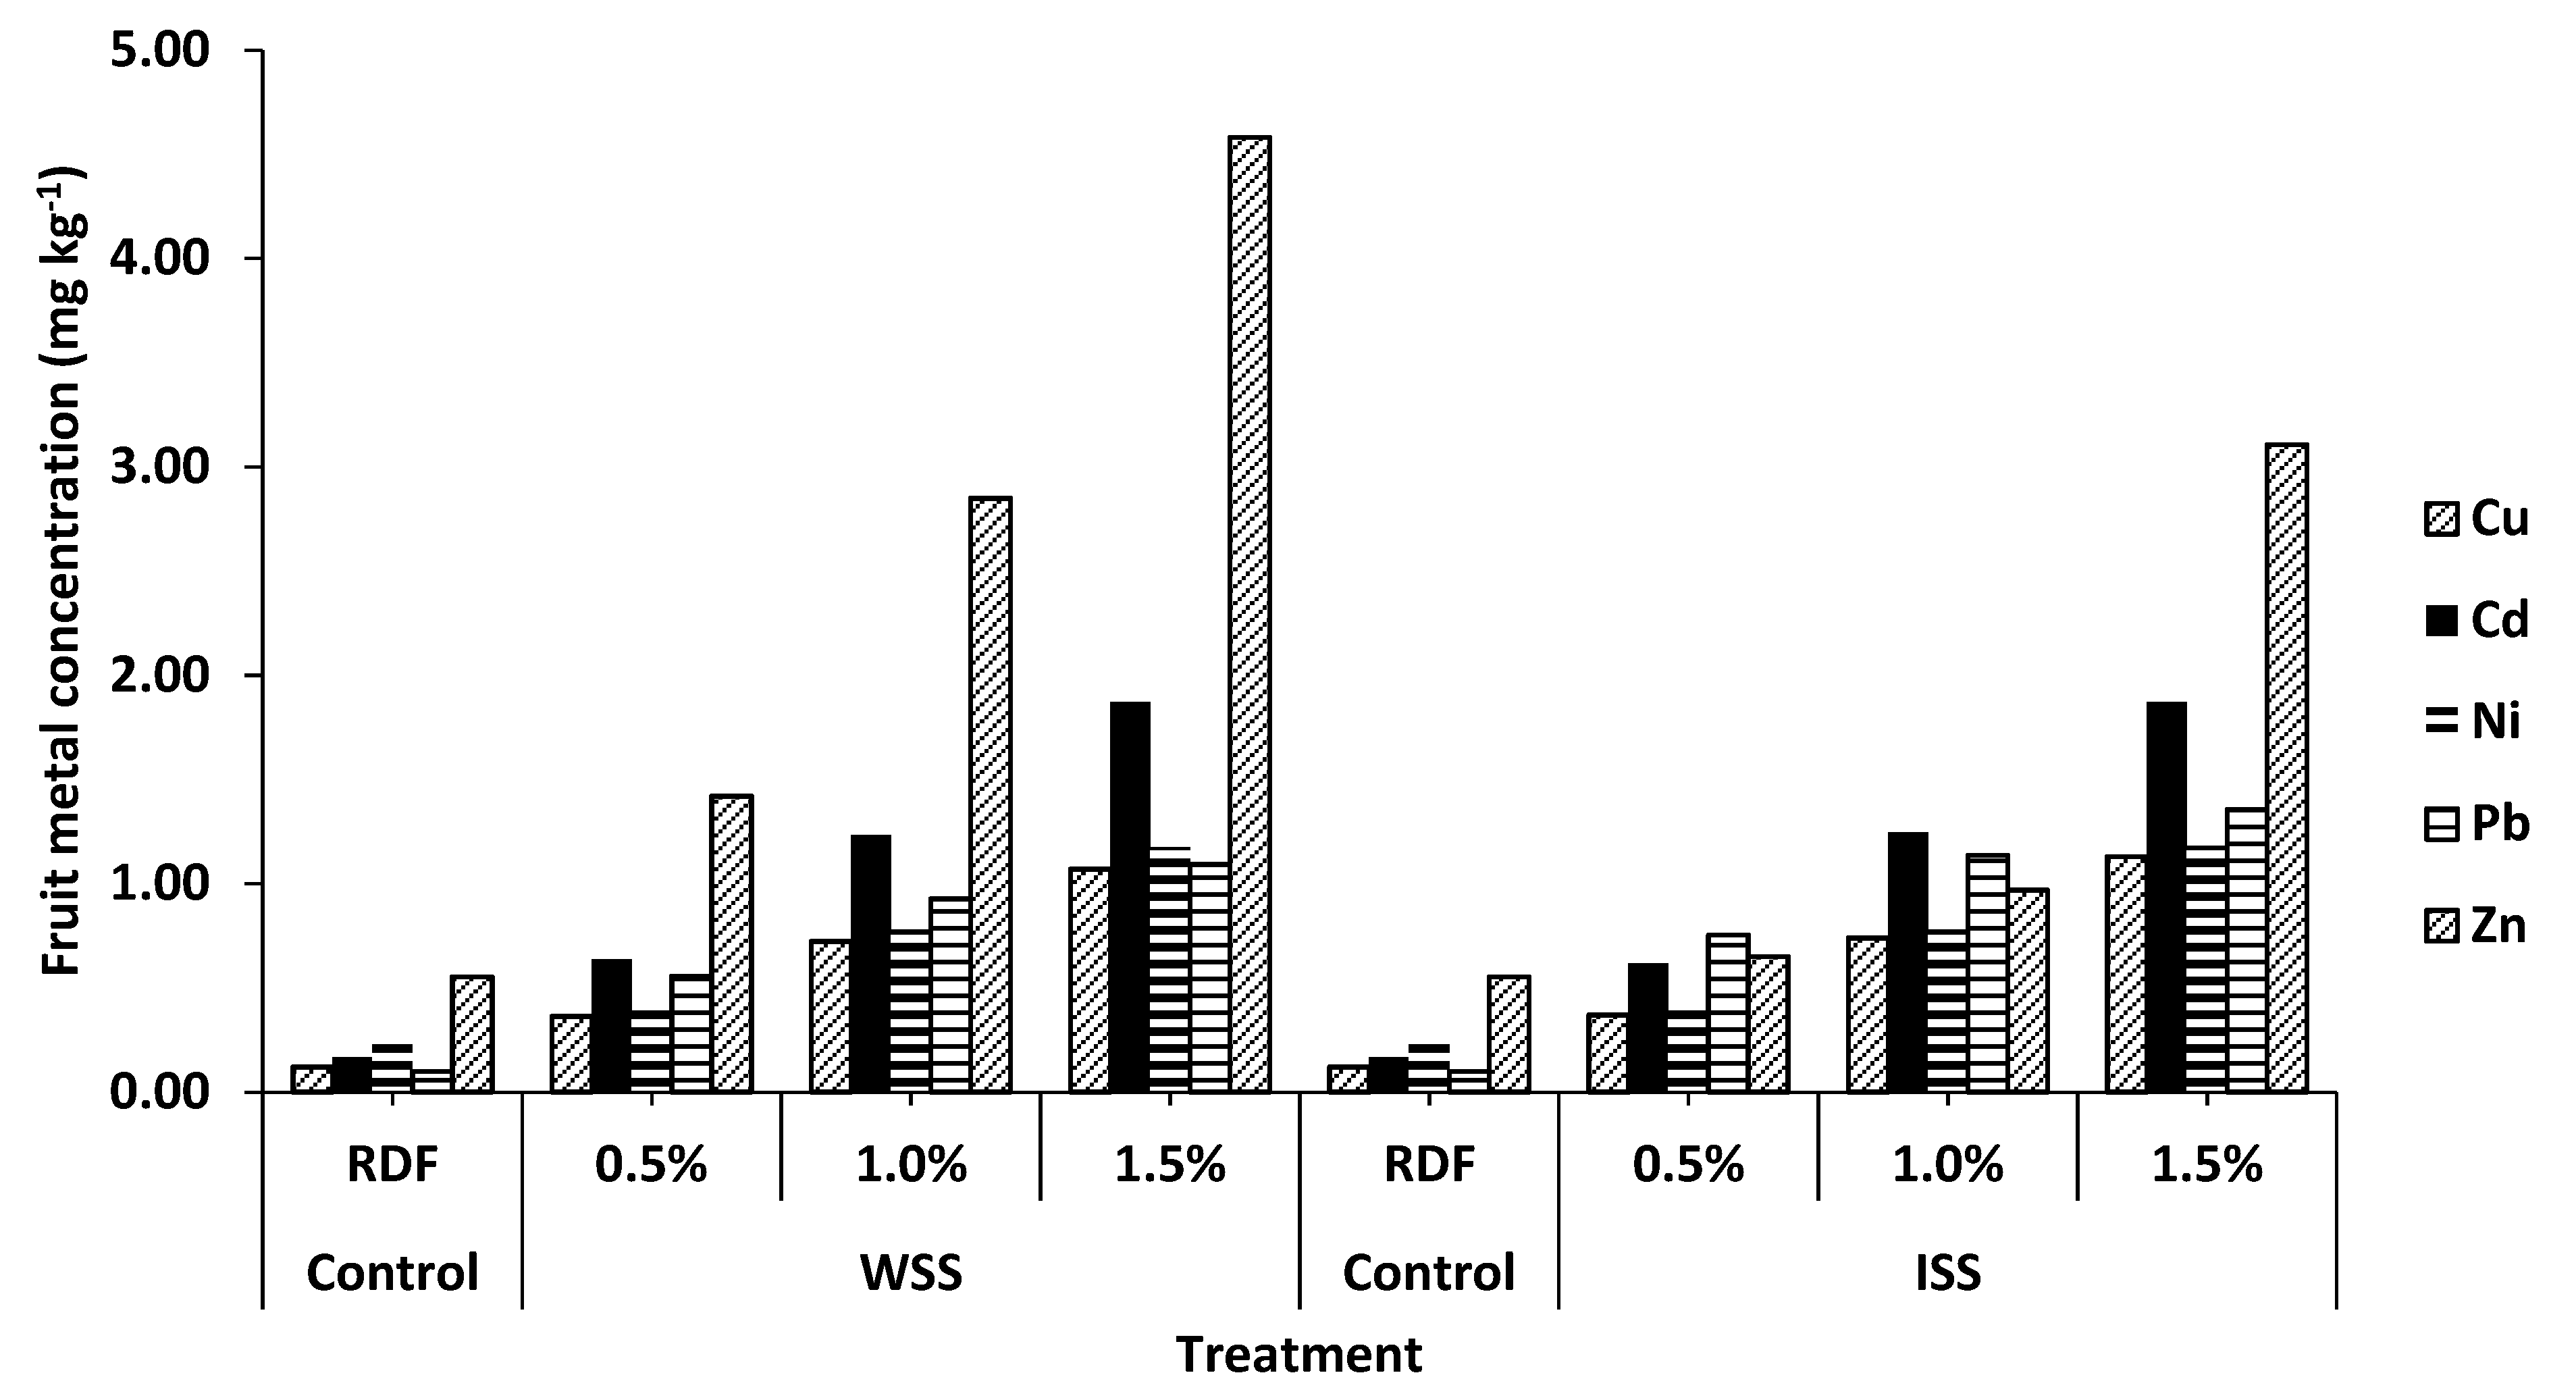
3.6. Accumulation of Trace Elements in Tomato Fruit

The concentrations of trace elements (Cd, Cu, Ni, Pb, and Zn) in the tomato fruit are shown in Figure 2. The concentrations of Cd, Cu, Ni, Pb, and Zn in tomato fruit ranged from 0.17 to 1.87 mg kg−1, 0.12 to 1.13 mg kg−1, 0.27 to 1.18 mg kg−1, 0.1 to 1.36 mg kg−1, and 0.55 to 4.58 mg kg−1, respectively. The highest concentration of Cd (1.87 mg kg−1) in fruit was detected with WSS at the application level of 1.5%. The maximum concentrations of Cu (1.13 mg kg−1), Ni (1.18 mg kg−1), and Pb (2.58 mg kg−1) in fruit were found with the addition of ISS at the 1.5% level. The highest Zn content (4.58 mg kg−1) in fruit was recorded with WSS at the 1.5% level of application.

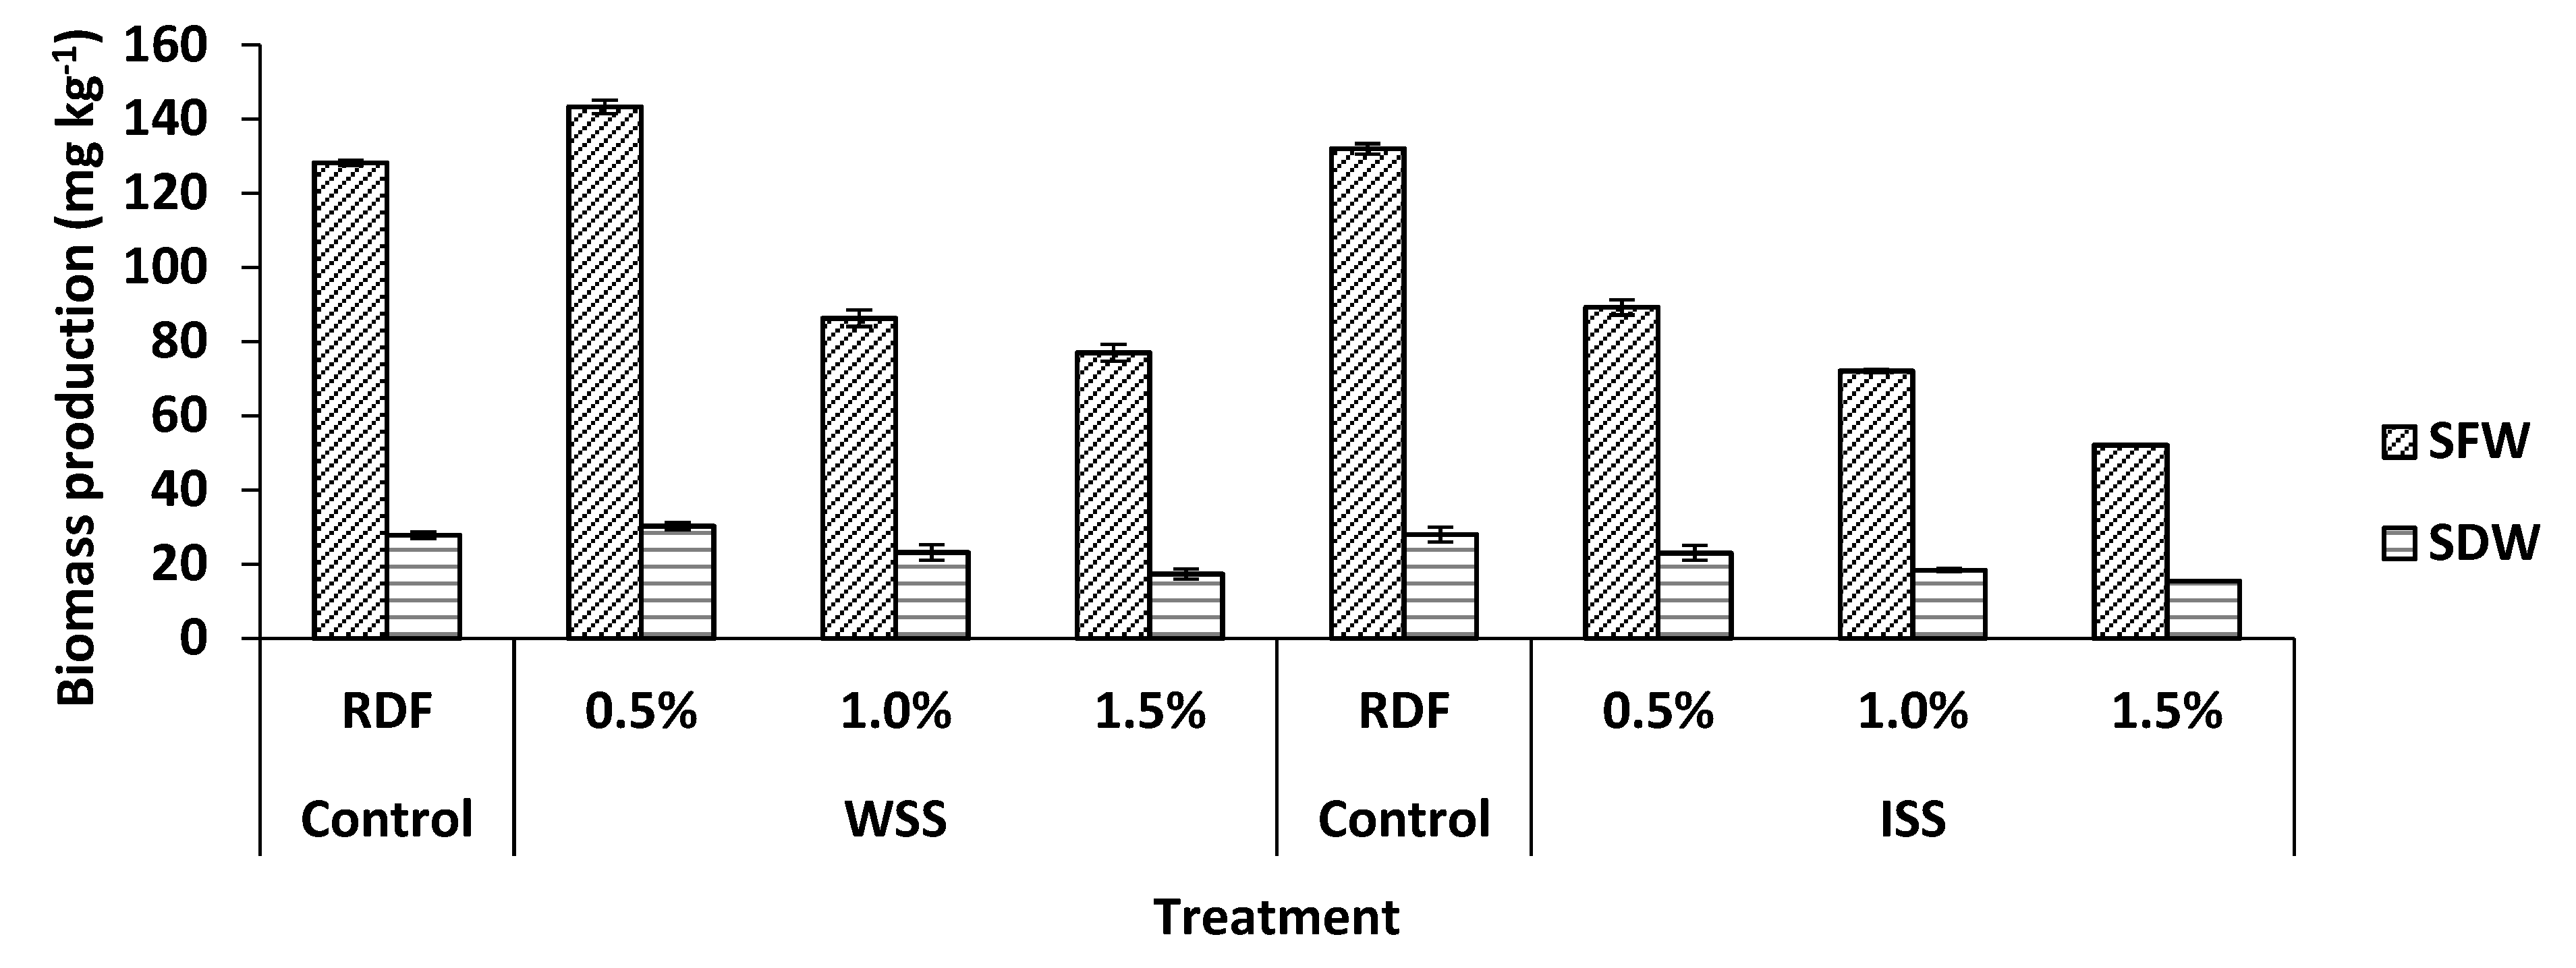
3.7. Effect of Treatments on Biomass Production

Biomass production in terms of shoot fresh weight (SFW) and shoot dry weight (SDW) is shown in Figure 3. The application of sewage sludge resulted in a significant (p ≤ 0.05) difference in SFW and SDW. The highest SFW (143 mg kg−1) was recorded with the addition of WSS at 0.5% (12% higher than control). The lowest SFW was recorded with the addition of ISS at 1.5% application rate. Similar to SFW, the highest SDW (30.27 g) was recorded with WSS at 1.5% level, which was 8% more as compared to control treatment where chemical fertilizers were applied without any addition of sewage sludge. On the other hand, the biomass declined to 44% with ISS treatment at 1.5% level, as compared to the control treatment.

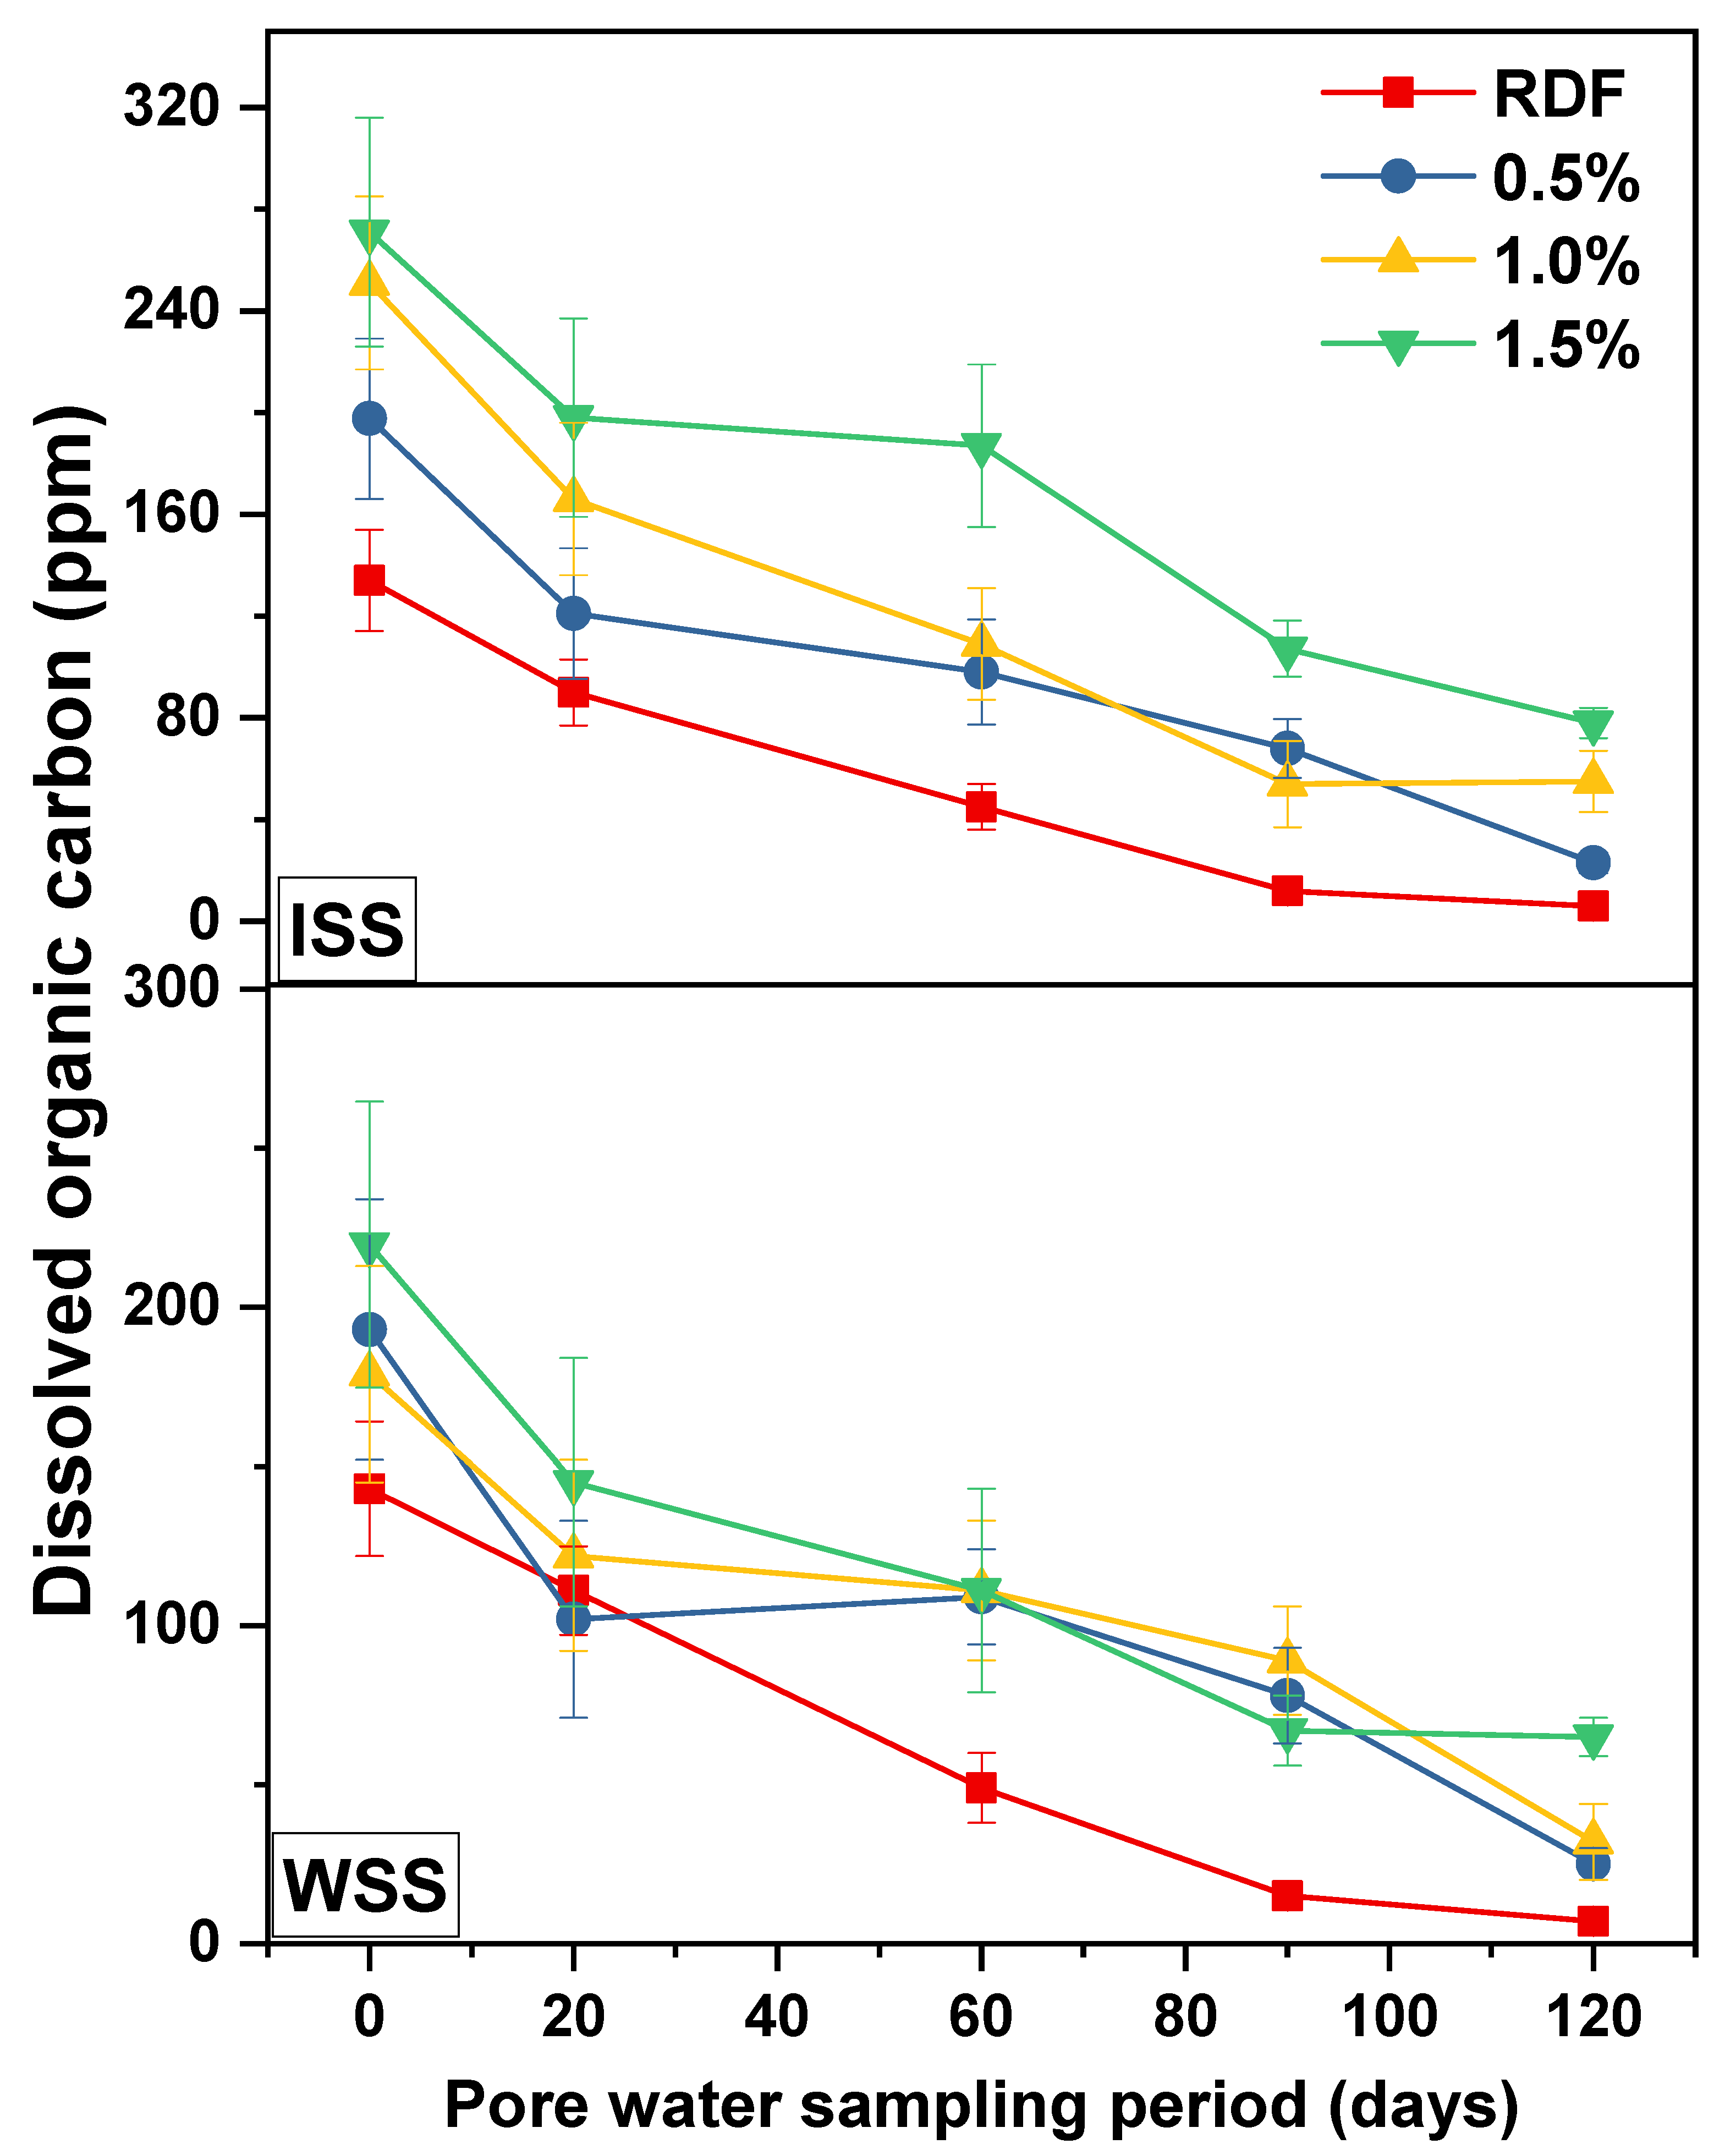
3.8. Pore Water Characteristics

The concentration of DOC increased with the increase in the rate of sewage sludge. In this regard, the highest DOC concentration was found with ISS at the rate of 1.5% (Figure 4). The data collected at various times during crop growth indicated that DOC concentration decreased with time. Pore water samples collected from the pots treated with ISS during crop growth had maximum DOC (271 mg kg−1) at the 1.5% level (0 days), and at the end, DOC decreased to 71% compared to the initial value. In the case of WSS, a reduction of about 70% was observed at the level of 1.5% (Figure 4).

3.9. Daily Intake of Metals (DIM) and Health Risk Index (HRI) through Consumption of Tomatoes

Prognostication of exposure levels of contaminants to detect the human health risk through exposure routes is highly imperative. There are many pathways by which humans are exposed to trace metals. Ingestion of vegetables contaminated with significant amounts of trace metal could cause harm to human health [29]. Cultivation of tomatoes under sewage sludge application at various levels and soil properties showed considerable variation in risk assessment indices. The daily dietary intake of metal values (mg kg−1 day−1) for adults by consumption of tomatoes grown in soil amended with two different sewage sludges are given in Table 5. In our study, the only intake pathway considered for Cu, Cd, Ni, Pb, and Zn was assumed to be vegetable consumption. The DIM values were estimated according to the average vegetable consumption for adults and compared with the recommended daily intakes [30]. The results revealed that both DIM and HRI values for all trace metals increased for soil treated with sewage sludge in a dose-additive manner irrespective of the origin of sewage sludge (Table 5). Overall, among all treatments, the highest DIM value (2.2 × 10⁻³) was found for Zn in WSS-treated soil with 1.5% application rate, while the highest DIM values for Cu, Cd, Ni, and Pb were 5.49 × 10⁻⁴, 2.27 × 10⁻⁶, 1.43 × 10⁻⁶, and 7.12 × 10⁻⁶, respectively, found in 1.5% application of ISS sludge treatment. Overall, the highest HRI value (1.3 × 10⁻²) was found for Cu with 1.5% application of both sludge types. The HRI values for all trace metals were below the permissible limit (HRI = 1) described by USEPA-IRIS.
The health risk index due to the ingestion of tomatoes was calculated by the United States Environmental Protection Agency (USEPA) hazard quotient. HRI < 1 means the exposed population is assumed to be safe. Oral reference doses (RfD) for Cu, Cd, Ni, Pb, and Zn are 4 × 10⁻², 1 × 10⁻³, 2 × 10⁻², 4 × 10⁻³, and 0.3 × 10−0 mg kg−1 day−1, respectively (USEPA, IRIS 2012). The DIM values less than RfD are assumed to be safe for adults and children.

3.10. Soil Pollution Indices

The Igeo values for the trace metals from SS application in soil, soil contamination factor values of metals and classification through CF in this study followed that described by [26] showed in Table 6, Table 7 and Table 8, respectively. Among all trace meals, Cd showed the highest Igeo values (29.6, 28.29, and 11.14) for 1%, 1.5%, and 0.5% WSS treatments, while Igeo from ISS source was 7.21 and 5.01 for 1.5% and 1% ISS application. The Cu followed the Cd with Igeo values of 1 from 1.5% WSS and 0.99 from 1.5% WSS treatment. The Igeo values for all other trace metals from both sources at all application rates except control treatments were below 1, ranging from 0.07 to 0.98.
Similarly, CF represents the contamination status of each element (Table 7), and our assessment showed that the highest CF was found for Cd (2.64 and 2.55) under 1% and 1.5% application of WSS. In WSS treatments, the CF ranged from 1.25 to 2.64 (all being higher than 1) at all three application rates (0.5%, 1%, and 1.5%), except for Pb and Zn which ranged from 0.07 to 0.38 (below 1). In ISS treatments, the highest CF (2.4) under 1.5% treatment was found for Ni, followed by 1.91 and 1.25 under 1% and 0.5% ISS treatments, respectively. All three application rates of ISS treatments showed CF values of 1.24 to 1.61 for Cu, while Cd CF values were 1.18 and 1.09 for 1.5% and 1% ISS treatments. Like WSS treatments, the CF for Zn and Cu did not exceed the value 1, but for Pb at 1.5% ISS application did. Similarly, PLI is another effective tool for determining the pollution level in soil. PLI above or equal to 1 indicates increased contamination level and decline in quality. In this study, PLI values did not agree with other indices, i.e., Igeo and CF. Although PLI values from all SS application rates were below 1, the highest PLI values, 0.36 and 0.16, were displayed by 1.5% and 1% ISS application, and the lowest PLI value, 0.03, was displayed by the lowest ISS application rate (0.5%). In the case of WSS treatments, the 1.5% application rate had the highest PLI of 0.078, and the lowest PLI of 0.008 was found for the 0.5% application rate.

4. Discussion

The current global production of SS is estimated at 45 million megagrams of dry matter (DM) per year; East Asia is among the largest producers [31], and Pakistan is not an exception, due to swiftly increasing population. The disposal of SS in agricultural lands as a cheap source of SOM and nutrients is increasingly adopted by farmers in Pakistan. Conversely, this practice is also being challenged regarding the food chain safety concerns of many inorganic pollutants, especially trace metals. The uncertainty in bioavailability of trace metals from sludge-amended soil under fluctuating soil pH and diminishing SOM levels remains a concern due to the rapid decomposition of such biosolids as SS. This concern turns intrusive when it comes to vegetable-based food chains [32]. In the current investigation, we evaluated tomato plants in soil amended with two SS types (WSS and ISS) obtained from different sources. Soil and WSS were slightly alkaline, while ISS was slightly acidic. Both sewage sludges were rich in total organic carbon (17.29–18.58%), while the soil used in this study was severely deficient. The detailed physiochemical characterization of SS used in this study has already been portrayed in our previous investigation [33].
The application of SS in soil led to enhancements in the soil EC, pH, and OC. The WSS addition increased the soil EC in an irregular manner, while the ISS had dose-dependent results. The increase in soil EC is due to the higher EC of WSS and ISS which contributed to the accumulation of soluble ions in the soil matrix during the decomposition of organic substances [34]. Previously, a 153% increase in EC was found following the application of raw SS having EC 2.85 dS m−1 in clayey soil (EC 0.35 dS m−1), showing that SS holds significant potential to raise soil EC following its application [35]. Similarly, the increase in soil pH under ISS application might be due to higher application rate and inherent acidity of ISS or may be due to the humification of applied SS [36,37,38,39,40,41,42,43]. Decomposition of SS following its application to soil leads to the release of fractions of available organic carbon and humus, which have a beneficial influence on soil properties and plant growth [44]. In a previous study [39], OM contents were found to increase proportionally (1.3 to 2.4%) with the rate of SS application (0 to 150 t ha−1), as in our study where 1.5% application rate of WSS and ISS increased the OM contents by 1.75% and 2.47%, respectively.
Remarkably higher concentrations of bioavailable trace metals in soil treated with WSS and ISS at 1.5% rate were measured at the end of the experiment. The increase in Pb and Zn solubility under ISS treatment compared to WSS treatment was due to inherently higher Pb and Zn contents in ISS sludge. SS can display higher or lower trace metal solubility depending on its source [25,42]. The negative association between increasing soil pH and trace metal bioavailability (Table 4) and the strong positive correlation between the trace metals and DOC suggest that trace metals were loosely bound by organic carbon [44], which enhanced their bioavailability in samples collected at 120 days after application of SS. Although the DOC contents were positively correlated to rates of both SS types, there was a decreasing trend in DOC contents over periodic sampling during 120 days. Similar results were also presented in [1]. These results suggest that DOC was able to bind trace metals. In our study, Zn and Cu had the highest bioavailability, which agrees with the findings of [45]. Similarly, the periodic decrease in DOC over the 120-day period strongly agrees with a previous finding [18] where sludge amendment to alkaline soil with no aging period decreased the DOC while the Zn concentration in pore water (bioavailable Zn) was increased in a 60-day period.
The application of sewage sludge was also found to influence soil phytotoxicity for tomato plants. However, the phytotoxicity of SS-derived HMs consists of many factors, such as the concentration and association of trace metals within SS matrices and soil and plant characteristics [46]. The concentration of trace metals was comparatively lower in WSS. The lowest rates of WSS application (0.5%) increased the shoot biomass compared to control, but the higher application rates of both SS types (1.5%) had 39–60% lower biomass than the control treatment. These results suggest that the application of SS containing lower contents of trace metals can boost soil fertility to support plant growth without generating phytotoxicity. On the contrary, the lower biomass production can be a result of either low nutrient supply in control treatment or phytotoxicity by either salinity or trace metals at higher application rates [5]. Similar results were also presented by [27], where the addition of 2% SS had higher shoot dry biomass (1.12 g) compared to 0.38 g only in control while increasing the application rate of SS to 10% resulted in a 39.5% decrease in biomass of tomato plants as the higher rates resulted in 73% mortality of tomato seedlings due to phytotoxicity originating from high salt stress together with high trace metal toxicity. Similarly, it was also found that tomato plant biomass was highest in 20% SS application compared to 0%, 10%, and 30% SS application in a greenhouse study [47].
Among studied metals, the translocation and subsequent accumulation in tomato plants (shoot and fruit) were found to be highest for Fe and Zn. A previous study also reported a similar accumulation of metals in above-ground parts; it also reported that the highest concentrations of Fe and Zn were found in the leaves, while the lowest concentrations of Fe and Zn were found in the fruits. Similarly, the second-highest accumulation of Cu in shoot or fruit found in this study is also supported from the results presented by [48], in which Cu was found to be the trace metal present in the highest concentration in radish. Similarly, [49] found very high contents of Pb (231.11 mg kg−1), Cd (9.41 mg kg−1), and Zn (108.72 mg kg−1) in shoots of tomato plants grown in a mixture of soil and SS at the ratio of 1:1. In this study, the concentration of Zn in tomato fruit was highest among all trace metals but still very safe for consumption. On the contrary, the concentration of Cd and Pb at 1.5% application rate of both SS types resulted in accumulation ranging from 1.09 to 1.87 mg kg−1, which exceeds the maximum allowable limits (MALs) defined by joint FAO/WHO Codex Alimentarius Commission [50] of 0.2 and 0.3 for Cd and Pb, respectively. Moreover, the FAO/WHO Codex Alimentarius Commission [51] has revised the MAL for Cd and Pb in fruiting vegetables to 0.05 mg kg−1. The high concentration of a trace metal such as Cd (1.87 mg kg−1) in tomatoes is not surprising, as previous studies suggested that tomatoes can accumulate higher concentrations of Cd, as Cd contents of up to 2.88 μg g−1 in tomatoes collected from wastewater-contaminated soils of Bangladesh have been reported [52]. Therefore, the results of this study suggest that applying trace-metal-enriched SS at high rates is a food safety risk in fruiting vegetables.
The application of sewage sludge on cropland must be taken into consideration due to its impact on food safety. Risk assessment results provide a scientific basis to make risk management decisions, including those related to food quality control standards. As the data indicated that the HRI values were <1, the health risks of trace metal exposure through the tomato-based food chain were of no consequence and generally assumed to be safe. The estimated dietary intakes of Cu, Cd, Ni, and Zn were far below the tolerable limits. The daily trace metal intake for both adults and children through the consumption of vegetables in this study was less than the RfD limit set by USEPA-IRIS. The findings of this study regarding DIM and HRI suggest that the consumption of plants grown in SS-treated soils is nearly free of risks, but field assessment is mandatory before generalizing such recommendations. Similar results have been reported previously based on findings that fruiting vegetables produced from wastewater irrigation had safe HRI limits for human consumption [53,54,55,56,57].
Soil pollution indices offer a useful tool for the assessment of soil polluted with trace metals. The Igeo consists of seven classes or grades (Table 7), whereby the highest Igeo value <5 or class 6 reflects a 100-fold enrichment above the background values [58]. However, Igeo is not readily comparable to the other indices of metal enrichment due to the nature of the Igeo calculation, which involves a log function and a background multiplication of 1.5× [59]. However, the trace metal values can be compared to background values to determine the contamination index as a result of SS application in agricultural soil. In our case, only Cd and Cu showed the highest Igeo potential from both sources of SS. According to Igeo classification, soil subjected to all three levels of WSS treatment and 1.5% ISS treatment had class 6 of Igeo (extremely contaminated with Cd). All other treatments were either partially uncontaminated or moderately contaminated. The highest Igeo of Cd can be linked to its background concentration both in soil (4.3 mg/kg) and in WSS (5.10 mg/kg), while the mobility of anthropogenic Cd is also highest among trace metals (Table 6). Thus, the highest rate of SS poses a serious risk of Cd and Cu accumulation if applied in croplands. Similarly, the results of CF significantly showed that individual elements Cu, Cd, and Ni had moderate to strong contamination status (Table 6) as per CF classification (Table 7). In [60], the highest CF and PLI were also found for Cd among studied trace metals from sewage-irrigated wheat crops. Similarly, contamination potential measured as PLI was found to be 12.6 for Cd in a field irrigated with sewage water, while the PLI for other trace metals (Cr, Mn, Zn, Cu, Pb) ranged from 0.02 to 4.69 [61], indicating that Cd has highest pollution potential through anthropogenic sources. Contrary to previous pollution indices which depend on soil trace metal concentration, the PLI uses the CF. A PLI value higher than unity suggests pollution existence, while a PLI value lower than 1 indicates no pollution load [25]. Contrary to CF which reflects the single elemental pollution, PLI elucidates the overall pollution level. Moreover, it also permits a comparison of pollution levels between sites and at different times [62]. In this study, the highest PLI found (0.36) was below 1, indicating that overall pollution of trace metals in the investigated samples was absent, but the Igeo and CF have shown that the contamination potential for Cd, Cu, and Ni was moderate to strong, as displayed in Table 7 and Table 8. In Pakistan, the human and environmental impacts of toxic metal concentrations, including in vegetables originating from untreated wastewater, remain a challenging matter in terms of research studies, food quality, food safety, and sustainability [63].

5. Conclusions

This study investigated the dynamics of trace elements in tomato plants grown in different mixtures of soil and two SS types (WSS and ISS) originating from different wastewater treatment plants which greatly differed in their chemical composition. Following the application of ISS, the change in soil pH by 2.2 was most prominent, while 1% WSS addition resulted in a 52.6% increase in EC. Remarkably higher concentrations of bioavailable trace metals in soils treated with WSS and ISS at a 1.5% rate were measured at the end of the experiment. There were 46- and 28.2-fold increases in Pb and Zn solubility under 1.5% ISS treatment and 15.7- and 22.5-fold increases in Pb and Zn solubility under 1.5% WSS treatment. The lowest rate of WSS application (0.5%) increased the shoot biomass by 12% compared to the control, but the highest application rate of SS (1.5%) had 39–60% less biomass than the control treatment. Although comparatively higher concentrations of Cd and Zn in tomato fruit were detected, our DIM and HRI analysis suggested that the tomatoes were safe for consumption. The HRI values for all trace metals were below the permissible limit (HRI = 1) described by USEPA-IRIS. However, the Igeo and CF showed that the contamination potential for Cd, Cu, and Ni was moderate to strong. According to the set of parameters observed in this study, soil amended with WSS at low application rates can be a vibrant opportunity for vegetable production and can provide economic benefits through enhancing the productivity at low input prices; however, the national standard regarding trace metal concentration should be given prime focus, and there should be tighter regulations to ensure the food safety.

Author Contributions

Data curation, M.H.A. and A.A.; formal analysis, G.M., H.A., M.I.S., M.H.A. and A.A.; funding acquisition, N.S., M.I.S. and A.A.; investigation, U.R., H.A. and M.H.A.; methodology, G.M. and N.S.; project administration, A.A.; resources, S.A.; software, M.H.S.; supervision, G.M. and S.A.; visualization, U.R., H.A., M.I.S. and M.H.S.; writing—original draft, H.A., G.M., U.R., M.I.S., M.H.S., S.A. and N.S.; writing—review and editing, M.H.S. All authors have read and agreed to the published version of the manuscript.

Funding

The authors would like to express their deepest gratitude to Higher Education Commission (HEC), Islamabad, Pakistan, for providing funds under the project NRPU #2714.

Institutional Review Board Statement

Not applicable.

Informed Consent Statement

Not applicable.

Data Availability Statement

Not applicable.

Acknowledgments

The authors are thankful to Higher Education Commission (HEC), Islamabad, Pakistan, for providing funds under the project NRPU #2714. The authors would like to express their deepest gratitude to the University of Tabuk, for the technical support for this study.

Conflicts of Interest

The authors declare that there are no conflict of interest.

References

  1. Riaz, U.; Murtaza, G.; Farooq, M. Influence of different sewage sludges and composts on growth, yield, and trace elements accumulation in rice and wheat. Land Degrad. Dev. 2018, 29, 1343–1352. [Google Scholar] [CrossRef]
  2. Tariq, F.; Wang, X.; Saleem, M.H.; Khan, Z.I.; Ahmad, K.; Saleem Malik, I.; Munir, M.; Mahpara, S.; Mehmood, N.; Ahmad, T.; et al. Risk Assessment of Heavy Metals in Basmati Rice: Implications for Public Health. Sustainability 2021, 13, 8513. [Google Scholar] [CrossRef]
  3. Zaheer, I.E.; Ali, S.; Saleem, M.H.; Noor, I.; El-Esawi, M.A.; Hayat, K.; Rizwan, M.; Abbas, Z.; El-Sheikh, M.A.; Alyemeni, M.N. Iron–Lysine Mediated Alleviation of Chromium Toxicity in Spinach (Spinacia oleracea L.) Plants in Relation to Morpho-Physiological Traits and Iron Uptake When Irrigated with Tannery Wastewater. Sustainability 2020, 12, 6690. [Google Scholar] [CrossRef]
  4. Zaheer, I.E.; Ali, S.; Saleem, M.H.; Arslan Ashraf, M.; Ali, Q.; Abbas, Z.; Rizwan, M.; El-Sheikh, M.A.; Alyemeni, M.N.; Wijaya, L. Zinc-lysine Supplementation Mitigates Oxidative Stress in Rapeseed (Brassica napus L.) by Preventing Phytotoxicity of Chromium, When Irrigated with Tannery Wastewater. Plants 2020, 9, 1145. [Google Scholar] [CrossRef] [PubMed]
  5. Ozyazici, M.A. Effects of sewage sludge on the yield of plants in the rotation system of wheat-white head cabbage-tomato. Eurasian J. Soil Sci. 2013, 2, 35–44. [Google Scholar]
  6. Bakshi, M.; Line, C.; Bedolla, D.E.; Stein, R.J.; Kaegi, R.; Sarret, G.; Larue, C. Assessing the impacts of sewage sludge amendment containing nano-TiO2 on tomato plants: A life cycle study. J. Hazard. Mater. 2019, 369, 191–198. [Google Scholar] [CrossRef]
  7. McGrath, D.; Postma, L.; McCormack, R.J.; Dowdall, C. Analysis of Irish sewage sludges: Suitability of sludge for use in agriculture. Ir. J. Agric. Food Res. 2000, 1, 73–78. [Google Scholar]
  8. Tehsin, M.; Khan, A.A.; Sargana, T.U.H. CPEC and sustainable economic growth for Pakistan. Pak. Vis. 2017, 18, 102–118. [Google Scholar]
  9. Jefferies, D.J.; Freestone, P. Chemical Analysis of Some Coarse Fish from a Suffolk River Carried Out as Part of the Preparation for the First Release of Captive-Bred Otters; Springer: New York, NY, USA, 1984. [Google Scholar]
  10. Forstner, U. Lecture nNotes in Earth Sciences; Springer: New York, NY, USA; London, UK, 1989. [Google Scholar]
  11. Shahid, M.; Dumat, C.; Khalid, S.; Schreck, E.; Xiong, T.; Niazi, N.K. Foliar heavy metal uptake, toxicity and detoxification in plants: A comparison of foliar and root metal uptake. J. Hazard. Mater. 2017, 325, 36–58. [Google Scholar] [CrossRef] [Green Version]
  12. Allen, J.R.L.; Rae, J.E. Time sequence of metal pollution, Severn Estuary, southwestern UK. Mar. Pollut. Bull. 1986, 17, 427–431. [Google Scholar] [CrossRef]
  13. Arora, M.; Kiran, B.; Rani, S.; Rani, A.; Kaur, B.; Mittal, N. Heavy metal accumulation in vegetables irrigated with water from different sources. Food Chem. 2008, 111, 811–815. [Google Scholar] [CrossRef]
  14. Rattan, R.K.; Datta, S.P.; Chhonkar, P.K.; Suribabu, K.; Singh, A.K. Long-term impact of irrigation with sewage effluents on heavy metal content in soils, crops and groundwater-a case study. Agric. Ecosyst. Environ. 2005, 109, 310–322. [Google Scholar] [CrossRef]
  15. Nishida, C.; Uauy, R.; Kumanyika, S.; Shetty, P. The Joint WHO/FAO Expert Consultation on diet, nutrition and the prevention of chronic diseases: Process, product and policy implications. Public Health Nutr. 2004, 7, 245–250. [Google Scholar] [CrossRef] [PubMed] [Green Version]
  16. WHO. World Health Organization Global Database on Body Mass Index. 2016. Available online: https://www.who.int/nutrition/databases/bmi/en/ (accessed on 20 September 2021).
  17. US-EPA, IRIS. United States, Environmental Protection Agency, Integrated Risk Information System; U.S. Environmental Protection Agency: Washington, DC, USA, 2006.
  18. Murtaza, G.; Haynes, R.J.; Kim, K.R.; Zia, M.H.; Naidu, R.; Belyaeva, O.N. Effect of Aging Biosolids with Soils of Contrasting PH on Subsequent Concentrations of Cu and Zn in Pore Water and on Their Plant Uptake. Environ. Sci. Pollut. Res. 2012, 19, 636–645. [Google Scholar] [CrossRef]
  19. Sigfusson, B.; Gislason, S.R.; Paton, G.I. The effect of soil solution chemistry on the weathering rate of a Histic Andosol. J. Geochem. Explor. 2006, 88, 321–324. [Google Scholar] [CrossRef]
  20. Sharp, J.H. The dissolved organic carbon controversy: An update. Oceanography 1993, 6, 45–50. [Google Scholar] [CrossRef] [Green Version]
  21. Li, Z.; Ma, Z.; van der Kuijp, T.J.; Yuan, Z.; Huang, L. A review of soil heavy metal pollution from mines in China: Pollution and health risk assessment. Sci. Total Environ. 2014, 468, 843–853. [Google Scholar] [CrossRef]
  22. Ji, Y.Q.; Feng, Y.C.; Wu, J.H.; Zhu, T.; Bai, Z.P.; Duan, C.Q. Using geoaccumulation index to study source profiles of soil dust in China. J. Environ. Sci. 2008, 20, 571–578. [Google Scholar] [CrossRef]
  23. Hakanson, L. An ecological risk index for aquatic pollution control. A sedimentological approach. Water Res. 1980, 14, 975–1001. [Google Scholar] [CrossRef]
  24. Solgi, E.; Esmaili-Sari, A.; Riyahi-Bakhtiari, A.; Hadipour, M. Soil contamination of metals in the three industrial estates, Arak, Iran. Bull. Environ. Contam. Toxicol. 2012, 88, 634–638. [Google Scholar] [CrossRef]
  25. Pandey, B.; Agrawal, M.; Singh, S. Ecological risk assessment of soil contamination by trace elements around coal mining area. J. Soils Sediments 2016, 16, 159–168. [Google Scholar] [CrossRef]
  26. Varol, M. Assessment of heavy metal contamination in sediments of the Tigris River (Turkey) using pollution indices and multivariate statistical techniques. J. Hazard. Mater. 2011, 195, 355–364. [Google Scholar] [CrossRef]
  27. Tomlinson, D.L.; Wilson, J.G.; Harris, C.R.; Jeffrey, D.W. Problems in the assessment of heavy-metal levels in estuaries and the formation of a pollution index. Helgoländer Meeresunters 1980, 33, 566–575. [Google Scholar] [CrossRef] [Green Version]
  28. Steel, R.G.D.; Torrie, J.H. Principles and Procedures of Statistics; McGraw-Hill Book Company, Inc.: New York, NY, USA, 1960. [Google Scholar]
  29. Balkhair, K.S.; Ashraf, M.A. Field accumulation risks of heavy metals in soil and vegetable crop irrigated with sewage water in western region of Saudi Arabia. Saudi J. Biol. Sci. 2016, 23, 32–44. [Google Scholar] [CrossRef] [PubMed] [Green Version]
  30. USEPA. Integrated Risk Information System (IRIS). 2012. Available online: http://www.epa.gov/IRIS/ (accessed on 15 October 2021).
  31. Buta, M.; Hubeny, J.; Zieliński, W.; Harnisz, M.; Korzeniewska, E. Sewage sludge in agriculture–the effects of selected chemical pollutants and emerging genetic resistance determinants on the quality of soil and crops—A review. Ecotoxicol. Environ. Saf. 2021, 214, 112070. [Google Scholar] [CrossRef] [PubMed]
  32. Eid, E.M.; Khedher, K.M.; Ayed, H.; Arshad, M.; Mouldi, A.; Shaltout, K.H.; Sewelam, N.A.; Galal, T.M.; El-Bebany, A.F.; Alshehri, A.M. Prediction models based on soil properties for evaluating the heavy metal uptake into Hordeum vulgare L. grown in agricultural soils amended with different rates of sewage sludge. Int. J. Environ. Health Res. 2020, AHEAD-OF-PRINT. 1–15. [Google Scholar] [CrossRef] [PubMed]
  33. Riaz, U.; Murtaza, G.; Farooq, M.; Aziz, H.; Qadir, A.A.; Mehdi, S.M.; Qazi, M.A. Chemical fractionation and risk assessment of trace elements in sewage sludge generated from various states of Pakistan. Environ. Sci. Pollut. Res. 2020, 27, 39742–39752. [Google Scholar] [CrossRef] [PubMed]
  34. Mingorance, M.D.; Oliva, S.R.; Valdés, B.; Gata, F.P.; Leidi, E.O.; Guzmán, I.; Peña, A. Stabilized Municipal Sewage Sludge Addition to Improve Properties of an Acid Mine Soil for Plant Growth. J. Soils Sediments 2014, 14, 703–712. [Google Scholar] [CrossRef] [Green Version]
  35. Gwenzi, W.; Muzava, M.; Mapanda, F.; Tauro, T.P. Comparative Short-Term Effects of Sewage Sludge and Its Biochar on Soil Properties, Maize Growth and Uptake of Nutrients on a Tropical Clay Soil in Zimbabwe. J. Integr. Agric. 2016, 15, 1395–1406. [Google Scholar] [CrossRef] [Green Version]
  36. Grobelak, A.; Placek, A.; Grosser, A.; Singh, B.R.; Almås, Å.R.; Napora, A.; Kacprzak, M. Effects of Single Sewage Sludge Application on Soil Phytoremediation. J. Clean. Prod. 2016, 155, 1–9. [Google Scholar] [CrossRef]
  37. Kumar, V.; Chopra, A.K. Accumulation and Translocation of Metals in Soil and Different Parts of French Bean (Phaseolus vulgaris L.) Amended with Sewage Sludge. B. Environ. Contam. Tox. 2014, 92, 103–108. [Google Scholar] [CrossRef] [PubMed]
  38. Eid, E.M.; Alrumman, S.A.; El-Bebany, A.F.; Hesham, A.E.L.; Taher, M.A.; Fawy, K.F. The effects of different sewage sludge amendment rates on the heavy metal bioaccumulation, growth and biomass of cucumbers (Cucumissativus L.). Int. J. Phytoremed. 2017, 24, 16371–16382. [Google Scholar]
  39. Eid, E.M.; Alrumman, S.A.; El-Bebany, A.F.; Fawy, K.F.; Taher, M.A.; Hesham, A.E.L.; El-Shaboury, G.A.; Ahmed, M.T. The evaluation of sewage sludge application as a fertilizer for broad bean (Faba sativa Bernh.) crops. Food Energy Secur. 2018, 7, e00142. [Google Scholar] [CrossRef] [Green Version]
  40. Zuo, W.; Gu, C.; Zhang, W.; Xu, K.; Wang, Y.; Bai, Y.; Dai, Q. Sewage sludge amendment improved soil properties and sweet sorghum yield and quality in a newly reclaimed mudflat land. Sci. Total Environ. 2019, 654, 541–549. [Google Scholar] [CrossRef]
  41. Antonkiewicz, J.; Kuc, A.; Witkowicz, R.; Tabak, M. Effect of municipal sewage sludge on soil chemical properties and chemical composition of spring wheat. Ecol. Chem. Eng. 2019, 26, 583–595. [Google Scholar] [CrossRef] [Green Version]
  42. Gondek, K. Effect of fertilization with farmyard manure, municipal sewage sludge and compost from biodegradable waste on yield and mineral composition of spring wheat grain. J. Elementol. 2012, 17. [Google Scholar] [CrossRef]
  43. Vieira, R.F.; Moriconi, W.; Pazianotto, R.A.A. Residual and cumulative effects of soil application of sewage sludge on corn productivity. Environ. Sci. Pollut. Res. 2014, 21, 6472–6481. [Google Scholar] [CrossRef]
  44. Urbaniak, M.; Wyrwicka, A.; Tołoczko, W.; Serwecińska, L.; Zieliński, M. The Effect of Sewage Sludge Application on Soil Properties and Willow (Salix sp.) Cultivation. Sci. Total Environ. 2017, 586, 66–75. [Google Scholar] [CrossRef]
  45. Schwab, P.; Zhu, D.; Banks, M.K. Heavy metal leaching from mine tailings as affected by organic amendments. Bioresour Technol. 2007, 98, 2935–2941. [Google Scholar] [CrossRef]
  46. Gomez-Eyles, J.L.; Sizmur, T.; Collins, C.D.; Hodson, M.E. Effects of biochar and the earthworm Eisenia fetida on the bioavailability of polycyclic aromatic hydrocarbons and potentially toxic elements. Environ. Pollut. 2011, 159, 616–622. [Google Scholar] [CrossRef]
  47. Elmi, A.; AlOlayan, M. Sewage Sludge Land Application: Balancing Act between Agronomic Bene Fi Ts and Environmental Concerns. J. Clean. Prod. 2020, 250, 119512. [Google Scholar] [CrossRef]
  48. Sousa, A.A.T.C.; Figueiredo, C. Sewage sludge biochar: Effects on soil fertility and growth of radish. Biol. Agric. Hortic. 2016, 32, 127–138. [Google Scholar] [CrossRef]
  49. Krishna, V.; Pandey, A.K.; Gupta, P.K. Heavy Metals in Sludge Produced from UASB Treatment Plant at Mirzapur India. Pollution 2021, 7, 607–616. [Google Scholar]
  50. FAO; WHO; Codex Alimentarius Commission. Food Additives and Contaminants. Joint FAO. WHO Food Stand. Programme 2001, 1, 1–289. [Google Scholar]
  51. FAO; WHO; Codex Alimentarius Commission. Working Document for Information and Use in Discussions Related to Contaminants and Toxins in the GSCTFF; FAO: Rome, Italy, 2018. [Google Scholar]
  52. Chowdhury, M.A.H.; Chowdhury, T.; Rahman, M.A. Heavy Metal Accumulation in Tomato and Cabbage Grown in Some Industrially Contaminated Soils of Bangladesh. J. Bangladesh Agric. Univ. 2019, 17, 288–294. [Google Scholar] [CrossRef] [Green Version]
  53. U.S.-EPA. Systematic Review Protocol for the PFBA, PFHxA, PFHxS, PFNA, and PFDA IRIS Assessments; U.S. Environmental Protection Agency: Washington, DC, USA, 2019.
  54. Ali, F.; Ullah, H.; Khan, I. Heavy Metals Accumulation in Vegetables Irrigated with Industrial Influents and Possible Impact of such Vegetables on Human Health. Sarhad J. Agric. 2017, 1, 33. [Google Scholar] [CrossRef]
  55. Shaheen, N.; Irfan, N.M.; Khan, I.N.; Islam, S.; Islam, M.S.; Ahmed, M.K. Presence of heavy metals in fruits and vegetables: Health risk implications in Bangladesh. Chemosphere 2016, 152, 431–438. [Google Scholar] [CrossRef]
  56. Zafarzadeh, A.; Rahimzadeh, H.; Mahvi, A.H. Health risk assessment of heavy metals in vegetables in an endemic esophageal cancer region in Iran. Health Scope 2018, 7, 12340. [Google Scholar] [CrossRef] [Green Version]
  57. Iqbal, S.; Naz, T.; Abdul Sattar, M. Challenges and opportunities linked with waste management under global perspective: A mini review. J. Qual. Assur. Agric. Sci. 2021, 1, 9–13. [Google Scholar]
  58. Forstner, U.; Ahlf, W.; Calmano, W.; Kersten, M. Sediment criteria development-contributions from environmental geochemistry to water quality management. Sed. Environ. Geochem. Sel. Asp. Case Stud. 1990, 3, 11–38. [Google Scholar]
  59. Zahra, A.; Hashmi, M.Z.; Malik, R.N.; Ahmed, Z. Enrichment and geo-accumulation of heavy metals and risk assessment of sediments of the Kurang Nallah—feeding tributary of the Rawal Lake Reservoir, Pakistan. Sci. Total Environ. 2014, 470, 925–933. [Google Scholar] [CrossRef]
  60. Khan, Z.I.; Iqbal, S.; Batool, F.; Ahmad, K.; Elshikh, M.S.; Al Sahli, A.; El-Zaidy, M.; Bashir, H.; Noorka, I.R.; Sher, M.; et al. Evaluation of heavy metals uptake by wheat growing in sewage irrigated soil: Relationship with heavy metal in soil and wheat grains. Fresenius Environ. Bull. 2017, 26, 7838–7848. [Google Scholar]
  61. Ashfaq, A.; Khan, Z.I.; Bibi, Z.; Ahmad, K.; Ashraf, M.; Mustafa, I.; Akram, N.A.; Perveen, R.; Yasmeen, S. Heavy Metals Uptake by Cucurbita maxima Grown in Soil Contaminated with Sewage Water and its Human Health Implications in Peri-urban Areas of Sargodha City. Pak. J. Zool. 2015, 47, 1051–1058. [Google Scholar]
  62. Kumar, A.; Cabral-Pinto, M.; Kumar, M.; Dinis, P.A. Estimation of risk to the eco-environment and human health of using heavy metals in the Uttarakhand Himalaya, India. Appl. Sci. 2020, 10, 7078. [Google Scholar] [CrossRef]
  63. Nawaz, A.; Hussain, S.; Waqas, M.S.; Rasheed, H.; Ali, S.; Iqbal, M.M.; Yasmeen, Z.; Waqas, M.M. Health Risk Assessment of Heavy Metals due to untreated wastewater irrigated vegetables. Big Data Water Resour. Eng. (BDWRE) 2020, 1, 11–13. [Google Scholar] [CrossRef] [Green Version]
Figure 1. Accumulation of trace metals in tomato shoots. RDF: recommended dose of fertilizer; WSS: WASA sewage sludge; ISS: I-9 Sector sewage sludge.
Sustainability 13 12394 g001
Figure 2. Accumulation of trace metals in tomato fruit. RDF: recommended dose of fertilizer; WSS: WASA sewage sludge; ISS: I-9 Sector sewage sludge.
Sustainability 13 12394 g002
Figure 3. Effect of treatments on biomass production in terms of shoot fresh weight (SFW) and shoot dry weight (SDW). RDF: recommended dose of fertilizer; WSS: WASA sewage sludge; ISS: I-9 Sector sewage sludge.
Sustainability 13 12394 g003
Figure 4. Changes in dissolved organic carbon in pore water samples during the crop growth period. RDF: recommended dose of fertilizer; WSS: WASA sewage sludge; ISS: I-9 Sector sewage sludge.
Sustainability 13 12394 g004
Table 1. Selected properties of soil and sewage sludges used in experiment.
PropertiesSoilISSWSS
EC(1:10) (dS m−1)3.67 ± 0.0096.46 ± 1.065.08 ± 0.42
pHw (1:10)7.87 ± 0.0026.69 ± 0.127.32 ± 0.21
TOC (%)0.02 ± 0.00318.58 ± 0.817.29 ± 0.90
N (%)0.08 ± 0.0021.03 ± 0.030.41 ± 0.02
P (%)0.67 ± 0.0020.24 ± 0.030.15 ± 0.003
K (%)0.69 ± 0.0010.27 ± 0.020.16 ± 0.01
Cd (mg kg−1)4.30 ± 0.153.20 ± 0.075.10 ± 0.131
Cu (mg kg−1)61.60 ± 2.332.50 ± 2.8019.80 ± 1.43
Ni (mg kg−1)25.00 ± 8.69123. ± 29.40187 ± 8.21
Pb (mg kg−1)4.30 ± 0.1574.20 ± 6.2018.10 ± 1.17
Zn (mg kg−1)61.60 ± 2.30831 ± 57.00203 ± 16
Values are means ± standard error (n = 3); WSS: WASA sewage sludge, ISS: I-9 Sector sewage sludge.
Table 2. Changes in soil chemical properties after experiment.
TreatmentsLevelsECepHsSOM
WSSRDF4.48 ± 0.31 d5.83 ± 0.32 d0.24 ± 0.01 c
0.5%6.49 ± 0.31 b6.85 ± 0.34 c0.43 ± 0.01 b
1.0%6.84 ± 0.20 a7.49 ± 0.54 b0.54 ± 0.02 b
1.5%6.34 ± 0.25 c7.66 ± 0.65 a0.65 ± 0.03 a
LSD (WSS) (p ≤ 0.05)0.130.110.10
ISSRDF4.42 ± 0.21 d5.73 ± 0.12 d0.21 ± 0.02 d
0.5%6.81 ± 0.22 a7.10 ± 0.56 c0.32 ± 0.03 c
1.0%6.70 ± 0.21 b7.47 ± 0.67 b0.45 ± 0.03 b
1.5%6.52 ± 0.42 c7.83 ± 0.42 a0.73 ± 0.04 a
LSD (ISS) (p ≤ 0.05)0.060.190.04
LSD WSS × ISS (p ≤ 0.05)NS0.12NS
Values are means ± standard error (n = 3); parameters sharing the same letters within a column are statistically nonsignificant at p ≤ 0.05; NS: nonsignificant; RDF: recommended dose of fertilizer; WSS: WASA sewage sludge; ISS: I-9 Sector sewage sludge.
Table 3. Accumulation of metals in postharvest soil.
TreatmentsLevelsCuCdNiPbZn
WSSRDF0.45 ± 0.02 d0.17 ± 0.01 d0.52 ± 0.01 d0.10 ± 0.01 d0.43 ± 0.02 d
0.5%1.99 ± 0.05 c0.28 ± 0.01 c1.21 ± 0.08 c0.55 ± 0.01 c3.43 ± 0.12 c
1.0%2.86 ± 0.11 b0.58 ± 0.02 b2.54 ± 0.23 b1.05 ± 0.01 b5.43 ± 0.22 b
1.5%5.27 ± 0.15 a0.88 ± 0.03 a3.54 ± 0.32 a1.57 ± 0.01 a9.65 ± 0.67 a
LSD (WSS) (p ≤ 0.05)1.120.090.510.211.12
ISSRDF0.41 ± 0.01 c0.15 ± 0.02 d0.48 ± 0.02 d0.07 ± 0.02 d0.48 ± 0.02 d
0.5%3.44 ± 0.18 b1.43 ± 0.12 c1.11 ± 0.43 c2.32 ± 0.01 c7.65 ± 0.52 c
1.0%3.54 ± 0.17 b2.97 ± 0.32 b3.23 ± 0.43 b2.55 ± 0.01 b11.43 ± 0.87 b
1.5%6.89 ± 0.52 a3.65 ± 0.43 a5.43 ± 0.54 a3.22 ± 0.01 a13.54 ± 0.92 a
LSD (ISS) (p ≤ 0.05)0.321.010.910.160.81
LSD WSS × ISS (p ≤ 0.05)NS1.540.120.06NS
Values are means ± standard error (n = 3); parameters sharing the same letters within a column are statistically nonsignificant at p ≤ 0.05; NS: nonsignificant; RDF: recommended dose of fertilizer; WSS: WASA sewage sludge; ISS: I-9 Sector sewage sludge.
Table 4. Correlation coefficients (R2) and significance of the correlations between the Cu, Cd, Ni, Pb, and Zn concentrations in pore water solution and the dissolved organic C and solution pH.
PropertyMetalCorrelation
DOCCu0.78
Cd0.56
Pb0.89
Ni0.72
Zn0.88
Solution pHCu−0.18
Cd−0.11
Pb−0.31
Ni−0.21
Zn0.18
Table 5. Daily intake of metals (DIM) and health risk index (HRI) through consumption of tomatoes produced from soils treated with two different sewage sludge types.
LevelsCuCdNiPbZn
DIMHRIDIMHRIDIMHRIDIMHRIDIMHRI
WSSRDF5.83 × 10−5 1.46 × 10−32.00 × 10−72.00 × 10−43.22 × 10−71.61 × 10−66.80 × 10−61.70 × 10−42.69 × 10−48.96 × 10⁻⁴
0.5%1.76 × 10−44.41 × 10−37.74 × 10−77.74 × 10−44.74 × 10−72.37 × 10−67.12 × 10−61.78 × 10−46.90 × 10−42.30 × 10−3
1.0%3.51 × 10−48.78 × 10−31.50 × 10−61.50 × 10−39.47 × 10−74.74 × 10−63.79 × 10−69.47 × 10−41.38 × 10−34.61 × 10−3
1.5%5.20 × 10−51.30 × 10−22.27 × 10−62.27 × 10−31.42 × 10−67.12 × 10−65.28 × 10−61.32 × 10−32.22 × 10−37.42 × 10−3
ISSRDF5.83 × 10−41.46 × 10−32.00 × 10−72.00 × 10−43.22 × 10−71.61 × 10−60.00 × 10−00.00 × 10−02.69 × 10−48.96 × 10−4
0.5%1.79 × 10−44.48 × 10−37.50 × 10−77.50 × 10−44.75 × 10−72.38 × 10−63.72 × 10−69.31 × 10−43.16 × 10−41.05 × 10−3
1.0%3.59 × 10−48.98 × 10−31.51 × 10−61.51 × 10−39.47 × 10−74.74 × 10−66.01 × 10−61.50 × 10−34.71 × 10−41.57 × 10−3
1.5%5.49 × 10−41.37 × 10−32.27 × 10−62.27 × 10−31.43 × 10−67.16 × 10−67.12 × 10−61.78 × 10−31.51 × 10−35.03 × 10−3
Table 6. Geo-accumulation indices of metals treated by two different sewage sludge types at varying levels.
TreatmentsLevelsCuCdNiPbZn
WSSRDF0.92−0.560.130.070.15
0.5%0.9511.140.150.250.16
1.0%0.98F.260.170.270.17
1.5%1.0028.290.180.290.18
ISSRDF0.89−3.510.110.070.15
0.5%0.930.000.160.340.21
1.0%0.985.010.170.380.23
1.5%0.997.210.190.400.24
Table 7. Contamination factor values of metals treated by two different sewage sludge types at varying levels.
TreatmentsLevelsCuCdNiPbZn
WSSRDF1.180.890.750.050.05
0.5%1.341.361.250.260.07
1.0%1.552.641.900.310.09
1.5%1.712.552.300.380.10
ISSRDF1.050.800.500.050.05
0.5%1.240.911.400.640.20
1.0%1.531.091.900.900.29
1.5%1.611.182.401.050.38
Table 8. Soil contamination classification on the basis of Igeo and CF.
Igeo ClassificationCF Classification
ClassValueSoil QualityCF ValueContamination Level
0Igeo ≤ 0Practically uncontaminatedCF < 0No contamination
10 < Igeo < 1Uncontaminated to moderately contaminated0 < CF < 1None to medium
21 < Igeo < 2Moderately contaminated1 < CF < 2Moderate
32 < Igeo < 3Moderately to heavily contaminated2 < CF < 3Moderate to strong
43 < Igeo < 4Heavily contaminated3 < CF < 4Strongly polluted
54 < Igeo < 5Heavily to extremely contaminated4 < CF < 5Strong to very strong
65 < IgeoExtremely contaminated5 < CF < 6Very strong
Publisher’s Note: MDPI stays neutral with regard to jurisdictional claims in published maps and institutional affiliations.

