
Evaluation of Sustainable Development of Tourism Cities Based on SDGs and Tourism Competitiveness Index: Analysis of 221 Prefecture-Level Cities in China


Abstract
:1. Introduction
2. Materials and Methods
2.1. Data and Study Area
2.2. Research Methods
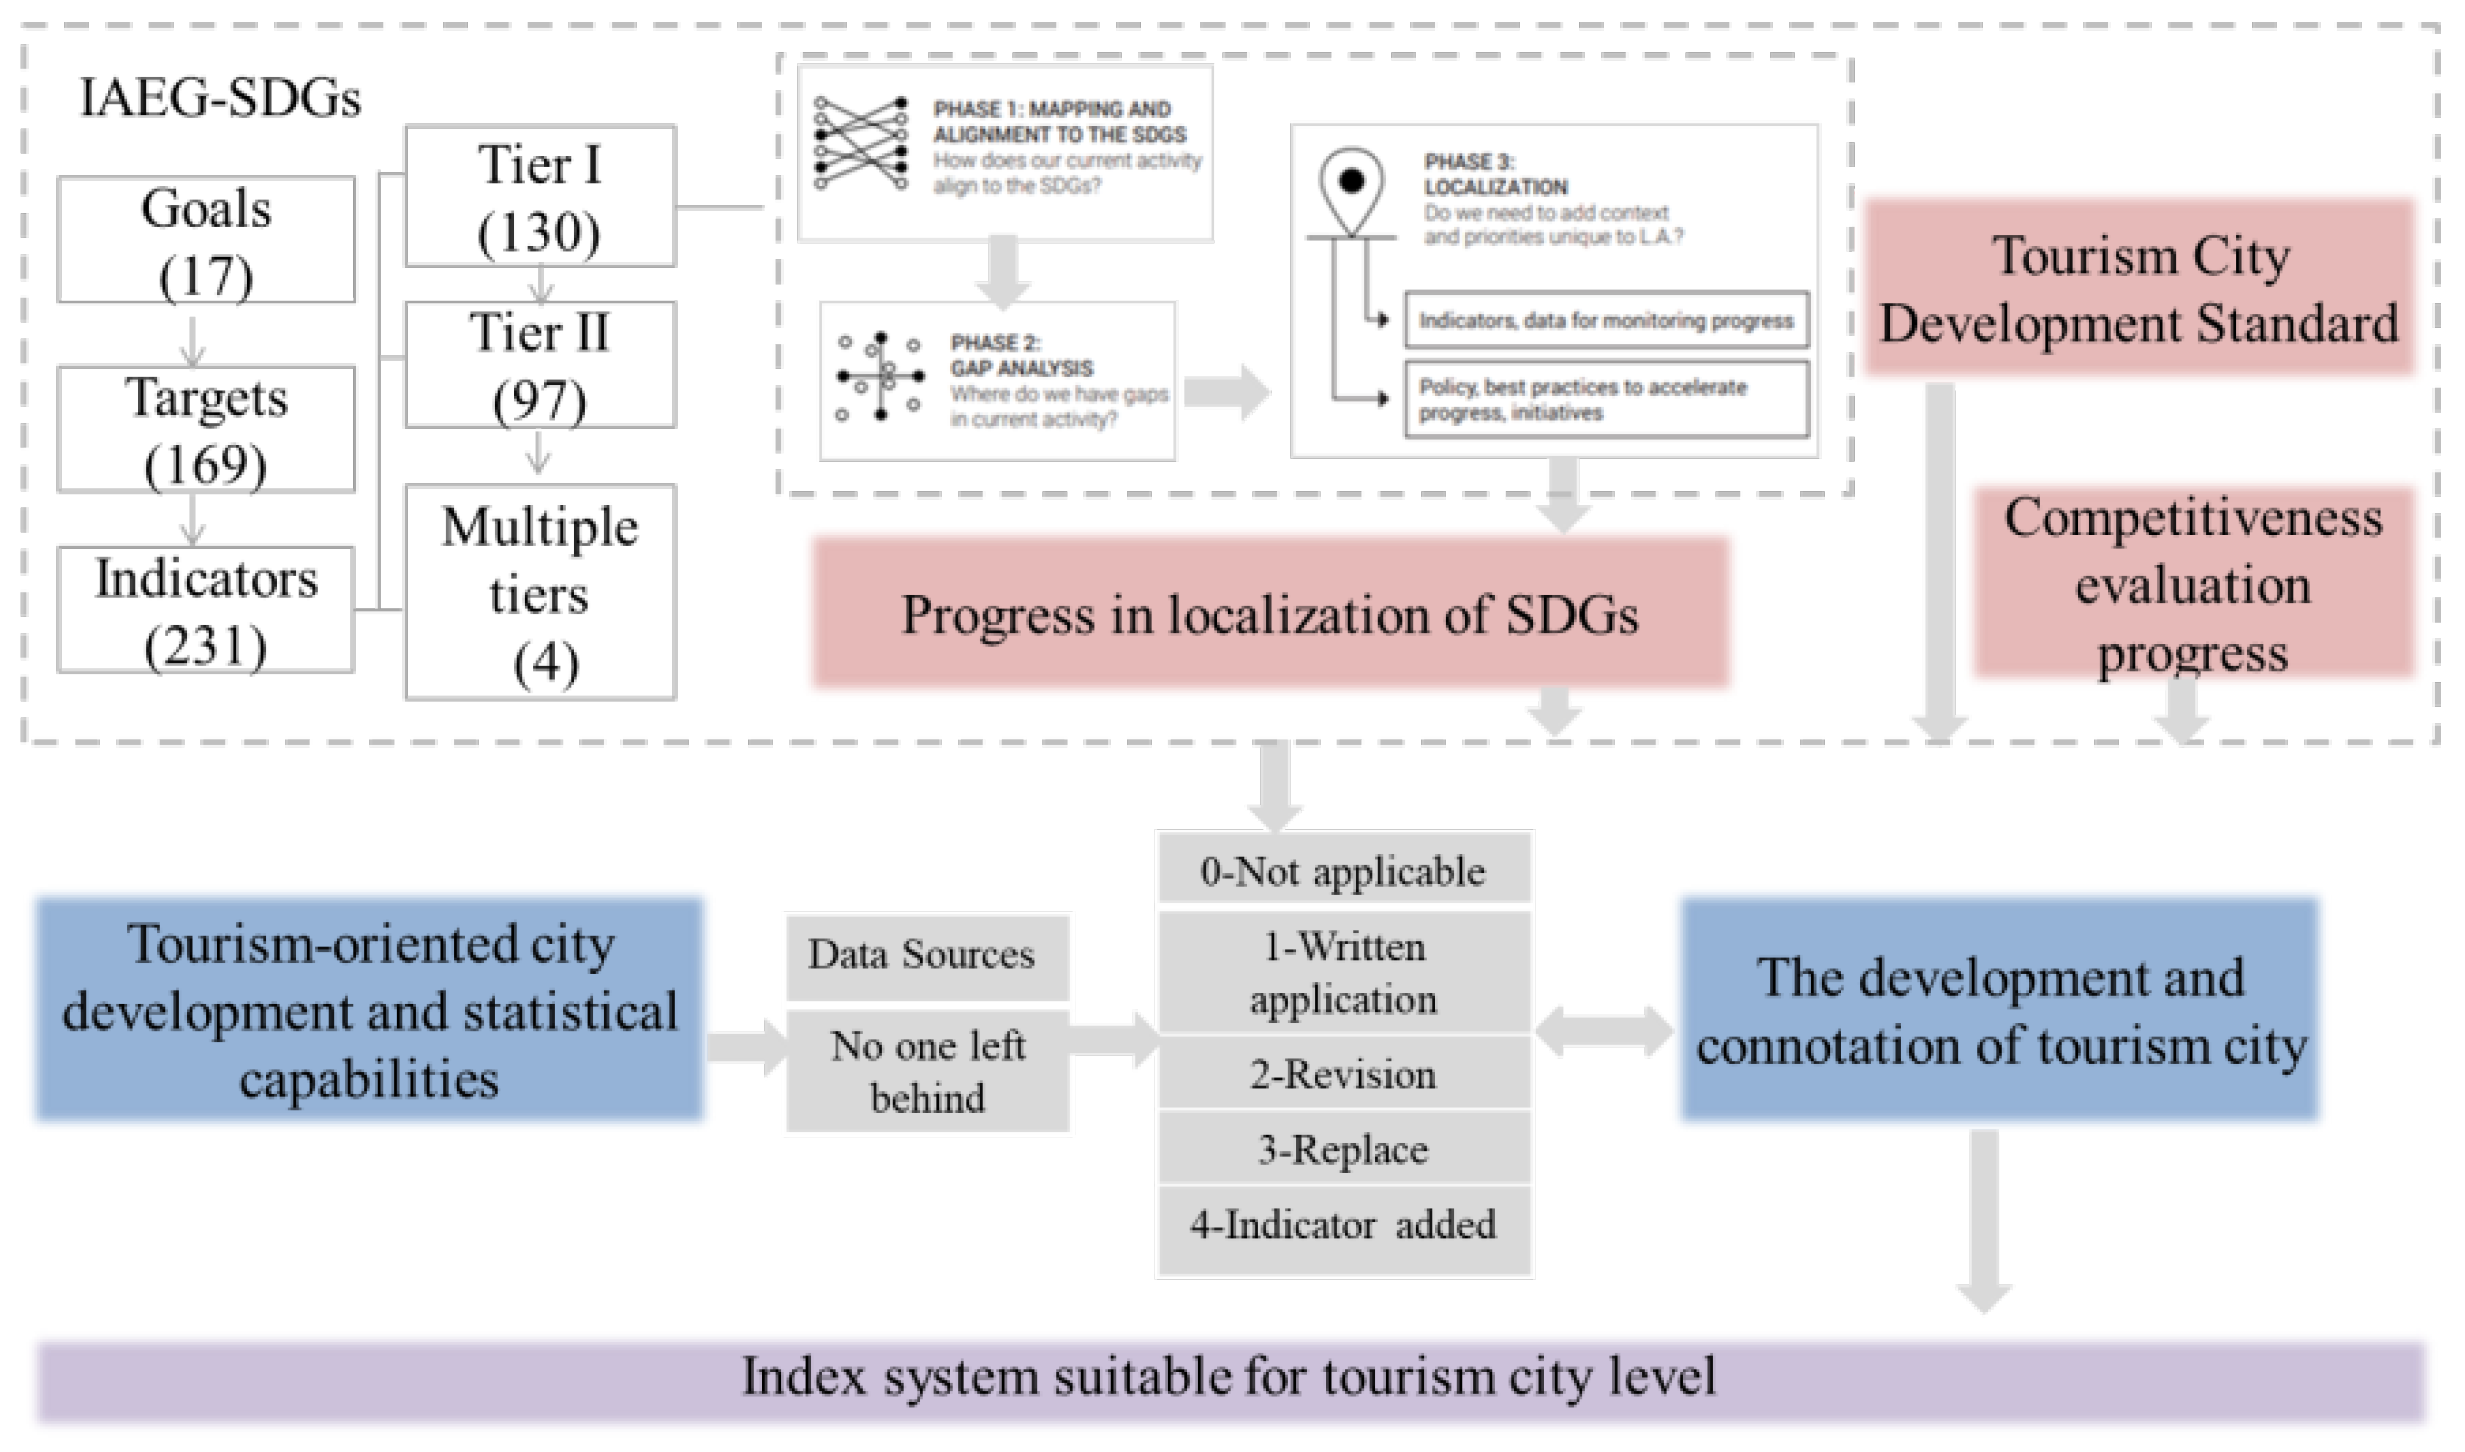
2.3. Evaluation Index System of Sustainable Development of Tourism Cities Based on SDGs and Tourism Competitiveness Index
2.4. Standardization and Weights
2.4.1. Standardization of Indicators
2.4.2. Weight Calculation
2.5. Calculation of Sustainable Development Level of Tourism Cities Based on SDGs and Tourism Competitiveness Index
2.6. Three-Axis and Eight-Zone Classification Assessment
2.7. Multiple Linear Regression Model
3. Results
3.1. Influence Weights of Each Indicator
3.2. Overall Result
3.2.1. Overall Score
3.2.2. Sustainability Level
3.3. Results and Analysis of the Eight Economic Zones
3.4. Three-Axis, Eight-Zone Division Results and Analysis
3.5. Validation and Result Analysis of Multiple Linear Regression Model
4. Discussion
4.1. Further Discussion
4.1.1. Comparative Analysis with SDG Index and Dashboards
4.1.2. Comparative Analysis with the Travel and Tourism Competitiveness Index
4.2. Policy Implications
4.3. Limitations and Future Research Direction
5. Conclusions
Author Contributions
Funding
Institutional Review Board Statement
Informed Consent Statement
Data Availability Statement
Acknowledgments
Conflicts of Interest
References
- China Environment News. Towards the 21st World-A Literature Compilation of the United Nations Conference on Environment and Developmen; China Environmental Science Press: Beijing, China, 1992; pp. 15–17. [Google Scholar]
- United Nations. SDG Indicators: Global indicator framework for the Sustainable Development Goals and targets of the 2030 Agenda for Sustainable Development; United Nations: New York, NY, USA, 2018; pp. 3–15. [Google Scholar]
- The Inter-Agency and Expert Group on SDG Indicators. Global Indicator Framework for the Sustainable Development Goals and Targets of the 2030 Agenda for Sustainable Development. Available online: https://unstats.un.org/sdgs/indicators/indicators-list/ (accessed on 1 February 2020).
- UN General Assembly. Political Declaration of the High-Level Political Forum on Sustainable Development Convened under the Auspices of the General Assembly. Available online: https://undocs.org/en/A/RES/74/4 (accessed on 21 September 2019).
- Satterthwaite, D. Successful, safe and sustainable cities: Towards a new urban agenda. Commonw. J. Local Gov. 2016, 19, 3–18. [Google Scholar] [CrossRef] [Green Version]
- Global Taskforce of Local and Regional Governments. UN-Habitat, UNDP. Roadmap for Localizing the SDGs: Implementation and Monitoring at Subnational Level. Available online: https://www.uclg.org/sites/default/files/roadmap_for_localizing_the_sdgs_0.pdf (accessed on 20 July 2016).
- Croese, S.; Green, C.; Morgan, G. Localizing the sustainable development goals through the lens of urban resilience: Lessons and learnings from 100 resilient cities and cape town. Sustainability 2020, 12, 550. [Google Scholar] [CrossRef] [Green Version]
- International Council for Science. A Guide to “SDG” Interactions: From Science to Implementation; International Council for Science: Paris, France, 2017; pp. 16–25. [Google Scholar]
- Liu, J.; Hull, V.; Godfray, H.C.J.; Tilman, D.; Gleick, P.; Hoff, H.; Pahl-Wostl, C.; Xu, Z.; Chung, M.G.; Sun, J.; et al. Nexus approaches to global sustainable development. Sustainability 2018, 1, 466–476. [Google Scholar] [CrossRef]
- Tseng, M.-L.; Wu, K.-J.; Lee, C.-H.; Lim, M.K.; Bui, T.-D.; Chen, C.-C. Assessing sustainable tourism in Vietnam: A hierarchical structure approach. J. Clean. Prod. 2018, 195, 406–417. [Google Scholar] [CrossRef]
- Savage, V.R.; Huang, S.; Chang, T.C. The Singapore river thematic zone: Sustainable tourism in an urban context. J. Geogr. Sci. 2004, 170, 212–225. [Google Scholar] [CrossRef]
- Lee, C.-F.; Huang, H.-I.; Yeh, H.-R. Developing an evaluation model for destination attractiveness: Sustainable forest recreation tourism in Taiwan. J. Sustain. Tour. 2010, 18, 811–828. [Google Scholar] [CrossRef]
- Wang, H. Study on the Sustainable Development of Small and Medium-Sized Tourism Cities. Ph.D. Thesis, Central China Normal University, Wuhan, China, 1 May 2014. [Google Scholar]
- Li, Y.X. Sustainable Development and Image Perception Analysis of Lijiang Urban Tourism under the Goal of Ring Model. Ph.D. Thesis, Yunnan University, Kunming, China, 1 May 2017. [Google Scholar]
- Yin, F.X. The construction of international tourist cities under the guidance of the concept of sustainable development. Managers 2009, 17, 358. [Google Scholar]
- Pérez, V.; Hernández, A.; Guerrero, F.; León, M.A.; Da Silva, C.L.; Caballero, R. Sustainability ranking for Cuban tourist destinations based on composite indexes. Soc. Indic. Res. 2015, 129, 425–444. [Google Scholar] [CrossRef]
- Blancas, F.; Lozano, M.G.; González, M.; Caballero, R. Sustainable tourism composite indicators: A dynamic evaluation to manage changes in sustainability. J. Sustain. Tour. 2016, 24, 1403–1424. [Google Scholar] [CrossRef]
- Crouch, G.I. Destination competitiveness: An analysis of determinant attributes. J. Travel Res. 2010, 50, 27–45. [Google Scholar] [CrossRef]
- Bornhorst, T.; Ritchie, J.B.; Sheehan, L. Determinants of tourism success for DMOs & destinations: An empirical examination of stakeholders’ perspectives. Tour. Manag. 2010, 31, 572–589. [Google Scholar] [CrossRef]
- Dwyer, L.; Cvelbar, L.K.; Edwards, D.; Mihalic, T. Fashioning a destination tourism future: The case of Slovenia. Tour. Manag. 2012, 33, 305–316. [Google Scholar] [CrossRef]
- Sainaghi, R.; Phillips, P.; Zavarrone, E. Performance measurement in tourism firms: A content analytical meta-approach. Tour. Manag. 2017, 59, 36–56. [Google Scholar] [CrossRef]
- Mendola, D.; Volo, S. Building composite indicators in tourism studies: Measurements and applications in tourism destination competitiveness. Tour. Manag. 2017, 59, 541–553. [Google Scholar] [CrossRef]
- City Department of Los Angeles. Sustainable Development Goals: A Local Review of Progress in 2019; City Department of Los Angeles: Los Angeles, LA, USA, 2020; p. 58. [Google Scholar]
- Organization for Economic Cooperation and Development. Measuring Distance from Sustainable Development Goals: Assessment of the Process of Achieving SDGs in OECD Countries in 2019; Organization for Economic Cooperation and Development: Paris, France, 2019; p. 58. [Google Scholar]
- The Economic and Social Commission for Asia and the Pacific. Asia and the Pacific SDG Progress Report 2019; The Economic and Social Commission for Asia and the Pacific: New York, NY, USA, 2019; p. 67. [Google Scholar]
- Statistical Office of the European Communities. EU SDG Indicator set 2019: Result of the Review in Preparation of the 2019 Edition of the EU SDG Monitoring Report; Statistical Office of the European Communities: Brussels, Belgium, 2019; pp. 17–19. [Google Scholar]
- The Japanese Government. Japan’s Voluntary National Review Report on the Implementation of the Sustainable Development Goals; The Japanese Government: Tokyo, Japan, 2017; p. 27.
- Federal Government of Germany. German Sustainable Development Strategy 2016; Federal Government of Germany: Berlin, Germany, 2017; pp. 12–13.
- Monash Sustainable Development Institute. Transforming Australia SDG Progress Report: 2020 Update; Monash Sustainable Development Institute: Monash, Australia, 2020; pp. 67–89. [Google Scholar]
- SDSN; BERTELSMANNS. The 2019 SDG Index and Dashboards Report for European Cities; SDSN: New York, NY, USA, 2019; pp. 26–35. [Google Scholar]
- SDSN; BERTELSMANNS. The 2019 Italian Cities Sustainable Development Report; SDSN: New York, NY, USA, 2019; pp. 15–20. [Google Scholar]
- Institute for Global Environmental Strategies, City of Turku. The Implementation of the 2030 Agenda for Sustainable Development in the City of Turku; Institute for Global Environmental Strategies: Kanagawa, Japan, 2020; pp. 43–60. [Google Scholar]
- City Department of Mannheim. The Implementation of the UN SDGs in Mannheim; City Department of Mannheim: Mannheim, Germany, 2019; pp. 16–18. [Google Scholar]
- Sydney Government. City of Sydney Community Wellbeing Indicators; Sydney Government: Sydney, Australia, 2019; pp. 36–58.
- Institute for Global Environmental Strategies. Shimokawa the Sustainable Development goals Report 2018; Institute for Global Environmental Strategies: Kanagawa, Japan, 2018; pp. 13–16. [Google Scholar]
- SDSN; BERTELSMANNS. 2018 SDG Index and Dashboards Report; SDSN: New York, NY, USA, 2018; p. 11. [Google Scholar]
- Zhu, D.J. Pursue the goal of sustainable development within the "planetary boundary. Econ. Guide Sustain. Dev. 2019, 7, 53–56. [Google Scholar]
- Pulido-Fernández, J.I.; Rodríguez-Díaz, B. Reinterpreting the World Economic Forum’s global tourism competitiveness index. Tour. Manag. Perspect. 2016, 20, 131–140. [Google Scholar] [CrossRef]
- Chen, H.G.; Li, X.N.; Li, C.Y. Evaluation of resilience of water resources system based on entropy method of coefficient of variation-A case study of water resources in Heilongjiang Province from 2007 to 2016. Ecol. Econ. 2021, 37, 179–184. [Google Scholar]
- Gong, X.; Zheng, C.D.; Xiao, Y.R. A study on the income growth of farmers and herdsmen in Tibet from the perspective of green de-velopment-- based on multiple linear regression analysis. Tibet. Stud. 2018, 6, 131–138. [Google Scholar]
- Shi, H.J. Research on low-carbon consumption behaviors and influencing factors of urban residents: A case study of Fuzhou, Fujian Province. Resour. Sci. 2015, 37, 308–317. [Google Scholar]
- Zhou, Q.; Wu, Y.H.; Dong, Z.F.; Li, H.X.; Ge, C.Z. Analysis and revelation of the 2017 global sustainable development goals index and dashboard report. Environ. Prot. 2018, 46, 63–69. [Google Scholar]
- World Economic Forum. The Travel & Tourism Competitiveness Report 2019-Travel and Tourism at Tipping Point; World Economic Forum: Geneva, Switzerland, 2020; pp. 25–31. [Google Scholar]


| Element Indicators | Specific Indicators | SDG | |
|---|---|---|---|
| Resource abundance (A1I) | Heritage index (A10) P | 11 | 11.4 |
| Scenic spot index (A11) P | 15 | 15.1 | |
| Resource influence (A1II) | Network fever (A12) P | 12 | 12b |
| City well-known index (A13) P | 12 | 12b | |
| Resource protection (A2I) | Percentage of forest area in total land area (%) (A20) P | 15 | 15.1 |
| Nature reserve coverage index (A21) P | 14, 15 | 14.5, 15.5 | |
| Urban greening index (A22) P | 11 | 11.7 | |
| Total expenditure per capita for preservation, protection, and conservation of cultural and natural heritage (international dollar/person) (A23) P | 11 | 11.4 | |
| Ecological environment quality (A3I) | Annual average concentration of PM2.5 (μg/m3) (A30) N | 11 | 11.6 |
| Proportion of days with good air quality (%) (A31) P | 3, 11 | 3.9, 11.6 | |
| Proportion of water bodies with good environmental quality (%) (A32) P | 3, 6 | 3.9, 6.3 | |
| Ecological index (A33) P | 15 | 15.1 | |
| Ecological environment control (A3II) | Proportion of safe treatment of waste water (%) (A34) P | 6 | 6.3 |
| Rate of harmless treatment of municipal solid waste (%) (A35) P | 11 | 11.6 | |
| Greenhouse gas emission intensity (ton carbon dioxide equivalent/international dollar) (A36) N | 9, 13 | 9.4, 13.1 | |
| Development and utilization of natural and cultural resources (B1I) | Natural and cultural resource development and utilization index (B10) P | 11 | 11.4 |
| Tourism service infrastructure (B2I) | Tourism infrastructure index (B20) P | 9 | 9.1 |
| Number of public transportation vehicles per 10,000 people (vehicles/10,000 people) (B21) P | 11 | 11.2 | |
| Road density (km/km2) (B22) I | 9 | 9.1 | |
| Cultural and stylistic infrastructure (B2II) | Cultural and sports facilities index (B23) P | 11 | 11.7 |
| Intelligent tourism facilities (B2III) | Number of wisdom scenic spots (unit) (B24) P | 9 | 9c |
| Tourism economic performance (B3I) | Per capita tourism consumption expenditure (10,000 international dollar/person) (B30) P | 8 | 8.9 |
| Per capita tourist reception (person-times/person) (B31) P | 8 | 8.9 | |
| Average annual growth rate of tourism income (%) (B32) P | 8 | 8.9 | |
| Contribution of tourism economy (B3II) | Proportion of GDP directly from tourism (%) (B33) P | 8 | 8.9 |
| Sustainability of resource utilization (B4I) | Land development utilization rate (%) (B40) M | 11 | 11.3 |
| Water resource development and utilization rate (%) (B41) M | 6 | 6.4 | |
| Tourism carrying capacity (B4II) | Intensity of tourist space utilization (B42) | 12 | - |
| Proportion of scenic spots exceeding maximum carrying capacity on holidays (%) (B43) N | 12 | - | |
| Tourism environmental carrying capacity (B44) M | 12 | - | |
| Macroeconomic stability (C1I) | GDP per capita (international dollar/person) (C10) P | 8 | 8.2 |
| Annual GDP growth rate (%) (C11) P | 8 | 8.1 | |
| Financial self-sufficiency rate (%) (C12) | 8 | - | |
| International openness (C1II) | Proportion of foreign direct investment in GDP (%) (C13) P | 17 | - |
| Freedom of trade (%) (C14) P | 17 | 17.4 | |
| Industrial structure (C1III) | Proportion of tertiary industry (%) (C15) I | 9 | - |
| Tourism safety and health care (C2I) | Mortality due to road traffic injuries (%) (C20) N | 3 | 3.6 |
| Density of health workers (per thousand) (C21) P | 3 | 3.8 | |
| Resource communication readiness (C2II) | Percentage of population covered by mobile network (%) (C22) P | 9 | 9.c |
| Social stability (C2III) | Unemployment rate (%) (C23) N | 8 | 8.5 |
| Income gap between urban and rural residents (C24) M | 10 | 10.1 | |
| Proportion of expenditure on basic services (education, health, social protection) in total government expenditure (%) (C25) P | 1 | 1.a | |
| Administrative governance (C3I) | Number of law enforcement inspections in tourism market (times/year) (C30) P | 16 | 16.6 |
| Rate of tourism complaint resolution (%) (C31) P | 16 | 16.3 | |
| Rule of law (C3II) | Number of sustainable tourism strategies or policies and action plans implemented using agreed monitoring and evaluation tools (unit) (C32) P | 12 | 12b |
| Association governance (C3III) | Number of tourist associations (unit) (C33) P | 12 | 12b |
| Category | Number of Tourism Cities | Features (A-B-C) | Internal State |
|---|---|---|---|
| I | 44 | Low-low-low | Low |
| II | 24 | Low-low-high | Primary transformation |
| III | 14 | Low-high-low | Primary transformation |
| IV | 28 | Low-high-high | Advanced transformation |
| V | 30 | High-low-low | Primary transformation |
| VI | 13 | High-low-high | Advanced transformation |
| VII | 22 | High-high-low | Advanced transformation |
| VIII | 46 | High-high-high | High |
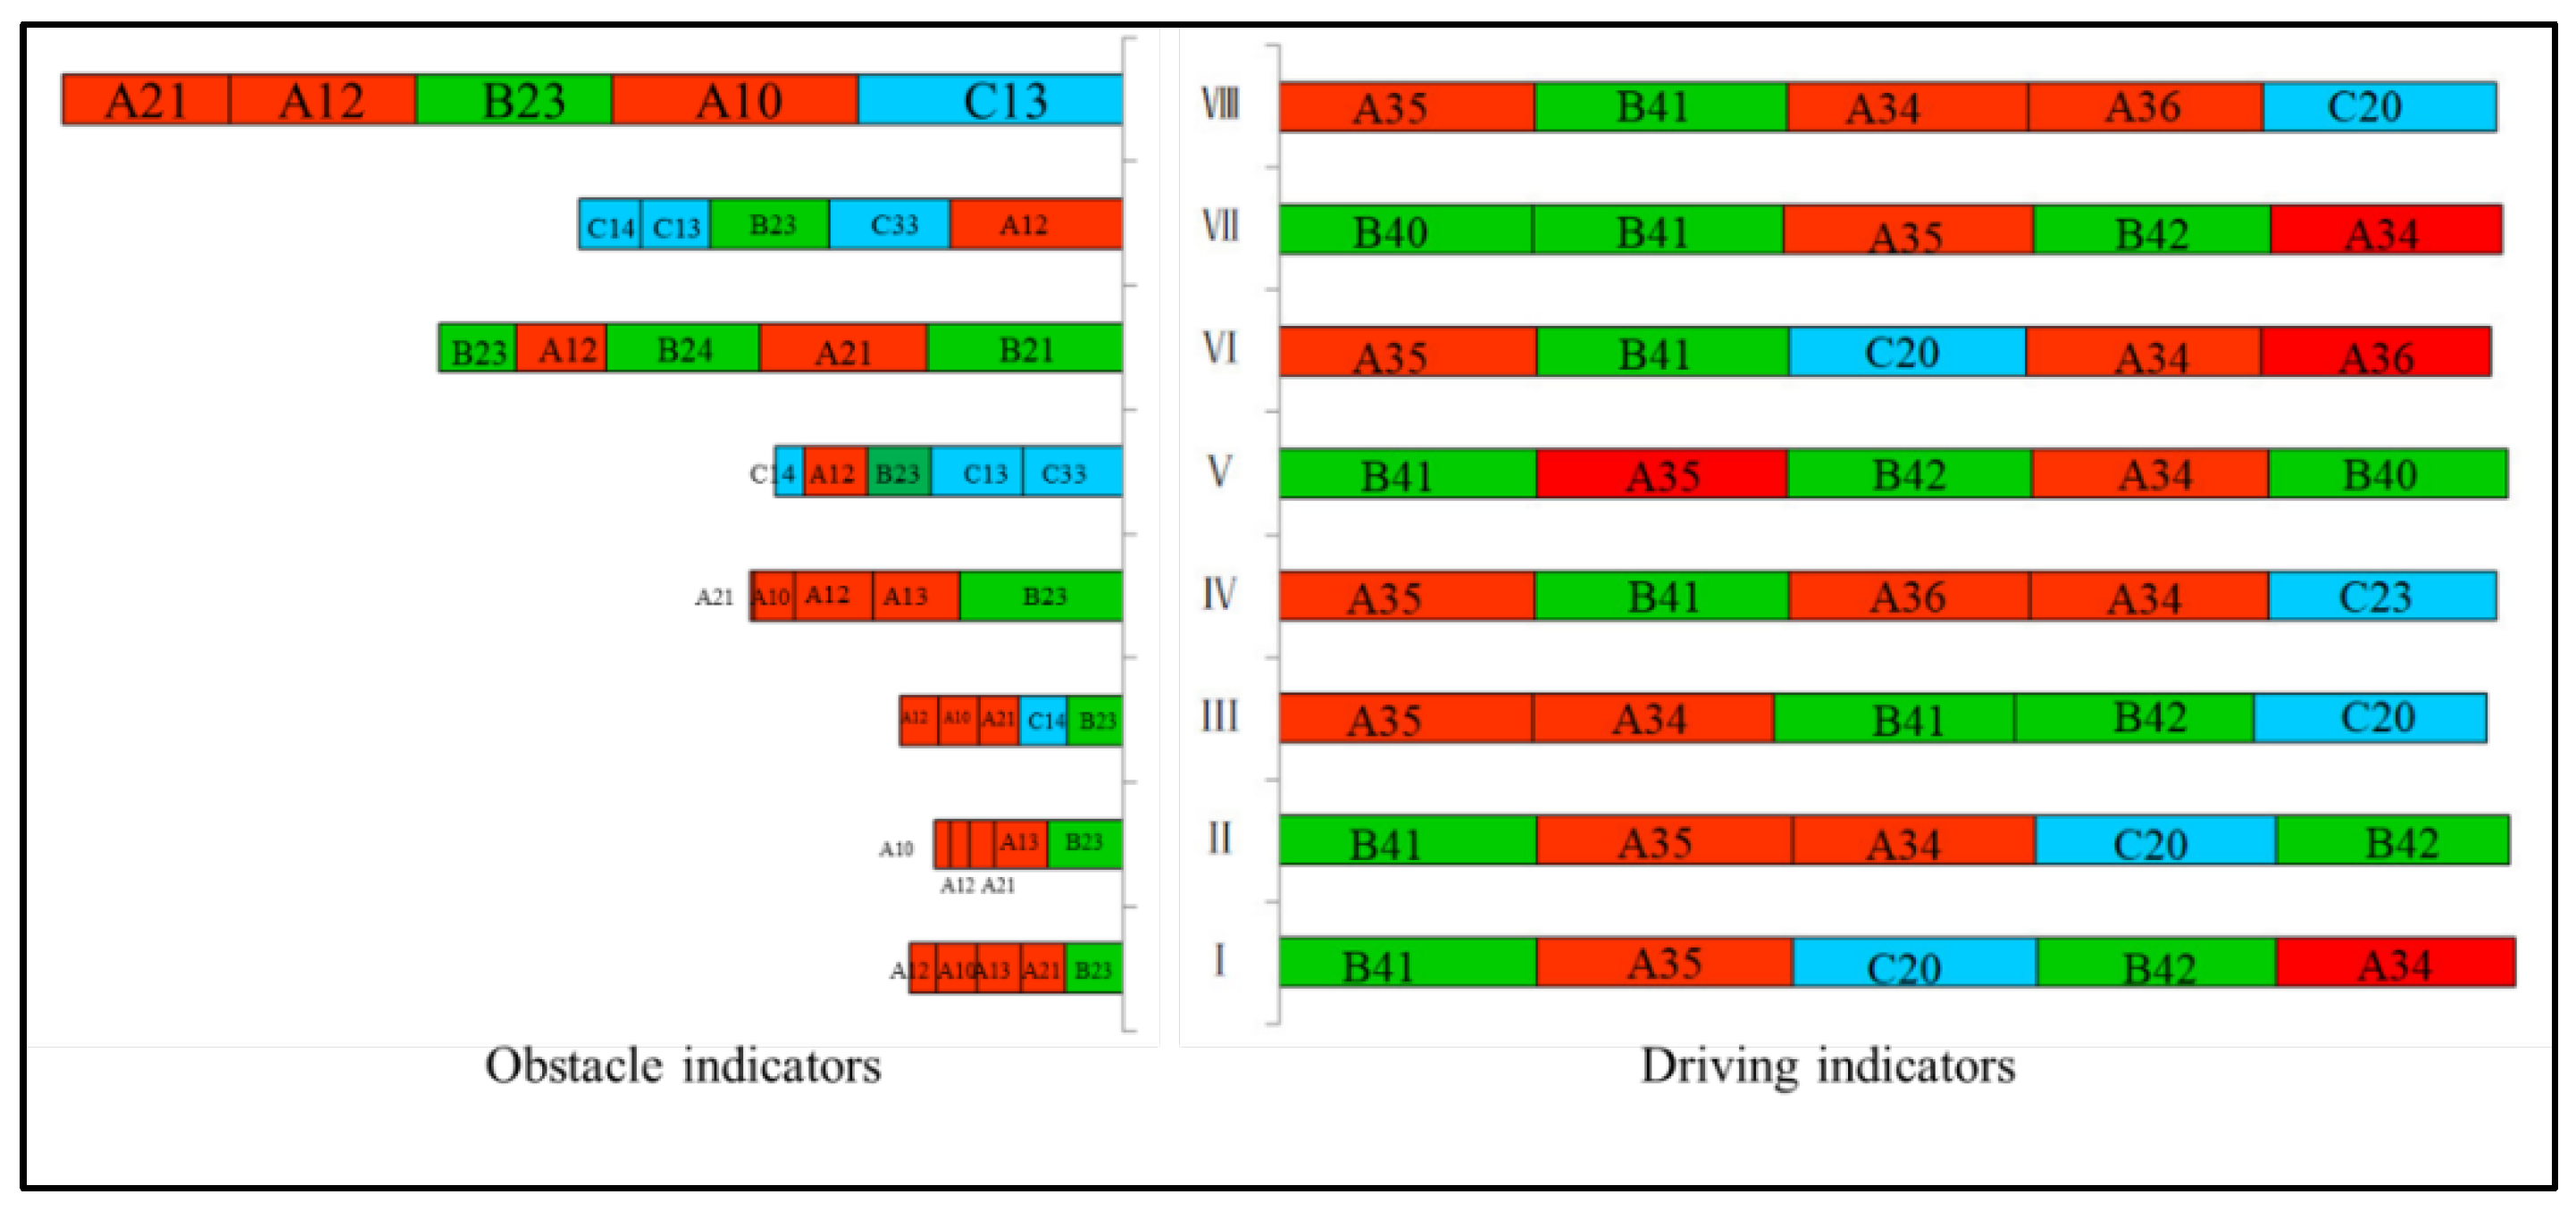
| Category | TOCSD-Specific Indicators | A-Specific Indicators | B-Specific Indicators | C-Specific Indicators |
|---|---|---|---|---|
| I | C22(0.489),A30(0.342), C25(0.310),C13(0.266) | A21(0.646),A10(0.552),A13(0.465), A20(0.465),A12(0.353) | B32(0.575),B10(0.567),B21(0.490), B30(0.487),B22(0.472) | C11(0.330) |
| II | A31(0.575) | A20(0.501),A36(0.362),A21(0.290), A11(0.289),A13(0.272) | B10(0.438),B23(0.223),B22(0.474), B24(0.360),B31(0.259) | C14(0.7878),C13(0.694),C33(0.344), C10(0.214),C22(0.092) |
| III | B24(0.553),C33(0.214), B32(0.168),A22(0.089) | A13(1.155),A31(0.920) | B10(0.607) | C11(0.546),C12(0.672),C25(0.387) |
| IV | A30(0.726),A13(0.543), A10(0.440),C22(0.237) | A12(0.689),A10(0.643),A30(0.415) | B24(0.994),B21(0.631),B10(0.419), B40(0.190),B23(0.439) | C14(0.486),C33(0.403),C10(0.187), C13(0.337),C22(0.176),C12(0.174) |
| V | A10(0.461),C14(0.415) | A12(0.458),A10(0.541),A21(0.478), A13(0.345),A35(0.245),A31(0.215) | B31(0.814),B22(0.745),B40(0.400), B32(0.390) | C13(0.852),C14(0.315),C25(0.276), C21(0.231) |
| VI | A30(1.001) | A10(0.833),A21(0.930),A12(0.279), A13(0.466),A20(0.277),A31(0.129) | B24(0.108) | C14(0.450),C21(0.225),C13(0.460), C33(0.357) |
| VII | A30(1.211),C20(0.818), B10(0.356) | A30(0.876) | B10(0.508) | C20(0.716),C23(0.550),C25(0.482) |
| VIII | B24(0.342),C22(0.326) | A21(0.643),A13(0.343),A12(0.363), A10(0.387),A20(0.147),A11(0.118) | B24(0.577),B23(0.267),B10(0.322), B32(0.124),B31(0.153) | C14(0.509),C33(0.426),C10(0.191), C13(0.213),C22(0.083),C24(0.087) |
 |  |  |  |  |  |  |  |  |  |  |  |  |  |  |  |  |  |
| China national dashboard (SDSN) | 99.70 | 71.50 | 80.00 | 73.80 | 75.60 | 89.90 | 69.10 | 83.10 | 58.70 | 59.60 | 69.20 | 73.20 | 69.30 | 33.50 | 58.60 | 72.50 | 53.60 |
| Tourism city dashboard | 57.36 | - | 61.10 | - | - | 86.62 | - | 48.19 | 48.30 | 52.37 | 51.97 | 44.62 | 81.44 | - | 46.10 | - | 15.31 |
| - | - | - | - | - | - | - |
| System | Enabling Environment | T&T Policy and Enabling Conditions | Infrastructure | Natural and Cultural Resources | ||||||||||
|---|---|---|---|---|---|---|---|---|---|---|---|---|---|---|
| Pillar | Business Environment | Safety and Security | Health and Hygiene | Human Resources and Labor Market | ICT Readiness | Prioritization of Travel and Tourism | International Openness | Price Competitiveness | Environmental Sustainability | Air Transport Infrastructure | Ground and Port Infrastructure | Tourist Service Infrastructure | Natural Resources | Cultural Resources and Business Travel |
| China’s tourism competitiveness (WEF) | 67.14 (4.7/7) | 80.00 (5.6/7) | 80.00 (5.6/7) | 74.29 (5.2/7) | 71.43 (5.0/7) | 68.57 (4.8/7) | 44.29 (3.1/7) | 81.43 (5.7/7) | 54.29 (3.8/7) | 61.43 (4.3/7) | 55.71 (3.9/7) | 50.00 (3.5/7) | 72.86 (5.1/7) | 100 (7.0/7) |
| Pillar | A1 | A2 | A3 | B1 | B2 | B3 | B4 | C1 | C2 | C3 | - | - | - | - |
| TOSDL | 34.86 | 40.06 | 80.97 | 21.66 | 29.25 | 35.33 | 91.54 | 39.11 | 56.67 | 16.18 | - | - | - | - |
| Category | Improvement Path and Suggestions |
|---|---|
| I | Consolidate foundation of economic and social development, prioritize construction of local cultural and sports infrastructure, and gradually improve speed and quality of tourism development. |
| II | Ensure macroeconomic stability, improve international openness, increase the rate of local financial self-sufficiency, improve local air quality, and promote the rapid development of tourism economy. |
| III | To enable the development of tourism economy to drive the development of natural and cultural resources and social and economic development, increase the rate of local financial self-sufficiency, and promote macroeconomic stability. |
| IV | Increase the development and utilization of natural cultural resources and the quality of environmental protection, reduce greenhouse gas emissions, increase the influence and popularity of cultural tourism resources, and further explore the development of urban smart tourism. |
| V | Consolidate the foundation of economic and social development, improve the development, utilization and protection of rich natural and cultural resources, improve the international openness of cities, and strengthen inter-regional exchanges and cooperation. |
| VI | Attach importance to the treatment and disposal of local water bodies and solid wastes, improve the level of ecological environment management, improve the preparation of resources and communications, and promote the coverage of mobile internet. |
| VII | With a better basis for development and conservation of natural resources and current situation of tourism economic development, steadily increase per capita GDP, support overall promotion of social and economic development. |
| VIII | Optimize the quality of tourism development. Increase publicity and the building of cultural tourism brands, enhance the visibility of the city, and increase investment in the construction of cultural and sports facilities and intelligent facilities while ensuring macroeconomic stability. |
Publisher’s Note: MDPI stays neutral with regard to jurisdictional claims in published maps and institutional affiliations. |
© 2021 by the authors. Licensee MDPI, Basel, Switzerland. This article is an open access article distributed under the terms and conditions of the Creative Commons Attribution (CC BY) license (https://creativecommons.org/licenses/by/4.0/).
Share and Cite
Gao, J.; Shao, C.; Chen, S.; Wei, Z. Evaluation of Sustainable Development of Tourism Cities Based on SDGs and Tourism Competitiveness Index: Analysis of 221 Prefecture-Level Cities in China. Sustainability 2021, 13, 12338. https://doi.org/10.3390/su132212338
Gao J, Shao C, Chen S, Wei Z. Evaluation of Sustainable Development of Tourism Cities Based on SDGs and Tourism Competitiveness Index: Analysis of 221 Prefecture-Level Cities in China. Sustainability. 2021; 13(22):12338. https://doi.org/10.3390/su132212338
Chicago/Turabian StyleGao, Junli, Chaofeng Shao, Sihan Chen, and Zizhang Wei. 2021. "Evaluation of Sustainable Development of Tourism Cities Based on SDGs and Tourism Competitiveness Index: Analysis of 221 Prefecture-Level Cities in China" Sustainability 13, no. 22: 12338. https://doi.org/10.3390/su132212338
APA StyleGao, J., Shao, C., Chen, S., & Wei, Z. (2021). Evaluation of Sustainable Development of Tourism Cities Based on SDGs and Tourism Competitiveness Index: Analysis of 221 Prefecture-Level Cities in China. Sustainability, 13(22), 12338. https://doi.org/10.3390/su132212338