Abstract
Practices and research on measuring traditionally urban sustainability abound, therefore the challenge now is related to how the urban carbon issues are included into current measuring methods, thus there is a need to develop methods for measuring urban low-carbon sustainability. In this paper, a simple method, which is based on low-carbon sustainability index, is developed. The overall urban low-carbon sustainability index is the weighted sum of 11 single indices, and each single index is defined as the indicator assessing the development level against the baseline. The baseline is often the criteria or the minimum requirement of low-carbon sustainability. Case studies in four Chinese cities have put this method into practice, and the results show that all four selected cities fail to pass the testing of sensible low-carbon sustainability rule and they are all in weakly low-carbon sustainable development. Although the four cities have made great progress in their capacity building on pollution control and their capacities on wastewater treatment, main pollutants’ removal and household and hazardous wastes treatment are enough to meet the needs of local development, they are all facing the great challenges on using of sustainable energy, offsetting of CO2 emissions and adoptions of nature-based solutions. The method developed by this research is a useful tool for decision makers identifying whether the local development is not on a low-carbon sustainable path.
1. Introduction
Large and diverse literature has emerged concerning the measurement of urban sustainability. As a result, many indicators have been suggested to cope with the inherent complex, uncertain, multidimensional, inter-disciplinary and horizontal characteristics of urban sustainable development process at international, national and local levels [1,2,3,4,5]. For measuring urban sustainability, many indices have been developed and are increasingly becoming popular tools for monitoring the progress towards sustainable development and in the formulation of efficient policies in the last two decades. Integrated information on urban sustainability can be obtained by means of urban sustainability index [6,7,8]. An integrated index can transform a large number of data and other indicators into usable information for decision makers. Access to sources of data on sustainable development and disposing of such information at the right time and at the right cost is critical.
Until now urban sustainability measurement has been mostly focused on natural resources, urban development and urban environmental issues. Far less attention has been given to low-carbon and urban resilience issues [9]. In order to support local decision-makers to identify whether local development is in its pathway to a low-carbon sustainable development, analytical framework and related quantitative analytical tools are needed to determine the influences of development on environment and climate change. Thus, recent studies have developed methodologies for measuring urban resilience and low-carbon sustainability [9,10].
Challenges remain in measuring urban low-carbon sustainability. The first challenge in measuring urban low-carbon sustainability is to define urban low-carbon sustainability, based on which analytical frameworks and related measuring tools can be developed. The second challenge is to identify a reference point or baseline, from which progress made to improve urban low-carbon sustainability can be assessed. Reference points or baseline in emission reduction can be easily defined; however, setting a baseline or reference point for low-carbon sustainability is much more complex [11]. The third challenge is the lack of data and methods for integrating different data sources [12]. Data collection is often expensive in terms of time and resources. Existing practices on measuring urban low-carbon sustainability are mainly applying qualitative approaches, which leads to limited acceptance of the assessment results (e.g., peer reviewed and gray literature, quantitative data with qualitative information and expert judgment). The fourth challenge is to develop and to use a harmonized methodology (e.g., common climate scenarios, metrics) and to involve stakeholders in the judgements. The last challenges include the selection of necessary indicators, aggregation of indicators into an index, linking indicators to policy implication [13].
The European Union is leading the global fight against climate change and has made it one of its top priorities. There are plenty of green policy tools for low-carbon development have been developed and are being practiced. The tool of Sustainable Energy and Climate Action Plan (SECAP) has brought the concept of urban low-carbon sustainability into practice within the European context [14]. SECAP provides a systematic, step-by-step way of addressing local energy and low carbon issues and thus provides a good demonstration for measuring urban low-carbon sustainability. We are aware of low carbon development tools developed for municipality, such as SECAP that primarily focused on climate change (both mitigation and adaptation actions). However, the starting point of this study is the current gap in research of “urban sustainability” indicators, which has so far mostly focus on environmental pollution and natural resource issues. Thus, it is important to integrated climate change-related indicators, which can be inspired from tools such as SECAP.
This paper aims to develop an urban low-carbon sustainability index, as well as an assessment method and test it in four representative small and medium-sized cities across China. The index was developed based on as few indicators as possible, but it is still sufficient to effectively measure sustainability and help policymakers at city level to assess whether urban development is low-carbon and sustainable. The index integrates carbon emission reduction. The developed method enables measurement against a specific baseline.
Two important issues have been taken into account in this research. One is to integrate carbon issues into measuring of traditional urban sustainability and the other is to measure urban low-carbon sustainability by indicators against their baseline or reference point. Our strategy is first to develop an urban low-carbon sustainability index, and secondly to test the low-carbon sustainability index in four Chinese cities, namely Qinhuangdao, Taizhou, Jiangshan and Yuhuan. Four cities are selected as representatives for small and medium-sized cities in China and spread over the country. In China’s national statistics, a small city is defined as a city with an urban population of less than 500 thousand, and a medium-sized city has the urban population between 500 thousand and 1 million.
2. Theories and Methods
2.1. Defining Urban Low-Carbon Sustainability
The concept of urban sustainability has been well developed and three aspects of economy, society and environment have been recognized as the key components of urban sustainability [15,16]. In practice, however, these three aspects are not equally addressed and more attention of international, national and local urban sustainability initiatives are paid to the environmental aspect. UN Habitat, together with the United Nations Environment Program (UNEP), initiated the sustainable cities program (SCP). SCP is also focusing on urban environment and aims to achieve good urban environmental governance [17]. Roberto et al. (1998) highlight the possible intervention policies which may be developed to achieve balanced “sustainable development” in terms of new policy principles that should govern a “sustainable city” [18]. Meine Pieter and Zhang [19] have operationalized the concept of urban sustainability within the context of China and their focus is also on the environmental aspect [19]. In this research, we address the issue of how the existing urban climate-oriented objectives can be incorporated within the traditional concept of urban sustainability.
In most emerging economies, the prevailing wisdom in development theory was that economic growth (increasing gross national product or growth rates) was the key to development [20]. There are increasing concerns about whether the existing development trajectory of the developing countries is low-carbon or even carbon-neutral [19]. Measuring urban low-carbon sustainability could provide essential information for answering this question.
Urban low-carbon sustainable development can be defined as development that ensures urban environment quality, conserves natural resources and biodiversity and achieves carbon neutrality. In practice, urban low-carbon sustainability is defined as carbon-neutral, non-declining urban environmental quality, highest efficient uses of the natural resources (e.g., consumption of renewables cannot exceed their regeneration, and consumption of non-renewables cannot exceed their target consumption and the lowest externality for the surrounding system of a specific city). Thus, urban low-carbon sustainable development is based on harmonization between urban environment and development. The harmonization level is determined by resource consumption and emissions of pollutants, wastes and carbon dioxide resulting from the socio-economic development and sustainable resource supply, pollutants’ treatment/disposal capacities and capacities of carbon captures. Thus, we define the following urban low-carbon sustainability index (K):
where:
K = D/E
- K: Urban low-carbon sustainability index or harmonious level between development and environment;
- D: Development level that is determined by resource consumption and emissions of pollutants, wastes and carbon dioxide;
- E: Environmental capacity that is determined by availability of natural resources, natural environmental purification, capacities of pollutants treatment, waste disposal and carbon offsetting.
If:
- (1)
- K ≤ 1, a city can be regarded as low-carbon sustainable development. It implies that depletion of natural resources and emissions are within the environmental capacities, which results in sustainable development; on the other hand, when K << 1, the city may be underdeveloped. This is a frequent cause of backwardness of science and technology. It is also possible in the developed world where policies favorable to the environment and low-carbon development exist. Our research suggests that K < 0.8 for developed world and K ≈ 1 for developing world are acceptable before the year of 2030.
- (2)
- K > 1, the development of a city is not low-carbon and sustainable. This situation is common in the present time, especially in developing countries and emerging economies, due to the rapid socio-economic growth and the expected living standard that of the developed countries. Meine Pieter [21] argues that the current levels of resource depletion and environmental degradation in developing countries may actually be “excessive”—a problem that stems not just from the inefficient transformation of natural capital into other forms of capital, but also from its “unsustainable” management for economic welfare.
Different values of K may be adopted by different countries or local governments based on their local socio-economic and environmental conditions. In countries or regions where economic growth is highly dependent of resource extraction, as well as processing (resource-based) and carbon-intensive processes, a higher value of K exists. A lower K appears in countries or regions where economic growth depends on low-carbon technologies.
D and E can be represented by a set of indicators discussed below. The value of index K (Ki) depends on which and how many indicators are selected. It is possible that the overall K value is less than or equal to 1, while the individual K value may be higher than 1. Thus, until now the concepts of weak, strong and sensible sustainability have emerged for measuring urban sustainability [22,23,24]. In this paper, a similar approach was defined as follows:
- (1)
- A city is low-carbon unsustainable when the overall K > 1 and any individual Ki >1.
- (2)
- A city is weakly low-carbon sustainable when the overall K > 1 and some individual Ki may be less than 1. In this case, resource depletion, environmental degradation and carbon emission can offset each other. For example, the excessive resource depletion can be offset by less pollutant emissions or carbon emissions.
- (3)
- A city is strongly low-carbon sustainable when the overall K ≤ 1 and any individual Ki ≤ 1, which means the full conservation of natural resources, non-degradation of environmental quality and carbon neutrality.
- (4)
- A city is sensibly low-carbon sustainable when the overall K ≤ 1 and any individual Ki > 1. This situation is in between the weak and strong low-carbon sustainable development and acceptable to emerging economies. In this case, the remaining challenges are to identify the key Ks.
2.2. Assessing Development Level and Environmental Capacity
A conventional way to define the progress of development is the indicator of gross national production or the gross domestic product (GDP), which is focusing on the result of development. This is not sufficient for assessing sustainability, since GDP alone monitors economic progress, while social and environmental issues are hardly included [20]. Thus, there are many researchers focused on adapting the traditional GDP to green GDP or net income in which environmental damage is excluded from the traditional GDP [19]. In this paper, the development level is defined as natural resource consumption, pollutant emissions and CO2 emission resulting from the development process. Based on the definition of urban low-carbon sustainability above and an extensive review of the literature, a list of 178 urban development indicators were identified. In order to reduce the number of indicators, we applied a pre-coded questionnaire to 24 experts and asked those 24 experts to select indicators from the database based on (1) data availability; (2) policy relevance; (3) scientific soundness and measurability and (4) standardization of definition and thus allowing comparisons among different cities. Among the 24 experts, 8 are from national level and 16 are from the four selected cities. In total, 11 indicators have passed the above principles’ test and they are presented in Table 1.

Table 1.
Indicators for identifying urban development level and environmental capacity.
The data of all 11 indicators for assessing development level and the data of most of the indicators for assessing environmental capacity are available from local social-economic-environmental statistics, except for the indicators related to the offset of CO2 emissions (3e) and nature-based solutions (NBS) (4e). Offset of CO2 emissions includes carbon capture, utilization and storage (CCUS), which remove CO2 from the atmosphere through technology solutions. Carbon sink is not considered, because carbon sink is a part of the ecosystem and is included in the natural global carbon cycle or carbon sink offsets CO2 emission generated from natural ecosystem other than development. CCUS in China is still at its infancy stage. Compared to China’s CO2 emissions reduction target, the contribution of CCUS is still very small (the annual storage volume is about one ten-thousandth of annual total emissions) [25]. In this research, data of CCUS is provided by local Development and Reform Commission (DRC) of each target city.
For assessing NBS, the global standard for NBS developed by IUCN (International Union for Conservation of Nature and Natural Resources) is applied [26]. Global standard for NBS includes a self-assessment that consists of eight criteria and associated 28 indicators, which address the key pillars of sustainable development (economy, environment and society) and resilient project management. The eight criteria are societal challenges, design at scale, biodiversity net-gain, economic feasibility, inclusive governance, balance trade-offs, adaptive management and mainstreaming and sustainability. In addition to the standard, there is associated guidance, which instructs users on how to perform a self-assessment. In this research, environmental solutions (mainly urban infrastructure projects and carbon emission reduction projects) in each of the four target cities are evaluated against the IUCN standard.
2.3. Weighting Indicators
Contribution of each indicator is different and thus weighting an indicator is necessary. There are several methods that are frequently applied in weighting indicators [27,28,29]. Expert judgment is commonly used. An obvious disadvantage is that weights of indicators are highly dependent on experts’ opinions. Selection of different experts may result in different weighting results. Evidence-based approach is not commonly used as it is often costly and time-consuming and data collection is sometimes very difficult. Literature review is similar to expert approach, and it is also commonly used and builds on previous experiences. In this research, analytical hierarchy process (AHP) is applied for weighting indicators. AHP is a common approach used in decision-making, which provides the necessary logical/scientific foundations but does not lose sight of the fact that decisions are ultimately dependent on the process by which the decision problem is formulated. AHP was first developed by Professor Thomas L. Saaty in the 1970s and, since that time, has received wide application in a variety of areas [30,31]. AHP is a quantitative mathematical analytical tool, suitable for the analyses of complex qualitative issues. AHP highly depends on experts’ judgment. It is recognized that a decision-making is very difficult within more than one principle. However, the advantage of AHP is depending on the experts’ consultations under only one principle by using the rule presented in Table 2. Priorities under many principles will be calculated by AHP itself.
Table 2.
Values of comparison between two factors under a single principle.
By applying AHP, all 11 single indicators are weighted, and the weights are presented in the Table 3.
Table 3.
Weights of indicators.
2.4. Calculating Urban Low-Carbon Sustainability Index (K)
According to (1) and taking the weights of indicators into account, K is calculated by:
where:
K = ∑Wi × (Di/Ei)
- K: urban low-carbon sustainability index;
- Wi: weight of indicator i (i: 1–11);
- Di: development indicator i (i: 1–11);
- Ei: environmental capacity indicator i (i:1–11).
2.5. Case Study Cities
There are four cities included in the case studies. Four cities were selected, based on the criteria of (1) willing to participate in this research; (2) being able to provide necessary data; and (3) having developed its low-carbon sustainable development strategies and plan. The four cities are indicated in the Figure 1.
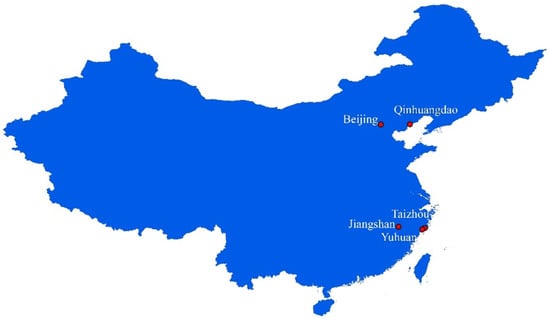
Figure 1.
Locations of the four selected cities.
Qinhuangdao City is one of the first 14 opening seaside cities in China, with an urban population of three million and area of 512 km2. The port of Qinhuangdao, which is the major port for transporting coal from Northern China to Southern China, ranks the second (behind the Port of Shanghai) among Chinese mainland ports. GDP per capita is 10,000 USD in 2020 and the main industries include port, glass production, manufacturing and tourism. Although a great progress in economic aspect has been achieved, the city is facing great challenges of pollution, shortage of water and arable land resources and climate disaster.
Taizhou City, a seaside city, is located in the center of Zhejiang Province, with an urban population of six million and area of 1200 km2. Taizhou is an economically developed city in China, but its development has been associated with severe pollution. GDP per capita of Taizhou is about 20,000 USD per capita. The urban structure of Taizhou City is like an equilateral triangle where the three city districts such as Jiaojiang, Huanyang and Luqiao are located in each of the angles, and a greenery mountain area is situated at the center of the triangle. Medical and chemical industries have played key roles in city’s economic structure. Water pollution and acid rain are the major environmental problems. In addition, toxic chemicals and hazardous wastes are also the local main environmental problems.
Jiangshan City is a small-sized interior city, located in the area where Zhejiang Province, Anhui Province and Fujian Province meet. The city has an urban population of 480,000 and an area of 80 Km2. More than 80 percent of the industrial output is from cement industry. GDP per capita is 12,000 USD in 2020. Many environmental issues in the city, such as air pollution characterized by suspended particles and acid deposition, result from cement production and its value chain. Chemical industry is the second-largest industry in Jiangshan. In the drought season, water pollution is also serious.
Yuhuan City, located in Zhejiang Province, is a typically island city in China, with an urban population of 640,000 and area of 125 Km2. The city is one of the national top-100 economically developed counties (including city in county level). Yuhuan City is characterized by high economic growth, high population density and poor natural resources. GDP per capita is 23,000 USD in 2020. Although the economy in Yuhuan is multi-sectoral, seawater aquiculture, seafood processing and manufacture are the main industries. Both freshwater pollution and coastal water pollution have becoming increasingly serious. Meanwhile, shortage of freshwater can be a serious threat to the further development of Yuhuan.
3. Results
3.1. Low-Carbon Sustainability in Qinhuangdao
Low-carbon sustainability index of Qinhuangdao is calculated by the formula (2) and the result is presented in Table 4. Table 4 shows that:
Table 4.
Measuring low-carbon sustainability in Qinhuangdao.
- (1)
- The overall K is greater than 1, while indicators of Kwastewater, KCOD, KSO2, Khazardous and Kwaste are less than 1. Thus, Qinhuangdao has weak low-carbon sustainability and is moving towards sensible low-carbon sustainability. The overall low-carbon sustainability has been improved by 8.1% in the past decade.
- (2)
- It is obvious that Qinhuangdao has made great progress in environmental pollution control since 2010. Each of Kwastewater, KCOD, KSO2, Khazardous and Kwaste are less than 1, which means the capacities for wastewater treatment, COD and SO2 removal, hazardous waste treatment and household waste disposal are sufficient to meet the demand for development. On average, the growth of capacities on pollution control is faster than the growth of demand as Kwastewater, KCOD, KSO2, Khazardous and Kwaste have decreased by 24%−34% since 2019 and the investment in urban environmental infrastructures has increased fast in the past decade.
- (3)
- Qinhuangdao is a port city as well as a summer resort city. It is 300 Km away from Beijing. Thus, the city is also named as Chinese summer capital. Thus, the economic structure of the city, i.e., based on port economy or tourism, has long been discussed and undetermined. Consequently, the city has developed in a mixed way. Development of both the resort and port needs a large number of the arable land. Before 2018, the arable land had decreased more than 1.5 Km2 each year. Thus, Kland was greater than 1 before 2019. In 2019, the city has developed strict arable land conservation regulations and arable land “Redline” has been established since 2019. Under this Redline regulation, arable land should never be developed for non-agricultural activities in Qinhuangdao.
Kwater (water demand divided by water resource availability) is quite stabilized at the value of about 1.20, which means that Qinhuangdao has water resource shortage by about 20% since 2010. It is recognized that one of the natural resource barriers for development of Qinhuangdao is the limited availability of water resource.
Main barriers for improving urban low-carbon sustainability of Qinhuangdao include the very low level of sustainable energy consumption (Kenergy), adoption of NBS (KNBS) and implementation of offset of CO2 emissions (Kcarbon). The share of sustainable energy consumption in total energy consumption is about 11% and there has been no considerable improvement in promoting sustainable energy consumption in Qinhuangdao in the last decade. CCUS (carbon capture, utilization and storage) is still in very earlier stage of feasibility studies and pilot actions, and no considerable progress has been made. However, the annual CO2 emission was about 5 million tons. NBS measures, such as green corridors, water source restoration and river denaturalization, are viable options for sustainable and resilient cities. They help to achieve global agendas, such as the sustainable development goals (SDGs), the new urban agenda (NUA) and climate risk reduction [32]. Thus, adoption of NBS is crucial for cities achieving their targets of low-carbon and sustainability [33]. As presented in Table 4, Qinhuangdao has been increasingly adopted NBS. The share of NBS urban infrastructure projects (in particular urban environmental infrastructure projects) had increased from 27% in 2010 to 44% in 2019. The adoption of NBS, such as spongy city program, low-impact development projects and other green approaches, has been widely adopted in Qinhuangdao since 2010.
3.2. Low-Carbon Sustainability in Taizhou
Taizhou is a city based on medical and chemical industry. Most of the medical and chemical factories in Taizhou were transferred from Shanghai in 1990s, where they faced compulsory shutdowns for non-compliance with local environmental standards, given to the stricter environmental laws and regulations in Shanghai. These factories have played key role in local industrial development, and therefore have been the main industries in Taizhou. Table 5 presents the urban low-carbon sustainability index calculated based on the formula (2).
Table 5.
Measuring low-carbon sustainability in Taizhou.
- (1)
- The overall low-carbon sustainability is higher than 1. Kwater, Kland and Kwastewater, KCOD, KSO2, Khazardous and Kwaste are less than 1. The urban low-carbon sustainability of Taizhou is weak and moving towards sensible. The overall low-carbon sustainability has been improved by 21.3% in the last decade.
- (2)
- Similar to Qinhuangdao, Taizhou has made great progress in urban environmental infrastructure development by building up capacities of wastewater treatment, removal of COD and SO2, and treatment of both hazardous wastes and household wastes. Each of Kwastewater, KCOD, KSO2, Khazardous and Kwaste has decreased by 14.1–18.6%, leads to a significant improvement in the city’s environmentally sustainability since 2010.
- (3)
- Arable land has been fully under conservation after the “Redline” was introduced in 2016.
Taizhou is rich in water resource and its water availability is higher than its demand, due to its effective sustainable water use policies. Although the city is highly industrialized, water efficiency in both industrial sectors and household is very high. Taizhou has also made great progress in promoting sustainable energy consumption. Thus, Kenergy has increased by 33% in the last decade. The share of sustainable energy in total energy consumption has increased from 12.3% in 2010 to 18.3% in 2019. Taizhou has been one of the advanced cities in China in promoting sustainable energy consumption.
Although CCUS is still in its infancy, Taizhou has developed several CCUS pilot projects focused on separating and enriching CO2 generated from the use of fossil energy in the chemical, power, steel, cement and other industries. Chemical conversion being adopted in Taizhou is the main actions to covert CO2 and co-reactants into target products. There are also some feasibility studies and pilot actions in biological utilization of CO2 in Taizhou. In this regard, CO2 is used to facilitate biomass synthesis and the main products are food ad feed, biofertilizers, chemicals and biofuels and gas fertilizers. As a result, K3 has decreased by 21.0% in the last decade. Taizhou’s experiences on offsetting of CO2 emission in its industrial sectors can be disseminated to other cities, in particular, industrial cities.
One of the most successful actions that Taizhou’s low-carbon sustainability is that Taizhou has made great progress in adopting NBS urban infrastructure projects and. Consequently, KNBS has increased by 48.9% in the past decade. NBS has been widely adopted at the levels of single buildings or single pilots (e.g., permeable paving, urban meadow, rooftop farming, renewable energy, etc.), neighborhood or district level (e.g., cemetery, green wharf, spontaneous flora, urban park and community garden, etc.), and city or regional level (e.g., urban farming, constructed wetland, urban forest, ecological corridor, etc.).
3.3. Low-Carbon Sustainability in Jiangshan
Table 6 presents the results of low-carbon sustainability index of Jiangshan. Similar to the selected cities of Qinhuangdao and Taizhou, Jiangshan’s overall low-carbon sustainability index is greater than 1, while Kwater, Kland, and Kwastewater, KCOD, KSO2, Khazardous and Kwaste are less than 1. Thus, Jiangshan also has weak low-carbon sustainable development and is moving towards sensible low-carbon sustainable development. Although the low-carbon sustainability has been improved since 2010, the improvement is not significant, with the increase of the overall K by 5.3% in the last decade.
Table 6.
Measuring low-carbon sustainability in Jiangshan.
Jiangshan is rich in water resource and its arable land has been fully under conservation since 2013. In addition, Capacities of wastewater treatment, removal of SO2 and hazardous waste treatment have been improved by 26.1%, 26.1% and 25.0%, respectively, due to the great efforts and investment made in industrial pollution control in the last decade.
Challenges remains in low sustainable energy uses (Kenergy), very small scale of offset of CO2 emission (Kcarbon), and limited adoptions of NBS (KNBS). The share of sustainable energy use is at about 11% with very slow growth (5.8%) in the last decade. Offset of CO2 emissions has been at a very early stage of feasibility studies and pilot actions in the last decade and the amount of offset is about 1% of the CO2 emissions. Although the adoption of NBS has been in about 20%, it has only increased by 10.2% in the last decade. The majority of NBS projects have been implemented at the level of single buildings and have not yet scaled up. Lack of urban green space is another challenge for improving the low-carbon sustainability, although the green space has increased 9.8% in the last decade.
3.4. Low-Carbon Sustainability in Yuhuan
Table 7 presents overall low-carbon sustainability in Yuhuan is quite similar to the other three cities. The overall K is greater than 1 and Kland, Kwastewater, KCOD, KSO2, Khazardous and Kwaste are less than 1, thus the urban low-carbon sustainability is still weak and is moving towards sensible. Indicators of pollution control capacities such as wastewater treatment, COD and SO2 removal and treatments of hazardous and household wastes contribute positively low-carbon sustainability. Similar as Jiangshan, main challenges remain in sustainable energy use, development of offset of CO2 emission and adoption of NBS. As an island city, Yuhuan has assigned high priorities to its low-carbon sustainable development. The sustainable energy use has increased by 28.6%, offset of CO2 emissions increases by 18.0% and adoption of NBS increases by 13.1%.
Table 7.
Measuring low-carbon sustainability in Yuhuan.
There are two fundamental issues for Yuhuan on urban low-carbon sustainable development. The first is limited water resource as an island city. Thus, Yuhuan has developed a series of strict policies and criteria on water consumption. As a result, many water-intensive industries have been closed. Although great efforts have been made in water saving and phasing out water-intensive sectors, Yuhuan is still lack of water resource with Kwater greater than 1. Another issue is the arable land, which has been fully protected and it has been forbidden on occupying arable land since 2012. Yuhuan is paying much attention to develop urban green spaces, which has increased by 15.6% in the last decade.
3.5. Comparison of Low-Carbon Sustainability in the Four Selected Cities
Figure 2 shows that the four selected cities are all in weakly low-carbon sustainability and they are all moving towards to sensibly low-carbon sustainability in the last decade. Considerable progress has been made in improving urban low-carbon sustainability in the four cities. However, differences do exist. Taizhou has made most progress and its overall sustainability index decreases by 22.3%, following by Yuhuan. Both Qinhuangdao and Jiangshan have also made progress, but their overall low-carbon sustainability has not improved significantly in the last decade.
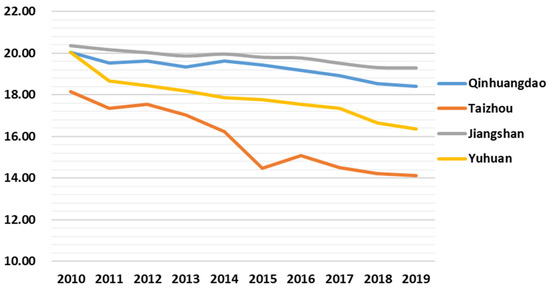
Figure 2.
Low-carbon sustainability in the four selected cities.
Our findings show that all four cities have made great efforts in building up their capacities for pollution control and, as a result, the capacity is enough for ensuring wastewater treatment, pollutants’ removal and household waste and hazardous waste treatment. Accordingly, their environmental sustainability is high, which paves the foundation for the four cities in the future improvement of their low-carbon sustainability.
All four cities are facing great challenges of use of sustainable energy, offset of CO2 emission and adoption of NBS in improving their low-carbon sustainability. In particular, all cities are still at a very eary stage of feasibility studies and pilot actions in developing offset of CO2 emission. Currently the amount of offset of CO2 is very small and is less than or about 1% of the annual CO2 emissions in four cities. Uses of sustainable energy and adoptions of NBS are also at the initial stages and are far from the need of carbon neutrality.
4. Discussion and Conclusions
Results of measuring urban low-carbon sustainability in the four cities show that all cities have made great progress in improving their environmental sustainability. However, they are still in very earlier stage in low-carbon pathway. The results of this research support the evidence that most international, national and local sustainability program are paying more attentions to environmental governance [18,19]. The result proves that China, as the biggest emerging economy, is not practicing development theory of emerging economies that the core of development is the GDP growth, since China has, in the meantime, made great progress in achieving environmental sustainability, given to the well development of urban environmental infrastructure in the past decades [20].
In many cities, climate change and urban resilience are high on the political agenda [34], given to the fact that high-carbon development and resulted in climate change generate systematic damages to ecosystem, socio-economic systems and health, and intensifying natural disasters [35]. In particular, high-carbon development will generate high damages to the vulnerable groups of poor and marginalized people [36]. For the mitigation of climate and improvement of urban resilience in the four cities, the trends of the existing high-carbon development must be changed.
Chinese central government has declared that China will be peaking carbon dioxide emissions in 2030 and achieve carbon neutrality in 2060. It is obvious that the four cities under this research is facing great challenge, since their carbon-related indicator is still far more than 1, which is the low-carbon sustainability criteria. Based on the value of existing Kcarbon, we can estimate that Kcarbon needs to decrease by 10–12% annually for the four cities achieving carbon neutrality before 2060. Therefore low-carbon enabling policy framework, low-carbon economic structure adjustment, intensifying low-carbon energy consumption and raising low-carbon awareness are crucial for the four cities achieving carbon neutrality in 2060.
A number of studies exist for assessment of urban sustainability. However, they are mostly focused urban resources and the environmental aspect [37,38,39]. Including low-carbon issues in measuring urban sustainability has been a new challenge [30,31]. Measuring urban low-carbon sustainability is still in its infancy, and no methods have been commonly agreed upon so far. On the other hand, decision-makers need information on its current low-carbon sustainability and need to evaluate (ex-post and ex-ante) the impacts of interventions or policies in terms of low-carbon sustainability. Against this background, the study developed a simple evaluation method, which is easily understood and rational, especially in the context of developing countries, where severe environmental pollution, natural resources depletion and carbon-intensive development often exist. The method was then validated through case study of four Chinese cities.
This study applied a method to screen a wide range of local, national and international system of sustainability and then an extensive list of 176 indicators has been established. Reducing indicators and selecting as small as necessary indicators have been conducted by evaluating each indicator against certain criteria. This is a specifically top-down expert approach, and its main advantage is to made use of quantitative indicators and statistical tools and to derive indicators from general principles and well-defined frameworks. Another advantage of expert approach is to allow comparisons at different levels. However, top-down expert approaches have also obvious disadvantages. Thus, it is needed to try a participatory bottom-up approach, in which local communities and stakeholders are the ones choosing indicators according to their needs and perceptions. It would be interesting that both top-down expert approach and participatory-based bottom-up approach are applied in the same cities and results of selections of a set of indicators can be compared and be tested in measuring local low-carbon sustainability.
Weighting indicators are crucial in indicator-based measuring since contributions of single indicators are different. Most traditional sustainability measuring projects apply expert judgements that are simple, easy to understand and easy to communicate. Since sustainability includes traditionally three pillars of economy, society and environmental and it is multidimensional and complex. Identification of importance of each single indicator is typically a multicriteria analysis and thus expert judge has the limitations that different experts may give different opinions. For avoiding disadvantages of expert judgement, this research applies the AHP approach and pairwise comparisons (refer to Table 2), results generated by AHP should pass the consistency check [40]. Another weighting approach is an evidence-based approach. This approach is to identify importance of each indicator, based on the evidence. In practice, it is always difficult and costly to get scientific evidence and thus very few indicator programs have applied evidence-based approach for weighting indicators.
The overall urban low-carbon sustainability index is weighted sum of 11 single indices and each single index is defined as the indicator of assessing development level against the baseline. The baseline is often the criteria or minimum requirement of low-carbon sustainability. The advantage of the developed method is that the evaluation is against the low-carbon sustainability criteria and thus the result is useful for decision-makers understanding where they are in the way towards to low-carbon sustainability. With this method, not only the overall low-carbon sustainability but also the key elements of low-carbon sustainability are evaluated. Accordingly, the priorities toward urban low-carbon sustainable development can be identified. Another advantage is that most data needed for applying this method is available. Therefore, it can be widely used for decision-making processes and evaluate whether local development is on a low-carbon sustainable path.
Based on the development and application of the evaluation method, we recommend that measuring low-carbon sustainability should start with consensus building of what low-carbon sustainability means to stakeholders. The next step is to develop an analytical framework to operationalize the concept of low-carbon sustainability with a set of key indicators. A mixture of approaches of expert judgment and stakeholder participation should be applied for selecting and reducing the indicators. Our method was tested in a limited number of cities. Further testing and validation of the method is necessary, because the cities are different in the aspects of development, environment and resilience and they may face different challenges in achieving carbon neutrality. After testing in more cities, the method should be improved, preferably in workshops with experts and stakeholders. It is also recommended that all cities should include carbon emissions and offsetting, the adoption of NBS and other urban resilient data into their existing statistics system that are very useful for further measuring and benchmarking low-carbon sustainability.
Author Contributions
Conceptualization, M.Z. and C.X.-B.; methodology, M.Z. and Y.Y.; validation, M.Z. and C.X.-B.; formal analysis, M.Z. and Y.Y.; investigation, M.Z. and Y.Y.; resources, M.Z.; data curation, Y.Y.; writing–original draft preparation, M.Z. and C.X.-B.; writing—review and editing, M.Z. and C.X.-B.; supervision, M.Z.; project administration, M.Z. All authors have read and agreed to the published version of the manuscript.
Funding
This research was funded by The Seed Fund for International Research Cooperation of Beijing University of Civil Engineering and Architecture (grant number: 32080821004).
Conflicts of Interest
The authors declare no conflict of interest.
References
- Mori, K.; Christodoulou, A. Review of Sustainability Indices and Indicators: Towards a New City Sustainability Index (CSI). Environ. Impact Assess. Rev. 2012, 32, 94–106. [Google Scholar] [CrossRef]
- Yigitcanlar, T.; Dur, F.; Dizdaroglu, D. Towards Prosperous Sustainable Cities: A Multiscalar Urban Sustainability Assessment Approach. Habitat Int. 2015, 45, 36–46. [Google Scholar] [CrossRef] [Green Version]
- Feyen, L.; Ciscar, J.C.; Gosling, S.; Ibarreta, D.; Soria, A. (Eds.) Climate Change Impacts and Adaptation in Europe. JRC PESETA IV Final Report. EUR 30180EN; Publications Office of the European Union: Luxembourg, 2020; ISBN 978-92-76-18123-1. JRC119178. [Google Scholar] [CrossRef]
- Júlia, A.N.; Benedek, J.; Ivan, K. Measuring Sustainable Development Goals at a Local Level: A Case of a Metropolitan Area in Romania. Sustainability 2018, 10, 3962. [Google Scholar] [CrossRef] [Green Version]
- Kawakubo, S.; Murakami, S.; Ikaga, T.; Asami, Y. Sustainability assessment of cities: SDGs and GHG emissions. Build. Res. Inf. 2017, 46, 528–539. [Google Scholar] [CrossRef]
- Schmidt-Traub, G.; Kroll, C.; Teksoz, K.; Durand-Delacre, D.; Sachs, J.D. National baselines for the Sustainable Development Goals assessed in the SDG Index and Dashboards. Nat. Geosci. 2017, 10, 547–555. [Google Scholar] [CrossRef]
- Hogan, D.R.; Stevens, G.A.; Hosseinpoor, A.R.; Boerma, T. Monitoring universal health coverage within the Sustainable Development Goals: Development and baseline data for an index of essential health services. Lancet Glob. Health 2018, 6, 152–168. [Google Scholar] [CrossRef] [Green Version]
- Kim, D.; Lim, U. Urban Resilience in Climate Change Adaptation: A Conceptual Framework. Sustainability 2016, 8, 405. [Google Scholar] [CrossRef] [Green Version]
- Michalina, D.; Mederly, P.; Diefenbacher, H.; Held, B. Sustainable Urban Development: A Review of Urban Sustainability Indicator Frameworks. Sustainability 2021, 13, 9348. [Google Scholar] [CrossRef]
- Heal, G. Reflections—Defining and Measuring Sustainability. Rev. Environ. Econ. Policy 2012, 6, 147–163. [Google Scholar] [CrossRef] [Green Version]
- Mingshun, Z.; Zelu, L.; van Dijk, M.P. Measuring urban vulnerability to climate change using an integrated approach, assessing climate risks in Beijing. Peer J. 2019, 7, 7018. [Google Scholar]
- Bozza, A.; Asprone, D.; Manfredi, G. Developing an Integrated Framework to Quantify Resilience of Urban Systems Against Disasters. Nat. Hazards 2015, 78, 1729–1748. [Google Scholar] [CrossRef]
- Mascarenhas, A.; Coelho, P.; Subtil, E.; Ramos, T.B. The role of common local indicators in regional sustainability assessment. Ecol. Indic. 2010, 10, 646–656. [Google Scholar] [CrossRef]
- Bertoldi, P. (Ed.) Guidebook How to Develop a Sustainable Energy and Climate Action Plan (SECAP)—Part 1—The SECAP Process, Step-by-Step Towards Low Carbon and Climate Resilient Cities by 2030; Publications Office of the European Union: Luxembourg, 2018; ISBN 978-92-79-96847-1. JRC112986. [Google Scholar] [CrossRef]
- Bithas, K.P.; Christofakis, M. Environmentally sustainable cities: Critical review and operational conditions. Sustain. Dev. 2006, 14, 177–189. [Google Scholar] [CrossRef]
- Kenworthy, J.R. Dimensions for Sustainable City Development in the Third World. Environ. Urban. 2006, 18, 67–85. [Google Scholar] [CrossRef]
- UN Habitat. Sustainable Cities Programme; United Nations: Nairobi, Kenya, 2018; Available online: http://www.fukuoka.unhabitat.org/programmes/detail04_03_en.html (accessed on 22 April 2021).
- Camagni, R.; Capello, R.; Nijkamp, P. Towards sustainable city policy: An economy-environment technology nexus. Ecol. Econ. 1998, 24, 103–118. [Google Scholar] [CrossRef]
- van Dijk, M.P.; Mingshun, Z. Sustainability indices as a tool for urban managers, evidence form four medium-sized Chinese cities. Environ. Impact Assess. Rev. 2005, 25, 667–688. [Google Scholar] [CrossRef]
- Halperin, S. Development theory. Encyclopedia Britannica. Posted 17 December 2018. Available online: https://www.britannica.com/topic/development-theory (accessed on 31 October 2021).
- Van Dijk, M.P. Measuring eco cities, comparing European and Asian experiences: Rotterdam versus Beijing. Asia Eur. J. 2014, 15, 75–94. [Google Scholar] [CrossRef] [Green Version]
- Jeb, B. Is There a Method in Our Measurement? The Use of Indicators in Local Sustainable Development Planning. Local Environ. 1997, 2, 59–72. [Google Scholar]
- Parris, T.M.; Kates, R.W. Characterizing and Measuring Sustainable Development. Annu. Rev. Environ. Res. 2003, 28, 559–586. [Google Scholar] [CrossRef]
- Ayres, R.; van den Berrgh, J.; Gowdy, J. Strong versus Weak Sustainability. Environ. Ethics 2001, 23, 155–168. [Google Scholar] [CrossRef]
- Cai, B.; Li, Q.; Lin, Q.; Ma, J. China Status of CO2 Capture, Utilization and Storage (CCUS) 2019; Center for Climate Change and Environmental Policy, Chinese Academy of Environmental Planning: Beijing, China, 2020; Available online: http://www.cityghg.com/uploads/soft/200316/1-200316151449.pdf (accessed on 15 August 2021).
- IUCN Global Standard for Nature-based Solutions: A User-Friendly Framework for the Verification, Design and Scaling up of NbS: First Edition. 2020. Available online: https://portals.iucn.org/library/node/49070 (accessed on 15 August 2021).
- Tanguay, G.A.; Rajaonson, J.; Lefebvre, J.-F.; Lanoie, P. Measuring the sustainability of cities: An analysis of the use of local indicators. Ecol. Indic. 2010, 10, 407–418. [Google Scholar] [CrossRef]
- Guijarro, F.; Poyatos, J.J.S. Designing a Sustainable Development Goal Index through a Goal Programming Model: The Case of EU-28 Countries. Sustainability 2018, 10, 3167. [Google Scholar] [CrossRef] [Green Version]
- Hiremath, R.B.; Balachandra, P.; Kumar, B.; Bansode, S.S.; Murali, J. Indicator-Based Urban Sustainability—A Review. Energy Sustain. Dev. 2013, 17, 555–563. [Google Scholar] [CrossRef]
- Zhang, M.; Yang, Y.; Li, H.; van Dijk, M.P. Measuring Urban Resilience to Climate Change in Three Chinese Cities. Sustainability 2020, 12, 9735. [Google Scholar] [CrossRef]
- Herzog, P.C.; Antuña Rozado, C. The EU—Brazil Sector Dialogue on Nature-Based Solutions: Contribution to a Brazilian Roadmap on Nature-Based Solutions for Resilient Cities; European Commission: Luxembourg, 2019. [Google Scholar] [CrossRef]
- Huang, L.; Wu, J.; Yan, L. Defining and Measuring Urban Sustainability: A Review of Indicators. Landsc. Ecol. 2015, 30, 1175–1193. [Google Scholar] [CrossRef]
- Albert, C.; Spangenberg, J.; Schröter, B. Nature-based solutions. Criteria. Nat. 2017, 543, 315. [Google Scholar] [CrossRef]
- Climate Change, Impacts and Vulnerability in Europe 2012: An Indicator-Based Report; EEA Report No 12/2012. EEA: Copenhagen, Denmark, 2012; pp. 35–42. Available online: https://op.europa.eu/en/publication-detail/-/publication/c42b2390-451f-475c-b0a4-7ff14aeaee45/language-en/format-PDF/source-239338487 (accessed on 25 August 2021).
- Zhang, M.; Wang, H.; Jin, W.; van Dijk, M.P. Assessing heat wave vulnerability in Beijing and its districts, using a three-dimensional model. Int. J. Glob. Warm. 2019, 17, 297–314. [Google Scholar] [CrossRef]
- Berman, M.; Orttung, R.W. Measuring Progress toward Urban Sustainability: Do Global Measures Work for Arctic Cities? Sustainability 2020, 12, 3708. [Google Scholar] [CrossRef]
- Basiago, A.D. Economic, Social, and Environmental Sustainability in Development Theory and Urban Planning Practice. Environmentalist 1998, 19, 145–161. [Google Scholar] [CrossRef]
- Gasparatos, A. Embedded Value Systems in Sustainability Assessment Tools and Their Implications. J. Environ. Manag. 2010, 91, 1613–1622. [Google Scholar] [CrossRef]
- Hassan, A.; Kotval-K, Z. A Framework for Measuring Urban Sustainability in an Emerging Region: The City of Duhok as a Case Study. Sustainability 2019, 11, 5402. [Google Scholar] [CrossRef] [Green Version]
- Greenberg, M.R. Measuring Historical Urban Neighborhood Sustainability: America’s Grand Avenues. Sustainability 2021, 13, 1358. [Google Scholar] [CrossRef]


Publisher’s Note: MDPI stays neutral with regard to jurisdictional claims in published maps and institutional affiliations. |
© 2021 by the authors. Licensee MDPI, Basel, Switzerland. This article is an open access article distributed under the terms and conditions of the Creative Commons Attribution (CC BY) license (https://creativecommons.org/licenses/by/4.0/).