Article

Assessment of the Heavy Metals Pollution and Ecological Risk in Sediments of Mediterranean Sea Drain Estuaries in Egypt and Phytoremediation Potential of Two Emergent Plants

by
Yasser A. El-Amier
1,*,
Armel Zacharie Ekoa Bessa
2,
Ashraf Elsayed
1,
Mohamed A. El-Esawi
3,*,
Mohammad S. AL-Harbi
4,
Bassem N. Samra
4 and
Wafaa K. Kotb
1
1
Department of Botany, Faculty of Science, Mansoura University, Mansoura 35516, Egypt
2
Department of Earth Sciences, Faculty of Science, University of Yaounde I, Yaoundé P.O. Box 812, Cameroon
3
Botany Department, Faculty of Science, Tanta University, Tanta 31527, Egypt
4
Department of Biology, College of Science, Taif University, P.O. Box 11099, Taif 21944, Saudi Arabia
*
Authors to whom correspondence should be addressed.
Sustainability 2021, 13(21), 12244; https://doi.org/10.3390/su132112244
Submission received: 3 October 2021 / Revised: 22 October 2021 / Accepted: 29 October 2021 / Published: 5 November 2021

Abstract

:
Environmental pollution and its eco-toxicological impacts have become a large and interesting concern worldwide as a result of fast urbanization, population expansion, sewage discharge, and heavy industrial development. Nine heavy metals (Pb, Cd, Fe, Mn, Zn, Ni, Cu, Cr, and Co) were evaluated in 20 sediment samples from the estuaries of four major drains along the Mediterranean shoreline (Nile Delta coast) to determine the possible ecological effect of high heavy metal concentrations as well as roots and shoots of two common macrophytes (Cyperus alopecuroides and Persicaria salicifolia). For sediment, single- and multi-elemental standard indices were used to measure ecological risk. Data revealed high contents of heavy metals, for which the mean values of heavy metals in sediment followed a direction of Fe > Mn > Co > Zn > Cu > Ni > Cr > Pb > Cd, Fe > Mn > Co > Ni > Zn > Cu > Cr > Pb > Cd and Fe > Mn > Zn > Co > Cu > Ni > Cr > Pb > Cd for drains stream, estuaries, and Mediterranean coast, respectively. Mn, Cr, Zn, and Pb were found to be within Canadian Soil Quality Guidelines (CSQGD) and U.S. Environmental Protection Agency Guidelines (US-EPA) limitations, except for Zn and Pb in drain streams, which were above the US-EPA limits, whereas Cd, Co, Cu, and Ni indicated a high ecological risk index. This high quantity of contaminants might be linked to unabated manufacturing operations, which can bio-accumulate in food systems and create significant health issues in people. C. alopecuroides root demonstrated a more efficient accumulation of all metals than the shoot system. For most heavy metals, C. alopecuroides had the highest root BAF levels with the exception of Ni and Pb in P. salicifolia. As a result, C. alopecuroides might be employed as a possible phytoextractor of these dangerous metals, while P. salicifolia could be used as a hyper-accumulator of Ni and Pb. The policymaker must consider strict rules and restrictions against uncontrolled industrial operations, particularly in the Nile Delta near water streams.

1. Introduction

Egypt’s water supply is supplemented significantly by agricultural drainage water. On its journey through Egypt, a large portion of Egypt’s water is reused several times. Finally, drain estuaries discharge to coastal marine bodies, such as lakes or the Mediterranean Sea [1]. Moreover, human settlements intensify pollution problems because drainage systems receive large amounts of nutrients, such as waste disposal from urban and industrial centres [2,3]. Heavy metals are one of the most studied environmental contaminants because they may cause human health issues, powerful neurotoxins in fish, and a detrimental influence on the marine ecology, all of which are harmful to communities and biological resources [4,5]. The protection of resources of water has led to a policy of sanitation development in urban areas, with the majority of cities now equipped. In any case, the deficit in rural areas continues to be a major concern for the industry [6].
The rate of population growth in Egypt, especially in the Nile Delta, puts a great deal of pressure on the agriculture industry to cover human food demands [7]. Farmers in several sections of the Nile Delta utilise drainage water (such as agricultural drainage, industrial, and household wastewater) for agriculture because of the scarcity water resources available for growth of this overburdened agricultural region. When drainage water is used for irrigation, the amount of toxic metals in farming soils rises [8]. This affects food safety and quality, having a great impression on the health of humans [9].
The Egyptian Mediterranean Sea coastline stretches 1550 km from Rafah in the east to El-Saloum in the west, making it one of North Africa’s longest. Due to the massive volume of industrial, agricultural, commercial, and residential waste effluents and emissions as well as toxic substances, the Egyptian marine environment along the Mediterranean coast has been subjected to a significant increase in pollution in recent decades [10,11,12]. The marine environment has been impacted by increasing population and industrial demands in the coastal zone. Activities such as garbage dumping, harbour building, dredging, and extraction operations can all affect the quality of the coastal zone ecosystem. To assess the consequences of these operations and initiate appropriate corrective efforts, it is important to monitor a wide variety of marine environment characteristics [13,14].
Heavy metals are serious pollutants of the environment, and anthropogenic activities in the Nile Delta (such as agricultural development, industrial operations, and poor rural sanitation) have a significant impact on metal eutrophication and pollution as well as its ecological value and environmental conditions [15]. Toxic effects for human and environmental health can be caused due to the chronic exposure to heavy metals and metalloids at low levels. Several health risks are associated with heavy metal toxicity due to the use of a wide variety of the metals in industry and in daily life work. The symptoms of heavy metal poisoning differ according to the type of metal that causes toxicity, and the duration of symptoms also differs depending on the amount of metal an individual is exposed to [16,17]. Toxicity of environmental pollutants is major problem for ecological evolutionary, nutritional, and environmental balance [18,19].
Concerns about environmental pollution have prompted the development of methods to determine the presence and mobility of metals in soil [20,21]. Macrophytes have shown to be effective in absorbing pollutants from soils and streams of water. One of the phytoremediation types, phytoextraction, may be used to eliminate heavy metals from soil by using the soil’s ability to absorb metals [22]. Heavy metals, such as Cd, Zn, Co, Mn, Ni, and Pb, can be concentrated up to 100 or 1000 times higher in metal-accumulating plant species than in non-accumulator plants [23,24]. Macrophytes are considered heavy metal bioindicators in this context. Aquatic macrophytes are thought to be an ecologically benign, green-driven, cost-effective, and passive form of heavy metal phytoremediation [25,26]. Several macrophyte plants have been identified as heavy metal phytoremediators, such as Azolla filiculoides, Lemna minor, Pistia stratiotes [21], Phragmites australis, Echinochloa stagnina, Typha domingensis [25,27], Cyperus alopecuroides [28], Potamogeton pectinatus, and P. malaianus [29].
Heavy metals are introduced to crops today through soil erosion, natural weathering of the earth’s crust, mining, industrial effluents, urban runoff, sewage discharge, and pest or disease-control agents [13,30]. The goals of this study were to (i) determine the pollution levels of major nine trace metals (Pb, Cd, Fe, Mn, Zn, Ni, Cu, Cr, and Co) in four drain estuaries along the central Nile Delta that discharge directly into the Mediterranean Sea; (ii) calculate the environmental risk using various contamination index values; and (iii) measure the phytoremediation efficiency of two perennial semi-aquatic plants that live along the banks of the four drains.

2. Materials and Methods

2.1. Study Area

The Nile Delta is located in the heart of the Mediterranean shore. It is Egypt’s most highly utilized region, accounting for 63% of all agricultural land and occupying 2% of the country’s land area (29,600 km2). Over 39 million people (41 percent of the country’s population) live in the Delta region. Furthermore, 40% of Egypt’s industrial base is situated in the Nile Delta [7]. The population density in the delta is 1000/km2 (2600/sq mi) or higher outside of large cities. The Nile River is the main supply of water in the Delta district, with agriculture responsible for 80% of its flow [31].
The northern Nile Delta lakes have a special habitat, but they are polluted by wastewater that comes from urban, industrial, and agricultural wastes discharged into waters [32]. As a response, the Delta area has a large drainage system that serves the agricultural industry. Some of the base drains in the Delta region discharge in the Mediterranean Sea directly, such as El-Bustan, Gamasa, Belqas, and Kitchener drains, while others influx in northern lakes, such as Brinbal, Elhoks, Elshakhlouba, Bahr Tirra, Elserw, Hadous, and Bahr Elbaqar. The map of the four drain estuaries and sampling sites (S1–S20) was produced basing on Landsat 8 image received in July 2021 (Figure 1a). The sectors for the different activities nearby four drain estuaries was taken in July 2021 using Google Map Earthpro (Figure 1b). The longitudes, latitudes, and activities nearby each sampling sites are summarized in Table S1.

2.2. Samples Collection and Preparation

Twenty locations along the Mediterranean coast were selected to reflect the four drains that discharge directly into the Deltaic Mediterranean coast (El-Bustan, Gamasa, Belqas, and Kitchener drains) (Figure 1a). Composite sediment samples (n = 3) were collected from each site at a depth of 15–30 cm, allowed to dry, sieved with a 2-mm sieve to eliminate debris and pebbles, and packed in container for additional physical and chemical tests. Additionally generated were composite samples of Cyperus alopecuroides Rottb. and Persicaria salicifolia (Willd) Assenov, two common perennial emergent macrophyte plants that naturally thrive in all of the studied drains. Plants were gathered in plastic bags from each drain investigated. To eliminate dust, the plant samples were washed in tap water and distilled water before being separated into shoots and roots. The samples were dried until fully dry in an oven at 55 °C, then crushed into a fine powder using an electric grinder. According to Boulos [33], plant species naming and description were carried out.

2.3. Heavy Metals Analysis

Prior to the chemical analysis of samples, by using microwave digestion (AR-MW), an acid extraction was performed [34]. In sediment, 12 mL of HCl (37%): HNO3 (70%) (3:1) mixture was supplemented with 0.2 g of each sample in a Teflon jar. For plant tissue, 10 mL of aqua regia, 3 mL HNO3 (70%): 1 mL H2O2 mixture was added to 0.2 g of each sample and placed in a Teflon jar. In a microwave apparatus, the vessels were heated to 180 °C in 5.5 min and maintained for 9.5 min at that temperature. With a standard calibration system, the Inductivity Coupled Plasma-Optical emission spectrometer (ICP-OES) (Thermo-Scientific TM/iCAPTM-7000 Plus-Series ICP-OES, Thermo Fisher Scientific, Waltham, USA) was used to determine the presence of nine metals (Pb, Fe, Cd, Mn, Zn, Ni, Cu, Cr, and Co) in plant tissue or sediment. Based on the results, the wavelengths utilised in ICP-OES were chosen [35].

2.4. Pollution Quantification

For sediment, single- and multi-elemental standard indices (such as enrichment factor (Ef), contamination factor (Cf), geoaccumulation index (Igeo), ecological risk factor (Er), degree of contamination (Dc), and potential ecological risk index (PERI)) were used to measure ecological risk [36,37,38,39,40,41]. Tables S2 and S3 display the emission indices’ measurement formulas and their class ranges.

2.5. Phytoremediation Efficiency of Macrophyte Species

The capacity of the two macrophytes species (C. alopecuroides and P. salicifolia) for phytoremediation was assessed using three indicators: bioaccumulation factor, enrichment factor, and translocation factor [42,43]. The measurement formulae for the indices are shown in Table S4.

2.6. Statistical Analysis

To assess the variation among the four selected drain estuaries, the concentrations of the calculated heavy metals (Pb, Cd, Fe, Mn, Zn, Ni, Cu, Cr, and Co) were subjected to one-way ANOVA. By the CoStat 6.3 software and using Duncan’s test at the p < 0.05 probability level (CoHort-Software, Monterey, CA, USA, http://www.cohort.com, accessed on 1 January 2019), the mean values of each parameter were separated. In addition, by using the SPSS software package (Version 27.0. IBM Corp, Armonk, NY, USA), different heavy metals from twenty locations were tested to Pearson’s correlation. Moreover, summary statistics, the Box Whiskers plot, and principal component analysis (PCA) were calculated using the PAST program (multivariate statistical package, ver. 1.72, Oslo, Norway, http:// www.nhm.uio.no/~ohammer/past/ plot.html accessed on 3 June 2020).

3. Results and Discussion

3.1. Heavy Metals in Sediment

Heavy metal pollution of sediment is a serious problem, and different activities, such as agriculture, urbanization, and industrialization, are all contributing to increased heavy metal concentration in the sediment [44]. Table 1 shows the heavy metals descriptive statistics in various sediment types from four drain streams, a drain estuary, and the Mediterranean coast in Egypt’s Nile Delta. Generally, the sediment’s Fe concentration was at its highest, whereas Cd levels were determined to be low. The mean heavy metal concentrations in drain stream sediment showed a downward trend of Fe > Mn > Co > Zn > Cu > Ni > Cr > Pb > Cd. Zn had the largest coefficient of variation, followed by Cu and Co, indicating that these metals vary greatly in the sediment. Anthropogenic activities have a significant impact on the composition of these metals. All the metals have skewness and kurtosis values less than one except for kurtosis of Cd, which indicates left-handed skewness and platykurtic kurtosis [45]. Skewness essentially measures the symmetry of the distribution, while kurtosis determines the heaviness of the distribution tails.
The direction of the mean value of heavy metals for drainage estuary was Fe > Mn > Co > Ni > Zn > Cu > Cr > Pb > Cd. Iron had the greatest coefficient of variation, followed by Cr, suggesting that these metals varied most in the sediment samples. (Table 1). All the metals have skewness and kurtosis less than one, except for skewness of Pb and Cr and kurtosis of pb and Cd, showing left-handed skewness and platykurtic kurtosis [45]. The average value of heavy metals throughout the Mediterranean coast followed the trend of Fe > Mn > Zn > Co > Cu > Ni > Cr > Pb > Cd. The highest coefficient of variation was found for Fe followed by Cd. The Fe and showed higher variation in the Mediterranean coast. All the metals have skewness and kurtosis values <1, except for skewness and kurtosis of Ni and Fe and skewness of Cd, which showed left-handed skewness and platykurtic kurtosis. The skewness and kurtosis of Cu and Co and Mn for all samples was found to be less than one, indicating normal distribution of these metals in the sediment samples [45] (Table 1).
A comparison of the current results with the USA–EPA [46] and the CSQGD [47] was made to determine the possible opposing biological impacts and sediment toxicity. Mn, Cr, Zn, and Pb were found to be within CSQGD [47] and USA–EPA [46] limitations except for Zn and Pb in drain streams, which were above the USA–EPA [46] limits, whereas Cd, Co, Cu, and Ni indicated a high ecological risk index.
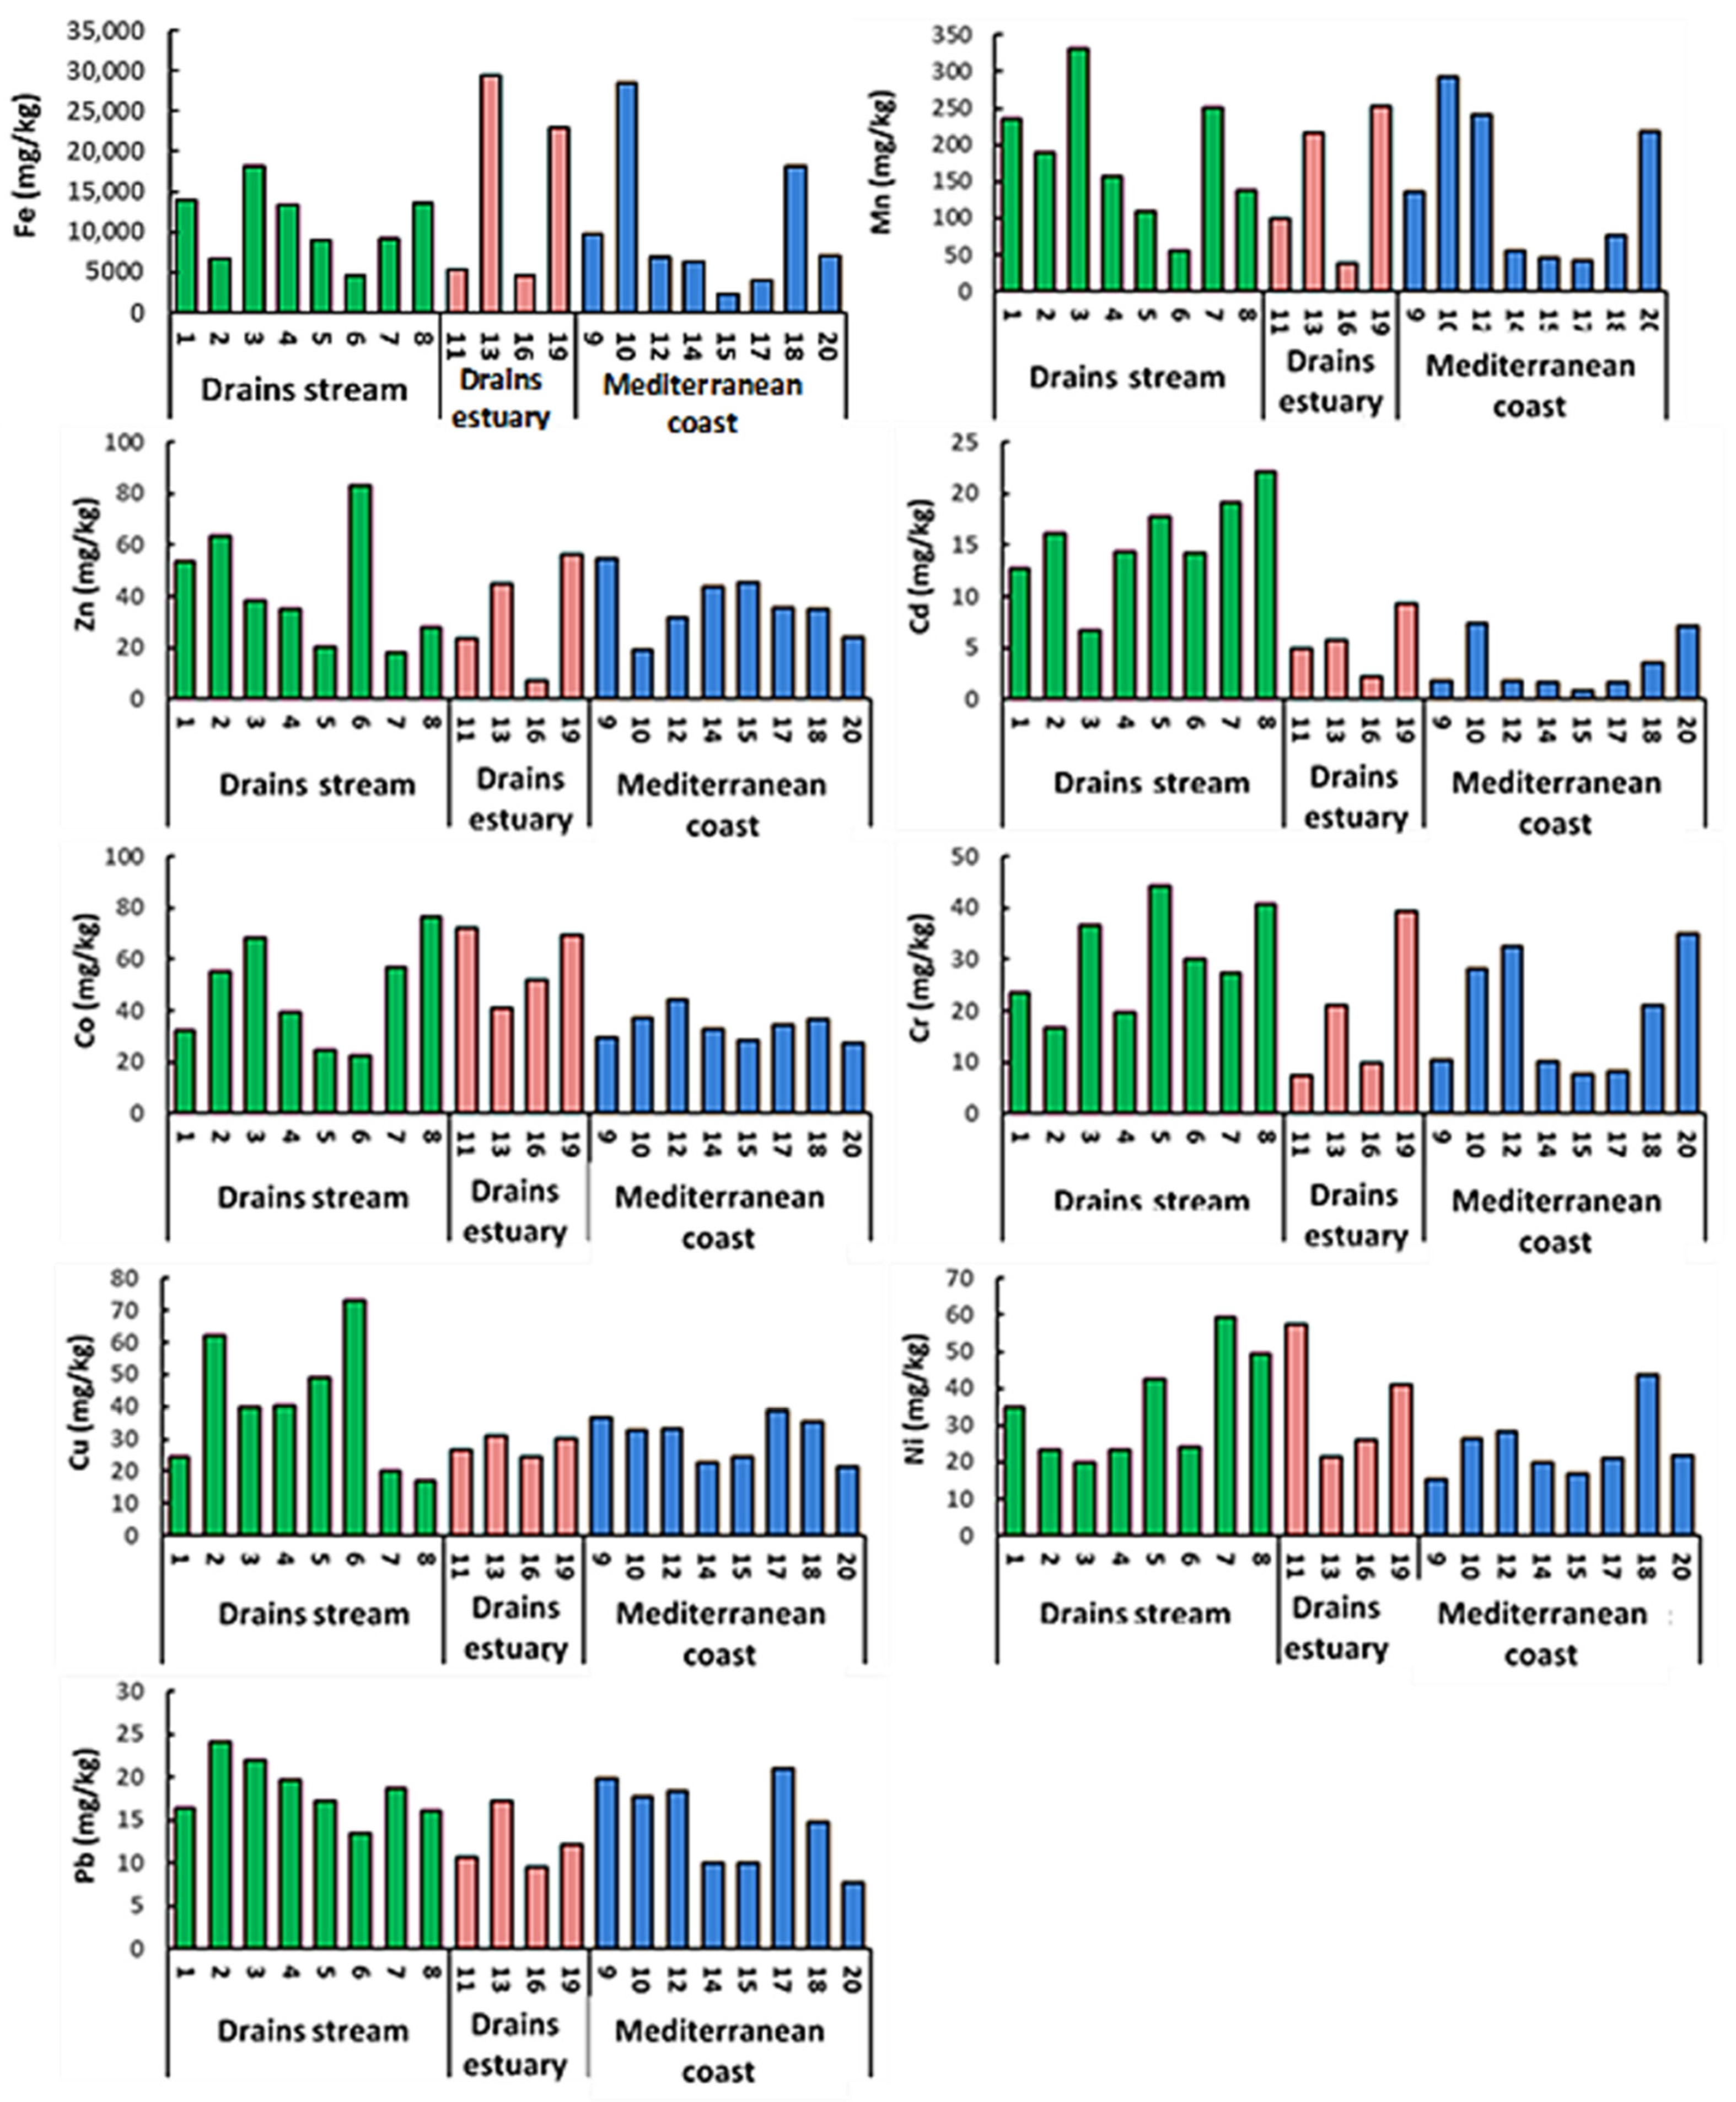
The box and whisker plots in Figure 2 present an overview of the fundamental statistics of heavy metal concentrations studied in the sediment of drains and the shoreline of Egypt’s Nile Delta. When comparing the concentrations of heavy metals in the three locations studied, it can be described better graphically through several box plots. The samples of the three locations showed a fluctuation in results. Results of the drain estuary samples act as a transitional zone between the results of the drain stream and the Mediterranean coast except for Cd, which was widely spread in the drain stream region compared with the drain estuary region and Mediterranean coast (Figure 3).

3.2. Statistical Analysis

3.2.1. Correlation Coefficient Analysis of Heavy Metals

High correlations between certain heavy metals in sediments might indicate comparable degrees of contamination and/or pollution discharge from the same sources [48]. The Pearson method was used to conduct a correlation analysis on heavy metals in the study area (Table 2). Some heavy metal pairs, such as Zn-Ni, Cu-Co, and Cu-Ni, showed negative correlations at p < 0.01 or p < 0.05, which has been well documented in previous studies [49,50]. The positive relationships between distinct pairs of heavy metals were all highly significant (p < 0.01 or p < 0.05). The close correlations between Fe and Mn (r = 0.615), Zn and Cu (r = 0.595), and Cd and Cr (r = 0.784) coincide with data collected from Atlantic Ocean coast of Cameroon (Fe and Mn, r = 0.546) [49], the Jin-Qu Basin in China (Zn and Cu, r = 0.623) [51], and drains in Nile Delta of Egypt (Cd and Cr, r = 0.890) [25], respectively. On the other hand, several pairs of elements (Mn-Co, Mn-Cr, Cd-Ni, Co-Ni, Cu-Pb) showed weak significant positive correlations (Table 2). According to the findings, these trace elements may have come from a similar contamination source, such as residential, agricultural, and industrial operations, as was also shown by several previous studies [52,53].

3.2.2. Principal Component Analysis (PCA)

To assess the extent of heavy metal pollution produced by lithogenic activity and anthropogenic sources, a dataset containing 20 sample points and 9 variables (Cd, Co, Cr, Fe, Mn, Cu, Ni, Pb, and Zn) was submitted to multivariate analysis (principal component analysis, PCA) [54,55]. The results of PCA for heavy metal contents are listed in Table 3. According to these results, Fe, Mn, Cd, Co, Cr, Cu, Ni, Pb, and Zn concentrations could be grouped into a three-component model with eigenvalues >1, which accounted for 70.15% of the total variances (Table 3).
The first component matrix showed that Fe, Mn, Cd, Co, Cr, Ni, and Pb were associated, displaying high levels in the first component (PC1, a contribution rate of 31.23%), and a strong connection between these seven heavy metals. (Table 3). These findings suggest that Fe, Mn, Cd, Co, Cr, Ni, and Pb are all anthropogenic components that come from the same pollution sources. This is the same result as the correlation analysis’ conclusion. The greatest concentrations of these seven heavy metals were found in the four drain streams and estuaries that were linked to significant pollution from industrial wastewater and household sewage discharge, according to an analysis of regional features. On the other hand, Zn and Cu were poorly correlated with the other seven heavy metals, perhaps because the origin source of this pollutant are different.
In the second component, PC2 explained 23.82% of the total variances, mainly including Zn and Cu (Table 3). These metals’ lower loading factors in the first component implies other sources, which can be defined as anthropogenic components due to the presence of high levels in some soils. Similarly, wastewater and industrial contamination may control the concentrations of Zn and Cu. Because of their high quantities in some sediment, these metals can be classified as anthropogenic components. The fact that these metals have smaller loading factors in the first component suggests that other sources, such as wastewater and industrial pollution, may be controlling Zn and Cu concentrations. PC3 explained 15.10% of the total variance and was dominated by high loadings of Cd and Ni, reflecting their association with Cd and Ni.
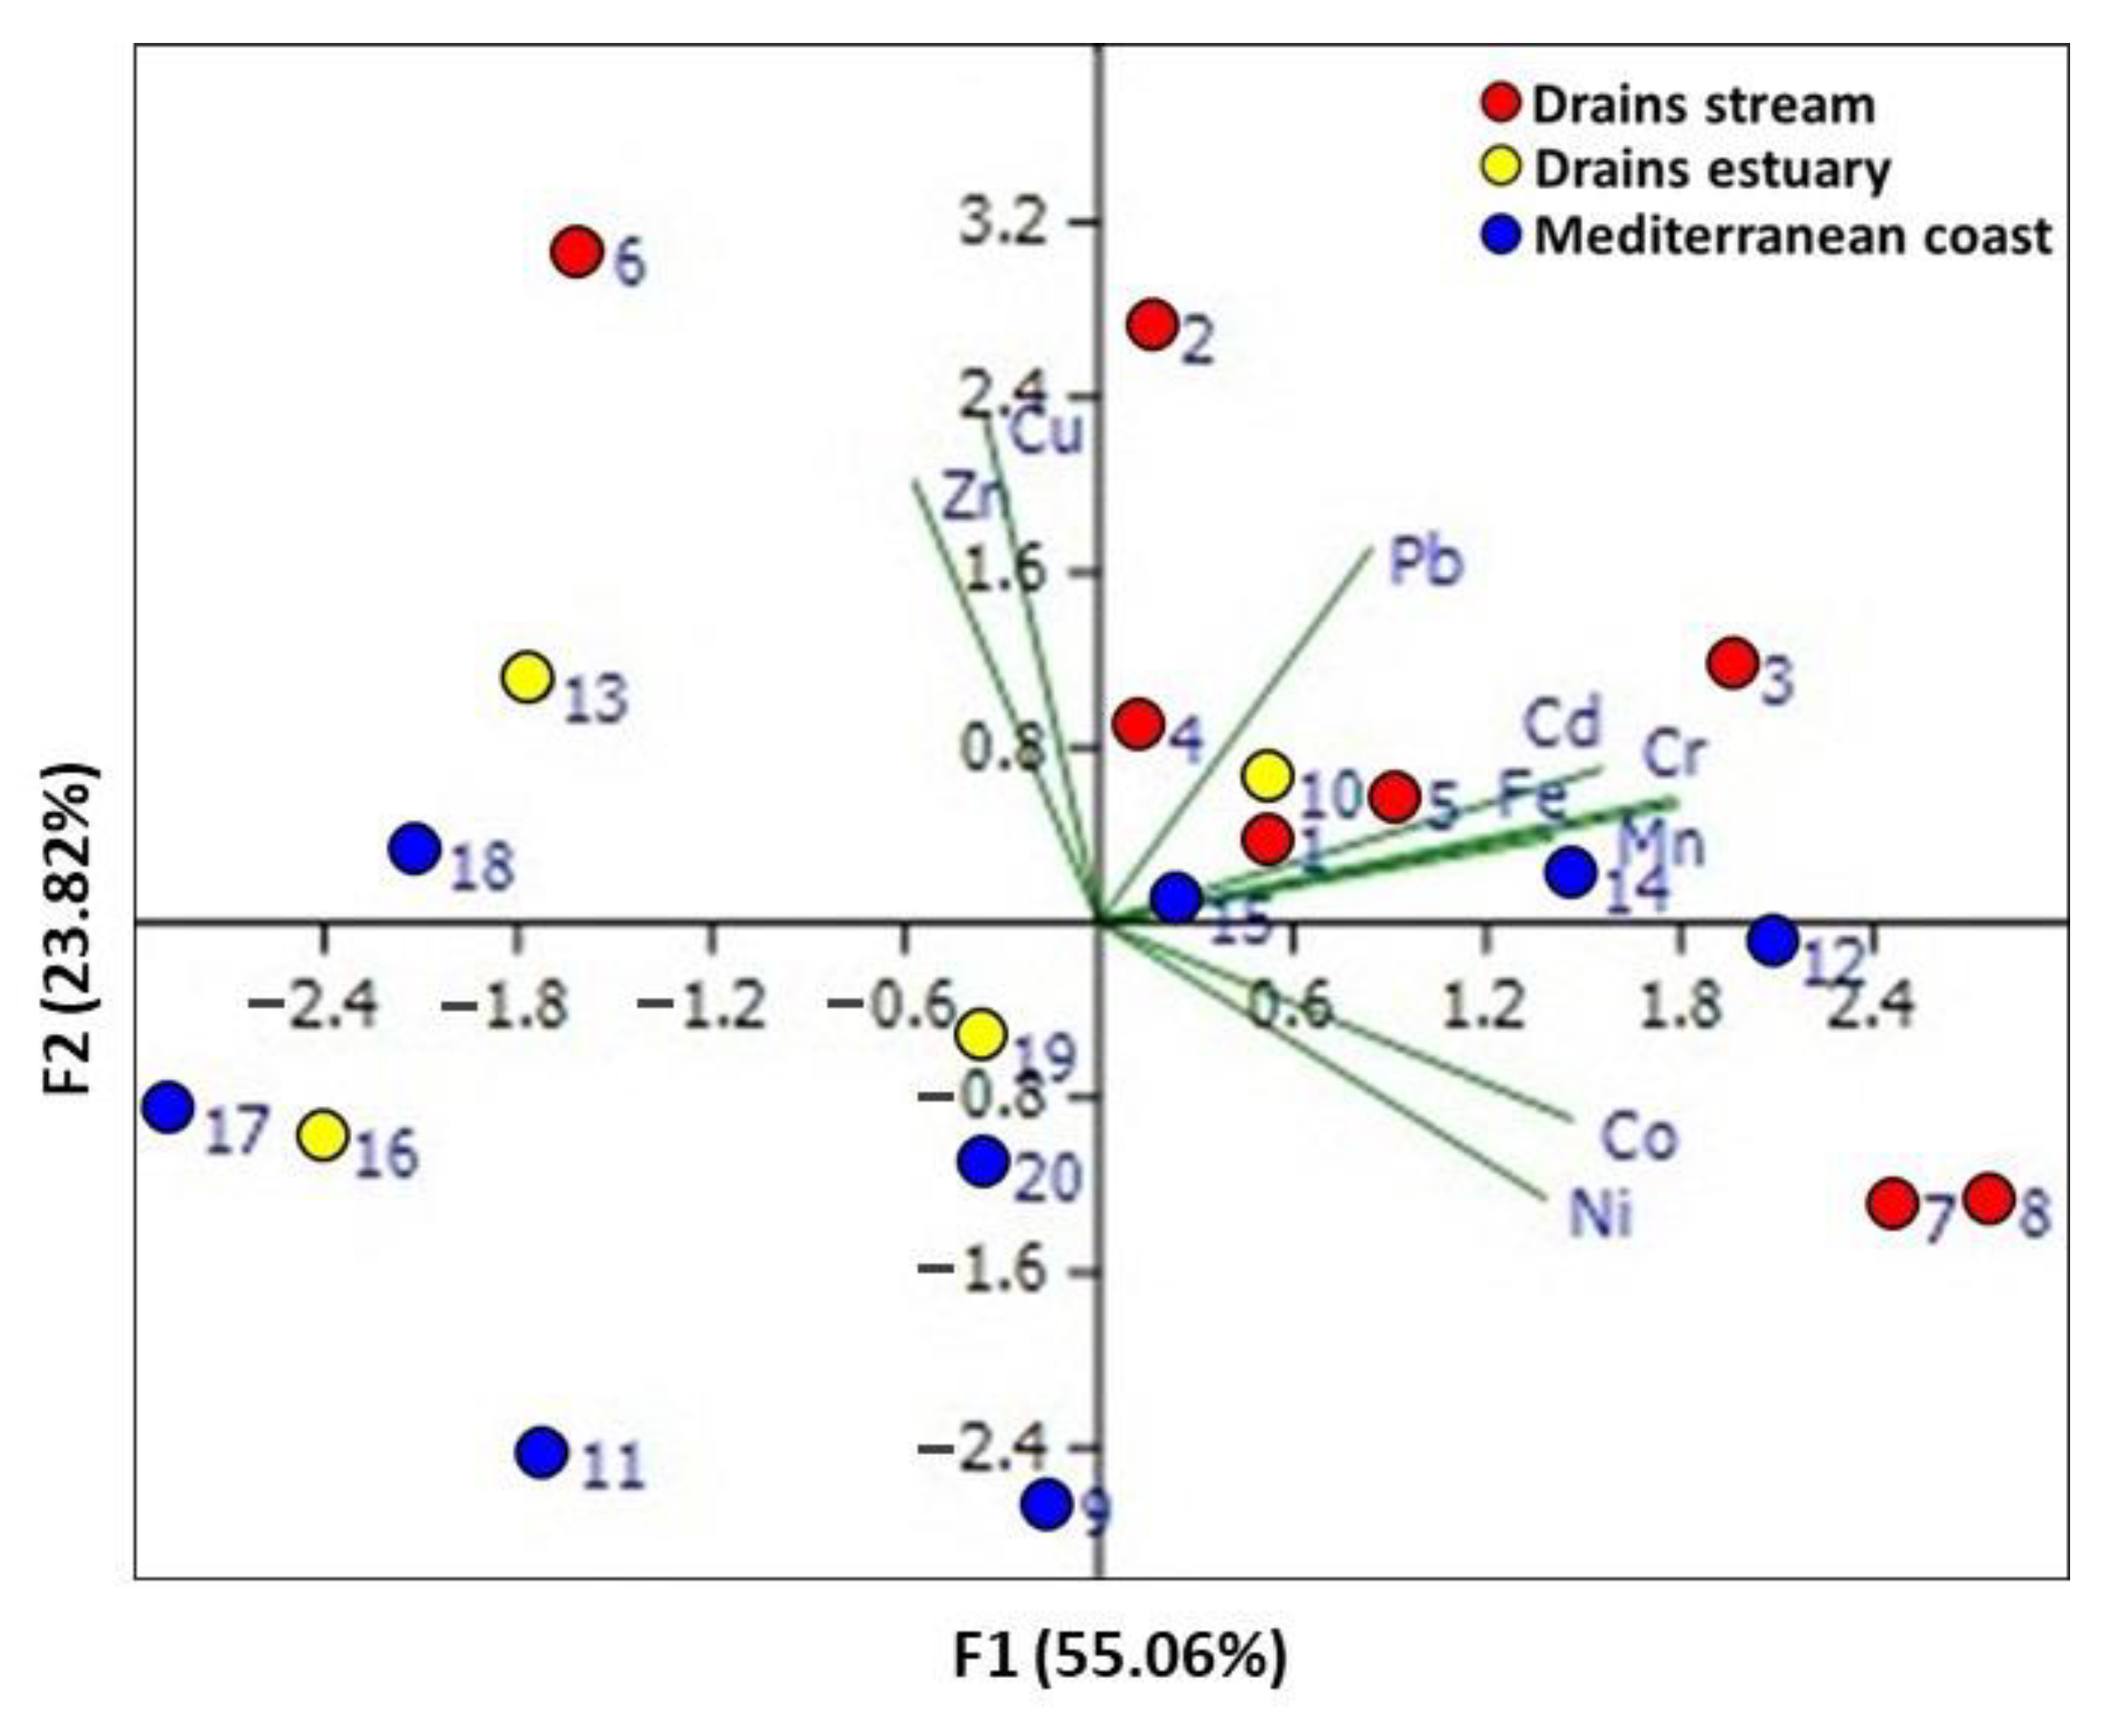
Sediment samples from drain streams (except site 6), estuary of El-Bustan drain (site 10), and Mediterranean coast (sites 12, 14, and 15) are grouped in the positive side of the two PCs (Figure 4) and closer to the variables Cd, Cr, Co, Fe, Mn, Ni, and Pb, which present the highest enrichment in all samples from this area (Table S4). Sediment samples from site 13 (estuary of Gamasa drain), site 18 (Mediterranean coast), and site 6 (Belqas drain) are grouped in the positive side of PC2 and mainly consist of the variable Zn and Cu (Figure 4). On the other hand, sediment samples from sites 19 and 16 (estuaries of Belqas and Kitchener drains) and sites 9, 11, 17, 16, 19, and 20 (Mediterranean coast), with the lowest enrichment of heavy metals (Table S4), are grouped in the negative side of the two PCs, indicating that they have a low influence on the sediment sample at this station.

3.3. Assessment of Sediment Contamination

3.3.1. Enrichment Factor

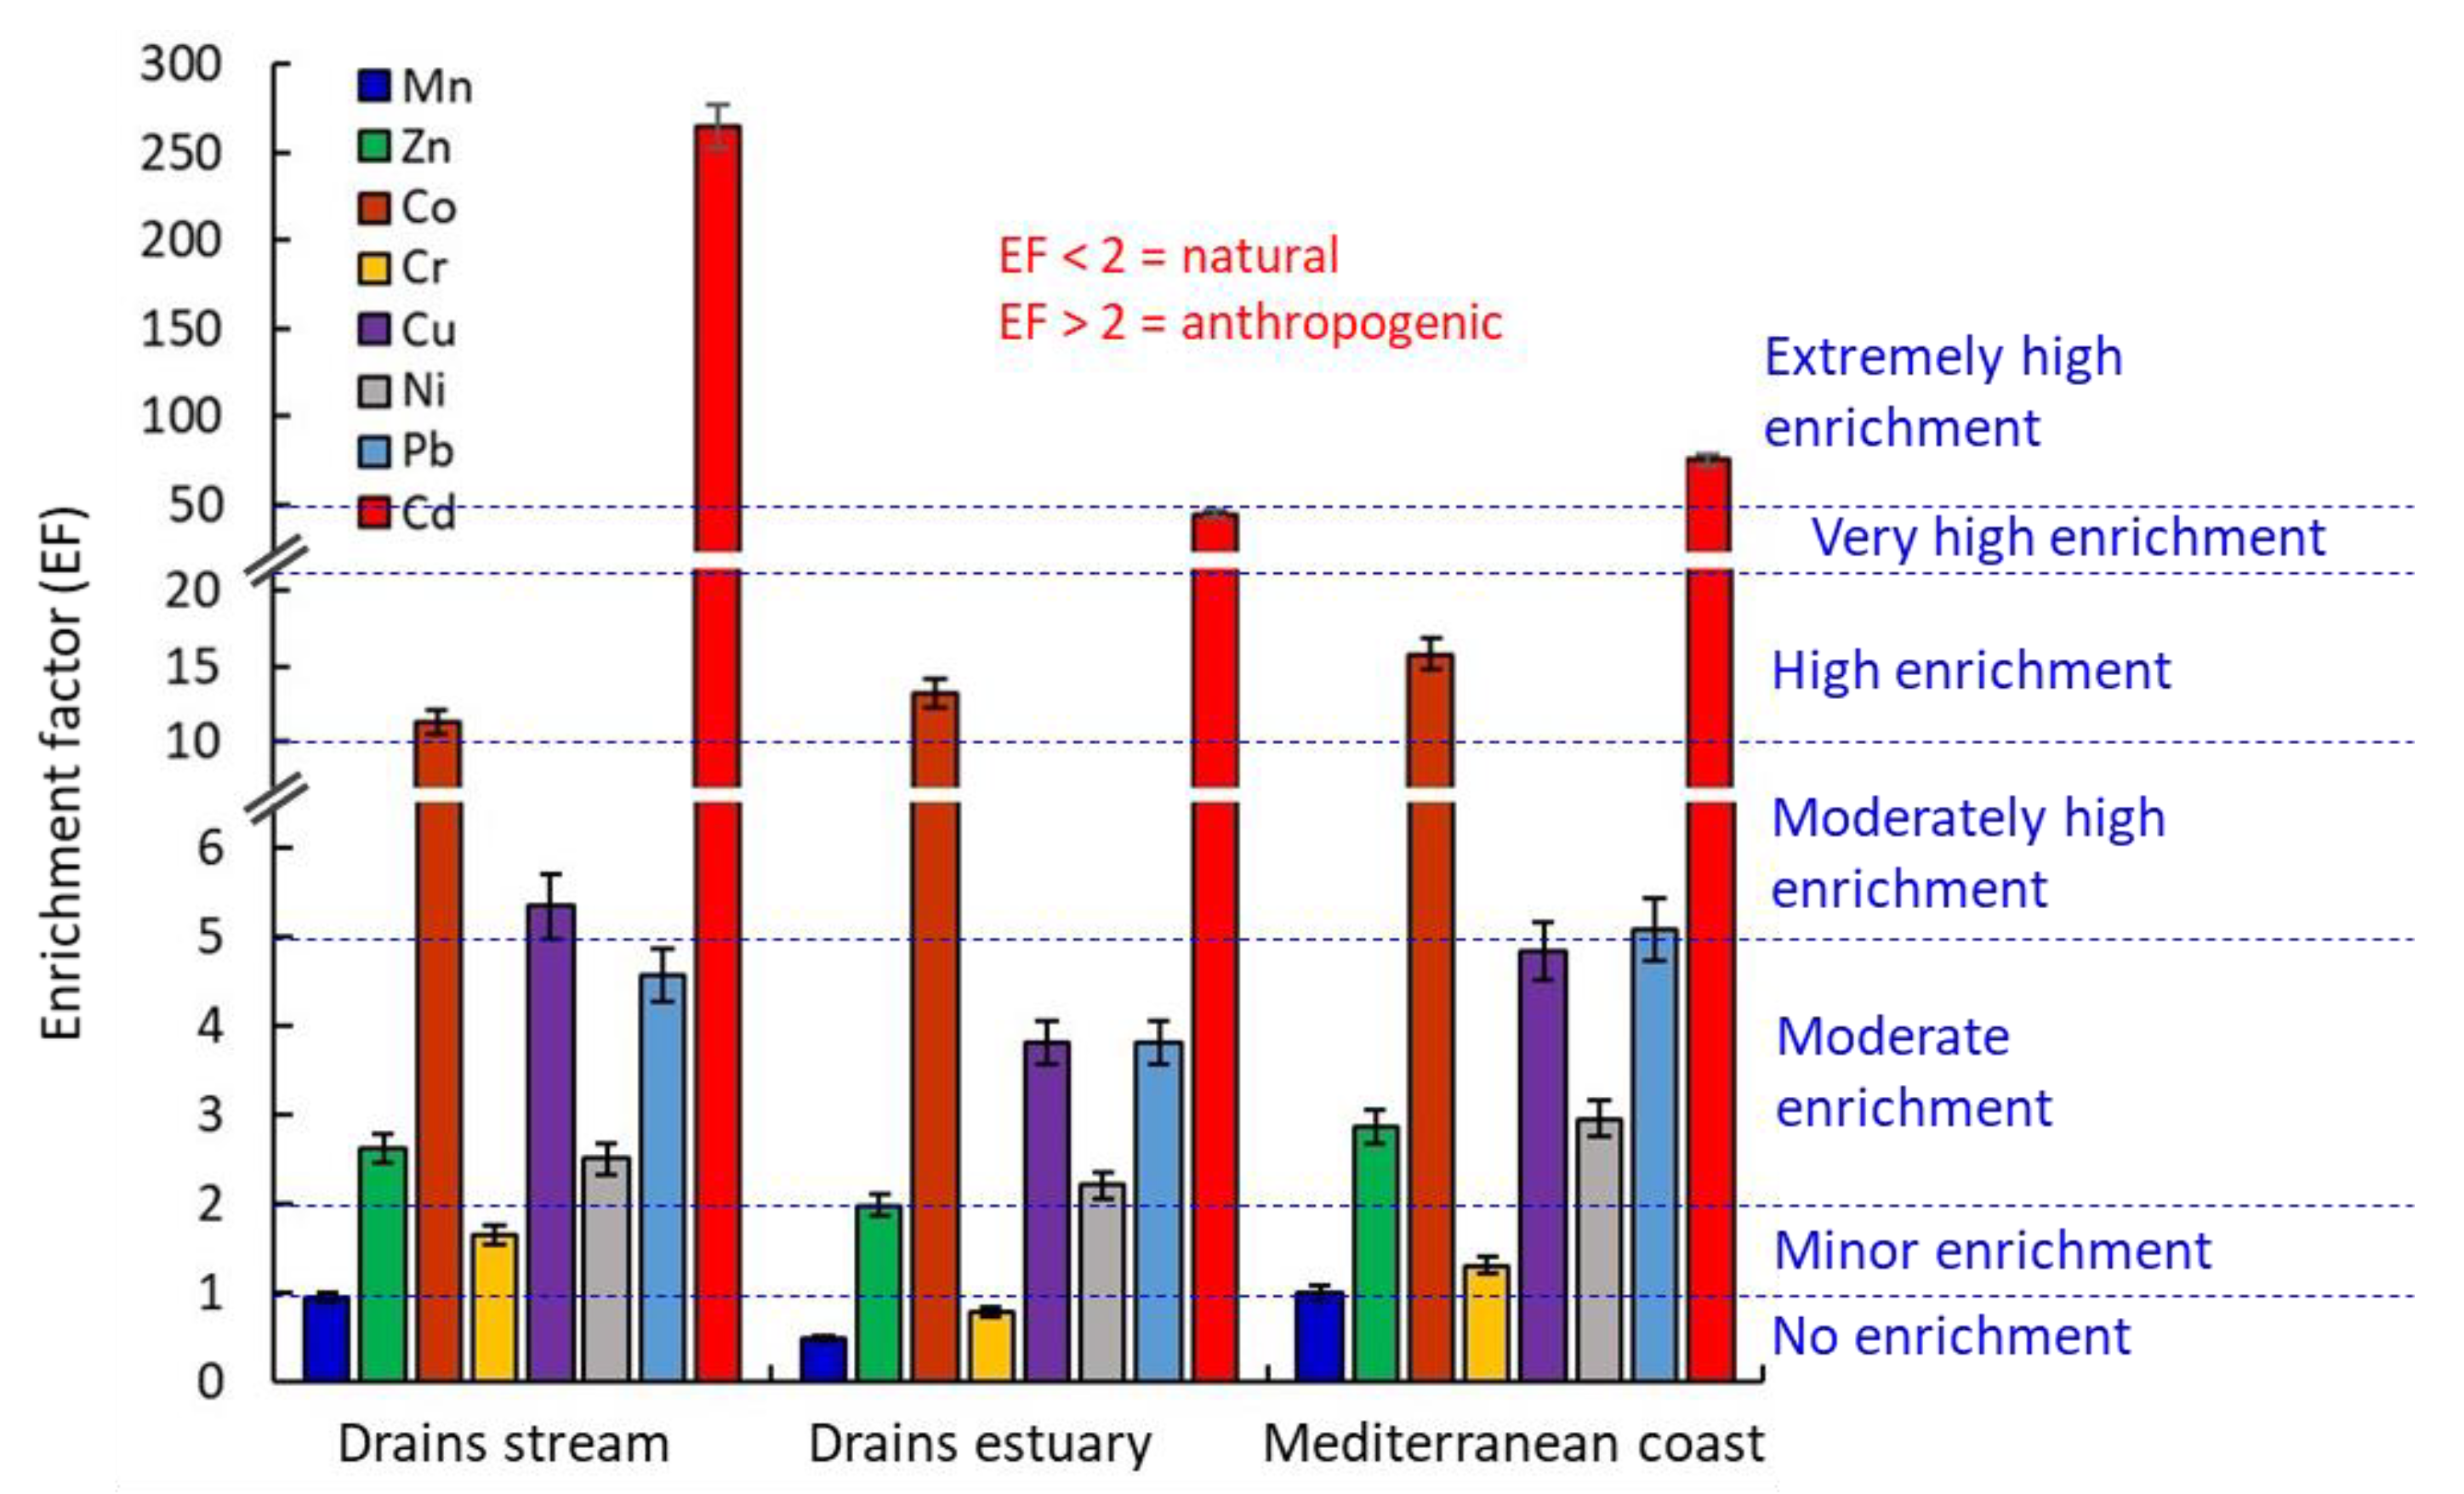
The enrichment factor was utilized in this study to determine the amount of contamination and probable anthropogenic effect on stream sediment samples. Except for Mn and Cr, the average Ef value of all the metals tested revealed enrichment in the investigated sediments. The results show that Zn, Co, Cd, Cu, Pb, and Ni are significantly enriched (Ef > 2) in the surface sediment samples of three locations (Figure 5). The highest Ef is observed for Cd with a value of 265.34 (i.e., extremely high enrichment). Co has the second highest Ef with a value of 11.37 (i.e., high enrichment), followed by Cu (5.35), Pb (4.57), Zn (2.62), Ni (2.50), and Mn (0.95) in the main drain stream. In drains estuary, Mn, Zn, and Cr are less than 2 in sediment samples, indicating a deficiency to moderate enrichment (Figure 5). While Cu, Ni, and Pb have low enrichment (i.e., Ef = 2–5), Co attained high enrichment (Ef = 10–25), and Cd shows extremely high enrichment (Ef > 50). In the Mediterranean coast sediment, the highest Ef value was identified in Cd (i.e., extremely high enrichment) while Co has the second highest Ef value (i.e., high enrichment). Pb was moderately highly enriched; Zn, Cu, and Ni had low enrichment values, and Mn and Cr had no enrichment value. The Ef values of the examined metals were sorted in descending order as follows: Cd > Co > Cu ≈ Pb > Ni > Zn > Cr > Mn (Figure 5).
According to Liuetal. [56], Ef values ranging from 0.05 to 1.50 can be considered to be due natural variations without human influence, whereas non-crustal materials, such as point and non-point anthropogenic sources, have an Ef > 1.50. On this basis, the main source of high metals concentration in the sediment of the study area is the anthropogenic origins except Mn (Figure 5). These higher Ef values are most probably the result of agricultural, municipal, and industrial wastewater discharges upstream of the four studied drains in Nile Delta. Ef values less than 5.0 were not considered significant, as such modest enrichments might be caused by variations in the composition of nearby soil components and the reference sediment used in Ef calculations [57]. Therefore, these elements, Cd, Co, and Pb, represent a source of threat to the Mediterranean coast.

3.3.2. Contamination Factor (Cf) and Contamination Degree (CD)

The contamination factor (Cf) is a ratio of metal concentration in the sediment (Csample) to metal concentration in unpolluted sediment (Cref) that may be used to assess sediment contamination. For measuring heavy metal pollution in soil, the metal content of the Earth’s crust is utilised as a reference value Hakanson [38]. The current findings show that the Cf values for Mn, Fe, Zn, Cr, Cu, Pb, and Ni at all sites are less than one (low contamination). Co, on the other hand, showed moderate contamination (1 ≤ Cf ≤ 3) at all sites. Meanwhile, the Cf values of Cd displayed the highest concentrations (very high contamination) amongst all the studied sites (Figure 6).
The drains stream region had the highest average degree of contamination (DC), with values of 57.43, indicating that the most reached site had DC > 28 (i.e., very high degree of contamination). The data obtained, according to Hakanson [38] and Caeiro et al. [36], suggest serious anthropogenic contamination. Contaminants are carried from agricultural land, sewerage, and tributaries and then deposited in the drains stream. Other regions, such as the drain estuary and the Mediterranean coast, have DC < 28, with values of 15.31 and 20.01, respectively.

3.3.3. Geo-Accumulation Index (Igeo)

The Igeo is the most reliable and widely used index for determining heavy metal accumulations in aquatic sediments. The Igeo was computed using the element’s geochemical background value in the average shale. [39]. The sediments in the drain streams can be categorized as class 0 (Igeo < 1: uncontaminated) except for Cd, which falls in class 2 (1 < Igeo < 2), indicating moderate to heavy contamination. Therefore, according to Müller [41], the metals Fe, Mn, Zn, Co, Cr, Pb, Ni, and Cu are all uncontaminated in the drain streams region, while Cd is moderately to heavily contaminated, with an order of Cd > Co > Pb > Cu > Ni > Zn > Cr > Fe > Mn (Figure 7). Sediments in both the drain estuaries and Mediterranean coast fall in class 0 (uncontaminated).

3.3.4. Ecological Risk Factor (Er) and Potential Ecological Risk Index (PERI)

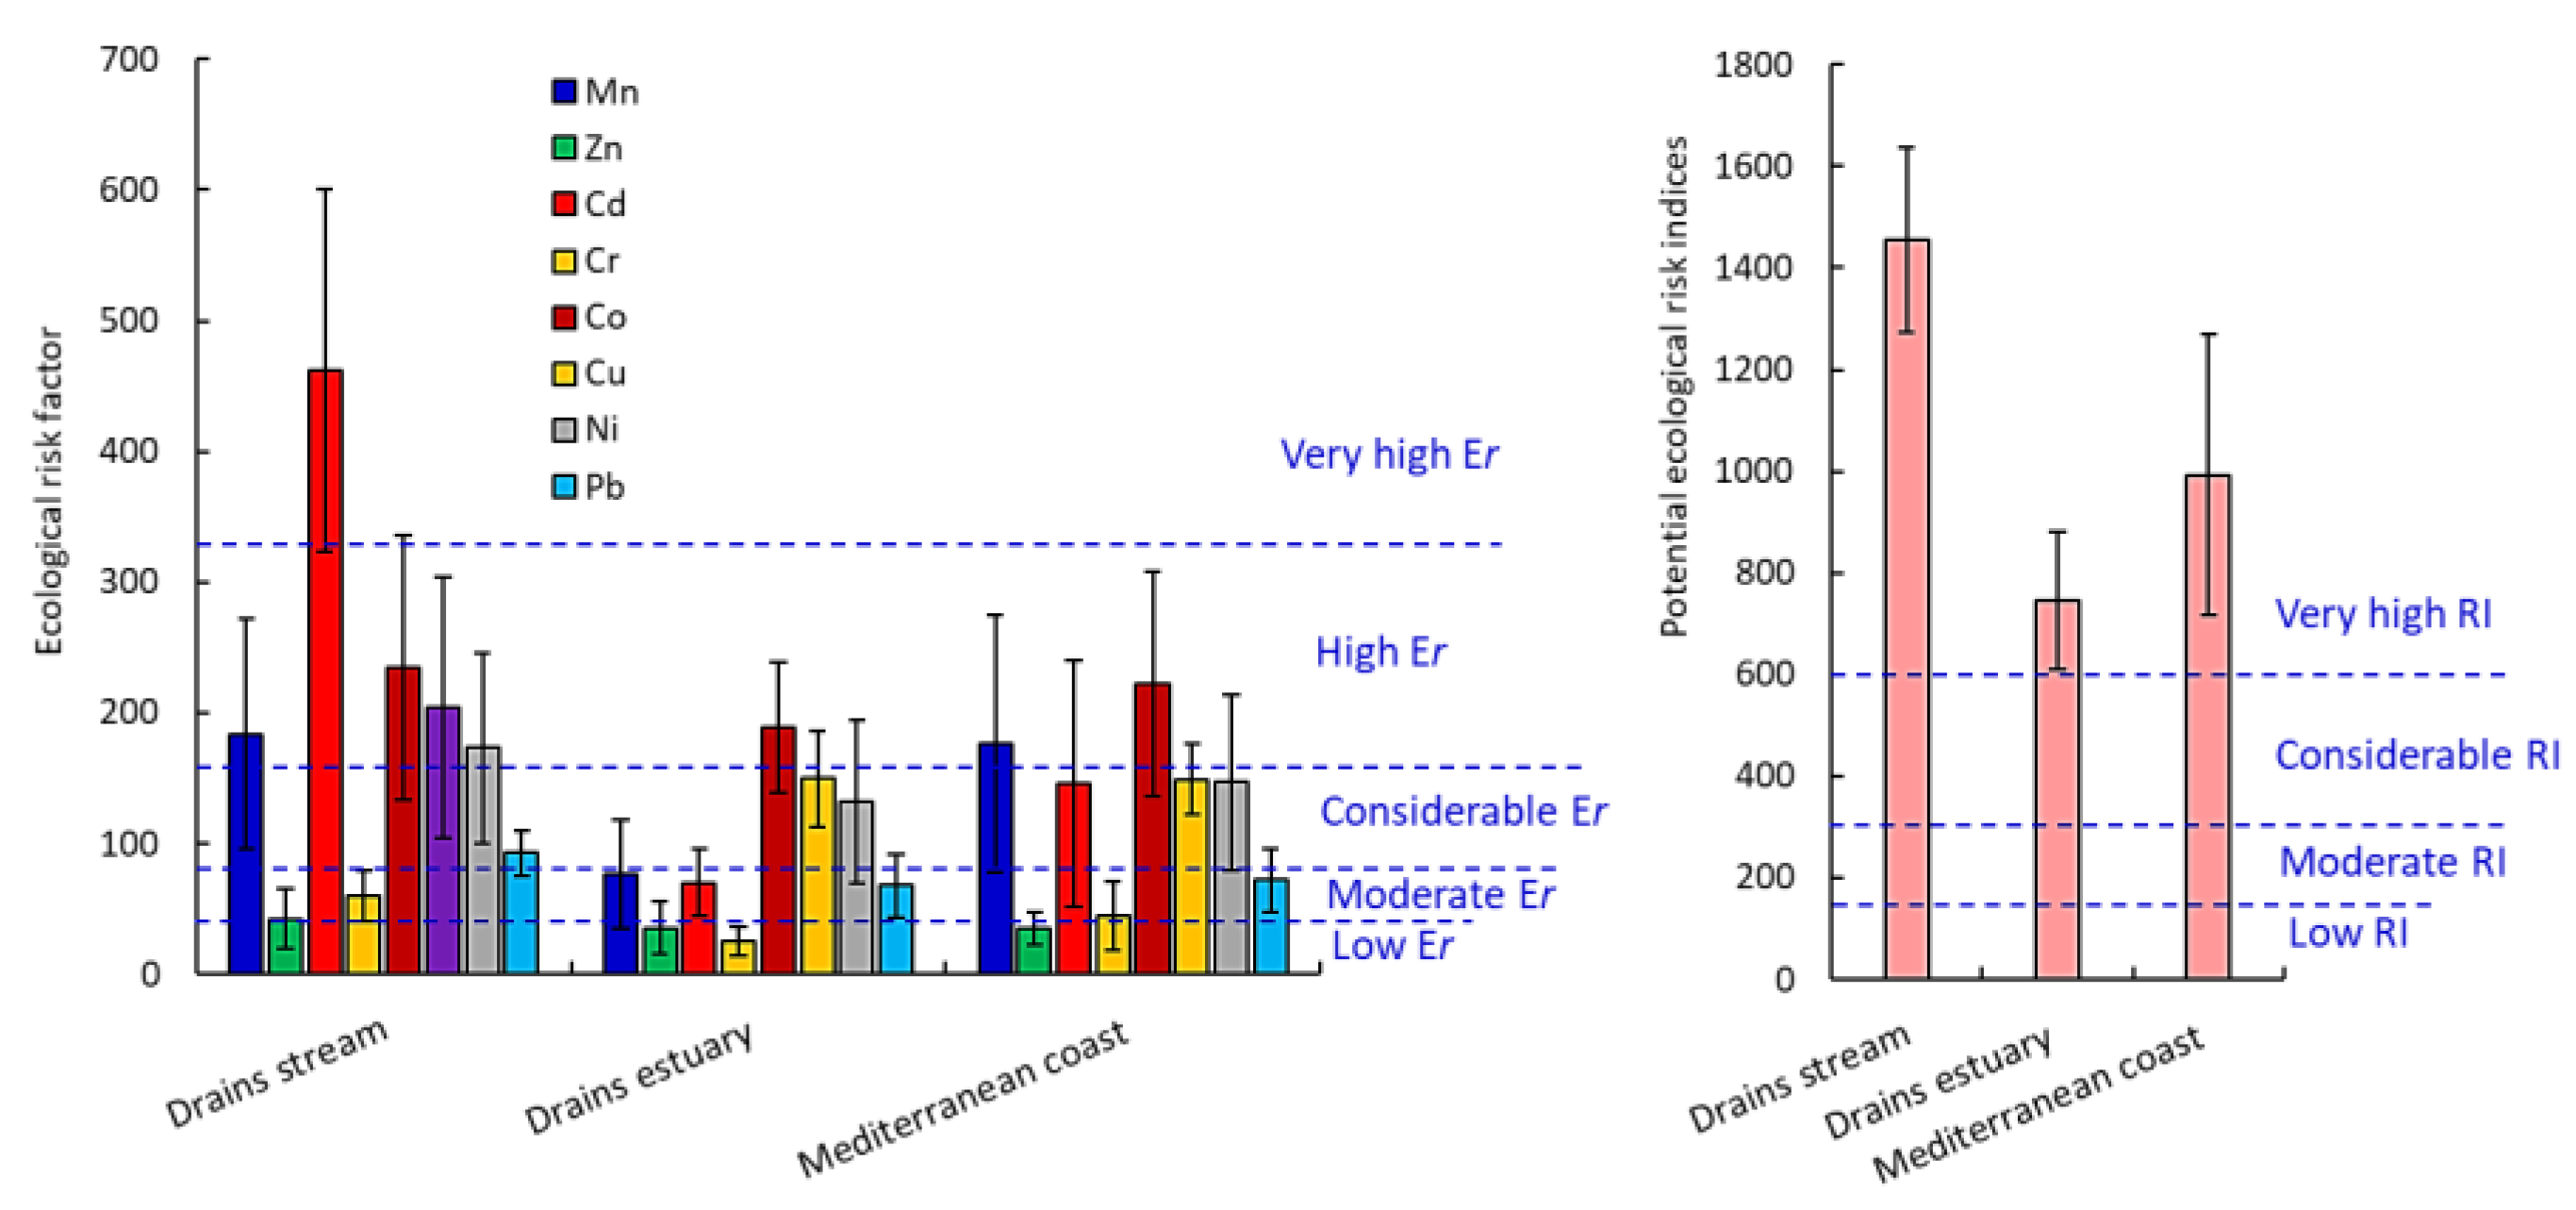
The potential ecological risk index was used to describe the Er of single heavy metals in sediments. The PERI was used to determine the ecological sensitivity of heavy metal contamination in stream sediments based on heavy metal toxicity and environmental responses [38]. Figure 8 depicts the results of the Er and PERI evaluations. The following is a ranking of the Er of heavy metals in the sediments of the drain’s streams: Co > Cu > Mn > Ni > Pb > Cr > Zn (Figure 8). The mean Er values of Pb were considerable (80 < Er < 160), while Cd, Co, Cu, Mn, and Ni were high (160 < Er < 320), and Cd was very high (Er ≥ 320) ecological risk (Figure 8).
The following is a ranking of the Er of heavy metals in the sediments of the drain’s estuary: Co > Cu > Ni > Mn > Cd > Pb > Zn > Cr. The Er index for Zn and Cr had mean values less than 40 (Er < 40; i.e., low ecological risk). Cu and Ni had significant Er values (80 < Er < 160), but Co had a high Er value (160 < Er < 320) (Figure 8). The Er of heavy metals in Mediterranean coast sediments can be graded as follows: Co > Mn > Cu > Ni > Cd > Pb > Cr > Zn (Figure 8). The Er index for Zn has a mean value of less than 40 (Er < 40; i.e., low ecological risk). Cu, Ni, and Cd had considerable Er levels (80 < Er < 160), but Mn and Co had high Er values (160 Er 320). (Figure 8).
The Values of PERI were 1454.10, 746.20, and 992.57 in the drain stream, estuaries, and Mediterranean coast areas, respectively. The human activities play an important role in the environmental risks of these regions and affect the concentrations of heavy metals (Figure 8).

3.4. Heavy Metal Phytoremediation

3.4.1. Heavy Metal Concentrations in Plants

Compared to terrestrial plants, aquatic macrophytes are more tolerant, effective, and appropriate for phytoremediation of pollutants in sludges, sediment, soil, and water, especially for the treatment of household effluents and wastewaters [58]. Semi-aquatic/emergent plant species have acquired appeal among aquatic plants due to their metal-removing abilities [59]. Table S5 shows the amounts of heavy metals in various organs (root and shoot) of emergent species of plants (C. alopecuroides and P. salicifolia) found along the banks of the drains under investigation. In the present study, the heavy metals (Co, Cd, Fe, Mn, Cr, and Ni) exhibited a significant change (p ˂ 0.05) between the two investigated species and between the root and shoot of the same plant, according to the ANOVA analysis (Table S5). Heavy metal concentrations differed based on the plant type, organs, and environment. Because roots are in close contact with the sediment and are characterized by a thick parenchyma cell of their cortex that encompasses large intercellular gaps, roots acquire more heavy metals than shoots [60].
The sequence of heavy metal accumulation was determined in the current study for the root systems as follows: Fe > Mn > Cu ≈ Ni ≈ Zn > Cd > Cr > Co ˃ Pb and Fe > Mn > Ni ˃ Zn ˃ Pb ˃ Cu ≈ Cd ˃ Cr ˃ Co and shoot systems: Fe > Mn > Zn ˃ Cu ≈ Cd ˃ Cr ≈ Pb ˃ Ni ˃ Co and Fe > Mn > Zn ˃ Ni ˃ Cd ˃ Pb > Cu ≈ Cr ˃ Co of the emergent hydrophytes C. alopecuroides and P. salicifolia, respectively (Table S5). In the context, the concentration of heavy metals in the root tissue of the investigated emergent hydrophytes is clearly greater than in the shoot system. Other macrophytes studied in the literature, such as P. australis, E. stagnina, T. domingensis [25,61,62], C. alopecuroides [28], and P. pectinatus [29], revealed that the roots exhibited a greater potential for accumulation than shoots.
Concerning plant shoots, the highest levels of Fe, Mn, and Zn concentrations were seen in C. alopecuroides, while Co, Cd, Ni, Cu, Cr, and Pb were the highest in P. salicifolia. Furthermore, all metal levels were greatest in the root of C. alopecuroides. All emergent hydrophytes in this study exhibited lower amounts of Zn and Cu than the FAO/WHO [63] maximum ordinary value, but they had higher levels of other heavy metals (Cu, Pb, Cr, Ni, Mn, Co, and Fe). Previous research [20,25,64] found greater amounts of heavy metals in wild plants and crops, and our findings are consistent with that.

3.4.2. Assessment of Phytoremediation Efficiency of Plants Species

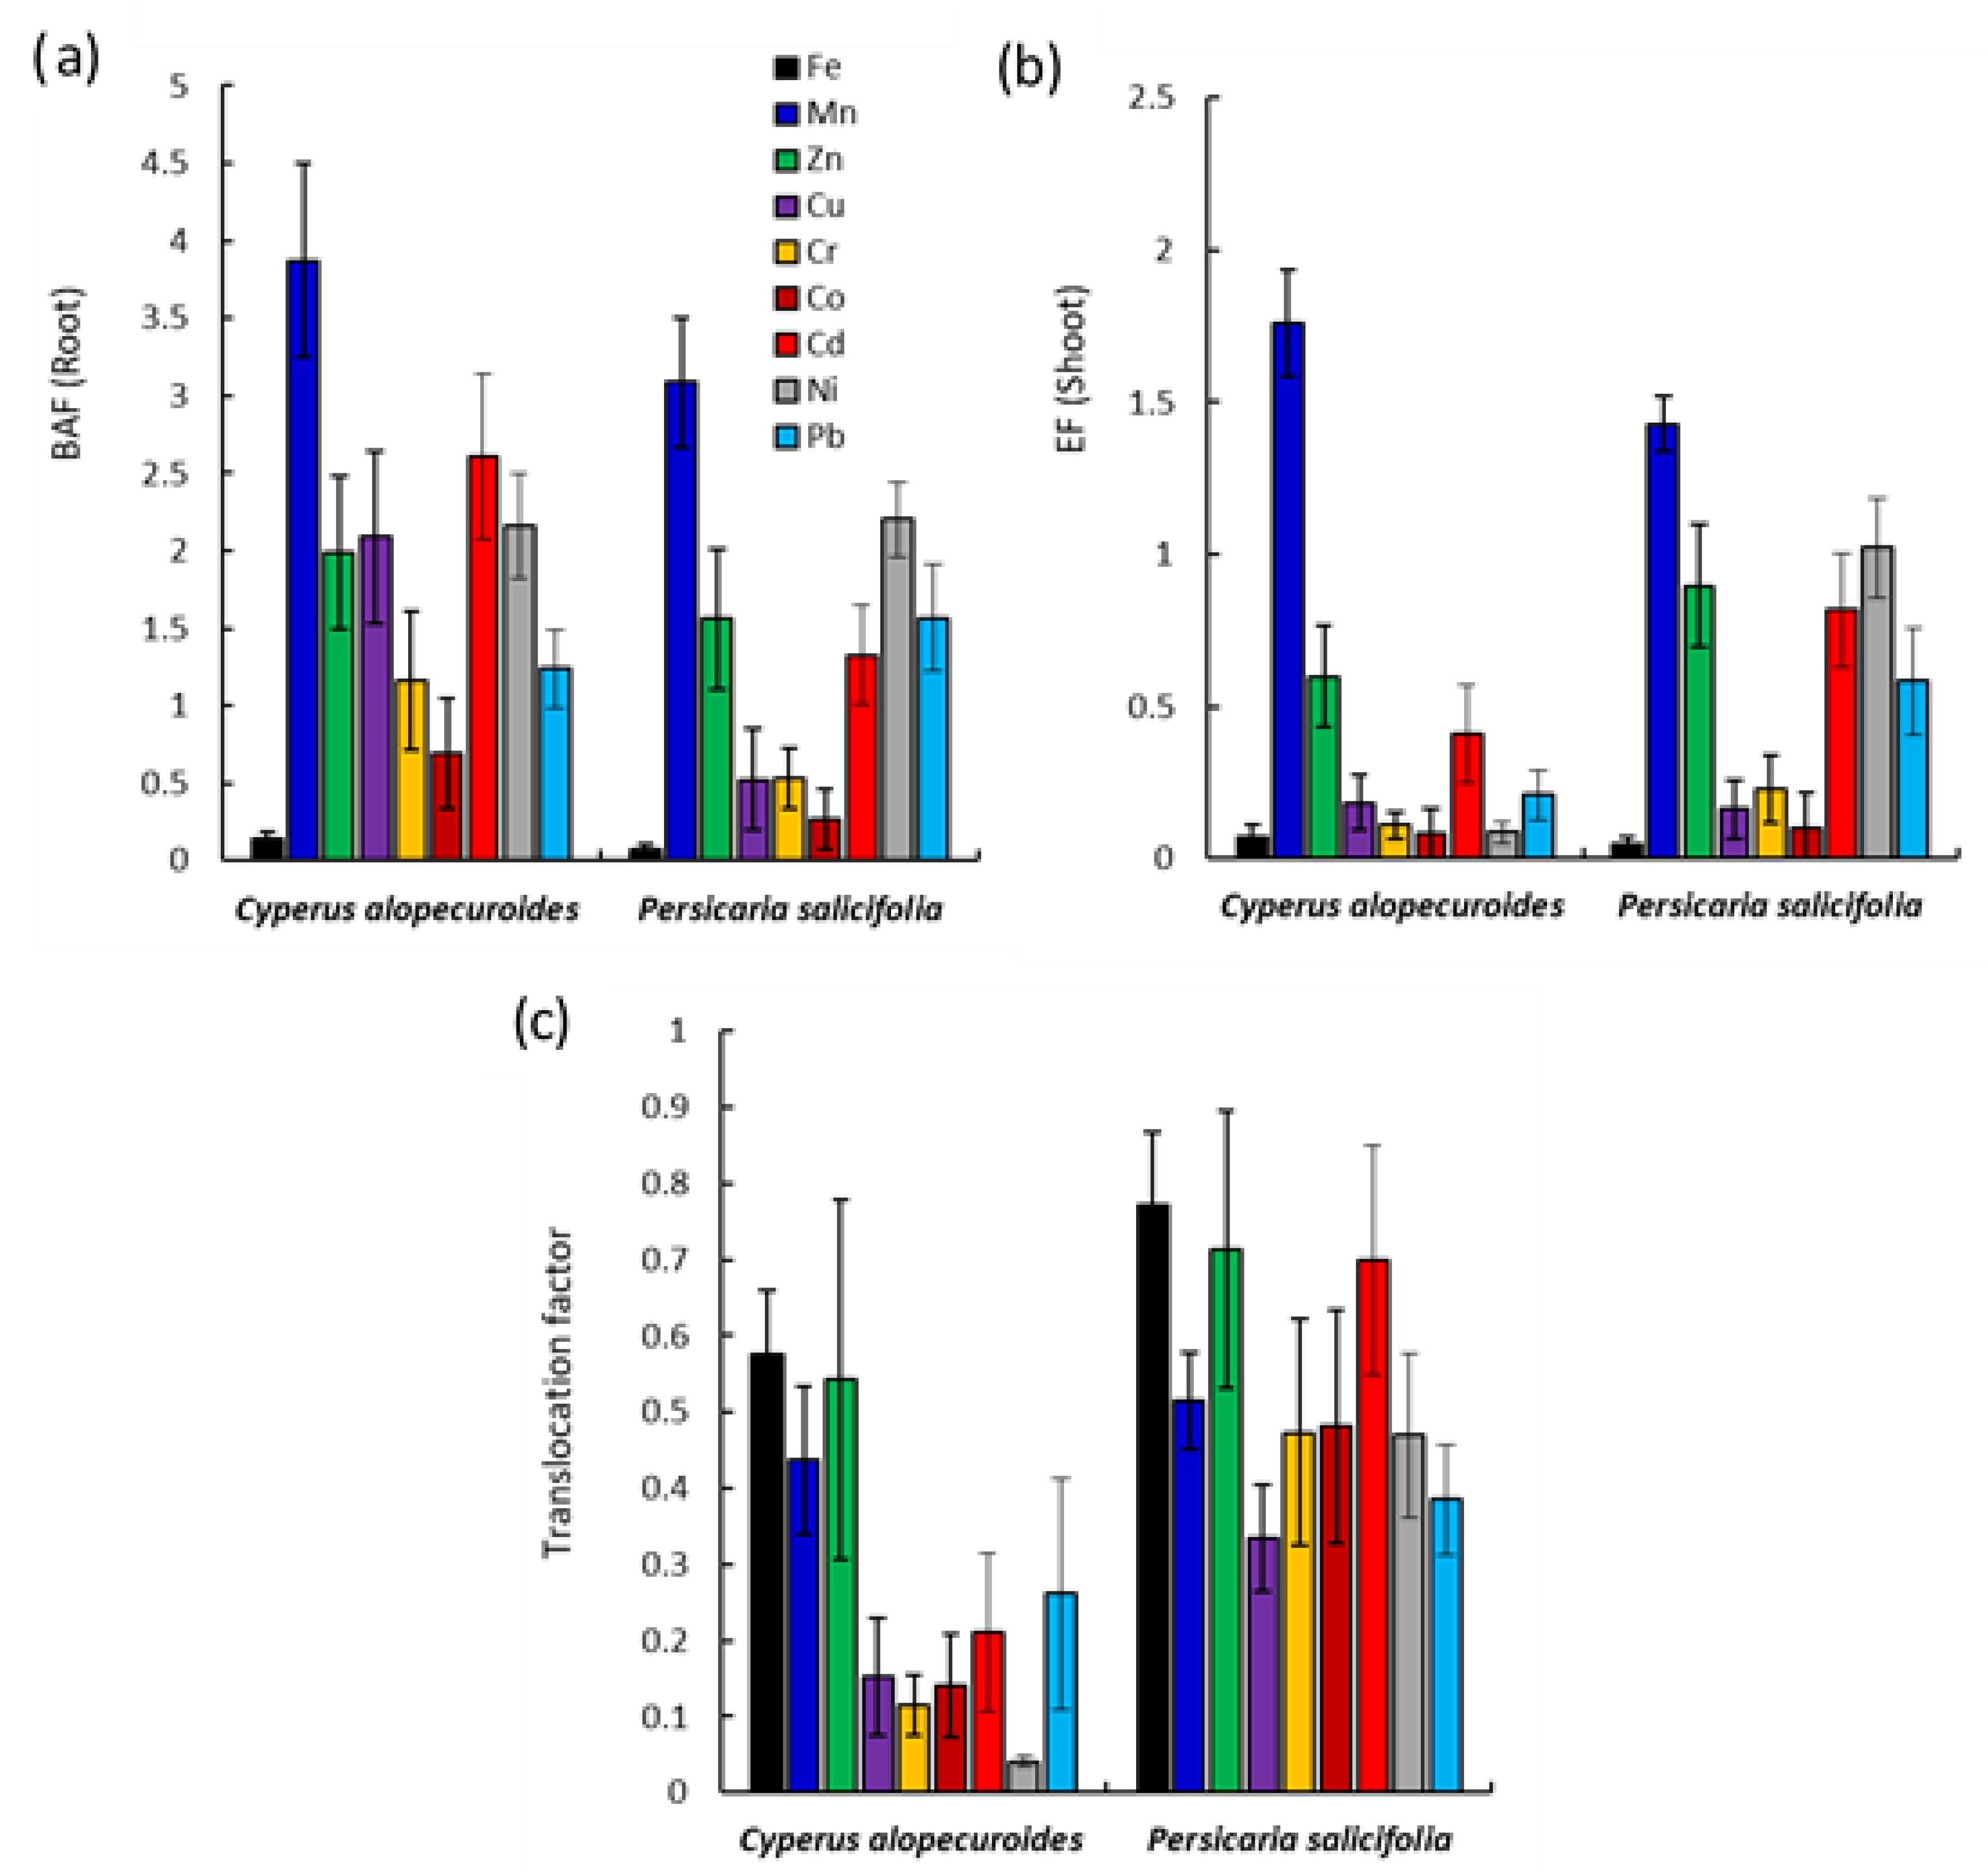
The process of a nutrients or metals migrating from the external environment (water, sediment, soil, air, or diet) into the organism via all potential exposure pathways is known as bioaccumulation [53]. The bioaccumulation indicator was computed to assess the potential of the three emerging aquatic species to eliminate and accumulate heavy metal in their cells. According to BAF data, plant samples absorbed heavy metals in the following order: Mn > Cd > Ni > Cu > Zn > Pb > Cr > Co > Fe for C. alopecuroides, while the ranking for P. salicifolia was Mn > Ni > Pb ≈ Zn > Cd > Cu ≈ Cr > Co > Fe (Figure 9a). In general, these findings were consistent with earlier research [25,29,65].
Except for Ni and Pb in P. salicifolia, C. alopecuroides had the highest root BAF values for most of the heavy metals (Figure 9a). Because the root is the organ responsible for absorption, the root BAF has been widely used to measure heavy metal translocation from the environment. As a result, our findings reveal that C. alopecuroides is the most efficient heavy metal accumulator, with the exception of Pb, which is primarily an air-source contaminant. These findings are consistent with those of earlier research utilizing macrophytes as phytoremediators [25,27,62,66].
As mentioned above, the concentrations of Ni, Pb, Cd, Cu, and Zn indicated a high ecological risk index. In this context, the BAF results for these metals reveal that C. alopecuroides roots have the best capacity to collect Cd, Cu, Ni, Pb, and Zn, with values of 2.60, 2.09, 2.16, 1.24, and 1.99, respectively, whereas P. salicifolia roots had values of 1.34, 2.21, 1.57, and 1.56, respectively (Figure 9a). Plant species having a BAF greater than one are considered appropriate for heavy metal phytoextraction [67].
When a toxin is taken in by a plant tissue and not promptly eliminated, it accumulates in the plant, producing enrichment. When assessing a plant’s phytoremediation capability, the enrichment coefficient (EF) is an essential element to consider. Furthermore, an EF of greater than one implies that the plant has a unique ability to absorb metal ions from soils/water and transport them to aerial portions [68]. According to enrichment factors (EFs) result, the sequence of heavy metal absorption by plant samples is as follows: Mn > Zn > Cd > Pb > Cu > Cr > Ni > Co > Fe for C. alopecuroides, while the order for P. salicifolia was Mn > Ni > Zn > Cd > Pb > Cr > Cu > Co > Fe (Figure 9b).
For most heavy metals, P. salicifolia had the greatest root EFs values with the exception of Fe, Mn, and Cu in C. alopecuroides (Figure 9b). The current study discovered that EFs varied little among the heavy metals studied; nevertheless, Mn and Ni had EFs more than unity (1.43 and 1.02, respectively) in P. salicifolia but only Ni (1.76) in C. alopecuroides.
The distribution of heavy metals between the roots and aboveground organs of C. alopecuroides and P. salicifolia was illustrated using the value of translocation factors (TF) (Figure 9c). According to the TF results, the highest values were found in P. salicifolia for all heavy metals, whereas the TF of all heavy metals in the two emergent studied species was less than unity. The EFs in plant cells differed slightly among the heavy metals examined in this study. The TF of heavy metals in plant samples followed the trend Fe ˃ Zn ˃ Cd ˃ Mn ˃ Co ˃ Cr ˃ Ni ˃ Pb ˃ Cu for C. alopecuroides, while the trend of TF in P. salicifolia was Fe ˃ Zn ˃ Mn ˃ Pb ˃ Cd ˃ Cu ˃ Co ˃ Cr ˃ Ni.
When TF results are compared, it is clear that heavy metals accumulate in roots rather than being translocated onto shoots, suggesting that the macrophytes studied had an internal heavy metal detoxification process [69]. These results are in line with previous studies that used macrophytes as phytoremediators [25,27,62,66]. Because the roots cortex is thicker and has a greater intercellular japs, the localization of heavy metals in roots may be regarded as a detoxifying process for hazardous metals [27]. In comparison to other elements, Fe, Mn, and Zn exhibited a rather constant high TF in the two investigated macrophytes, with values of 0.77, 0.52, and 0.72 for P. salicifolia and 0.58, 0.44, and 0.54 for C. alopecuroides, respectively (Figure 9c). Because Fe, Mn, and Zn are required for photosynthesis and a variety of enzymatic activities, the plant transports them from the roots to the leaves [70]. This conclusion is consistent with the findings of other research [25,27]. We may conclude that heavy metal accumulation in the current investigation is species- and organ-specific.

4. Conclusions

Heavy metal contamination increased from drain streams to estuaries, according to current data on several contamination indices (Ef, Cf, Igeo, Er, Dc, and PERI) in sediment samples from four main drain streams and estuaries in the Nile Delta. Except for Cd, which was extensively distributed in the drain stream region, the findings of the drain estuary samples function as a transitional zone between the results of the drain stream and the Mediterranean shore. Mn, Cr, Zn, and Pb were found to be within normal limits except for Zn and Pb in drain streams, which was above the US-EPA limits, whereas Cd, Co, Cu, and Ni indicated a high ecological risk index, which could be attributed to anthropogenic activates in the Nile Delta. As a result, more study in the middle Nile Delta is needed to analyse Cd, Co, Cu, and Ni distribution on a wider scale; evaluate their probable effects on agricultural and human health; and provide a plan for managing these contaminants.
The highest root BAF values were found in C. alopecuroides for Cd and Cr except for Ni and Pb in P. salicifolia. As a consequence, these two emergent aquatic plants might be indicated as phytoremediators for these four hazardous heavy metals, which are common in canal bank habitats along the Nile Delta drains. As a result, the relevance of employing emergent aquatic plants to stabilize heavy metal pollution was proven in this study, and phytoremediation was suggested as a viable, ecologically friendly, and cost-effective technique for heavy metal remediation in polluted water bodies.
As a result of this study, it was discovered that sediment is a major sink for trace metal contamination, and it plays an essential role in heavy metal absorption by aquatic species and storage in tissues. As a result, the primary approach for protecting the species is to limit the sources of pollution of water and sediments in the aquatic ecosystem.

Supplementary Materials

The following are available online at www.mdpi.com/article/10.3390/su132112244/s1, Table S1: Coordinates and characterization of sampling sites along the four drains and Mediterranean Sea coast; Table S2: Various pollution indices formulas used in the present study; Table S3: Classes of used indices for metals in the present study; Table S4: Various indicators used in the present study to assess the potential of the two macrophytes species for phytoremediation and Table S5: Microelement concentrations (mg kg−1) in roots and shoots of three studied emergent hydrophytes naturally growing along studied drains.

Author Contributions

Conceptualization, Y.A.E.-A., and W.K.K.; validation, Y.A.E.-A., A.Z.E.B., and W.K.K.; formal analysis, Y.A.E.-A., A.Z.E.B., A.E., M.A.E.-E., and W.K.K.; investigation, Y.A.E.-A., A.E., and W.K.K.; writing—original draft preparation, Y.A.E.-A., and W.K.K.; writing—review and editing, Y.A.E.-A., A.Z.E.B., A.E., M.A.E.-E., M.S.A.-H., B.N.S. and W.K.K.; funding acquisition, M.S.A.-H., and B.N.S. All authors have read and agreed to the published version of the manuscript.

Funding

The research was funded by Taif University Researchers Supporting Project number (TURSP-2020/64), Taif University, Taif, Saudi Arabia.

Institutional Review Board Statement

Not applicable.

Informed Consent Statement

Not applicable.

Data Availability Statement

Not applicable.

Acknowledgments

The authors extend their appreciation to Taif University for funding current work by Taif University Researchers Supporting Project number (TURSP-2020/64), Taif University, Taif, Saudi Arabia.

Conflicts of Interest

The authors declare no conflict of interest.

Sample Availability

Samples of the compounds are not available from the authors.

References

  1. Abukila, A.F. Assessing the drain estuaries’ water quality in response to pollution abatement. Water Sci. 2015, 29, 1–18. [Google Scholar] [CrossRef] [Green Version]
  2. El-Alfy, M.A.; El-Amier, Y.A.; El-Eraky, T.E. Land use/cover and eco-toxicity indices for identifying metal contamination in sediments of drains, Manzala Lake, Egypt. Heliyon 2020, 6, e03177. [Google Scholar] [CrossRef] [Green Version]
  3. Elsokkary, I.; Abukila, A.F. Prospective speculation for safe reuse of agricultural drainage water in irrigation. Alex. Sci. Exch. J. 2012, 33, 134–152. [Google Scholar]
  4. Chang, W.K.; Ryu, J.; Yi, Y.; Lee, W.C.; Lee, C.W.; Kang, D.; Lee, C.H.; Hong, S.; Nam, J.; Khim, J.S. Improved water quality in response to pollution control measures at Masan Bay, Korea. Mar. Pollut. Bull. 2012, 64, 427–435. [Google Scholar] [CrossRef] [PubMed]
  5. Malone, T.C.; Newton, A. The globalization of cultural eutrophication in the coastal ocean: Causes and consequences. Front. Mar. Sci. 2020, 7, 670. [Google Scholar] [CrossRef]
  6. SWIM. Review and analysis of status of implementation of wastewater strategies and/or action plans national report- Egypt. Project funded by the European Union. Available online: http://www.swim-sm.eu/files/Natl._Rep._Ww_Strateg.-Eg_Final.Pdf (accessed on 6 July 2013).
  7. Negm, A.M.; Saavedra, O.; El-Adawy, A. Nile Delta biography: Challenges and opportunities; Springer: Cham, Switzerland, 2016. [Google Scholar]
  8. Balkhair, K.S.; Ashraf, M.A. Field accumulation risks of heavy metals in soil and vegetable crop irrigated with sewage water in western region of Saudi Arabia. Saudi J. Biol. Sci. 2016, 23, S32–S44. [Google Scholar] [CrossRef] [Green Version]
  9. Gall, J.E.; Boyd, R.S.; Rajakaruna, N. Transfer of heavy metals through terrestrial food webs: A review. Environ. Monit. Assess. 2015, 187, 201. [Google Scholar] [CrossRef] [Green Version]
  10. Fathy, S.A.; Abdel Hamid, F.F.; Shreadah, M.A.; Mohamed, L.A.; El-Gazar, M. Application of principal component analysis for developing water quality index for selected coastal areas of Alexandria Egypt. Recourses Environ. J. 2012, 2, 297–305. [Google Scholar]
  11. Shreadah, M.A.; Masoud, M.S.; Khattab, A.R.M.; El Zokm, G.M. Impacts of different drains on the seawater quality of El-Mex bay (Alexandria, Egypt). J. Ecol. Nat. Environ. 2014, 6, 287–303. [Google Scholar]
  12. Kostianoy, A.; Kostianaia, E.A.; Soloviev, D.M. Oil Pollution in the Mediterranean Waters of Egypt. In Environmental Remote Sensing in Egypt; Springer: Cham, Switzerland, 2020; pp. 305–328. [Google Scholar]
  13. Bianchini, A.; Cento, F.; Guzzini, A.; Pellegrini, M.; Saccani, C. Sediment management in coastal infrastructures: Techno-economic and environmental impact assessment of alternative technologies to dredging. J. Environ. Manag. 2019, 248, 109332. [Google Scholar] [CrossRef]
  14. Mills, G.; Fones, G. A review of in situ methods and sensors for monitoring the marine environment. Sens. Rev. 2012, 32, 17–28. [Google Scholar] [CrossRef]
  15. Shokr, M.S.; El Baroudy, A.A.; Fullen, M.A.; El-Beshbeshy, T.R.; Ramadan, A.R.; Abd El Halim, A.; Guerra, A.J.; Jorge, M.C. Spatial distribution of heavy metals in the middle nile delta of Egypt. Int. Soil Water Conserv. Res. 2016, 4, 293–303. [Google Scholar] [CrossRef] [Green Version]
  16. El-Alfy, M.A.; Darwish, D.H.; El-Amier, Y.A. Land use Land cover of the Burullus Lake shoreline (Egypt) and health risk assessment of metal-contaminated sediments. Hum Ecol Risk Assess 2021, 27, 898–920. [Google Scholar] [CrossRef]
  17. Ullah, H.; Noreen, S.; Rehman, A.; Waseem, A.; Zubair, S.; Adnan, M.; Ahmad, I. Comparative study of heavy metals content in cosmetic products of different countries marketed in Khyber Pakhtunkhwa, Pakistan. Arab. J. Chem. 2017, 10, 10–18. [Google Scholar] [CrossRef] [Green Version]
  18. El-Amier, Y.A.; Elsayed, A.; El-Esawi, M.A.; Noureldeen, A.; Darwish, H.; Fakhry, H. Optimizing the Biosorption Behavior of Ludwigia stolonifera in the Removal of Lead and Chromium Metal Ions from Synthetic Wastewater. Sustainability 2021, 13, 6390. [Google Scholar] [CrossRef]
  19. Wasi, S.; Tabrez, S.; Ahmad, M. Toxicological effects of major environmental pollutants: An overview. Environ. Monit. Assess. 2013, 185, 2585–2593. [Google Scholar] [CrossRef] [PubMed]
  20. El-Amier, Y.A.; Alghanem, S.M. Tree leaves as bioindicator of heavy metal pollution from soil and ambient air in urban environmental. Plant Arch. 2018, 18, 2559–2566. [Google Scholar]
  21. El Awady, F.R.; Abbas, M.A.; Abdelghany, A.M.; El-Amier, Y.A. Silver Modified Hydrophytes for Heavy Metal Removal from Different Water Resources. Biointerface Res. Appl. Chem. 2021, 11, 14555–14563. [Google Scholar]
  22. Cho-Ruk, K.; Kurukote, J.; Supprung, F.; Vetayasuporn, S. Perennial Plants in the phytoremediation of lead contaminated soils. Biotechnology 2006, 5, 1–4. [Google Scholar]
  23. Kumar, A.; Cabral Pinto, M.; Candeias, C.; Dinis, P.A. Baseline maps of potentially toxic elements on soils of Garhwal Himalaya, India: Assessment of their eco-environmental and human health risks. Land Degrad. Dev. 2021, 32, 3856–3869. [Google Scholar] [CrossRef]
  24. Rajput, V.; Minkina, T.; Semenkov, I.; Klink, G.; Tarigholizadeh, S.; Sushkova, S. Phylogenetic analysis of hyperaccumulator plant species for heavy metals and polycyclic aromatic hydrocarbons. Environ. Geochem. Health 2021, 43, 1629–1654. [Google Scholar] [CrossRef]
  25. El-Amier, Y.A.; Bonanomi, G.; Al-Rowaily, S.L.; Abd-ElGawad, A.M. Ecological risk assessment of heavy metals along three main drains in Nile Delta and potential phytoremediation by macrophyte plants. Plants 2020, 9, 910. [Google Scholar] [CrossRef]
  26. Rezania, S.; Taib, S.M.; Din, M.F.M.; Dahalan, F.A.; Kamyab, H. Comprehensive review on phytotechnology: Heavy metals removal by diverse aquatic plants species from wastewater. J. Hazard. Mater. 2016, 318, 587–599. [Google Scholar] [CrossRef]
  27. Bonanno, G. Comparative performance of trace element bioaccumulation and biomonitoring in the plant species Typha domingensis, Phragmites australis and Arundo donax. Ecotoxicol. Environ. Saf. 2013, 97, 124–130. [Google Scholar] [CrossRef]
  28. de Queiroz, R.D.C.S.; Maranduba, H.L.; Hafner, M.B.; Rodrigues, L.B.; de Almeida Neto, J.A. Life cycle thinking applied to phytoremediation of dairy wastewater using aquatic macrophytes for treatment and biomass production. J. Clean. Prod. 2020, 267, 122006. [Google Scholar] [CrossRef]
  29. Peng, K.; Luo, C.; Lou, L.; Li, X.; Shen, Z. Bioaccumulation of heavy metals by the aquatic plants Potamogeton pectinatus L. and Potamogeton malaianus Miq. and their potential use for contamination indicators and in wastewater treatment. Sci. Total Environ. 2008, 392, 22–29. [Google Scholar] [CrossRef]
  30. Arruti, A.; Fernández-Olmo, I.; Irabien, Á. Evaluation of the contribution of local sources to trace metals levels in urban PM2. 5 and PM10 in the Cantabria region (Northern Spain). J. Environ. Monit. 2010, 12, 1451–1458. [Google Scholar] [CrossRef] [PubMed]
  31. FAO. Land Resources Information Systems in the Near East. In Proceedings of the Regional Workshop, Cairo, Egypt, 3–7 September 2002. [Google Scholar]
  32. Abayazid, H.; Al-Shinnawy, I. Coastal lake sustainability: Threats and opportunities with climate change. IOSR J. Mech. Civ. Eng. 2012, 1, 33–41. [Google Scholar] [CrossRef]
  33. Boulos, L. Flora of Egypt, Volume 4: Monocotyledons (Alismataceae-Orchidaceae); All Hadara Publishing: Cairo, Egypt, 2005. [Google Scholar]
  34. ISO. Soil Quality—Microwave Assisted Extraction of the Aqua Regia Soluble Fraction for the Determination of Elements; ISO: Geneva, Switzerland, 2012. [Google Scholar]
  35. ISO. Water Quality—Determination of Selected Elements by Inductively Coupled Plasma Optical Emission Spectrometry (ICPOES); ISO 11885:2007; ISO: Geneva, Switzerland, 2009. [Google Scholar]
  36. Caeiro, S.; Costa, M.H.; Ramos, T.B.; Fernandes, F.; Silveira, N.; Coimbra, A.; Medeiros, G.; Painho, M. Assessing heavy metal contamination in Sado Estuary sediment: An index analysis approach. Ecol. Indic. 2005, 5, 151–169. [Google Scholar] [CrossRef]
  37. Franco-Uría, A.; López-Mateo, C.; Roca, E.; Fernández-Marcos, M.L. Source identification of heavy metals in pastureland by multivariate analysis in NW Spain. J. Hazard. Mater. 2009, 165, 1008–1015. [Google Scholar] [CrossRef]
  38. Hakanson, L. An ecological risk index for aquatic pollution control. A sedimentological approach. Water Res. 1980, 14, 975–1001. [Google Scholar] [CrossRef]
  39. Kowalska, J.; Mazurek, R.; Ga˛siorek, M.; Setlak, M.; Zaleski, T.; Waroszewski, J. Soil pollution indices conditioned by medieval metallurgical activity-A case study from Krakow (Poland). Environ. Pollut. 2016, 218, 1023–1036. [Google Scholar] [CrossRef] [PubMed]
  40. Lu, S.; Bai, S. Contamination and potential mobility assessment of heavy metals in urban soils of Hangzhou, China: Relationship with different land uses. Environ. Earth Sci. 2010, 60, 1481–1490. [Google Scholar] [CrossRef]
  41. Müller, G. Die Schwermetallbelstung der sediment des Neckars und seiner Nebenflusse: Eine Bestandsaufnahme. Chem. Ztg. 1981, 105, 156–164. [Google Scholar]
  42. Baker, A.J.M. Accumulators and excluders-strategies in the response of plants to heavy metals. J. Plant Nutr. 1981, 3, 643–654. [Google Scholar] [CrossRef]
  43. Ghosh, M.; Singh, S.P. A review on phytoremediation of heavy metals and utilization of it’s by products. Asian J. Energy Env. 2005, 6, 18. [Google Scholar]
  44. Zou, J.; Dai, W.; Gong, S.; Ma, Z. Analysis of spatial variations and sources of heavy metals in farmland soils of Beijing suburbs. PLoS ONE 2015, 10, e0118082. [Google Scholar] [CrossRef]
  45. Beaver, M.B.; Beaver, J.R.; Mendenhall, W. Introduction to Probability and Statistics; Cengage Learning: New Delhi, India, 2012. [Google Scholar]
  46. USA-EPA. Screening Level Ecological Risk Assessment Protocol for HazardousWaste Combustion Facilities, Appendix E: Toxicity Reference Values; EPA530-D99–001C; USA EPA: Dallas, TX, USA, 2011; Volume 3.
  47. CSQGD. Canadian Soil Quality Guidelines for the Protection of Environment and Human Health; Canadian Council of Ministers of the Environment: Winnipeg, MB, Canada, 2007. [Google Scholar]
  48. Li, F.Y.; Fan, Z.P.; Xiao, P.F.; Oh, K.; Ma, X.P.; Hou, W. Contamination, chemical speciation and vertical distribution of heavy metals in soils of an old and large industrial zone in Northeast China. Environ. Geol. 2009, 54, 1815–1823. [Google Scholar] [CrossRef]
  49. Bessa, A.Z.E.; Ngueutchoua, G.; Janpou, A.K.; El-Amier, Y.A.; Nguetnga, O.A.N.N.M.; Kayou, U.R.K.; Bisse, S.B.; Mapuna, E.C.N.; Armstrong-Altrin, J.S. Heavy metal contamination and its ecological risks in the beach sediments along the Atlantic Ocean (Limbe coastal fringes, Cameroon). Earth Syst. Environ. 2021, 5, 433–444. [Google Scholar] [CrossRef]
  50. Ramasamy, V.; Senthil, S.; Paramasivam, K.; Suresh, G. Potential toxicity of heavy metals in beach and intertidal sediments: A comparative study. Acta Ecol. Sin. 2021. [Google Scholar] [CrossRef]
  51. Guo, B.; Hong, C.; Tong, W.; Xu, M.; Huang, C.; Yin, H.; Lin, Y.; Fu, Q. Health risk assessment of heavy metal pollution in a soil-rice system: A case study in the Jin-Qu Basin of China. Sci. Rep. 2020, 10, 1–11. [Google Scholar] [CrossRef] [PubMed]
  52. Rodriguez, J.A.; Lopez-Arias, M.; Grau Corbi, J.M. Heavy metals contents in agricultural topsoils in the Ebro basin (Spain). Application of the multivariate geostatistical methods to study spatial variations. Environ. Pollut. 2006, 144, 1001–1012. [Google Scholar] [CrossRef] [PubMed]
  53. Zhang, C.; Yu, Z.G.; Zeng, G.M.; Jiang, M.; Yang, Z.Z.; Cui, F.; Zhu, M.Y.; Shen, L.Q.; Hu, L. Effects of sediment geochemical properties on heavy metal bioavailability. Environ. Int. 2014, 73, 270–281. [Google Scholar] [CrossRef] [PubMed]
  54. Facchinelli, A.; Sacchi, E.; Mallen, L. Multivariate statistical and GIS-based approach to identify heavy metal sources in soils. Environ. Pollut. 2001, 114, 313–324. [Google Scholar] [CrossRef]
  55. Sun, Y.; Zhou, Q.; Xie, X.; Liu, R. Spatial, sources and risk assessment of heavy metal contamination of urban soils in typical regions of Shenyang, China. J. Hazard. Mater. 2010, 174, 455–462. [Google Scholar] [CrossRef]
  56. Liu, J.; Yin, P.; Chen, B.; Gao, F.; Song, H.; Li, M. Distribution and contamination assessment of heavy metals in surface sediments of the Luanhe River Estuary, northwest of the Bohai Sea. Mar. Pollut. Bull. 2016, 109, 633–639. [Google Scholar] [CrossRef]
  57. Sezgin, N.; Ozcan, H.K.; Demir, G.; Nemlioglu, S.; Bayat, C. Determination of heavy metal concentrations in street dusts in Istanbul E-5 highway. Environ. Int. 2004, 29, 979–985. [Google Scholar] [CrossRef]
  58. Sood, A.; Uniyal, P.; Prasanna, R.; Ahluwalia, A. Phytoremediation potential of aquatic macrophyte, Azolla. Ambio 2012, 41, 122–137. [Google Scholar] [CrossRef] [Green Version]
  59. Dhir, B.; Sharmila, P.; Saradhi, P.P. Potential of aquatic macrophytes for removing contaminants from the environment. Crit. Rev. Environ. Sci. Technol. 2009, 39, 754–781. [Google Scholar] [CrossRef]
  60. Sawidis, T.; Chettri, M.K.; Zachariadis, G.A.; Stratis, J.A. Heavy metals in aquatic plants and sediments from water systems in Macedonia, Greece. Ecotoxicol. Environ. Saf. 1995, 32, 73–80. [Google Scholar] [CrossRef]
  61. Bonanno, G.; Giudice, R.L. Heavy metal bioaccumulation by the organs of Phragmites australis (common reed) and their potential use as contamination indicators. Ecol. Indic. 2010, 10, 639–645. [Google Scholar] [CrossRef]
  62. Cicero-Fernández, D.; Peña-Fernández, M.; Expósito-Camargo, J.A.; Antizar-Ladislao, B. Role of Phragmites australis (common reed) for heavy metals phytoremediation of estuarine sediments. Int. J. Phytoremediation 2016, 18, 575–582. [Google Scholar] [CrossRef]
  63. FAO; WHO. Joint FAO/WHO Food Standards Programme Codex Committee on Contaminants in Foods, 5th ed.; WHO: Geneva, Switzerland, 2011. [Google Scholar]
  64. Wang, X.; Sato, T.; Xing, B.; Tao, S. Health risks of heavy metals to the general public in Tianjin, China via consumption of vegetables and fish. Sci. Total Environ. 2005, 350, 28–37. [Google Scholar] [CrossRef] [PubMed]
  65. El-Amier, Y.A.; El-Alfy, M.A.; Nofal, M.M. Macrophytes potential for removal of heavy metals from aquatic ecosystem, Egypt: Using metal accumulation index (MAI). Plant Arch. 2018, 18, 2131–2144. [Google Scholar]
  66. Khandare, R.V.; Watharkar, A.D.; Pawar, P.K.; Jagtap, A.A.; Desai, N.S. Hydrophytic plants Canna indica, Epipremnum aureum, Cyperus alternifolius and Cyperus rotundus for phytoremediation of fluoride from water. Environ. Technol. Innov. 2021, 21, 101234. [Google Scholar] [CrossRef]
  67. Pilon-Smits, E. Phytoremediation. Annu. Rev. Plant Biol. 2005, 56, 15–39. [Google Scholar] [CrossRef]
  68. Ghavri, S.V.; Bauddh, K.; Kumar, S.; Singh, R.P. Bioaccumulation and translocation potential of Na+ and K+ in native weeds grown on industrially contaminated soil. Int. J. Chem. Tech. Res. 2013, 5, 1869–1875. [Google Scholar]
  69. Jiang, B.; Xing, Y.; Zhang, B.; Cai, R.; Zhang, D.; Sun, G. Effective phytoremediation of low-level heavy metals by native macrophytes in a vanadium mining area, China. Environ. Sci. Pollut. Res. 2018, 25, 31272–31282. [Google Scholar] [CrossRef]
  70. Klink, A.A. Comparison of tracemetal bioaccumulation and distribution in Typha latifolia and Phragmites australis: Implication for phytoremediation. Environ. Sci. Pollut. Res. 2017, 24, 3843–3852. [Google Scholar] [CrossRef]
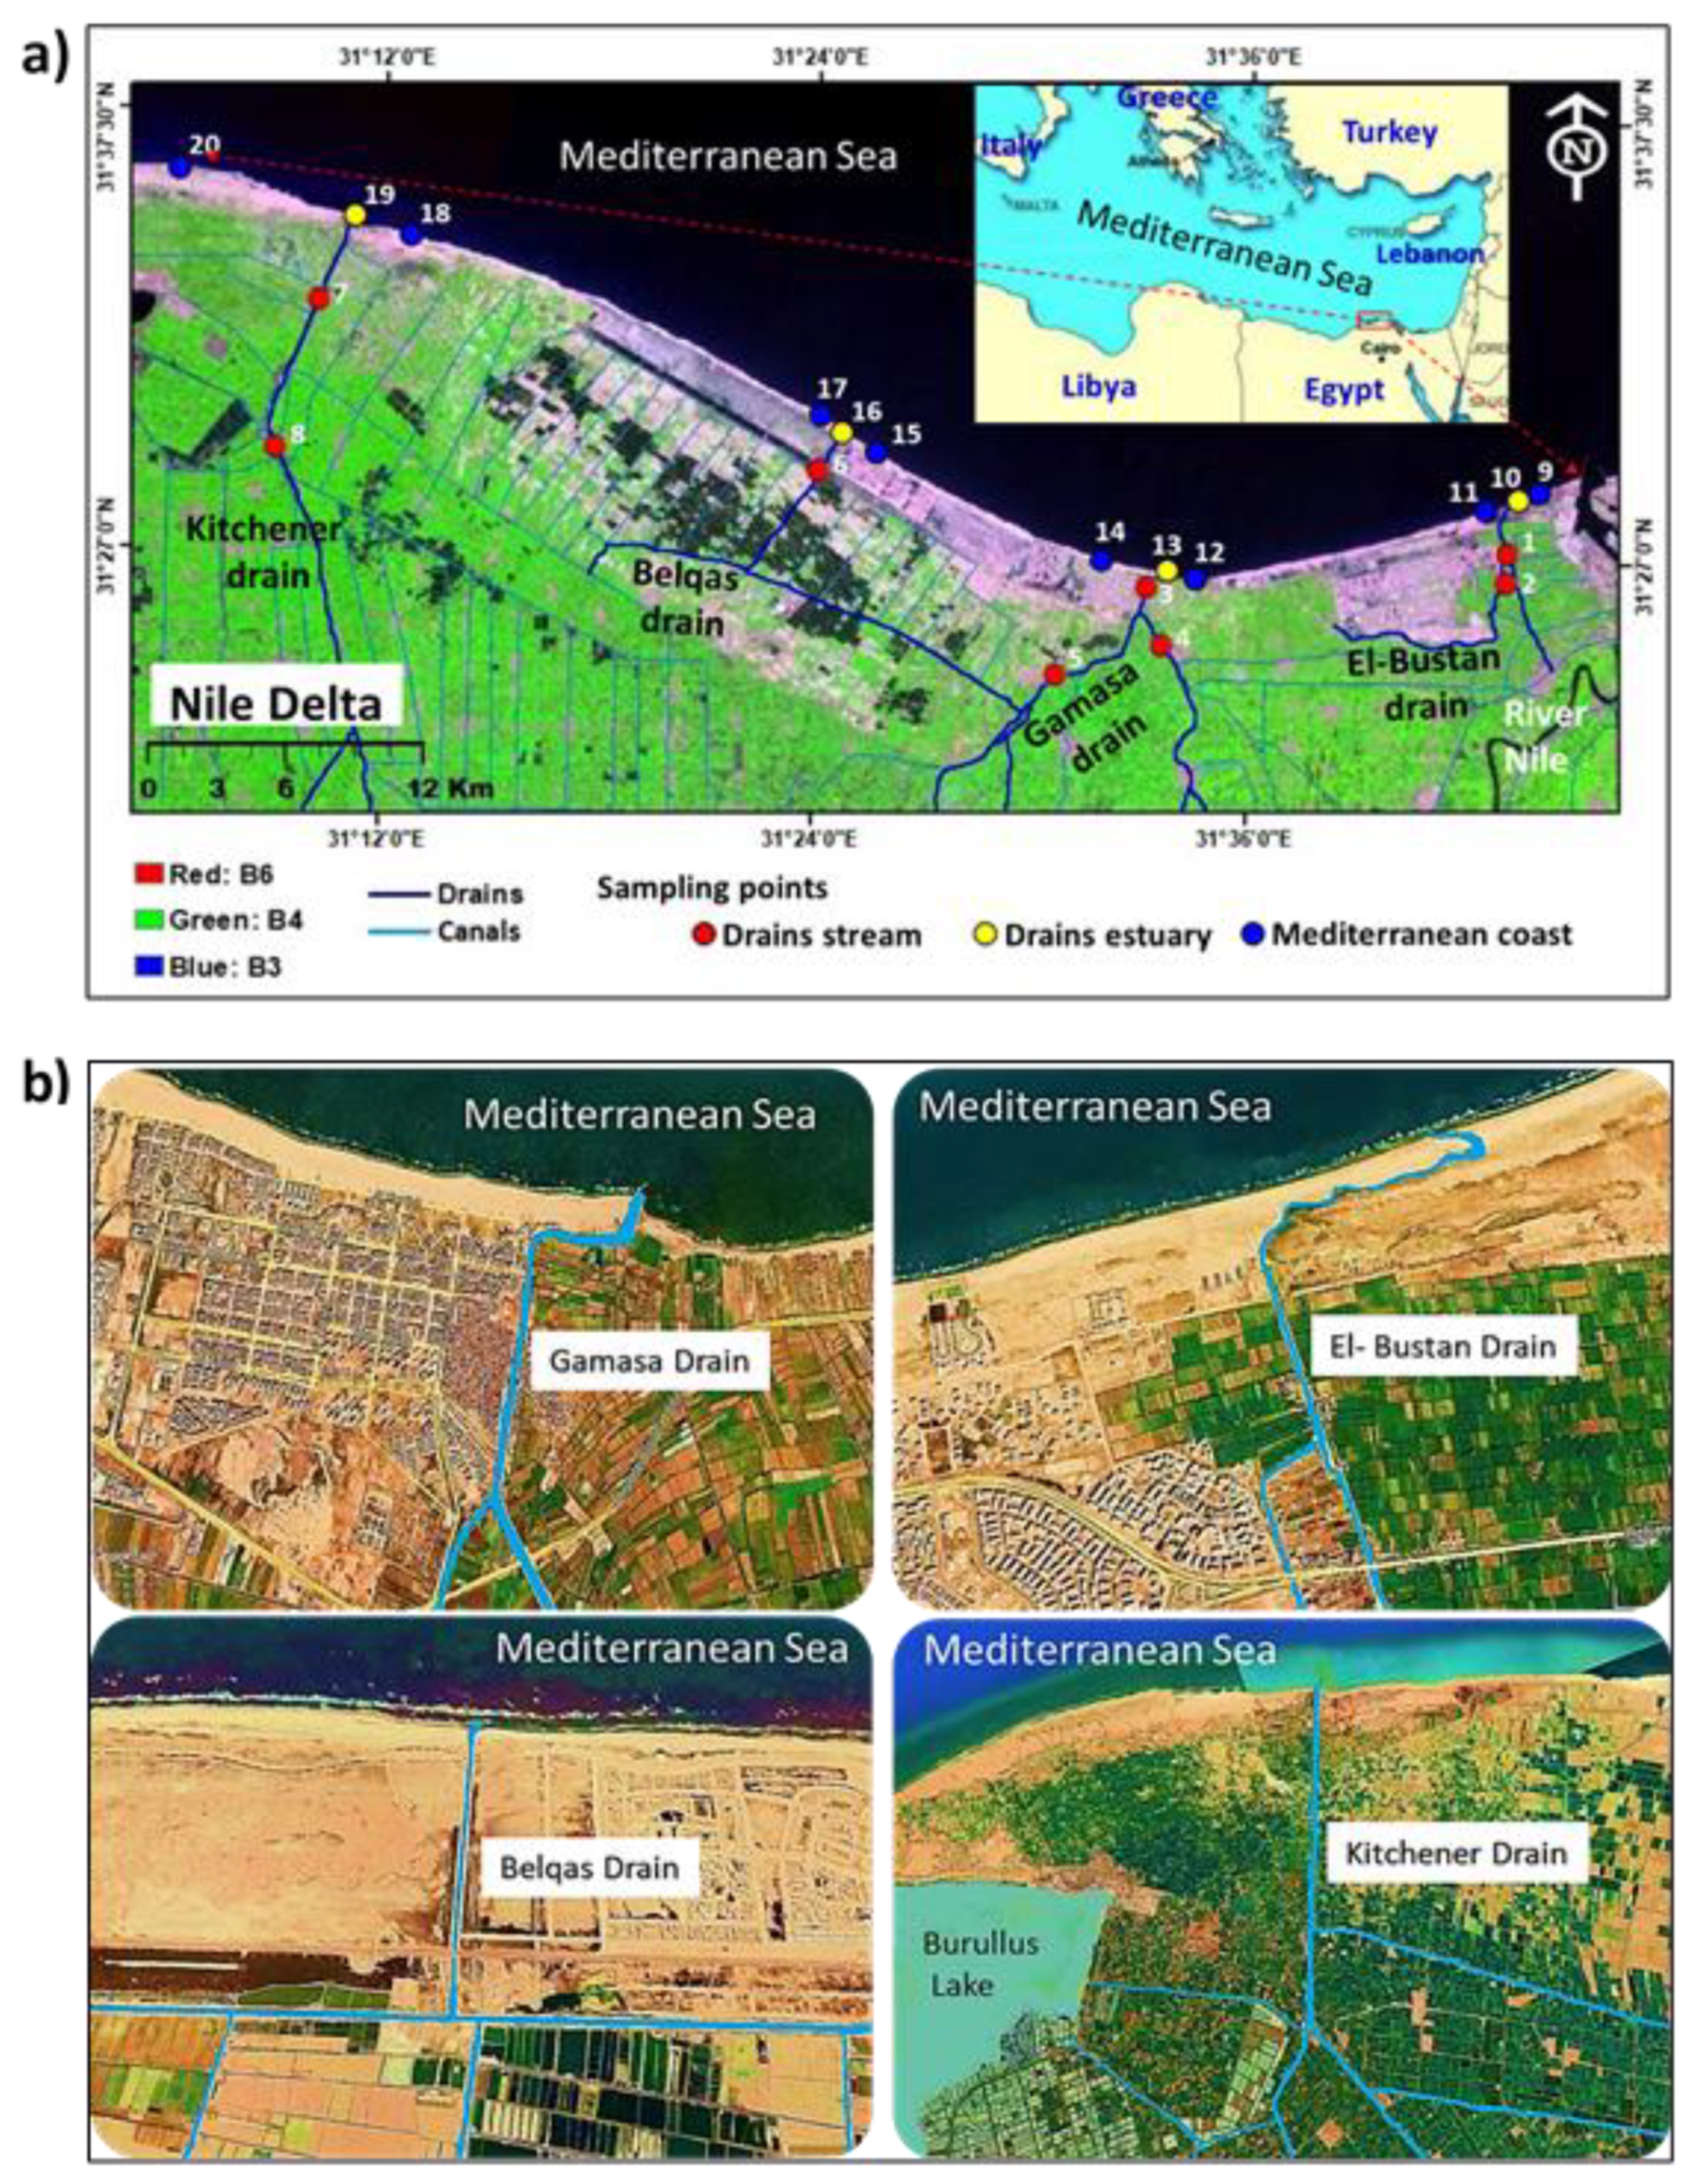
Figure 1. (a) Geographic location map of north coast of middle Nile Delta showing four drains and (b) sectors for the different activities near the four drain estuaries and sampling sites (S1–S17) using Google Earthpro.
Sustainability 13 12244 g001
Figure 2. Box-whisker plots of heavy metal concentrations in different locations.
Sustainability 13 12244 g002
Figure 3. Concentration of heavy metals at the sediments of four drains stream, drains estuary, and Mediterranean coast.
Sustainability 13 12244 g003
Figure 4. PCA of the nine heavy metals from sampling sites in the study area.
Sustainability 13 12244 g004
Figure 5. The heavy metals enrichment factor in the sediment samples from different sites.
Sustainability 13 12244 g005
Figure 6. The contamination factors and degree of contamination of heavy metals in the sediment samples from different sites.
Sustainability 13 12244 g006
Figure 7. The geo-accumulation index of the heavy metals in the sediment samples from different sites.
Sustainability 13 12244 g007
Figure 8. The Ecological risk factor and potential ecological risk index of heavy metals in the sediment samples from different sites.
Sustainability 13 12244 g008
Figure 9. BAF of the root (a), EF of the shoot (b), and TF (c) of heavy metals in the two studied emergent hydrophytes.
Sustainability 13 12244 g009
Table 1. Descriptive data of heavy metal in sediments of four drains stream (n = 8), drains estuary (n = 4), and Mediterranean coast (n = 8) in Nile Delta of Egypt.
Statistics DataFeMnZnCdCoCrCuNiPb
Drains stream
N888888888
Min.4629.2356.0618.256.7322.4116.8217.3119.7913.56
Max.18,179.17331.4683.2022.1676.4344.4473.2159.4424.19
Mean11,095.61183.8742.5415.4147.0329.9740.8634.6818.51
Median4435.2587.5722.644.6320.219.9620.0514.533.43
±SD11,316.37174.0036.7815.2947.4928.7840.0929.6517.97
Skewness0.090.300.80−0.590.170.190.420.730.39
Kurtosis−0.67−0.21−0.221.09−1.56−1.36−0.95−0.89−0.32
CV%39.9747.6353.2130.0442.9833.2349.0741.8918.54
Drains estuary
N444444444
Min.4688.3338.857.342.2741.307.5324.4821.569.57
Max.29,432.92253.1356.219.3372.0339.4431.1957.6217.28
Mean15,597.30151.8533.045.5858.7019.5028.0736.5612.43
Median12,512.5099.7021.812.9114.6114.583.1016.303.40
±SD14,133.97157.7134.315.3760.7315.5128.3133.5311.44
Skewness0.23−0.19−0.240.43−0.421.14−0.260.751.45
Kurtosis−4.69−3.64−2.421.25−3.370.34−3.34−1.242.18
CV%80.2265.6666.0152.1524.9074.7811.0444.5927.35
Mediterranean coast
N888888888
Min.2258.5342.6319.450.7827.557.6521.7315.547.82
Max.28,513.38292.6954.837.4644.3235.0038.8443.8221.01
Mean10,380.92138.7736.273.2533.9619.2130.8124.2314.94
Median8749.6799.4311.602.635.5611.496.769.045.08
±SD7046.06105.9235.401.8133.6515.8233.1221.3916.23
Skewness1.560.540.111.120.760.36−0.401.65−0.29
Kurtosis2.03−1.62−0.50−0.530.32−2.04−1.883.16−1.86
CV%84.2971.6531.9880.8116.3759.7921.9537.3034.03
p-value0.93 ns0.28 ns0.42 ns0.002 **0.16 ns0.019 *0.14 ns0.024 *0.04 *
References
Geochemical background47,200850950.301990456820
Guidelines US-EPA [46]-550600.01–419.154251919
CSQGD [47]---1.44064-5070
Toxic response factor-113052555
N, number of samples; SD, standard deviation; CV, coefficient of variation; US-EPA [46]. **: significant at p ≤ 0.01; *: significant at p ≤ 0.05; ns, non-significance.
Table 2. The Pearson correlation between the concentrations of heavy metals.
MetalsFeMnZnCdCoCrCuNiPb
Fe1
Mn0.615 **1
Zn−0.02−0.0571
Cd0.0930.2490.0561
Co0.2020.437 *−0.2240.2511
Cr0.3800.458 *−0.0560.784 **0.1811
Cu−0.114−0.1220.595 **0.222−0.428 *0.1001
Ni0.0570.074−0.436 *0.447 *0.520 *0.297−0.479 *1
Pb0.2280.4000.1730.3090.1200.1220.439 *−0.0991
* p < 0.05, ** p < 0.01; significant correlations (two-tailed).
Table 3. Total variance explained and component matrices for the heavy metals in surface sediments from different locations (drains stream, estuaries, and Mediterranean coast) of the Nile Delta shoreline.
ComponentRotation Sums of Squared Loadings
EigenvalueVariance (%)Cumulative (%)
12.8131.2331.23
22.1423.8255.05
31.3615.1070.15
ElementRotated component matrix
PC1PC2PC3
Fe0.3510.096−0.518
Mn0.4490.134−0.419
Zn−0.1430.5040.072
Cd0.3890.1750.508
Co0.366−0.2250.078
Cr0.4450.1410.081
Cu−0.0880.5790.271
Ni0.346−0.3150.450
Pb0.2100.427−0.067
Publisher’s Note: MDPI stays neutral with regard to jurisdictional claims in published maps and institutional affiliations.