Abstract
This paper presents the integration of mixed-integer nonlinear program (MINLP) and project management tool (PMT) to support sustainable cost-optimal construction scheduling. An integrated structure of a high-level system for exact optimization and PMT was created. To ensure data compatibility between the optimization system and PMT and to automate the process of obtaining a cost-optimal schedule, a data transformation tool (DTT) was developed within a spreadsheet application. The suggested system can determine: (i) an optimal project schedule with associated network diagram and Gantt chart in continuous or discrete time units; (ii) optimal critical and non-critical activities, including their early start, late start, early finish, late finish along with total and free slack times; and (iii) minimum total project cost along with the allocation of direct and indirect costs. The system provides functionalities such as: (i) MINLP can be updated, and schedules can be re-optimized; (ii) the optimal schedule can be saved as a baseline to track changes; (iii) different optimization algorithms can be engaged whereby switching between them does not require model changes; (iv) PMT can be used to track task completion in the optimized schedule; (v) calendar settings can be changed; and (vi) visual reports can be generated to support efficient project management. Results of cost-optimal project scheduling are given in a conventional PMT environment, which raises the possibility that the proposed system will be more widely used in practice. Integration of MINLP and PMT allows each software to be used for what it was initially designed. Their combination leads to additional information and features of optimized construction schedules that would be significantly more difficult to achieve if used separately. Application examples are given in the paper to show the advantages of the proposed approach.
1. Introduction
In a dynamic environment such as the construction industry, the success of a project is highly dependent on a project manager’s ability to create an optimal schedule for construction activities. Construction projects commonly require various participants for contracted works and are affected by site specifics as well as weather conditions. Changes in project duration frequently demand interrupting the work continuity of construction crews and/or utilizing overtime hours [1]. Constantly changing site conditions require different procedures and designs that take into account these changing conditions, whether it is a design solution, a change in environmental conditions, or just sustainability factors [2]. Nonetheless, a contractor’s ability to prepare a competitive bid for a construction tender still remains crucial for its survival on the market [3]. These particularities, together with the fact that wrong decisions on high-value construction projects can seriously jeopardize a contractor’s business success or even existence in the market, enhancing the need for optimization-supported construction scheduling.
Resilient scheduling can be taken as a response to uncertainty in construction projects [4]. In conventional construction practice, commercial project management tools (PMT) can provide in that context a single or even a set of feasible solutions for scheduling construction work. To ensure the optimality of the construction schedule, project managers most often develop separate optimization models. While the individual optimization model may serve its purpose, data incompatibility between PMT and special optimization systems frequently becomes a barrier to broader construction practice implementation. Since project changes are not uncommon in the construction industry, especially during the construction phase when the number of design changes increases, the updating process can become time-consuming and lead to deficient construction schedules. Human errors of manual data entry can result in inadequate or even insufficient realization of main project objectives.
A sustainable project schedule is necessary to assure efficient construction management. Such a schedule must continue to meet all target dates, even when parameters alternate during the task’s implementation period. Thusly, sustainable scheduling is not just about providing a result in line with expectations, within the feasible budget and in a timely manner, but also about assuring that managerial decisions are long-term sustainable. As sustainability in real-life situations is often connected with costs, sustainable scheduling, with regard to continuous cost-optimal time and resource assignment over the project’s life cycle, is widely acknowledged as a relevant subject of construction management. Consequently, the idea of integrating an optimization system into commercial PMT and ensuring an automated flow of data was met with great interest by researchers.
A wide range of powerful optimization algorithms is available to project managers to solve construction optimization problems—optimizing schedules, resources, layouts, routes, etc. Optimization problems can be modeled in algebraic modeling languages, spreadsheets, specialized stand-alone software, programing languages, or even internet-based optimization servers and solved using exact, heuristic, meta-heuristic, or hyper-heuristic algorithms. A comprehensive review that explicitly addresses sustainable scheduling in construction by integrating optimization modeling tools and PMT to ensure continuous optimal time and resource allocation throughout the project life cycle is given in reference [5]. The study shows achievements in integrating heuristic methods, mathematical programing, and special solving methods with conventional PMT and optimization-based building information modeling (BIM) tools. Emphasis was placed on the integration level of different information systems with optimization. The level of integration can be recognized as a primary indicator of the practical usability of an optimization-based scheduling system.
Literature reviews revealed that the integration of heuristic methods and PMT had been addressed in previous studies. Some studies have reached a high level of automation in integrating heuristic methods and commercial PMT. Most frequently used were genetic algorithms [6,7,8,9], ant colony system [10], tabu search [11], particle swarm optimization [12], simulated annealing [13], and harmony search [14]. Heuristic methods have been applied to the majority of common project scheduling problems, from time-cost trade-off problems (TCTP), resource leveling problems (RLP), and resource allocation problems (RAP) to resource-constrained project scheduling problems (RCPSP) and multi-objective analysis. Although heuristic methods may often ensure only that the achieved solution is near-optimal, they can solve a large share of scheduling problems in a time-efficient manner.
On the other hand, somewhat less attention has been paid to integrating mathematical programing methods and PMT. Mathematical methods are stricter about what they can represent than other techniques but can provide an exact optimal solution to a modeled problem. Mathematical programing often requires knowledge of algebraic modeling languages, so the biggest challenge is integrating such a system into the PMT. Some of the studies investigated the optimization of project schedules based on spreadsheets [15,16], but this approach has some limitations. Optimization models within spreadsheets are less transparent than models developed in algebraic modeling languages. Spreadsheet models also have a limit in the number of variables and constraints. Moreover, spreadsheet models often cause issues in scaling the optimization problem size and are limited in the number of solvers available. Although the tabular entry of input parameters and model formulas can be time-consuming, they can still be suitable for small- and medium-sized construction projects with a reasonable number of parameters.
Rare studies that have explored the possibility of mathematical programing methods and their linkage with PMT are exposed here. For example, Hebert and Deckro [17] developed a linear programing (LP) model to solve TCTP. The model was developed in MS Excel, and TCTP was solved by Excel Solver add-in. The objective was to reduce the duration of a project by a certain number of days by compressing only those activities requiring a minimal additional cost. The functionalities of the proposed approach were demonstrated on a small-scale construction project. The results are then manually entered into MS Project to present an optimal construction schedule.
In their research, Tereso et al. [18] developed an MS Project add-in function using C# programing language to implement heuristic and exact mathematical programming algorithms. The gained solutions for RCPSPs dealt with in their study showed no significant differences between heuristic and mathematical programing methods. One possible explanation was that the project network used as an example was not complex enough to see a discrepancy. Still, it was mentioned that the exact mathematical programing technique, i.e., branch-and-bound algorithm, produced exact optimal solution within a single run. At the same time, the heuristics were prone to parameter sensitivity.
Tiwari and Johari [16] developed a mixed-integer linear programing (MILP) model that solves TCTP with constrained resources. The proposed two-stage model first solves the TCTP by using Excel Solver add-in without considering resource constraints. Then, MS Project is used to explore possible solutions that achieve project deadline with available resources. However, the data transfer between the software has not been automated, questioning practicality for construction projects in terms of project updates.
The study by Valenko and Klanšek [15] proposed a spreadsheet-based LP model to solve TCTP. Input data on project activities were entered into MS Excel, optimized using Excel Solver add-in to minimize overall project costs, and then exported to MS Project. A higher level of integration between optimization and PMT was achieved using the Visual Basic for Applications (VBA) programing language. This feature reduced the time required to develop a cost-optimal construction schedule and reduced the possibility of human error in manual data entry.
Siganporia [19] developed an optimization model in General Algebraic Modeling System (GAMS) [20] for production planning in biopharmaceutical facilities in a doctoral thesis. The input parameters for the presented optimization model were recorded in MS Excel. The bidirectional link between the GAMS model and MS Excel was established using the GDXXRW utility. In this way, GAMS can read data from MS Excel, return optimization results to MS Excel, and present an optimal production plan. The results were not presented in PMT but in MS Excel, which holds some capabilities for visualizing, planning, and tracking the project. Although the author noted that integrating MS Excel and GAMS resulted in a complex editing process, some possible solutions were offered to increase scalability and ease of use.
Wang et al. [21] proposed integrating BIM and adopting its data for multi-mode RCPSP for construction scheduling. 4D-BIM software developed in their study can import and export various file formats in their mathematical model. The software can detect BIM elements and automatically generate project activities that are included in a scheduling problem. The constraint programing model designed in IBM ILOG CPLEX Optimization Studio generates an optimal construction schedule. The schedule can be presented in MS Project or even used for 4D visualization of the construction process.
The conducted literature review has shown that the general applicability of integrations between mathematical optimization and PMT is a current research challenge, especially from the viewpoint of data conformity between different types of software. The undisputed capability of integrated optimization models to ensure optimized schedules and sustainable scheduling processes throughout the life cycle of construction projects incites intensive research on their further development. Exact optimization models found in the literature were mainly based on LP and MILP, while the solving methods employed consisted of simplex, branch-and-bound (BB), and branch-and-cut (BC) algorithms. Attempts to integrate PMT with a mixed-integer nonlinear program (MINLP) capable of solving the nonlinear discrete project scheduling problem to exact optimality were not discovered.
This study fills a knowledge gap on MINLP combined with PMT to support sustainable cost-optimal construction scheduling. The major challenges here are to integrate two different software, i.e., PMT and MINLP, and overcome data incompatibility. Moreover, the created MINLP should generally be applicable to scheduling problems of various sizes, and the changes should be adopted without excessive manual programing. The approach proposed in this paper extends the one previously presented by Klanšek [22] to automatize data flow between MINLP and PMT. An export utility is introduced to store results in a database as an added value to the existing model. A data transformation tool (DTT) was developed to display results in PMT automatically.
The proposed optimization system can determine simultaneously, and in mutual consistency: (i) an optimal project schedule with associated network diagram and Gantt chart in either continuous or discrete-time units; (ii) optimal critical and non-critical activities, including their early start, late start, early finish, late finish along with total and free slacks; and (iii) minimum total project cost together with allocation of direct and indirect costs. In addition, it contains features such as: (i) MINLP can be updated and schedules can be re-optimized; (ii) optimal schedule can be saved as a baseline to track changes; (iii) different optimization algorithms can be engaged whereby switching between them requires no model changes; (iv) PMT can be used to track task completion in optimized schedule; (v) calendar settings can be changed; and (vi) visual reports can be generated to support efficient project management, e.g., total costs in the form of histogram and S-curve. To the best of our knowledge, such a system has not been developed before, so this work makes an original contribution in the field of upgrading conventional PMT with the exact MINLP optimization capabilities.
The remainder of this paper is divided into the following sections: Section 2 introduces the methodology for cost-optimal construction scheduling by integrating MINLP and PMT; Section 3 presents a case of methodology implementation by GAMS, MS Excel, and MS Project; Section 4 shows the advantages of the proposed approach through application examples; Section 5 discusses the results and findings; Section 6 gives the conclusions and recommendations for further research.
2. Methodology
This section presents a methodology devoted to reaching integration between MINLP and PMT. To achieve the objectives of this study, a three-part system is proposed here. The system consists of the MINLP developed using a modeling tool for mathematical programing, DTT, and PMT. The suggested methodology is represented in Figure 1. The developed MINLP is used to provide a construction schedule that generates the minimum total project cost, and the goal is to present results automatically in PMT. We propose DTT as an intermediate step between the MINLP and PMT in a spreadsheet to overcome the data inconsistency problem.
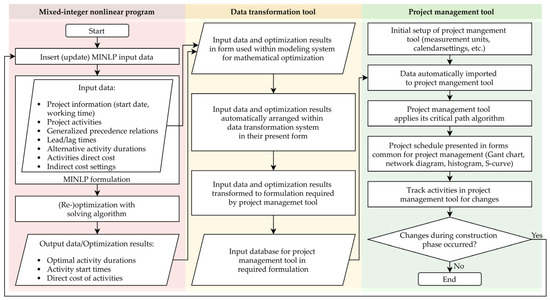
Figure 1.
Methodology for integration of MINLP and PMT.
First, a general-purpose MINLP for cost-optimal project scheduling is to be developed within mathematical programing software. The optimization system should provide MINLP formulation and input data independence in a manner universally applicable to any size project scheduling problem. Therefore, the input parameters can be changed or updated, but the MINLP formulation remains the same and can be reused at any point of project execution. The input parameters, which include details about the construction project (e.g., project start date, deadline, working time, indirect costs, etc.) and its activities (e.g., activity ID, different execution modes with associated costs and durations, precedence relationships, lag/lead times, etc.) can be stored in a database connected to optimization software or manually entered into the MINLP. Mathematical programing software applies a selected solver based on the input parameters to gain a cost-optimal construction schedule. Most well-known specialized optimization software subsequently produces reports on optimization results and provides an option to export results to a database file.
Thus, the results containing information on start times, durations, and costs of each activity can be viewed within the optimization software but must be further processed and edited to obtain forms and formats expected in project management. The raw data can be used at this point and manually entered in PMT, but the process would be tedious and error-prone. The goal should be to automate the process of entering and displaying results in PMT. This way, the results can be evaluated and adapted on construction sites much faster and without errors of manual data manipulation. In addition, optimization software for mathematical programing usually works with numerical values. Therefore, optimization results are stored in a database in numerical format. Commercial PMTs are strict about formatting project input parameters and cannot handle numeric values for most of the required data, apart from activity duration and cost. In literature, this is referred to as a data incompliance issue [23]. To express the results in the form expected by PMT, a DTT is introduced.
The task of DTT is to store numerical formulation of optimization results and to prepare input data for PMT. This tool can be developed within a programing language only for this purpose or within a spreadsheet. In the suggested system, the major information imported into PMT should be: (i) project data, e.g., project start date and project working time; (ii) activity data, e.g., IDs, start times, durations, direct costs; (iii) network data, e.g., generalized precedence relationships between activities with corresponding lag/lead times; and (iv) support data, e.g., details of indirect project costs in the form of support-type activity. The main challenge for DTT is the conversion of numerical data to represent activity start dates and overall precedence relationships.
After the data are suitably formatted for PMT, they can successfully be imported into PMT. Before the data are brought into PMT, initial project settings should be set. Setup includes selecting preferred project views, date formats, measurement units for duration and cost, and calendar settings that should be harmonized with MINLP. Most known PMTs are based on the critical path (CP) algorithm. PMT automatically applies its algorithm to sort activities and display the results in the desired form (e.g., Gantt chart, network diagram, etc.) when importing the data. All activities are presented in PMT with start dates, durations, costs, and precedence relations between activities. As PMT applies its CP algorithm, the activities that are on a critical path can be denoted. Furthermore, most PMT can provide various valuable visual reports, and additional information originated from optimization results but not directly calculated by the MINLP, which can represent the project better and more efficiently support its management. Additionally, such an integrated system allows the MINLP to contain only essential entities needed to be processed by an optimization algorithm, which significantly contributes to its solvability and improves its capacity to cope with large-scale nonlinear discrete optimization tasks of project scheduling.
The data flow in the proposed approach is automated to the extent that it does not require any human assistance once the system is set up. That way, the proposed method can be reused at any point of project implementation. The obtained schedule can be adopted and used on the construction site to track the completion of the tasks. For instance, if changes arise during the project execution, the suggested system can be updated, and schedules can be re-optimized based on new circumstances. Re-optimization will ensure that minimal additional expenses occur. This cyclic design ensures that the project is cost-optimal at each stage of construction. The procedure can be repeated an unlimited number of times until the project is completed or there are no project activities to be optimized. All the previously described processes are done automatically, and the initial schedule is updated and presented in PMT.
3. A Case of Methodology Implementation
A generally applicable MINLP designed to optimally solve nonlinear discrete TCTP was proposed in a study by Klanšek and Pšunder [24]. The MINLP was developed in a high-level modeling system for mathematical programing and optimization, i.e., GAMS. The presented MINLP was used to solve various TCTP, but the results were manually edited for the graphical representation. The said MINLP was rich in data that can be used by PMT, e.g., MS Project, to represent an optimal construction schedule. It contained activity IDs, precedence relations, and lag/lead times. Activity start times, durations, and direct costs were obtained from optimization results. Indirect costs, including initial project costs, daily project costs, and penalty costs or award bonuses depending on project duration, were also calculated. Since GAMS provides a collection of tools for data exchange between it and other data sources, such as MS Excel, the original MINLP has been extended to export necessary data to a database that can be edited and viewed in MS Project. The data was exported by GAMS Data eXchange (GDX) tool, called GDXXRW. The GDXXRW is a utility that allows reading and writing data to MS Excel spreadsheets. After the optimization process is complete, GAMS stores selected data sets in a GDX facility file that exports and arranges the same data in MS Excel spreadsheet.
The lines of code used to export project data to MS Excel can be seen in Listing 1. First, to unload and store the data into GDX file format, the command execute_unload was used. With this command, it was specified which parameters and variables should be exported to the database. The exported data sets are: activity start times (s.L), activity durations (d.L), activity direct costs (c.L), total indirect costs (LoE.L), project start time (SP.L), overall project duration (DP.L), along with predecessor/successor matrix for Finish-to-Start (zeroFS), Start-to-Start (zeroSS), Finish-to-Finish (zeroFF), Start-to-Finish (zeroSF), and matrix for lag/lead time (zeroL).

Listing 1.
GDXXRW utility used to export project data to MS Excel.
Listing 1.
GDXXRW utility used to export project data to MS Excel.
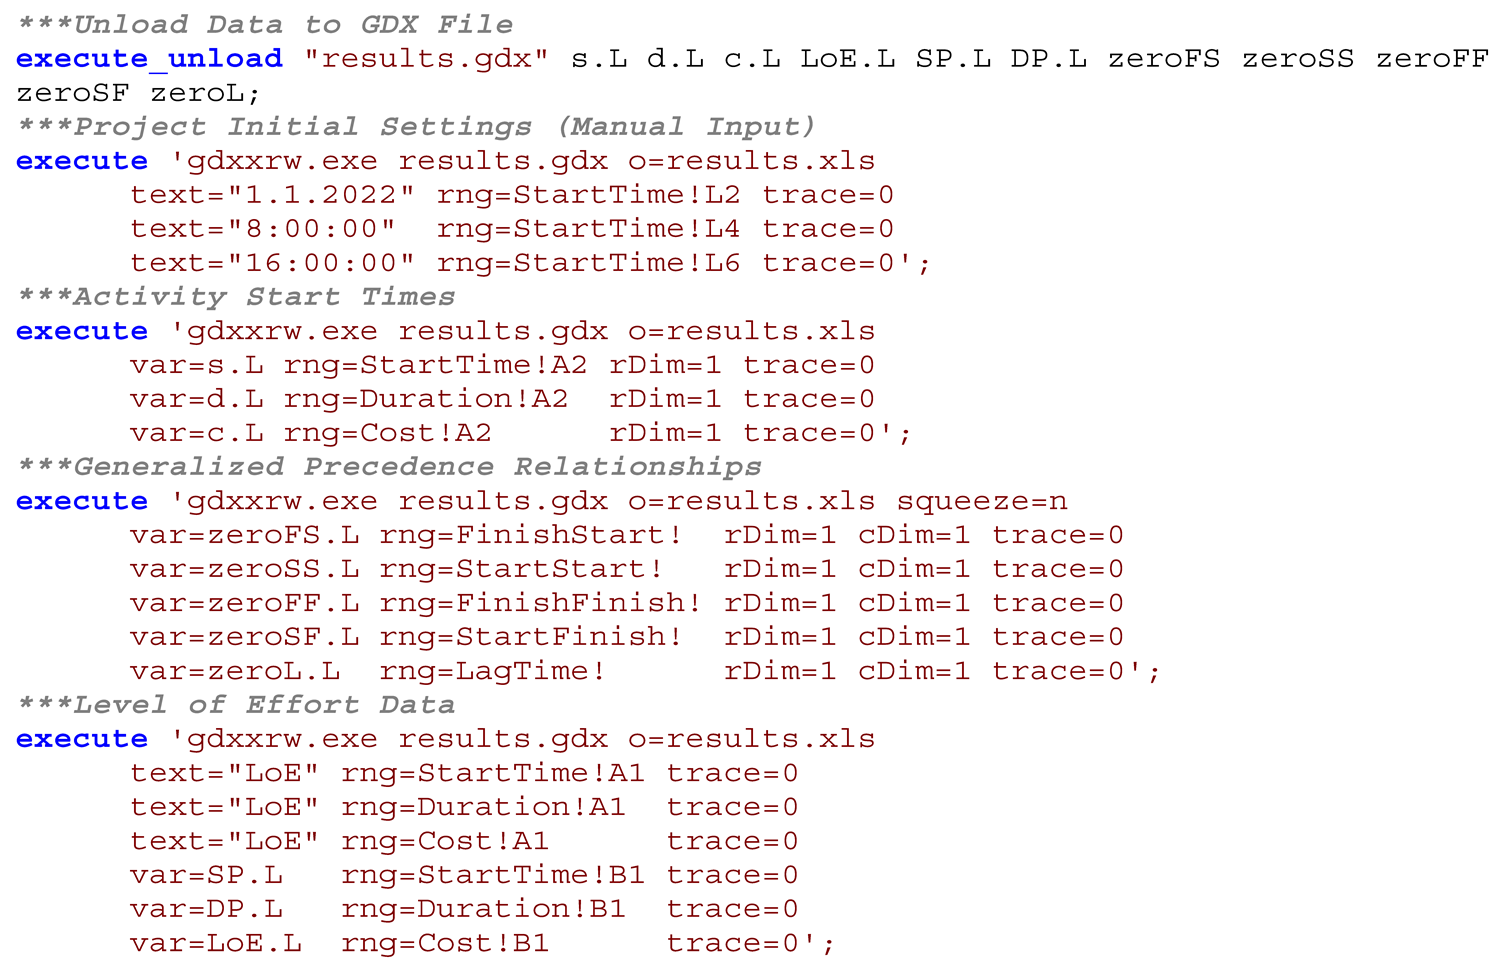 |
The command execute was used to arrange the abovementioned data sets. There is an optional line for manual input of initial project settings, such as project start date, start time, and end time of work shift. These settings can also be edited and changed in MS Project later on. After that, a set of activity start times, durations, and direct costs were placed on a separate worksheet in cell A2. The precedence relations in the MINLP are defined with i × j (i—number of preceding activities, j—number of succeeding activities) precedence matrix of binary input parameters, i.e., 1 if a given precedence relation exists, and 0 if it does not. The matrices for respective relationship types were arranged to separate MS Excel worksheets. The matrix of lag/lead times was also saved to a different sheet. Additionally, the data on indirect costs were exported to represent new support-type activity called Level of Effort (LoE) in a row before the rest of the project activities.
An example of GAMS output data arranged and sorted within MS Excel can be seen in Table 1 and Table 3 presented later in Section 4.2 and Section 4.3. The data regarding activity durations and costs can be used as input for MS Project in their current state. Still, the data on project start times and precedence relations need further transformation to meet PMT requirements. For this purpose, a unique MS Excel spreadsheet was created as DTT. The DTT was developed to store exported data from the MINLP solution and transform them into an appropriate formulation that can be used as input for MS Project.
The activity start times were changed to dates by adding an initial numerical value to the project start date determined in execute section. For example, the calculated start time of activity “8” in Table 1 was 15. Hence, the number 15 was subtracted by one and added to the project start date “1 January 2022” to result in “15 January 2022”. Suppose the resulting start time was calculated as a non-integer value, such as activity “2” in Table 3. In that case, a record is created with the exact time when the specified activity begins during the working day. For instance, activity “2” has obtained a value of 2.83 after the optimization process, so number two defines that the task starts on “2 January 2022”. The remainder of 0.83 describes that the activity begins at “14:38:24” that day if initial project settings are as in Listing 1.
The predecessor/successor recordings for MS Project should be in form [Preceding/succeeding activity ID] [Relationship type (FS/SS/FF/SF)] ± [Lag/lead time], e.g., “19FS+4”. It should be noted that there is a difference in terms “Activity name” and “Activity ID”. The “Activity name” is the index value used by optimization software, and “Activity ID” is the number of rows in which the activity is placed in MS Project. Since the activity Level of Effort was placed before all the other activities, the Activity ID would be Activity name increased by one. Because of the MINLP specifics, it was more convenient to create a recordings list for activity successors. While the common practice in MS Project is to determine predecessors for individual activity, it is possible to enter successors as an input parameter automatically transformed to a list of predecessors.
The example of exported general precedence matrix for Finish-to-Start relationship is presented in Figure 3 later in Section 4.2. From the said matrix, it can be noted that activity “1” is followed by activities “2”, “3”, and “6”. To create recordings that are appropriate for MS Project, the exact copy of this sheet was created. On this sheet, the parameter 0/1 from the original sheet was used as a trigger to make a recording for the Finish-to-Start relationship with the succeeding activity number shifted by one. In addition, the lag/lead time, if it exists, was added to recording from a separate sheet with exported parameters. In the same way, the recordings for all the other relationship types were created. For example, the resulting matrix for the Finish-to-Start relationship can be seen in Figure 2. Afterwards, all recordings were collected for each activity in one cell with the MS Excel function TEXTJOIN. The resulting recordings for each task can be viewed in Table 2 and Table 4 presented later in Section 4.2 and Section 4.3.
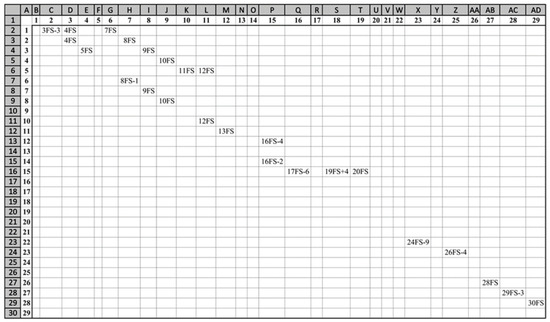
Figure 2.
Dependency matrix for Finish-to-Start (FS) relationship in form required by MS Project.
Now that the data transformation process is done, input parameters are gathered on a separate worksheet. Table 2 and Table 4 provide an overview of input data for the MS Project. At this point, there are multiple possibilities for importing data. When creating a new project in MS Project, there is an option to import an Excel workbook. The Import wizard automatically maps imported data to appropriate fields in MS Project and then allows verification or editing of the results. This approach can also be automated by creating a macro using the VBA programing language. The macro written in VBA could automatically generate an output file to display optimization results. For our study, a new project was created in which the transformed data would be imported. The important thing was setting the calendar of a project to a seven-day workweek since the MINLP works only with workdays. The calendar and the working time options can be changed once the data are imported. To get better automation in obtaining cost-optimal project schedules, the input data from MS Excel were copied to MS Project with a dynamic link. This way, whenever the MINLP optimization is launched, data are exported and transformed in MS Excel. Every time the MS Project file is opened, the project information can be updated by accessing the linked data from MS Excel.
4. Application Examples
4.1. General Data
The previously described system that integrates GAMS with MS Project to support MINLP-based cost-optimal scheduling was used here on a construction project example. All computer work was accomplished on a 64-bit operating system with a personal computer AMD Ryzen 7 2700 Eight-Core Processor at 3.2 GHz and 64 GB of RAM. As a mathematical programing environment, GAMS 35.1.0 was used. To present the benefits of the proposed approach, three examples were considered. In the first example, the proposed system was used to introduce a cost-optimal discrete solution for the project scheduling problem. Afterwards, the integer conditions for variables in the MINLP were relaxed so that the project scheduling solution could obtain continuous values. Finally, a real-life construction situation was simulated where unexpectedly, one of the activities is delayed, and forcibly its duration was prolonged to present the system’s ability to be updated and perform re-optimization of project schedule.
Application examples considered here are based on a 29-activity construction project that involves an expansion of an existing two-lane undivided highway into a four-lane divided highway with controlled traffic access. The project has initially been presented by Sakellaropoulos and Chassiakos [25]. The precedence relationships and lag/lead times between activities with direct cost-duration options were declared as input parameters for the MINLP as proposed by the authors. The indirect project cost is set to 150 currency units per day. As suggested by the authors, the target project duration is fixed at 80 days. If the project is completed before the target duration, a bonus of 100 units per day is given, but a penalty cost of 200 units per day is imposed if the target duration is exceeded. Input data for the project example dealt here can be found in the said reference [25].
The project scheduling tasks addressed in continuation of the paper were solved to optimality using the extended MINLP introduced by Klanšek and Pšunder [24]. The MINLP was selected as previous research demonstrated that it could effectively solve complex nonlinear discrete scheduling problems and provide exact optimal results in a reasonable time. However, past research was mainly focused on the MINLP formulation, but after the optimization, results had to be manually edited so that the project schedule could be graphically represented. In the present study, the goal was to automate that process.
4.2. MINLP Application
The first application example aims to use the proposed optimization system on project scheduling problems from literature and demonstrate its ability to obtain the exact cost-optimal discrete solution and refine the output data for visual presentation within MS Project. The MINLP presented in reference [24] was upgraded to export the results to a specially developed DTT spreadsheet. The objective of the MINLP optimization was to find the optimal discrete schedule for a construction project under the minimum total project cost, subject to generalized precedence relationship constraints, restrictions for overall project duration, and logical conditions on start times and durations of activities.
The MINLP optimization was carried out by a solver DICOPT [26]. The total problem-solving time required to obtain the optimal solution was less than a second. The optimal solution to the project scheduling problem was achieved at the minimum total project cost of 45,500 units and an optimal project duration of 75 days. The total project cost includes direct costs of activities and indirect costs, i.e., daily fixed expenses and bonus/penalty rate. The results obtained were identical to results from the original study by Sakellaropoulos and Chassiakos [25]. After the optimization was completed, the results were saved to GDX file format and exported to a specific position within a unique DTT Excel table. The raw exported and sorted data from the MINLP are presented in Table 1.
Table 1.
Results of MINLP application in numerical form sorted in spreadsheet table.
It can be noted that the table contains all the project activities along with their optimal start times, durations, and calculated direct costs. Additionally, indirect costs were included due to the LoE activity. The input parameters for activity successors were exported into individual sheets for each project relationship type and lag/lead time value. The example of the dependency matrix for the Finish-to-Start (FS) relationship exported from the MINLP can be seen in Figure 3. The matrix consists of preceding activities in rows and succeeding activities in columns. The value 0/1 defines the existence of succeeding activities for each task. For example, task “1” is followed by activities “2”, “3”, and “6”.
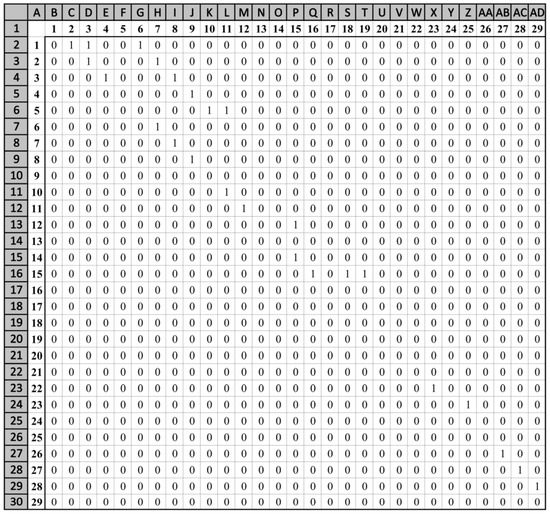
Figure 3.
Dependency matrix for Finish-to-Start (FS) relationship exported to MS Excel.
The data from the MINLP were automatically transformed into the form required by MS Project. The sorted and transformed data in MS Project form are shown in Table 2. The task names for activities are imported as activity indexes that were used in the MINLP. Since the MINLP provides integer values for the start times, each activity starts with the beginning of the workday. The task duration is also represented with an integer value. There are succeeding activities listed along with relationship type and lag/lead time for each activity. The costs are presented in currency units. The characteristics of support-type activity LoE were also included as the first project activity. The recordings for successors were obtained from dependency matrices and lag/lead time matrix exported from GAMS.
Table 2.
Transformed data from MINLP as input for MS Project.
The data in Table 2 can be considered as input data for MS Project. At this point, MS Project file was linked to the data within DTT table. The resulting Gantt chart in MS Project can be seen in Figure 4. The Project summary task shows that optimization of the example project schedule gained the minimum total project cost of 45,500 cost units and an optimal project duration of 75 days. The MS Project shows the generalized precedence relations between activities. As a result, a critical path can be identified for a cost-optimal project schedule. The optimal results can also be represented with an appropriate network diagram (Figure 5). The network diagram displays the workflow of project activities with additional information on activity early start, late start, early finish, late finish, as well as total and free floats. The MS Project can be used at this point for project management to track the execution of individual activities and even generate visual reports. An example of a visual project report is shown in Figure 6. The graph represents the minimum total costs in the form of a histogram and S-curve.
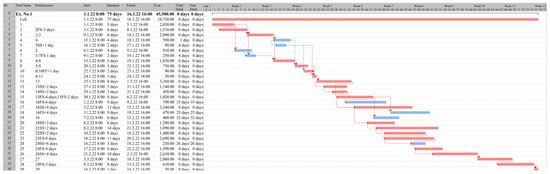
Figure 4.
Results of MINLP optimization in form of MS Project Gantt chart.
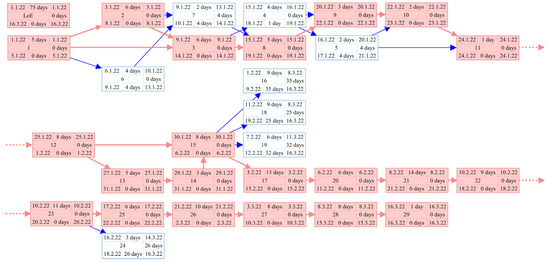
Figure 5.
Results of MINLP optimization in form of MS Project network diagram.
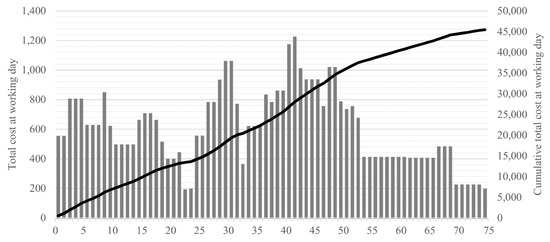
Figure 6.
Minimum total costs obtained by MINLP optimization shown as visual report of MS Project in form of histogram and S-curve.
4.3. Relaxed MINLP Application
In this example, the goal was to demonstrate the system’s capacity to optimize scheduling variables, e.g., activity start times, durations, costs, etc., in continuous values when necessary. As with the previous example, the results were automatically exported and transformed to present a cost-optimal schedule within MS Project. The convergence of the relaxed MINLP solution was again achieved in less than a second. As in the previous case, the output data were raw and unformatted. The data were automatically converted to a format suitable for MS Project. As the data within the DTT sheet changed, the MS Project updated the current construction schedule. As a result, the relaxed MINLP optimization achieved the project scheduling solution at the minimum total project cost of 45,498.75 units and the optimal project duration of 75 days. The raw and sorted data exported from the MINLP can be seen in Table 3.
Table 3.
Numerical results of relaxed MINLP optimization of project schedule sorted in spreadsheet form.
It can be noticed that some of the activities achieved different values for start times, durations, or costs compared to those in the previous example. The overall project duration stayed 75 days by relaxing the integer conditions but at a lower project cost. Table 4 shows that developed DTT can operate even with non-integer values. The continuous values can be used within MS Project. Non-integer values of start times during the transformation to start date gets additional information about the exact start time of activity during the workday. For example, activity “2” begins on 2 January at 14:38:24.
Table 4.
Transformed data from relaxed MINLP as input for MS Project.
Results of relaxed MINLP optimization in the form of the MS Project Gantt chart are shown in Figure 7. Just as in the previous example, MS Project can be used for further project management. It can be observed that the start dates have the exact time when the activity should begin. Additionally, in the project summary task, the project duration and overall project costs obtained through optimization can be seen. The chart contains generalized precedence relationships between the activities, separating critical activities from non-critical ones. Free and total slacks are calculated for each activity. As in the previous case, MS Project can track the completion of project tasks and intervene if the changes occur. As shown in Figure 8, the cost-optimal construction schedule can be represented in the form of network diagram with information on the exact date and hour for activities, early start, late start, early finish, and late finish. The said diagram also provides details on total and free slacks as non-integer values. Figure 9 presents the minimum total costs obtained by relaxed MINLP optimization shown as a visual report of MS Project in the form of histogram and S-curve.
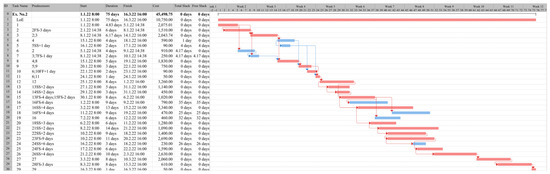
Figure 7.
Results of relaxed MINLP optimization in form of MS Project Gantt chart.
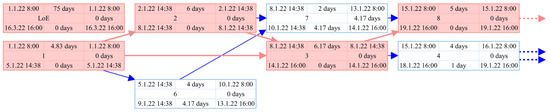
Figure 8.
Results of relaxed MINLP optimization in form of MS Project network diagram.
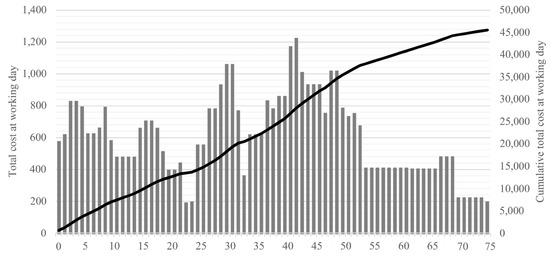
Figure 9.
Minimum total costs obtained by relaxed MINLP optimization shown as visual report of MS Project in form of histogram and S-curve.
4.4. Update of MINLP
This example is aimed to demonstrate the usability of the proposed system in a volatile construction environment. Since unexpected influential events during the project implementation are not that uncommon, the system may have to be updated during the construction period, and schedules should be re-optimized to minimize additional expenses. As a baseline for the initial construction schedule, we have chosen the solution from Section 4.2. For example, during the construction phase, it was found that activity “23” will start one day later than initially scheduled. Besides that, the task duration will be extended from 11 days to 14 days due to workforce shortage. Since activity “23” was on a critical path, the project duration would inevitably be prolonged. The changes to the initial settings were entered by fixing start times and durations for activity “23” and its predecessors. After the re-optimization, the resulting schedule was presented in MS Project, and the schedule changes can be seen in Figure 10.
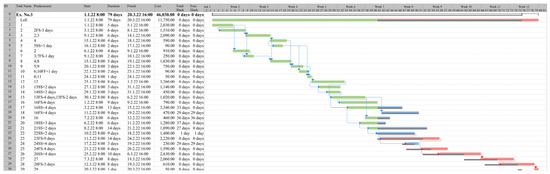
Figure 10.
Results of updating and re-optimization by MINLP in form of MS Project Gantt chart.
It can be noted that the observed activity should have started on 10 February 2022, but it was shifted to the day after. Additionally, the activity duration was prolonged from 11 to 14 days. With the green color are marked all the activities that are completed or partially completed on that date. Moreover, it can be found that after the project update, activity “22” is no longer critical because the moving of activity “23” resulted in one day of free float. There were no changes in durations of activities after activity “23”, so the overall project duration was extended by four days (one for the activity push and three because of extended activity duration). The MINLP optimization under revised input data attained the minimum total project cost of 46,030 units. Therefore, to break down additional expenses, the direct cost of activity 23 was reduced from 2690 to 2220 units. Still, the construction company lost four days’ worth of bonus and covered an additional four days of indirect daily costs. Therefore, the initial total cost was reduced by 470 units (lower direct cost) and then increased by 400 units (lower bonus) and 600 units (higher indirect cost). As a result, the total project cost was raised by 530 units.
5. Discussion
The following section brings to the fore the advantages and limitations of the suggested system. We have introduced a system that integrates MINLP with PMT to support sustainable cost-optimal construction scheduling. In the applicative part of this article, the presented system was put into operation by combining optimization functionalities of MINLP, expressed through state-of-the-art algorithms from GAMS, with MS Project features. As a result, the proposed system was shown useful for executing sustainable project scheduling within conventional PMT, however, strengthened by the exact MINLP optimization.
The fact that the proposed system works based on a deterministic estimation of time-cost data needs to be mentioned here. Namely, it is well-known that a precise deterministic assessment of said data can present a challenge in the construction business that requires considerable experience and should be addressed by skilled practitioners. Despite that, the deterministic approach is still broadly applied in the construction industry due to the recognized benefits of its outcomes. At this point, the deterministic optimization of construction schedules has proved a valuable source of data to make efficient decisions in project management.
Optimization problem complexity is also a topic that needs some attention. Construction scheduling tasks in practice may require solving the extensive MINLP, and global optimal solution in such cases can generally be hard to reach through all currently available methods. Though the field of MINLP is onerous and has not yet accomplished the level of maturity as linear (smooth) optimization, the exact high-quality solutions can still be anticipated from state-of-the-art search algorithms, even for large-scale construction scheduling tasks. Certainly, to hasten convergence of the optimal solution when employing the suggested system, it is desirable to run the optimization algorithm from a feasible initial point, as was shown in the previous section.
In the prior section, the dealt system’s functionalities were demonstrated as well and thus revealed its favorable characteristics. For instance, the MINLP ensures the exact optimal solution for project scheduling task. Moreover, the proposed system allows the usage of various algorithms that can optimally solve the scheduling problem, and they can be easily altered if needed. The system automatically stores input parameters and optimization results in a database file then transformed and automatically exported to the PMT. In other words, once the system is set, data flow from that point on is automatic and requires no human interaction. Once the cost-optimal construction schedule is exported to the PMT, the said software applies its CP algorithm. It provides the project representation in the form of a Gantt chart, network diagram, and visual reports (e.g., S-curve and histogram for minimum total cost). Therefore, each software is used for what it was initially intended for, while their integration leads to additional information and functionalities that would be significantly more difficult to achieve if used separately.
Since the CP algorithm is employed within the PMT, critical and non-critical activities can be identified for the optimal project schedule. This valuable information makes the MINLP more efficient. As the results of the previous section show, the proposed system can also provide information about the optimal total and free slacks, as well as the early start, late start, early finish, and late finish of activities. This allows practitioners to reschedule non-critical activities during construction without affecting the optimal overall project duration or minimum total cost. Because all this information is calculated in MS Project, the optimization algorithm is not burdened with additional calculations and therefore operates more efficiently. The MINLP includes no calendar information, such as weekends and holidays, but optimizes as if every day was a workday. That way, the schedule is imported into the PMT as each day is a working day. Afterwards, the end-user can insert their specific information about working days, shifts, and holidays. This would be a tedious and cumbersome task in developing MINLP, but in PMT, it is done in seconds. Overall, it is worth highlighting that the proposed system can manage both discrete and continuous time units by transforming the start times into the exact time and day when the activities should start. Therefore, the proposed approach can be used not only in conventional construction projects but also in the scheduling of production processes that require a higher level of accuracy.
Given the study design, it is inevitable that this approach requires at least basic programing skills to apply the suggested system in different software. Nevertheless, the given MINLP was created to be generally applicable and can be used to solve determined project scheduling optimization problems by updating the input parameters. The errors in this process can be avoided by adding detailed instructions in the comment section of the MINLP code. Another option is to insert all input parameters to spreadsheets from where the data would be loaded to the MINLP. One of the study limitations is the costly software licenses. However, the license price is insignificant compared to the potential savings of using such a system on high-value construction projects.
To conclude this discussion: the paper demonstrated by examples that the proposed optimization system can determine simultaneously and in mutual consistency: (i) an optimal project schedule with associated network diagram and Gantt chart in either continuous or discrete-time units; (ii) optimal critical and non-critical activities, including their early start, late start, early finish, late finish along with total and free slacks; and (iii) minimum total project cost together with allocation of direct and indirect costs. In addition, it contains features such as: (i) MINLP can be updated and schedules can be re-optimized; (ii) optimal schedule can be saved as a baseline to track changes; (iii) different optimization algorithms can be engaged whereby switching between them requires no model changes; (iv) PMT can be used to track task completion in optimized schedule; (v) calendar settings can be changed; and (vi) visual reports can be generated to support efficient project management, e.g., total costs in the form of histogram and S-curve.
6. Conclusions
This paper has demonstrated the integration of MINLP and PMT to support sustainable cost-optimal construction scheduling. The integrated structure of a high-level system for exact optimization and PMT was created. The proposed system generated the cost-optimal construction schedule within the environment of conventional PMT familiar to project managers. The implementation of the proposed approach was presented on scheduling examples using dynamic integration of GAMS and MS Project. The data incompliance was solved with an intermediate spreadsheet solution that transforms data from the optimization modeling environment to forms required by chosen PMT.
This study contributes to the area of sustainable construction scheduling by interconnecting MINLP and PMT as well as prevailing the data incompliance issue. We have obtained encouraging results demonstrating that the MINLP can provide the exact optimal solution for project scheduling tasks and present the results in a form suitable for project management in a reasonable time. The significance of the study lies in the ease of use. The suggested system is somewhat complex, but it requires from end-user only input parameters that can easily be entered. Once the MINLP optimization is launched, the rest of the system works straightforward. The designed DTT spreadsheet should be placed to the exact location as a model file and needs no further actions. The PMT, each time opened, offers an update of data linked to a mentioned spreadsheet. Every adjustment in the MINLP results in an up-to-date construction schedule.
The approach presented in this study requires basic programing skills, so future studies should focus on developing a more user-friendly system that automatically generates an optimization model, runs optimization in the background, and presents results in PMT. This would encourage more project managers to apply optimization in their daily practice. As a suggestion for further research on integrated systems, the application of online-based solvers should be considered in future work, especially from their potential to solve large-scale construction scheduling problems. In conclusion, the undoubted potential of integrating algebraic modeling systems and PMT to ensure the sustainability of cost-optimal construction schedules also encourages more intensive research to be done in this area.
Author Contributions
Conceptualization, B.D. and U.K.; methodology, B.D. and U.K.; software, B.D. and U.K.; validation, B.D. and U.K.; formal analysis, B.D. and U.K.; investigation, B.D. and U.K.; resources, B.D. and U.K.; data curation, B.D. and U.K.; writing—original draft preparation, B.D. and U.K.; writing—review and editing, B.D. and U.K.; visualization, B.D. and U.K.; supervision, U.K.; project administration, U.K.; funding acquisition, U.K. All authors have read and agreed to the published version of the manuscript.
Funding
This research is supported by Slovenian Research Agency (research core funding No. P2-0129).
Institutional Review Board Statement
Not applicable.
Informed Consent Statement
Not applicable.
Data Availability Statement
Data that support the findings of this study are available from the corresponding author upon reasonable request.
Acknowledgments
The authors acknowledge the financial support from the Slovenian Research Agency (research core funding No. P2-0129).
Conflicts of Interest
The authors declare no conflict of interest.
References
- Altuwaim, A.; El-Rayes, K. Multiobjective optimization model for planning repetitive construction projects. J. Constr. Eng. Manag. 2021, 147, 04021072. [Google Scholar] [CrossRef]
- Mésároš, P.; Spišáková, M.; Mandičák, T.; Čabala, J.; Oravec, M.M. Adaptive design of formworks for building renovation considering the sustainability of construction in BIM environment—Case study. Sustainability 2021, 13, 799. [Google Scholar] [CrossRef]
- Hanák, T.; Drozdová, A.; Marović, I. Bidding strategy in construction public procurement: A contractor’s perspective. Buildings 2021, 11, 47. [Google Scholar] [CrossRef]
- Milat, M.; Knezić, S.; Sedlar, J. Resilient scheduling as a response to uncertainty in construction projects. Appl. Sci. 2021, 11, 6493. [Google Scholar] [CrossRef]
- Dasović, B.; Galić, M.; Klanšek, U. A survey on integration of optimization and project management tools for sustainable construction scheduling. Sustainability 2020, 12, 3405. [Google Scholar] [CrossRef] [Green Version]
- Hegazy, T. Optimization of construction time-cost trade-off analysis using genetic algorithms. Can. J. Civ. Eng. 1999, 26, 685–697. [Google Scholar] [CrossRef]
- Dawood, N.; Sriprasert, E. Construction scheduling using multi-constraint and genetic algorithms approach. Constr. Manag. Econ. 2006, 24, 19–30. [Google Scholar] [CrossRef]
- Anagnostopoulos, K.P.; Koulinas, G.K. A genetic hyperheuristic algorithm for the resource constrained project scheduling problem. In Proceedings of the IEEE Congress on Evolutionary Computation, Barcelona, Spain, 18–23 July 2010; pp. 1–6. [Google Scholar] [CrossRef]
- Panwar, A.; Jha, K.N. Integrating quality and safety in construction scheduling time-cost trade-off model. J. Constr. Eng. Manag. 2021, 147, 04020160. [Google Scholar] [CrossRef]
- Zhang, Y.; Ng, S.T. An ant colony system based decision support system for construction time-cost optimization. J. Civ. Eng. Manag. 2012, 18, 580–589. [Google Scholar] [CrossRef]
- Koulinas, G.K.; Anagnostopoulos, K.P. A new tabu search-based hyper-heuristic algorithm for solving construction leveling problems with limited resource availabilities. Autom. Constr. 2013, 31, 169–175. [Google Scholar] [CrossRef]
- Lu, M.; Lam, H.-C.; Dai, F. Resource-constrained critical path analysis based on discrete event simulation and particle swarm optimization. Autom. Constr. 2008, 17, 670–681. [Google Scholar] [CrossRef]
- Anagnostopoulos, K.P.; Koulinas, G.K. A simulated annealing hyperheuristic for construction resource levelling. Constr. Manag. Econ. 2010, 28, 163–175. [Google Scholar] [CrossRef]
- Moselhi, O.; Roofigari-Esfahan, N. Project schedule compression: A multi-objective methodology. Constr. Innov. 2013, 13, 374–393. [Google Scholar] [CrossRef]
- Valenko, T.; Klanšek, U. An integration of spreadsheet and project management software for cost optimal time scheduling in construction. Organ. Technol. Manag. Constr. Int. J. 2017, 9, 1627–1637. [Google Scholar] [CrossRef] [Green Version]
- Tiwari, S.; Johari, S. Project scheduling by integration of time cost trade-off and constrained resource scheduling. J. Inst. Eng. Ser. A 2015, 96, 37–46. [Google Scholar] [CrossRef]
- Hebert, J.E.; Deckro, R.F. Combining contemporary and traditional project management tools to resolve a project scheduling problem. Comput. Oper. Res. 2011, 38, 21–32. [Google Scholar] [CrossRef]
- Tereso, A.; Guedes, A.; Cascais, A. A computer application for scheduling in MS Project. Comput. Sci. Appl. 2014, 1, 309–318. [Google Scholar]
- Siganporia, C.C. Strategic Biopharmaceutical Production Planning for Batch and Perfusion Processes. Ph.D Thesis, University College London, London, UK, 2016. [Google Scholar]
- GAMS General Algebraic Modeling System. Available online: https://www.gams.com/ (accessed on 17 September 2021).
- Wang, H.-W.; Lin, J.-R.; Zhang, J.-P. Work package-based information modeling for resource-constrained scheduling of construction projects. Autom. Constr. 2020, 109, 102958. [Google Scholar] [CrossRef]
- Klanšek, U. Mixed-integer nonlinear programming model for nonlinear discrete optimization of project schedules under restricted costs. J. Constr. Eng. Manag. 2016, 142, 04015088. [Google Scholar] [CrossRef]
- LeBlanc, L.J.; Grossman, T.A.; Bartolacci, M.R. Ensuring scalability and reusability of spreadsheet linear programming models. Omega 2019, 84, 55–69. [Google Scholar] [CrossRef]
- Klanšek, U.; Pšunder, M. MINLP optimization model for the nonlinear discrete time-cost trade-off problem. Adv. Eng. Softw. 2012, 48, 6–16. [Google Scholar] [CrossRef]
- Sakellaropoulos, S.; Chassiakos, A.P. Project time-cost analysis under generalised precedence relations. Adv. Eng. Softw. 2004, 35, 715–724. [Google Scholar] [CrossRef]
- DICOPT DIscrete and Continuous OPTimizer. Available online: https://www.gams.com/latest/docs/S_DICOPT.html (accessed on 17 September 2021).
Publisher’s Note: MDPI stays neutral with regard to jurisdictional claims in published maps and institutional affiliations. |
© 2021 by the authors. Licensee MDPI, Basel, Switzerland. This article is an open access article distributed under the terms and conditions of the Creative Commons Attribution (CC BY) license (https://creativecommons.org/licenses/by/4.0/).