
On the Classification of a Greenhouse Environment for a Rose Crop Based on AI-Based Surrogate Models

 ,
, 


 , and
, and
Abstract
:1. Introduction and Motivation
1.1. Introduction
1.2. Aims and Motivation
2. Materials and Methods
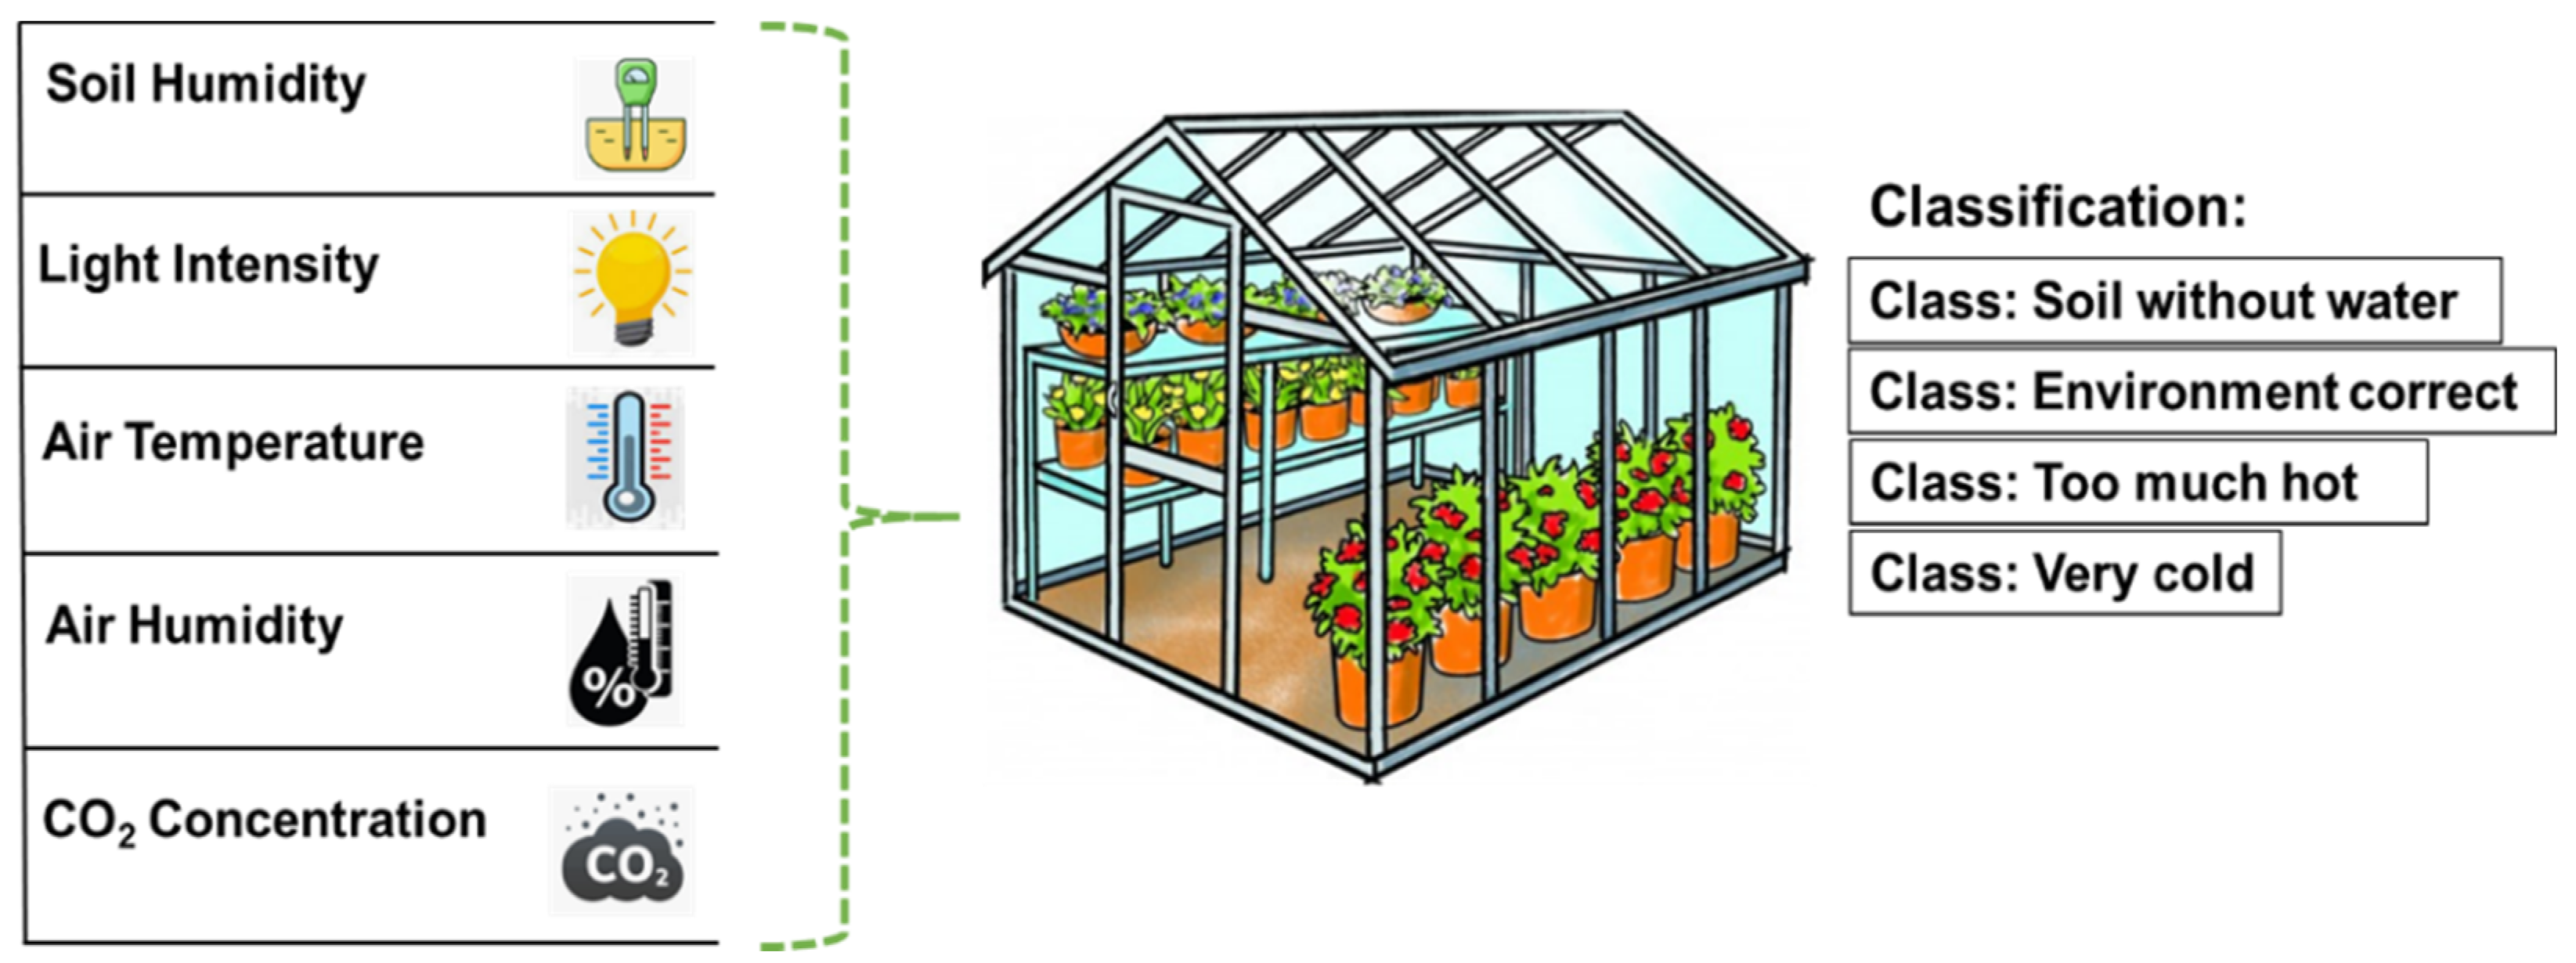
2.1. Data Collection
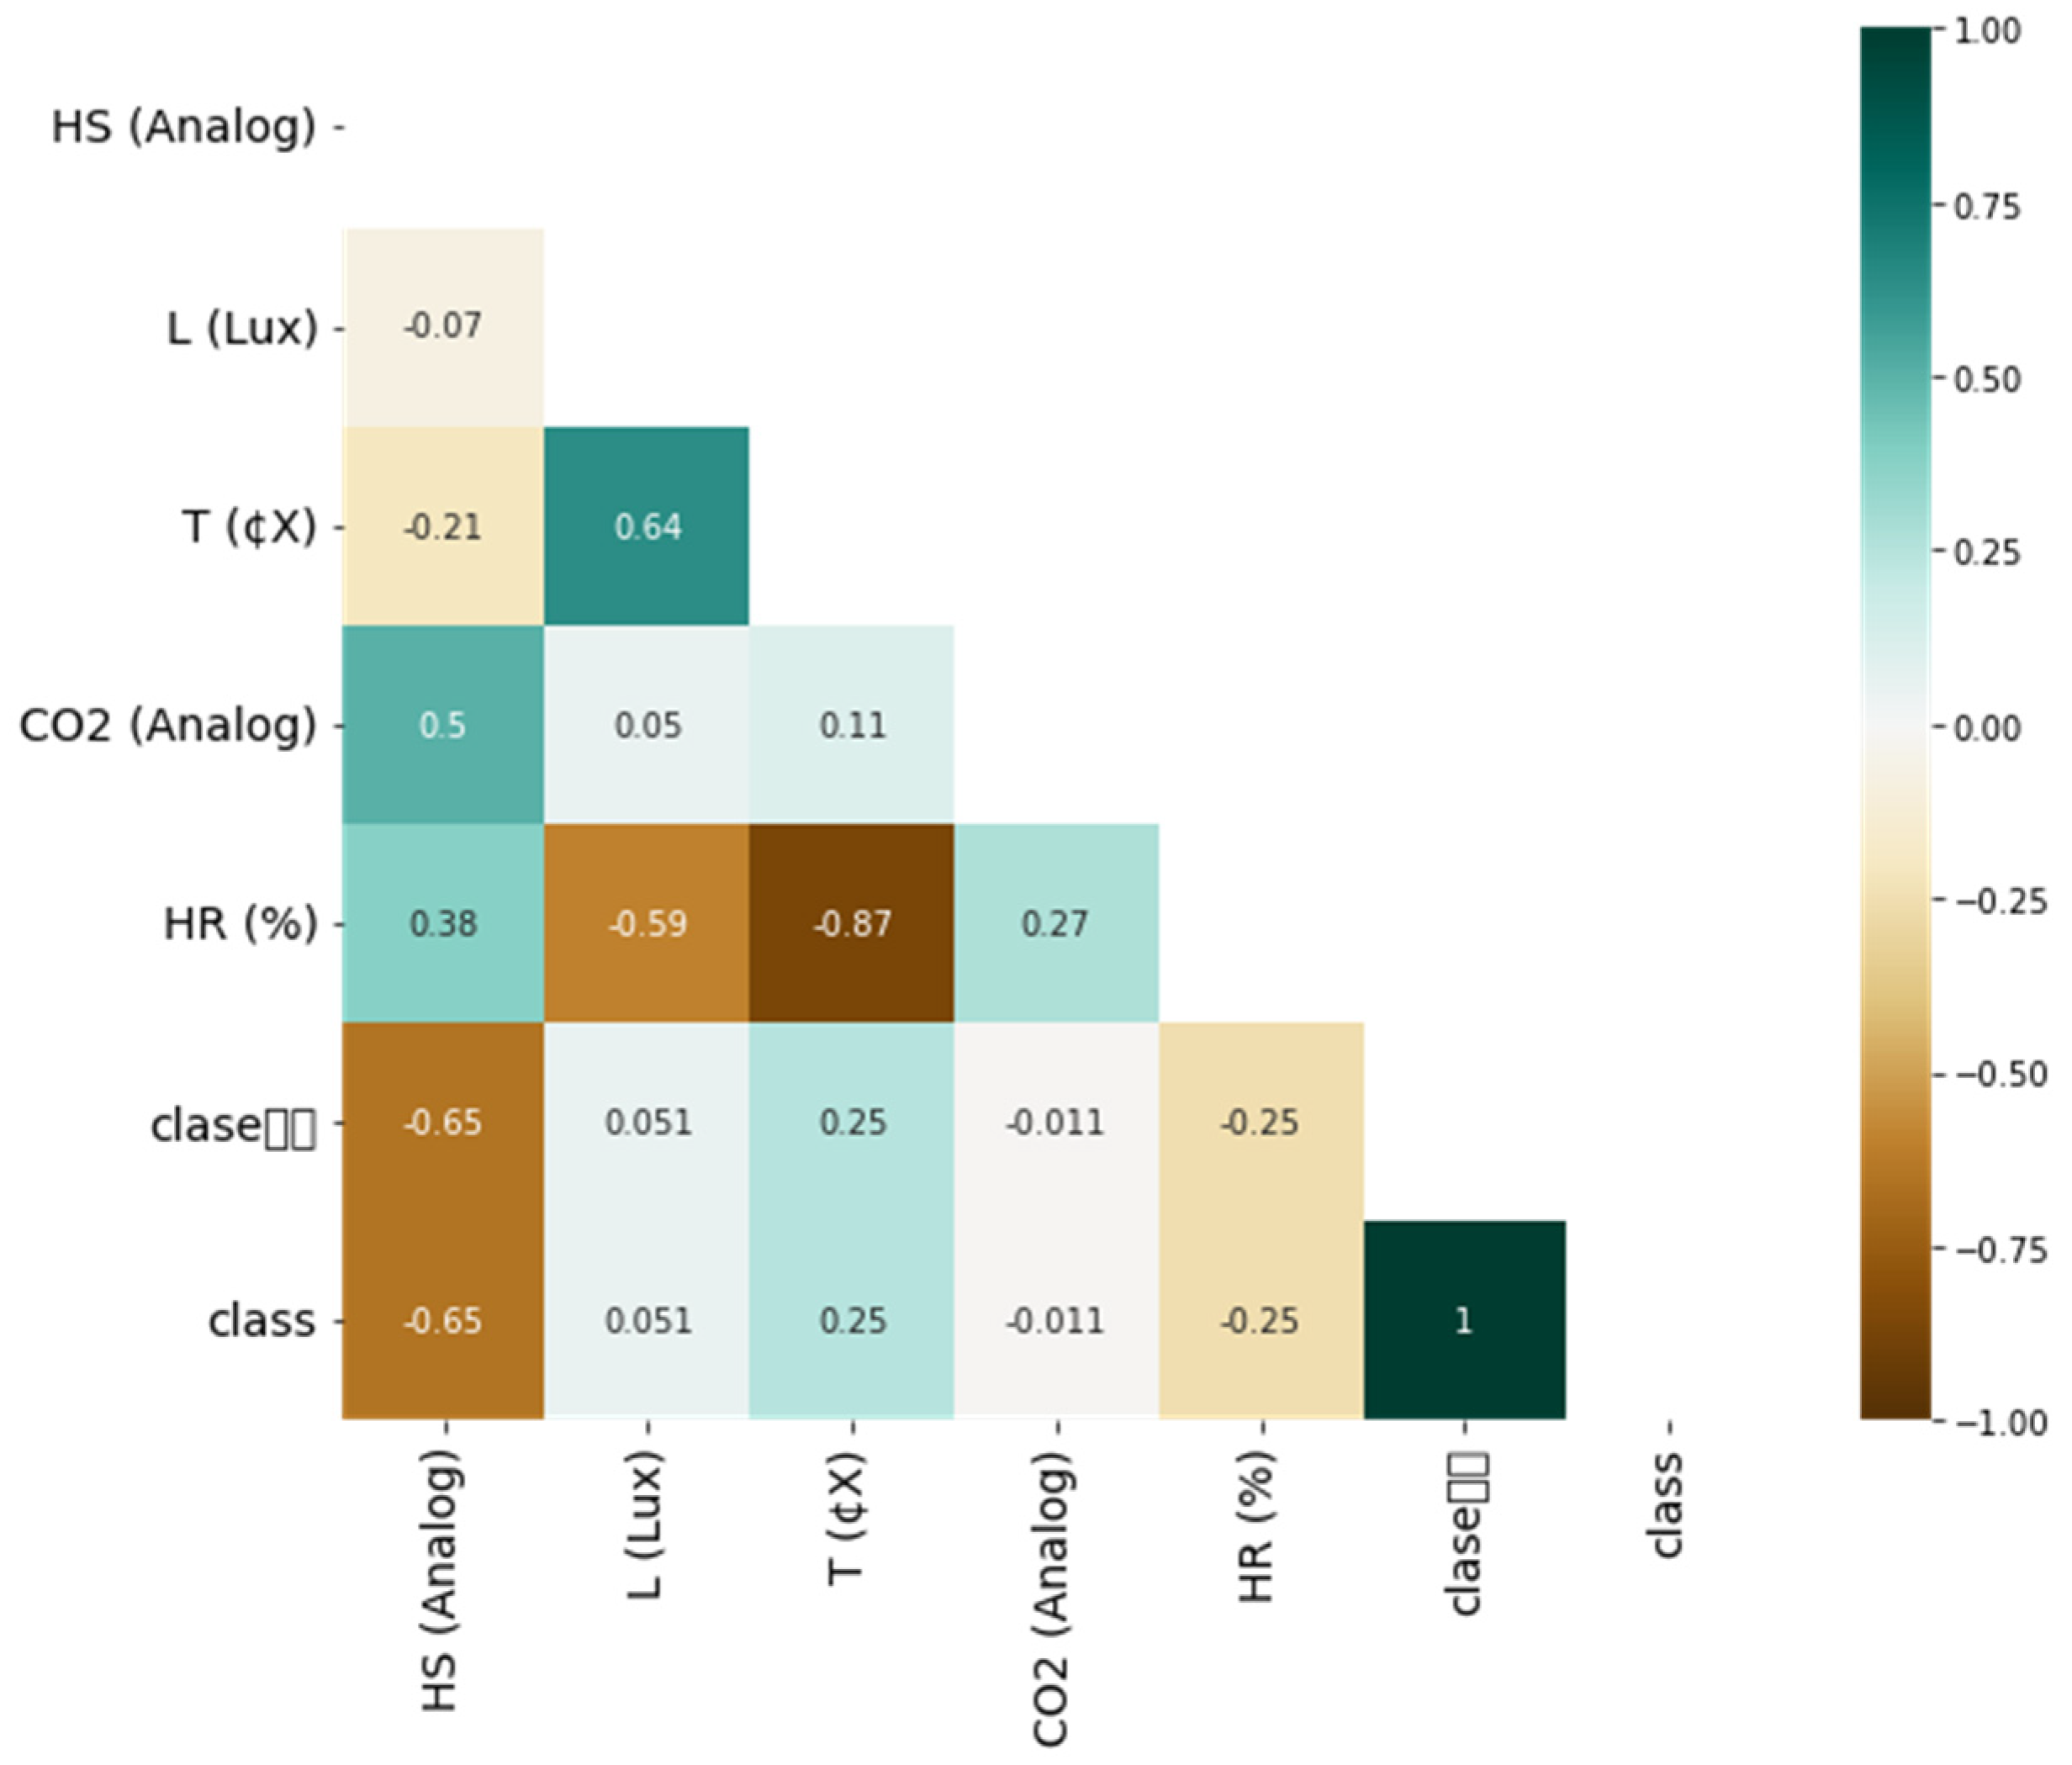
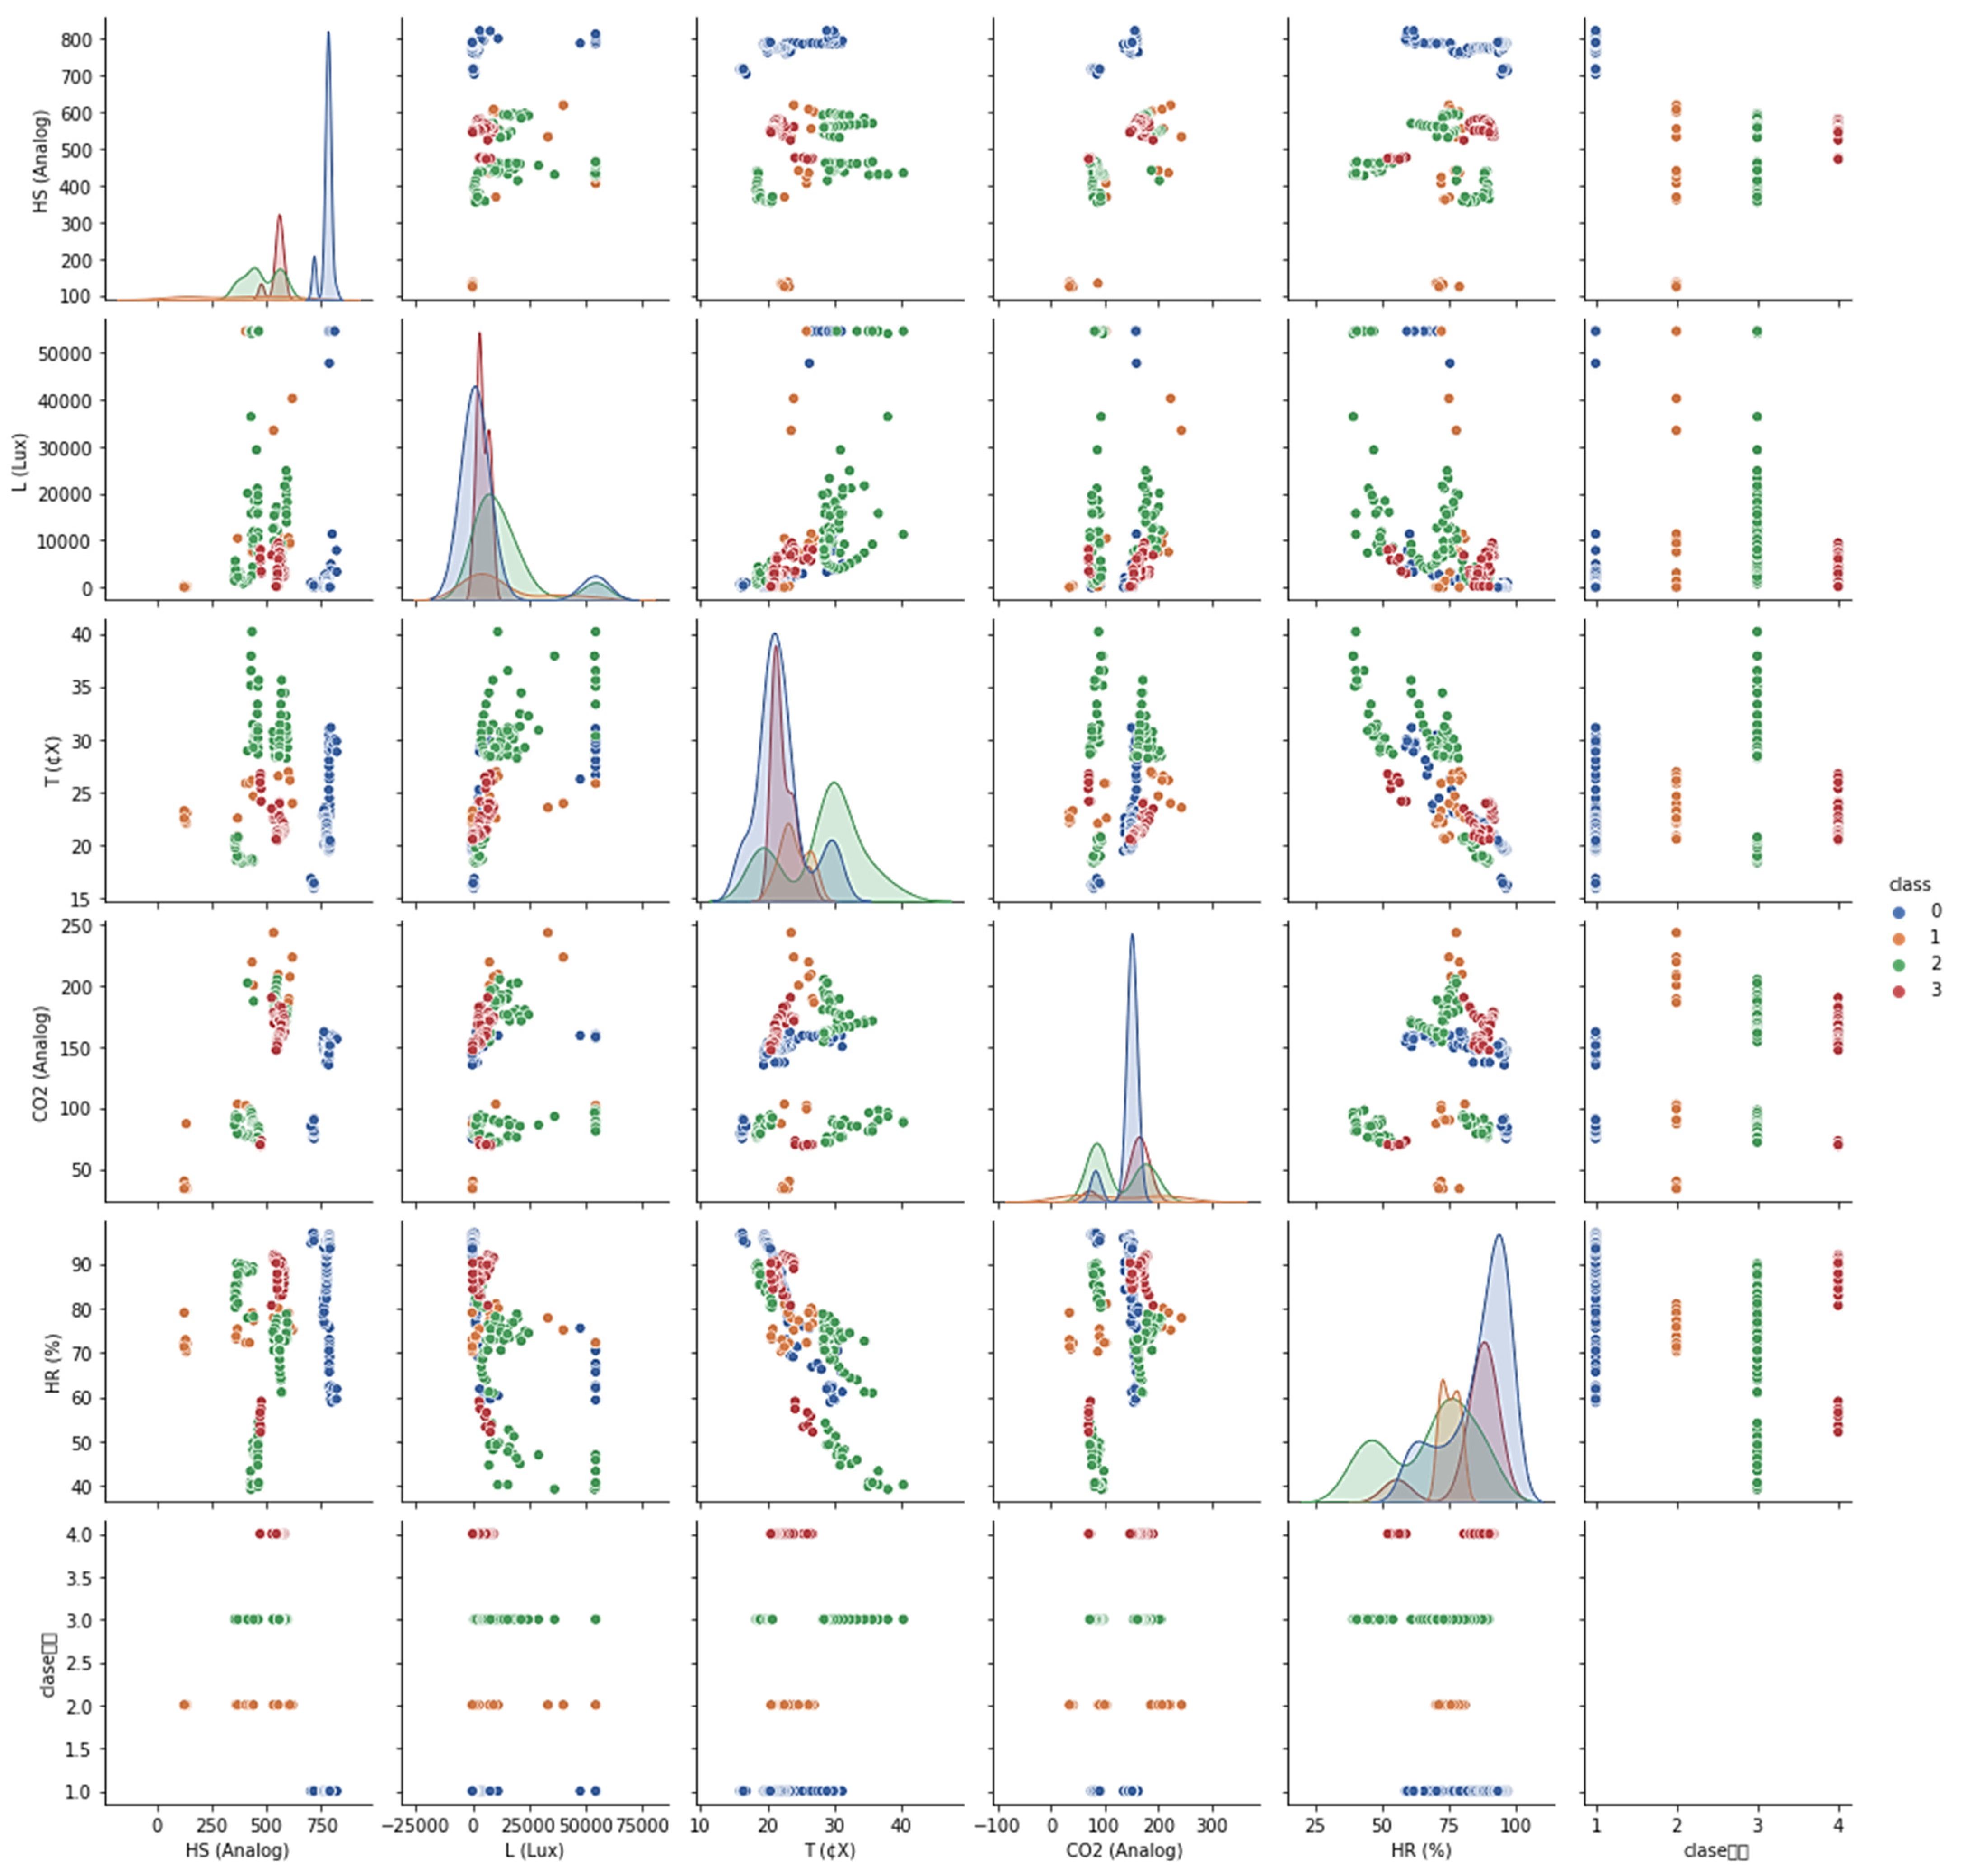
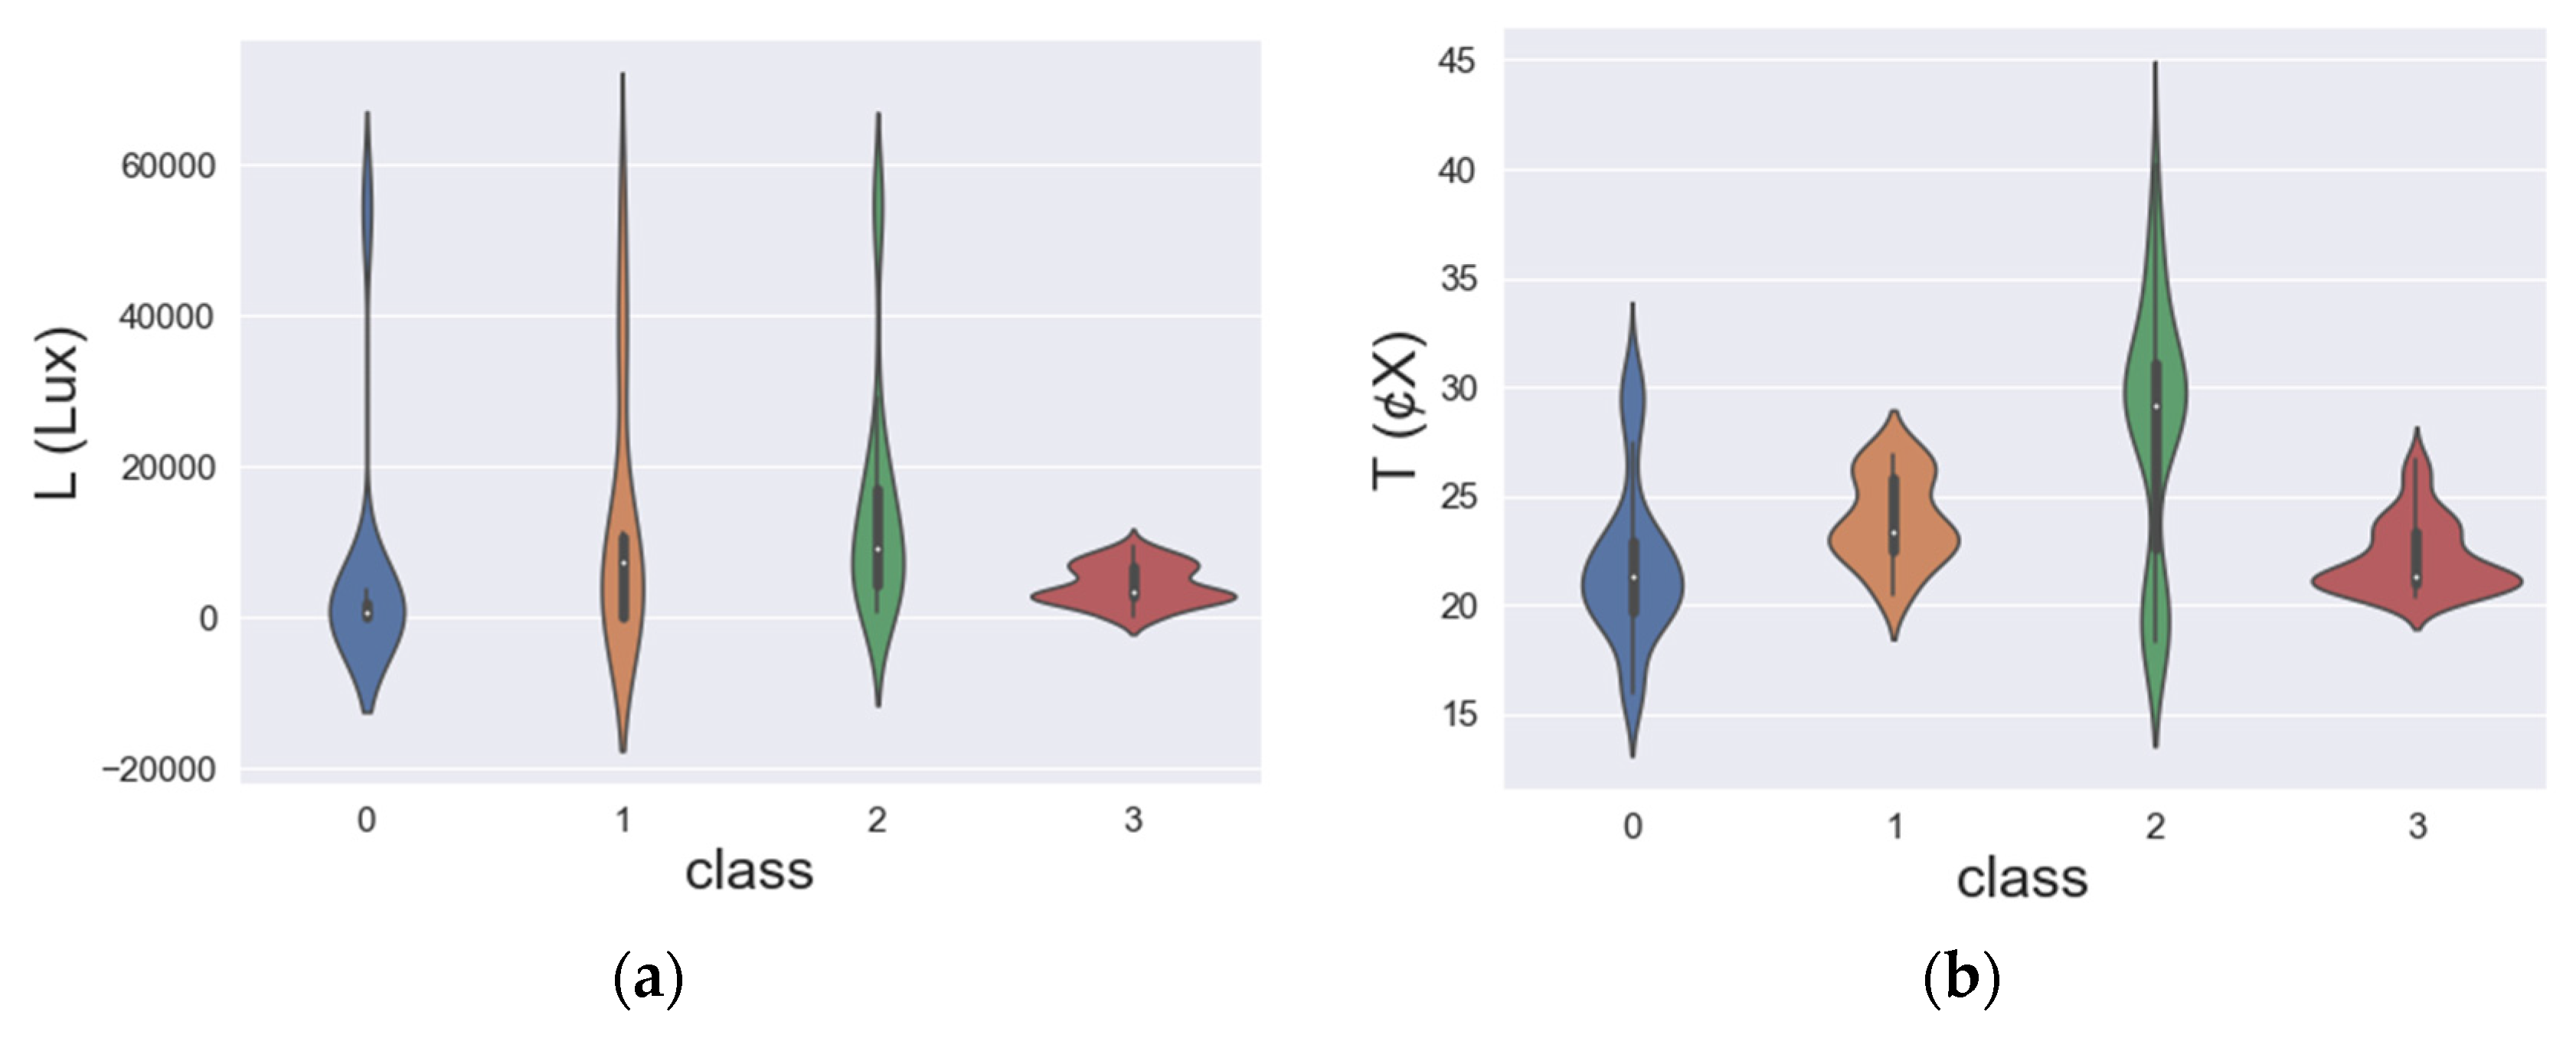
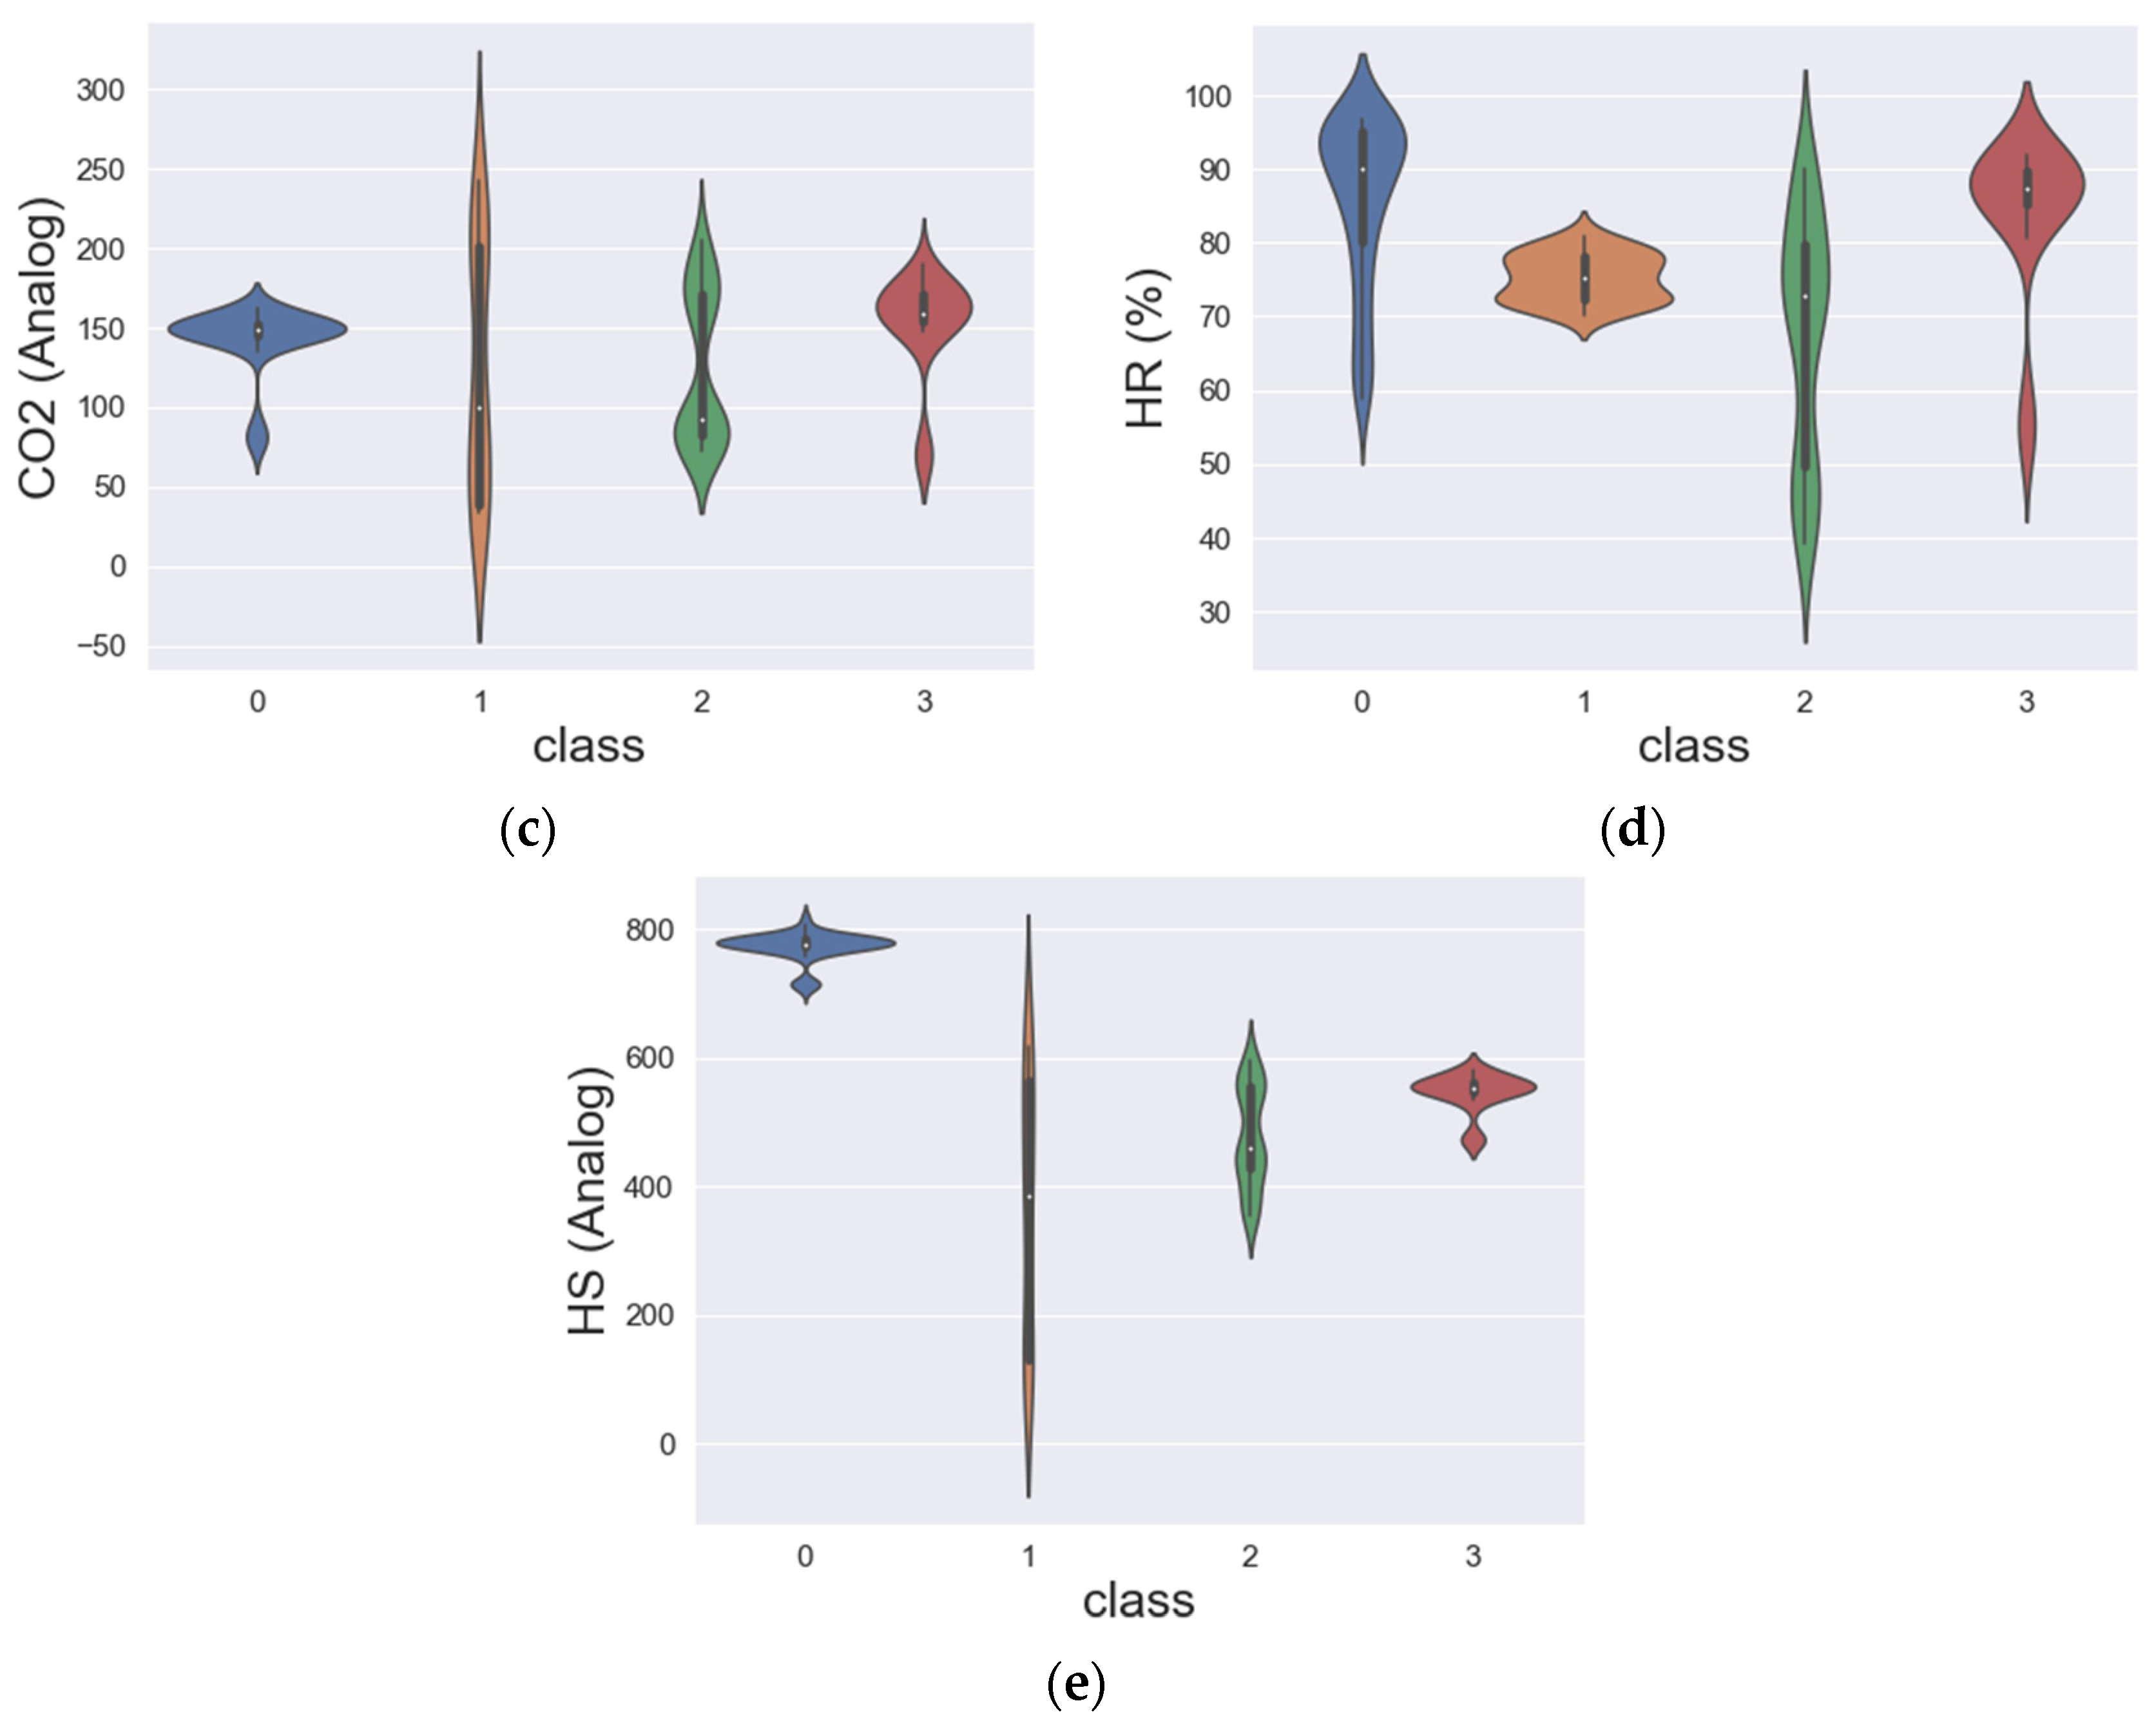
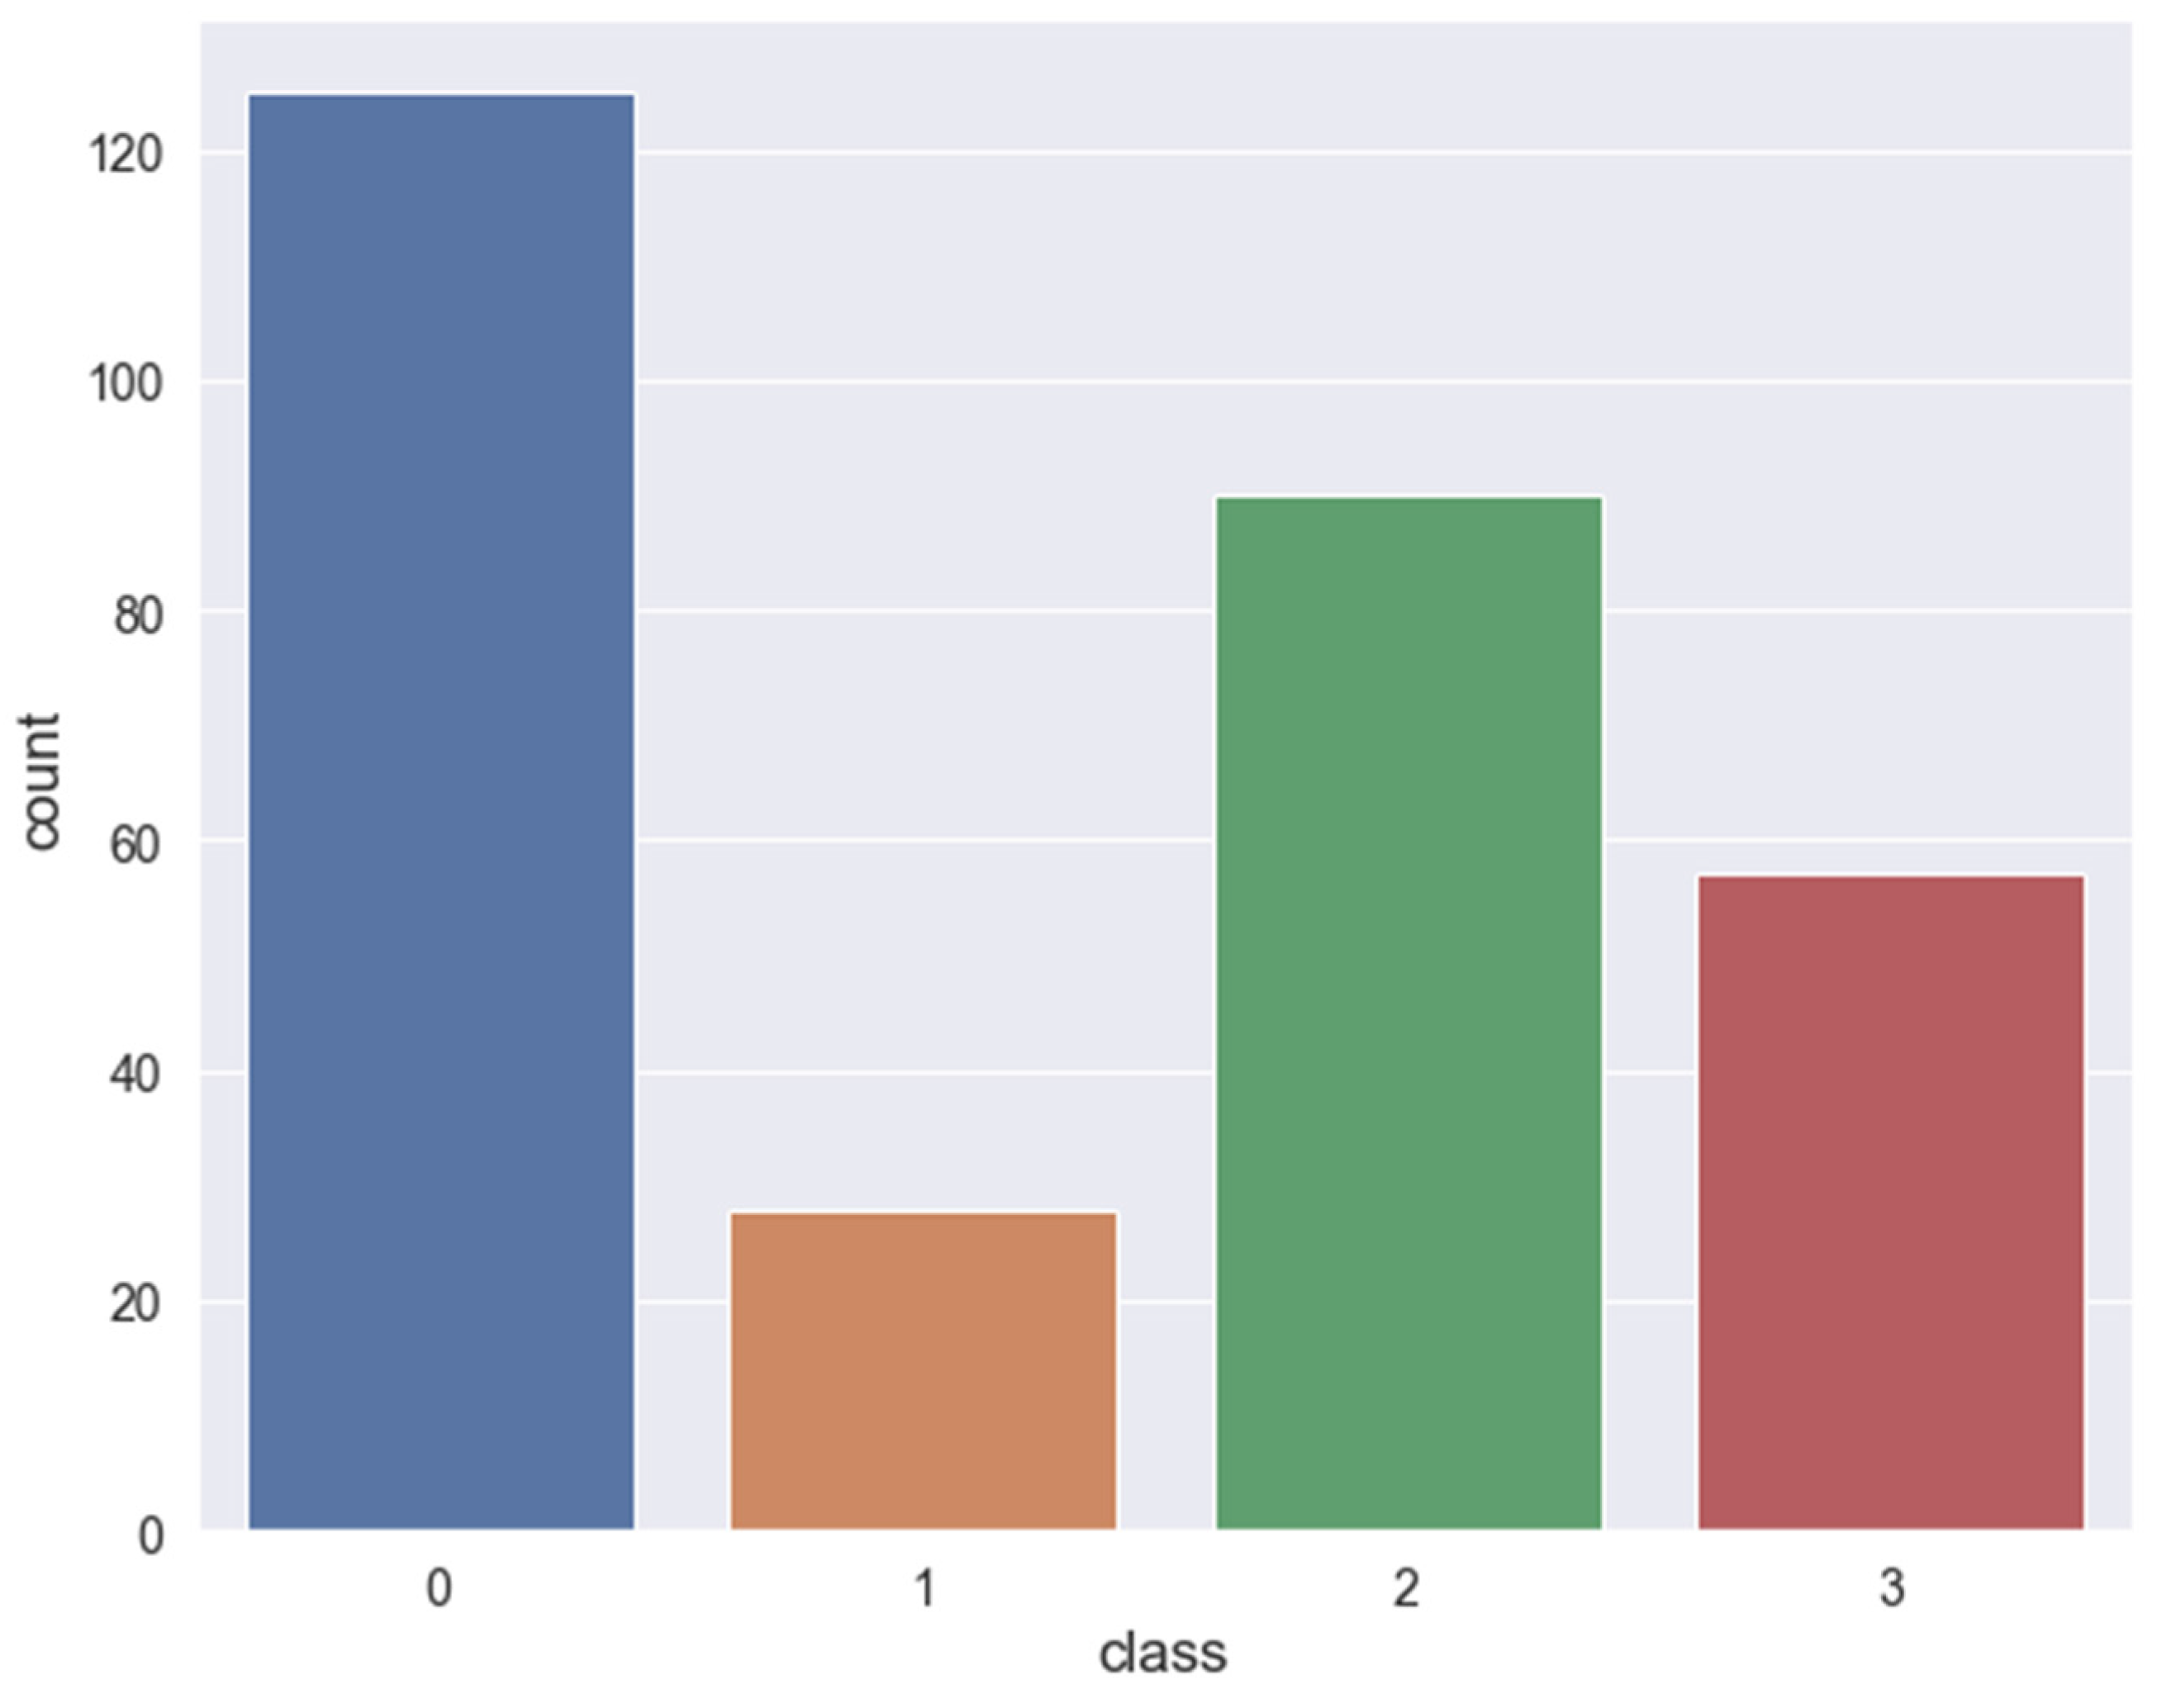
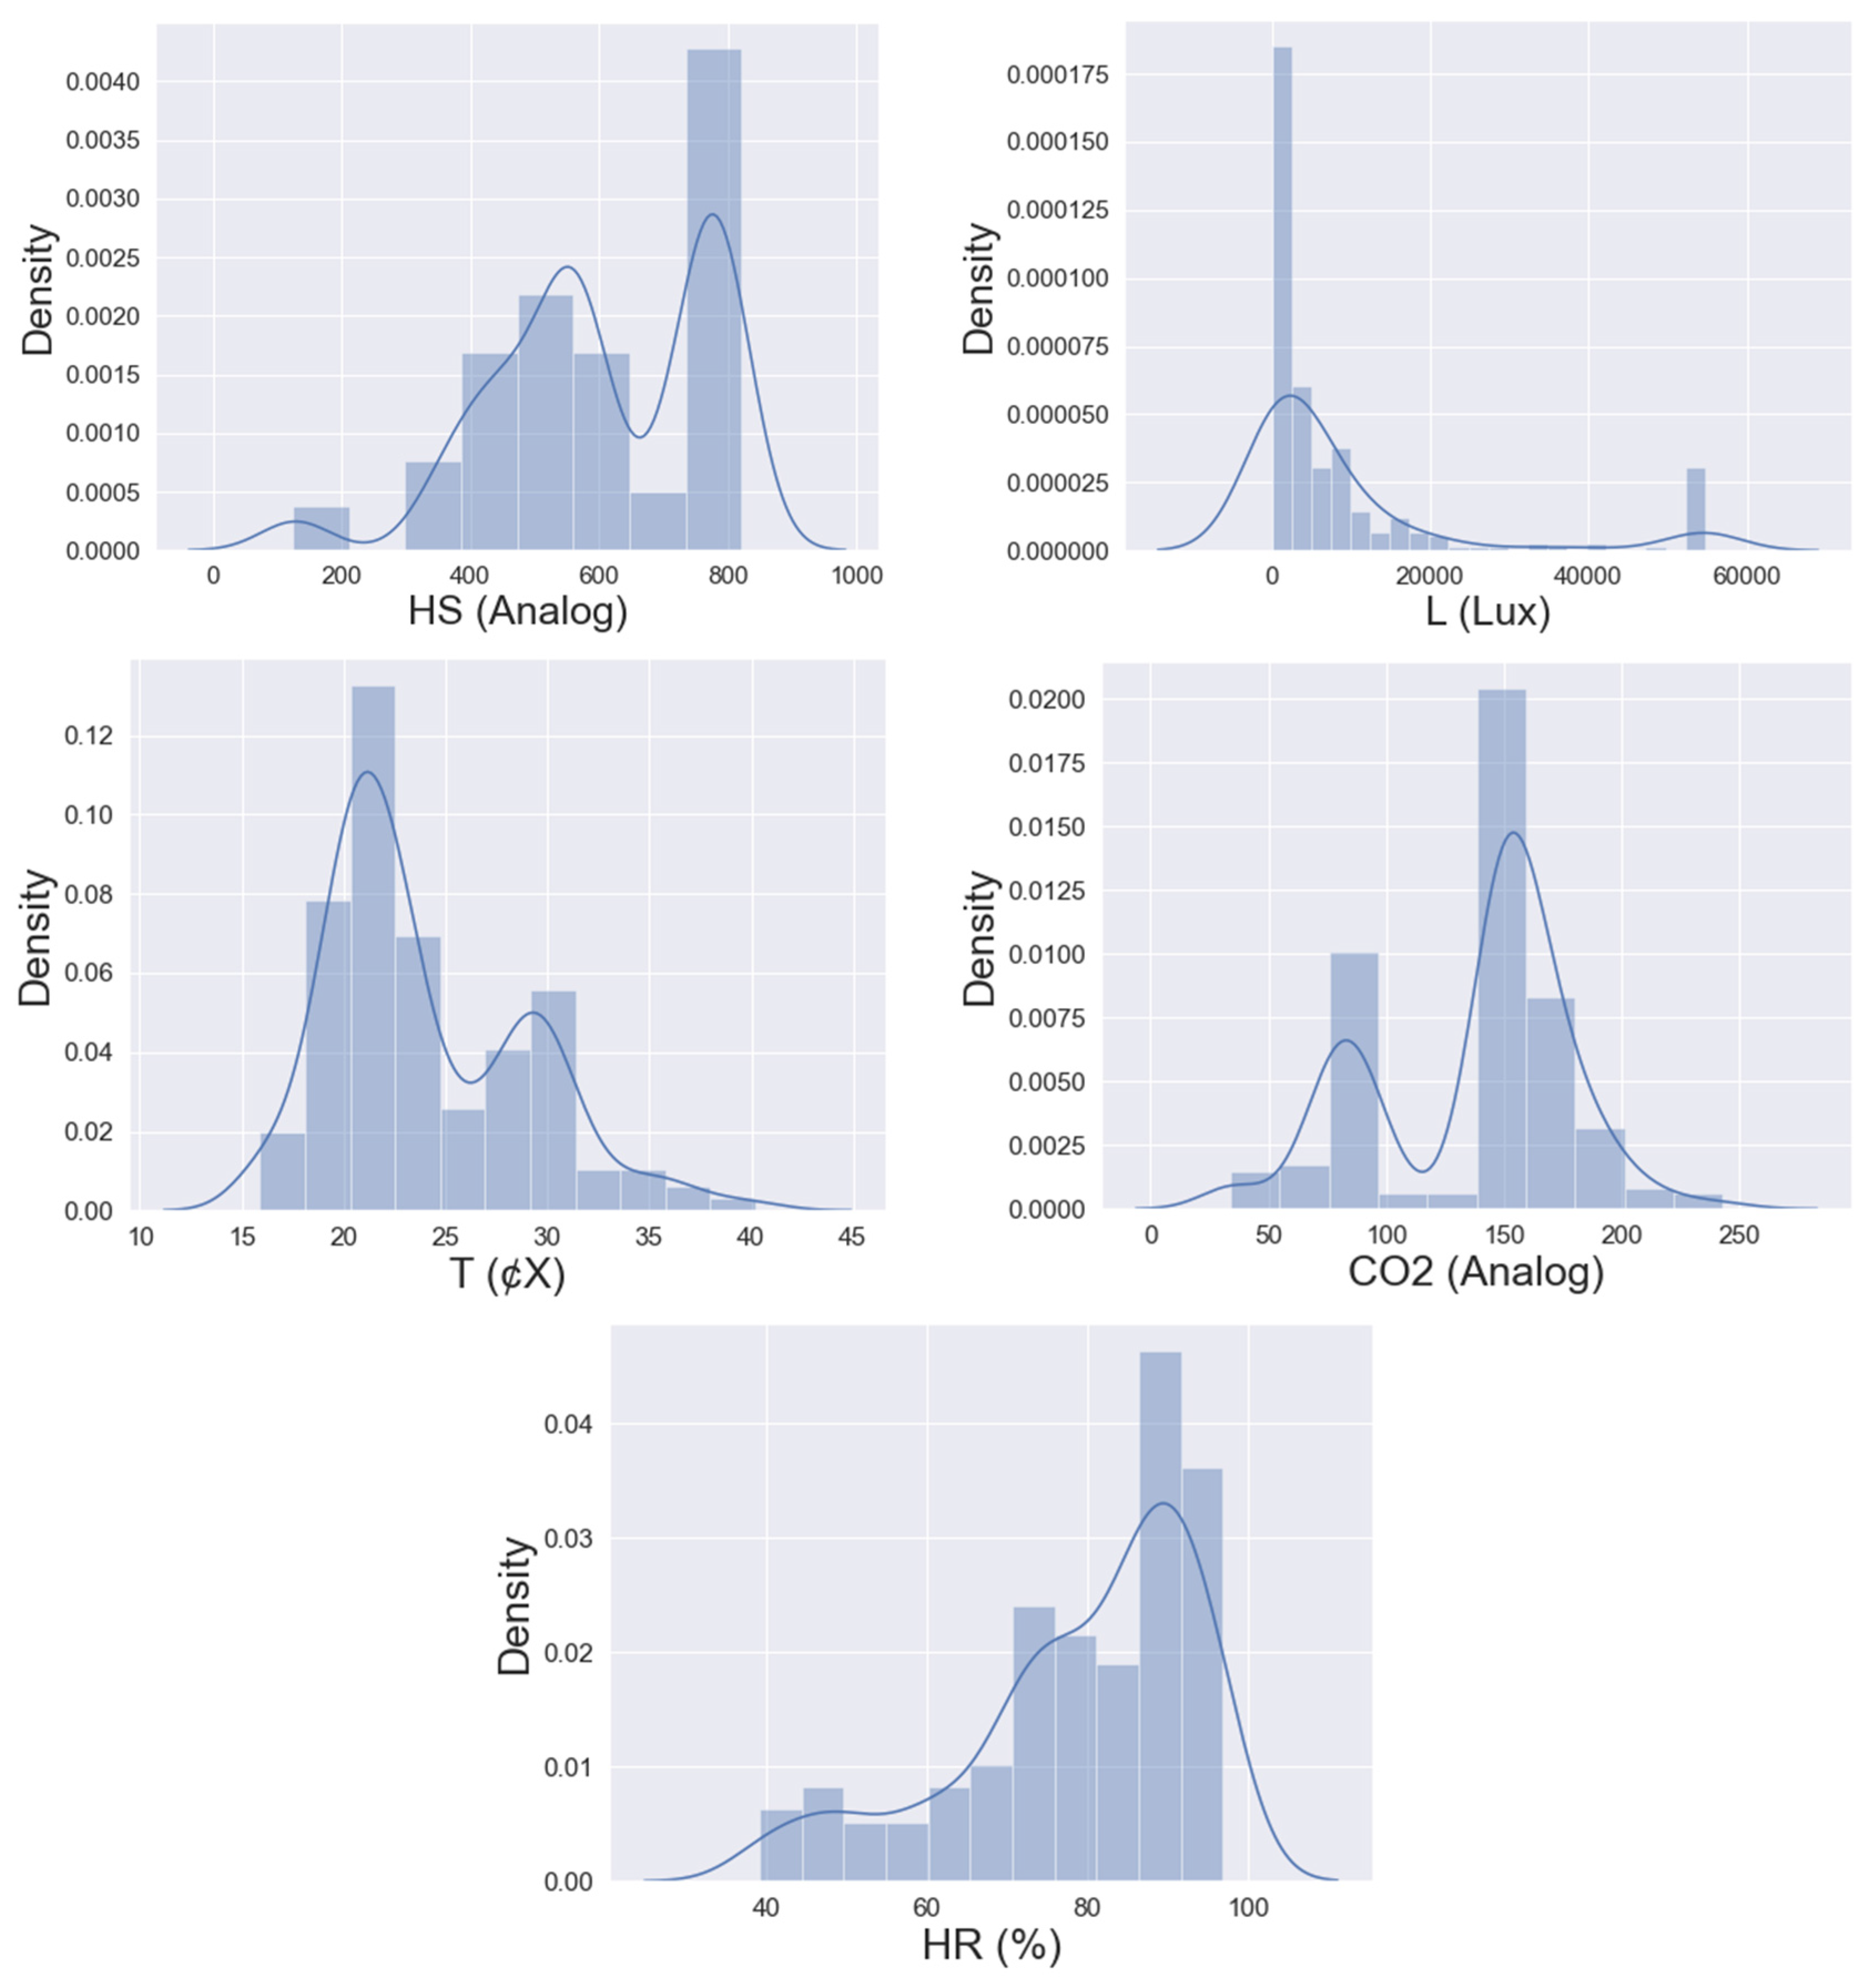
2.2. Data Visualization
2.3. Bayesian Optimization Integrated with a Deep Neural Network Algorithm
3. Results and Discussion
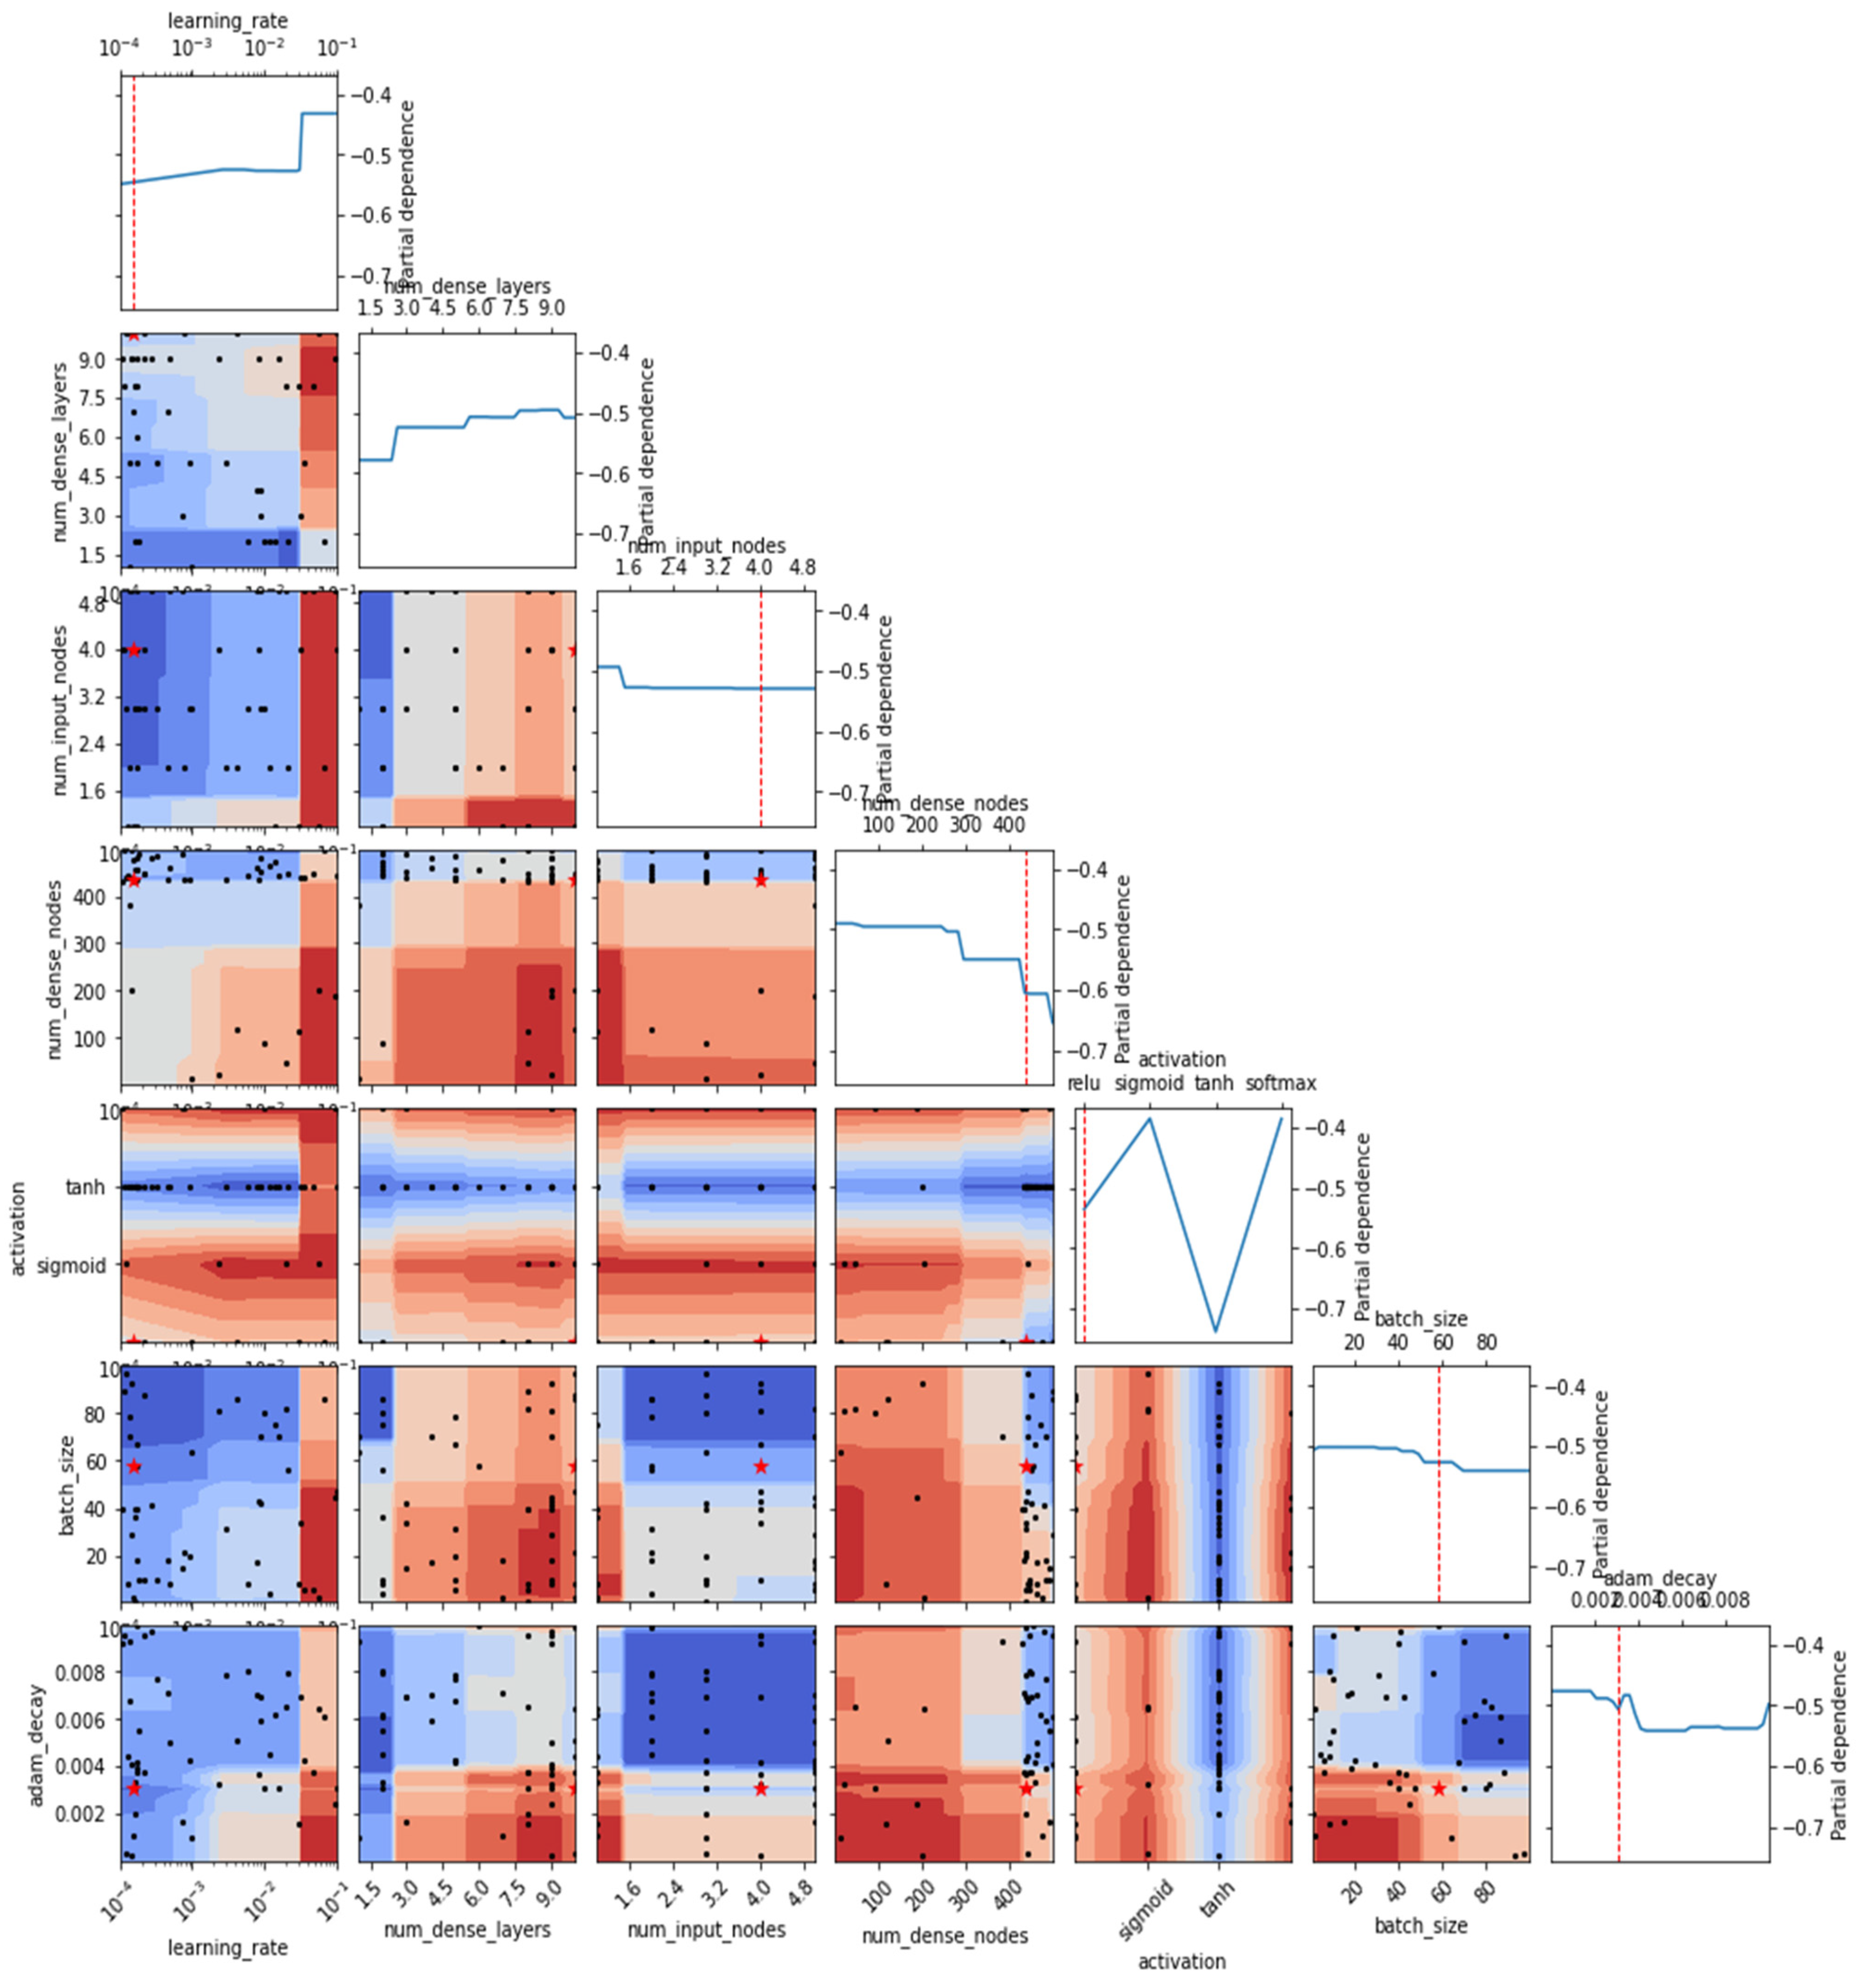
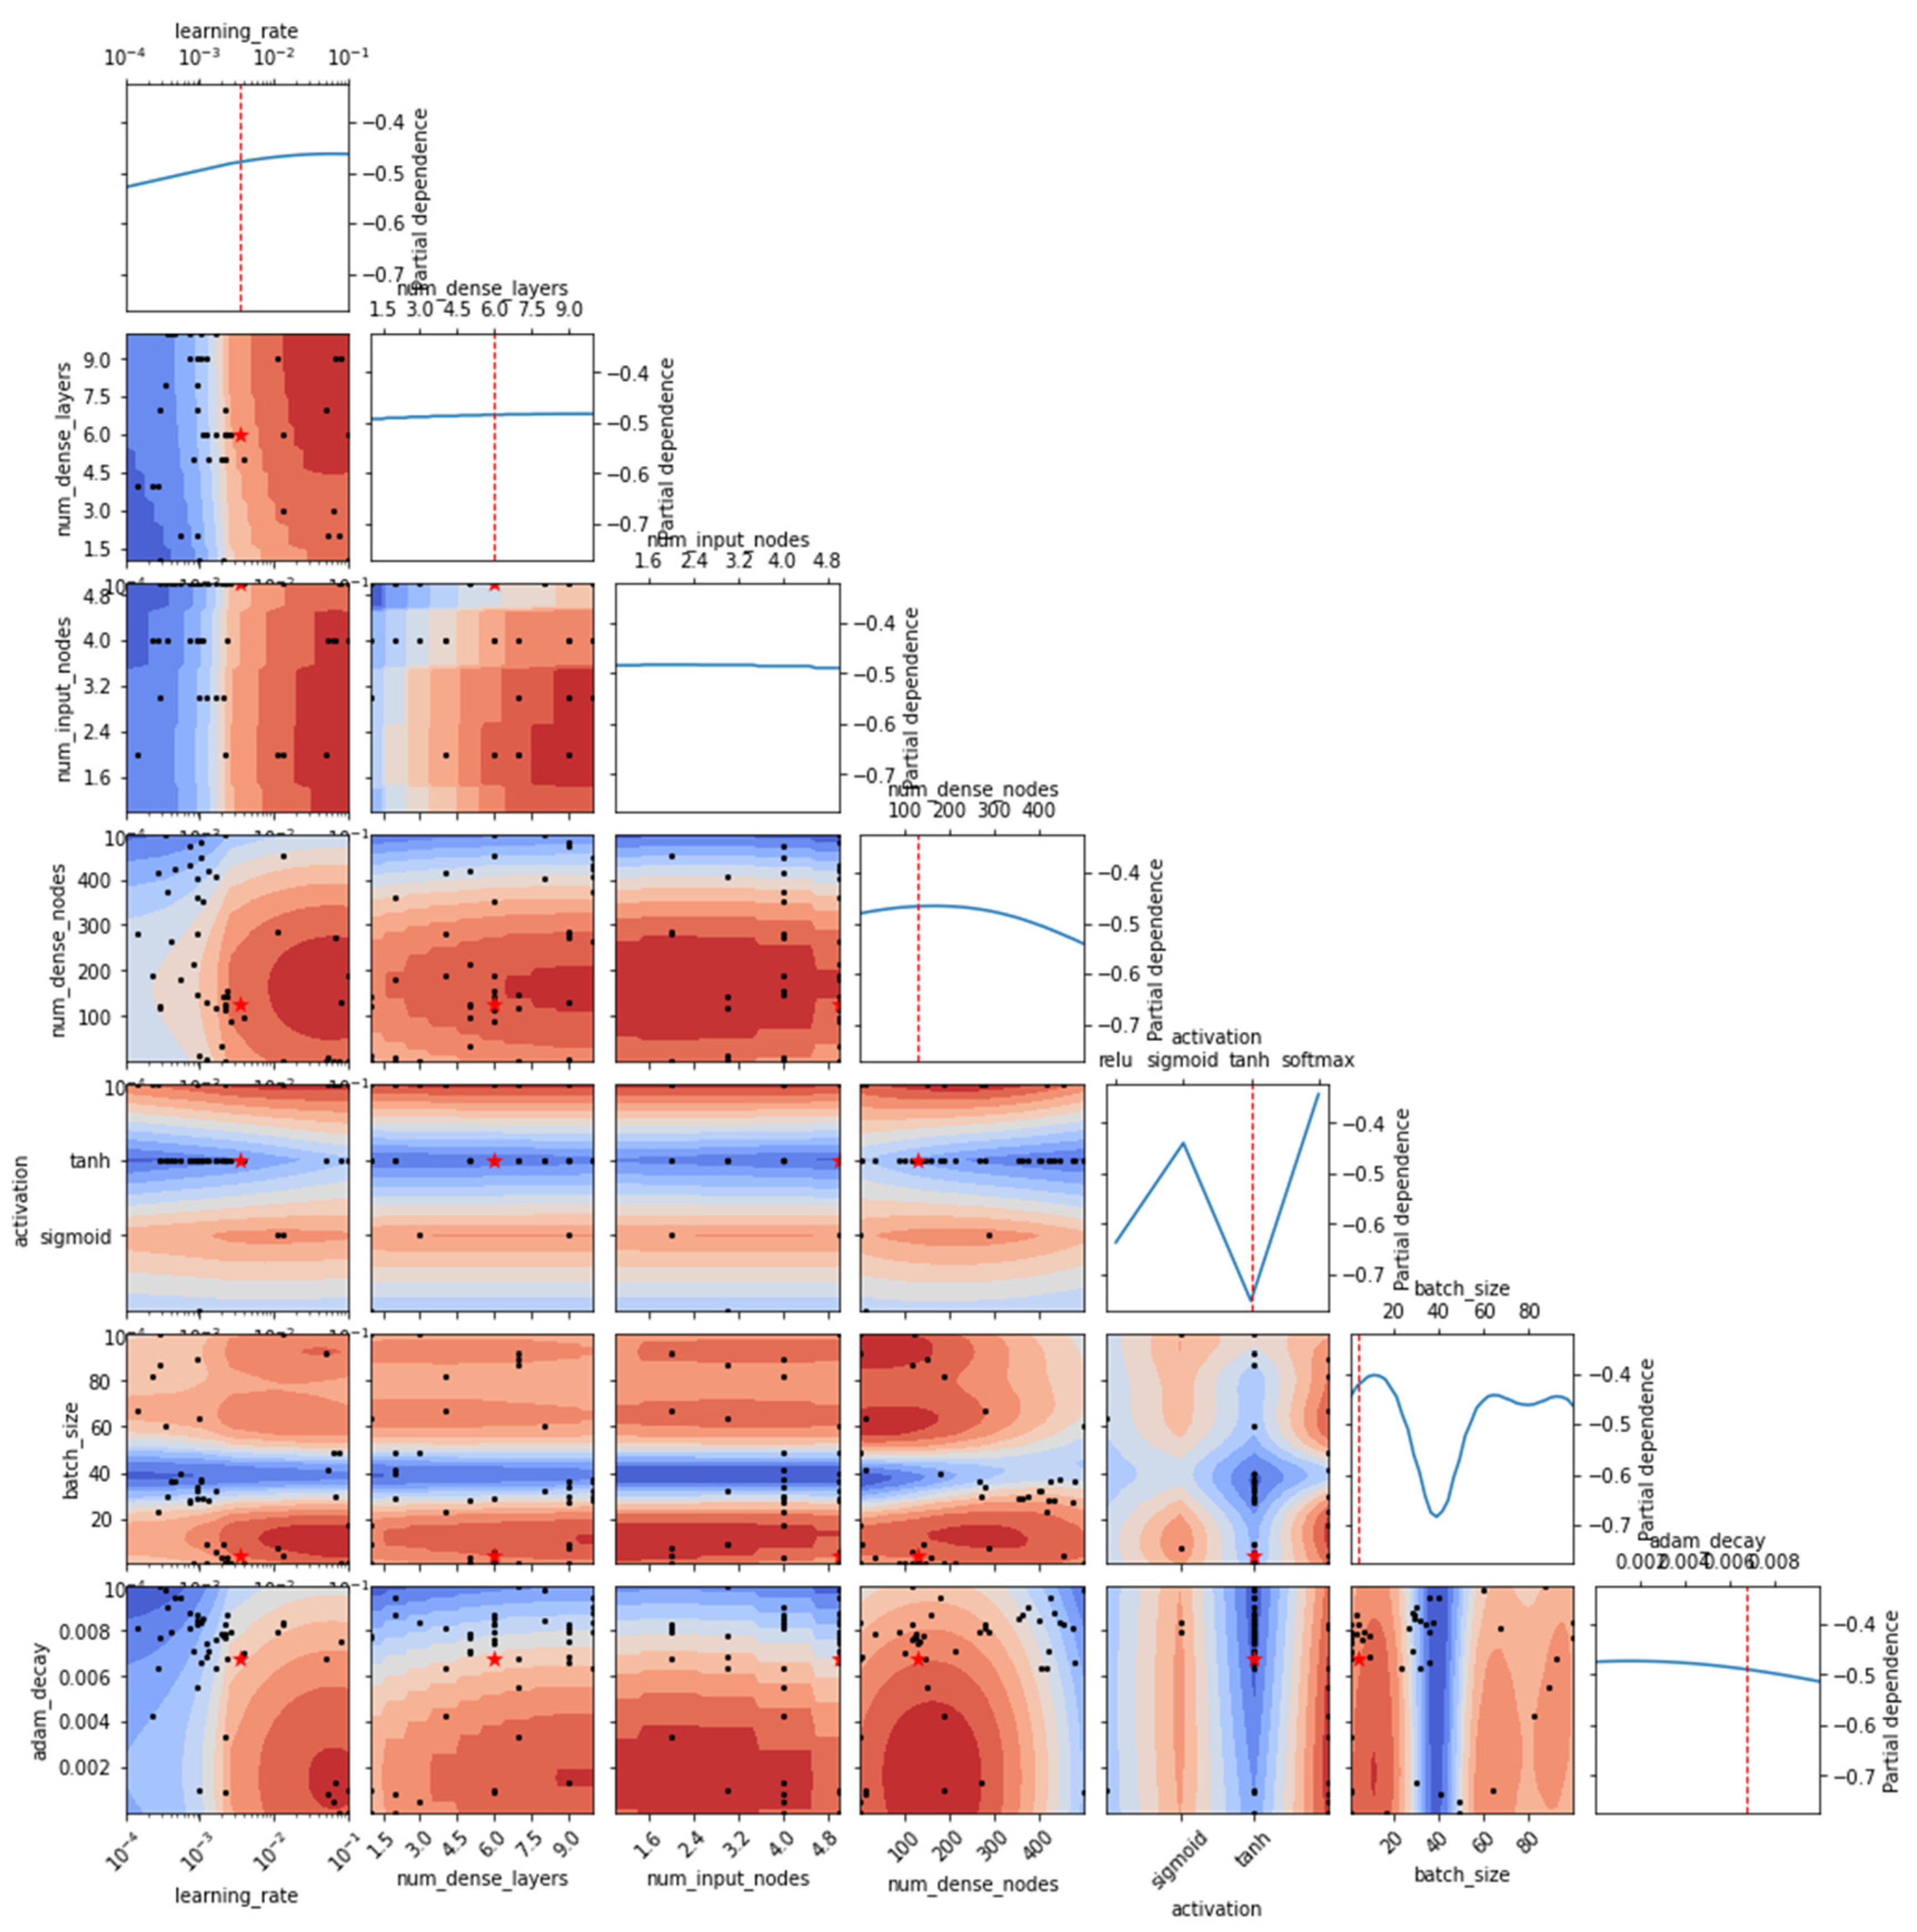
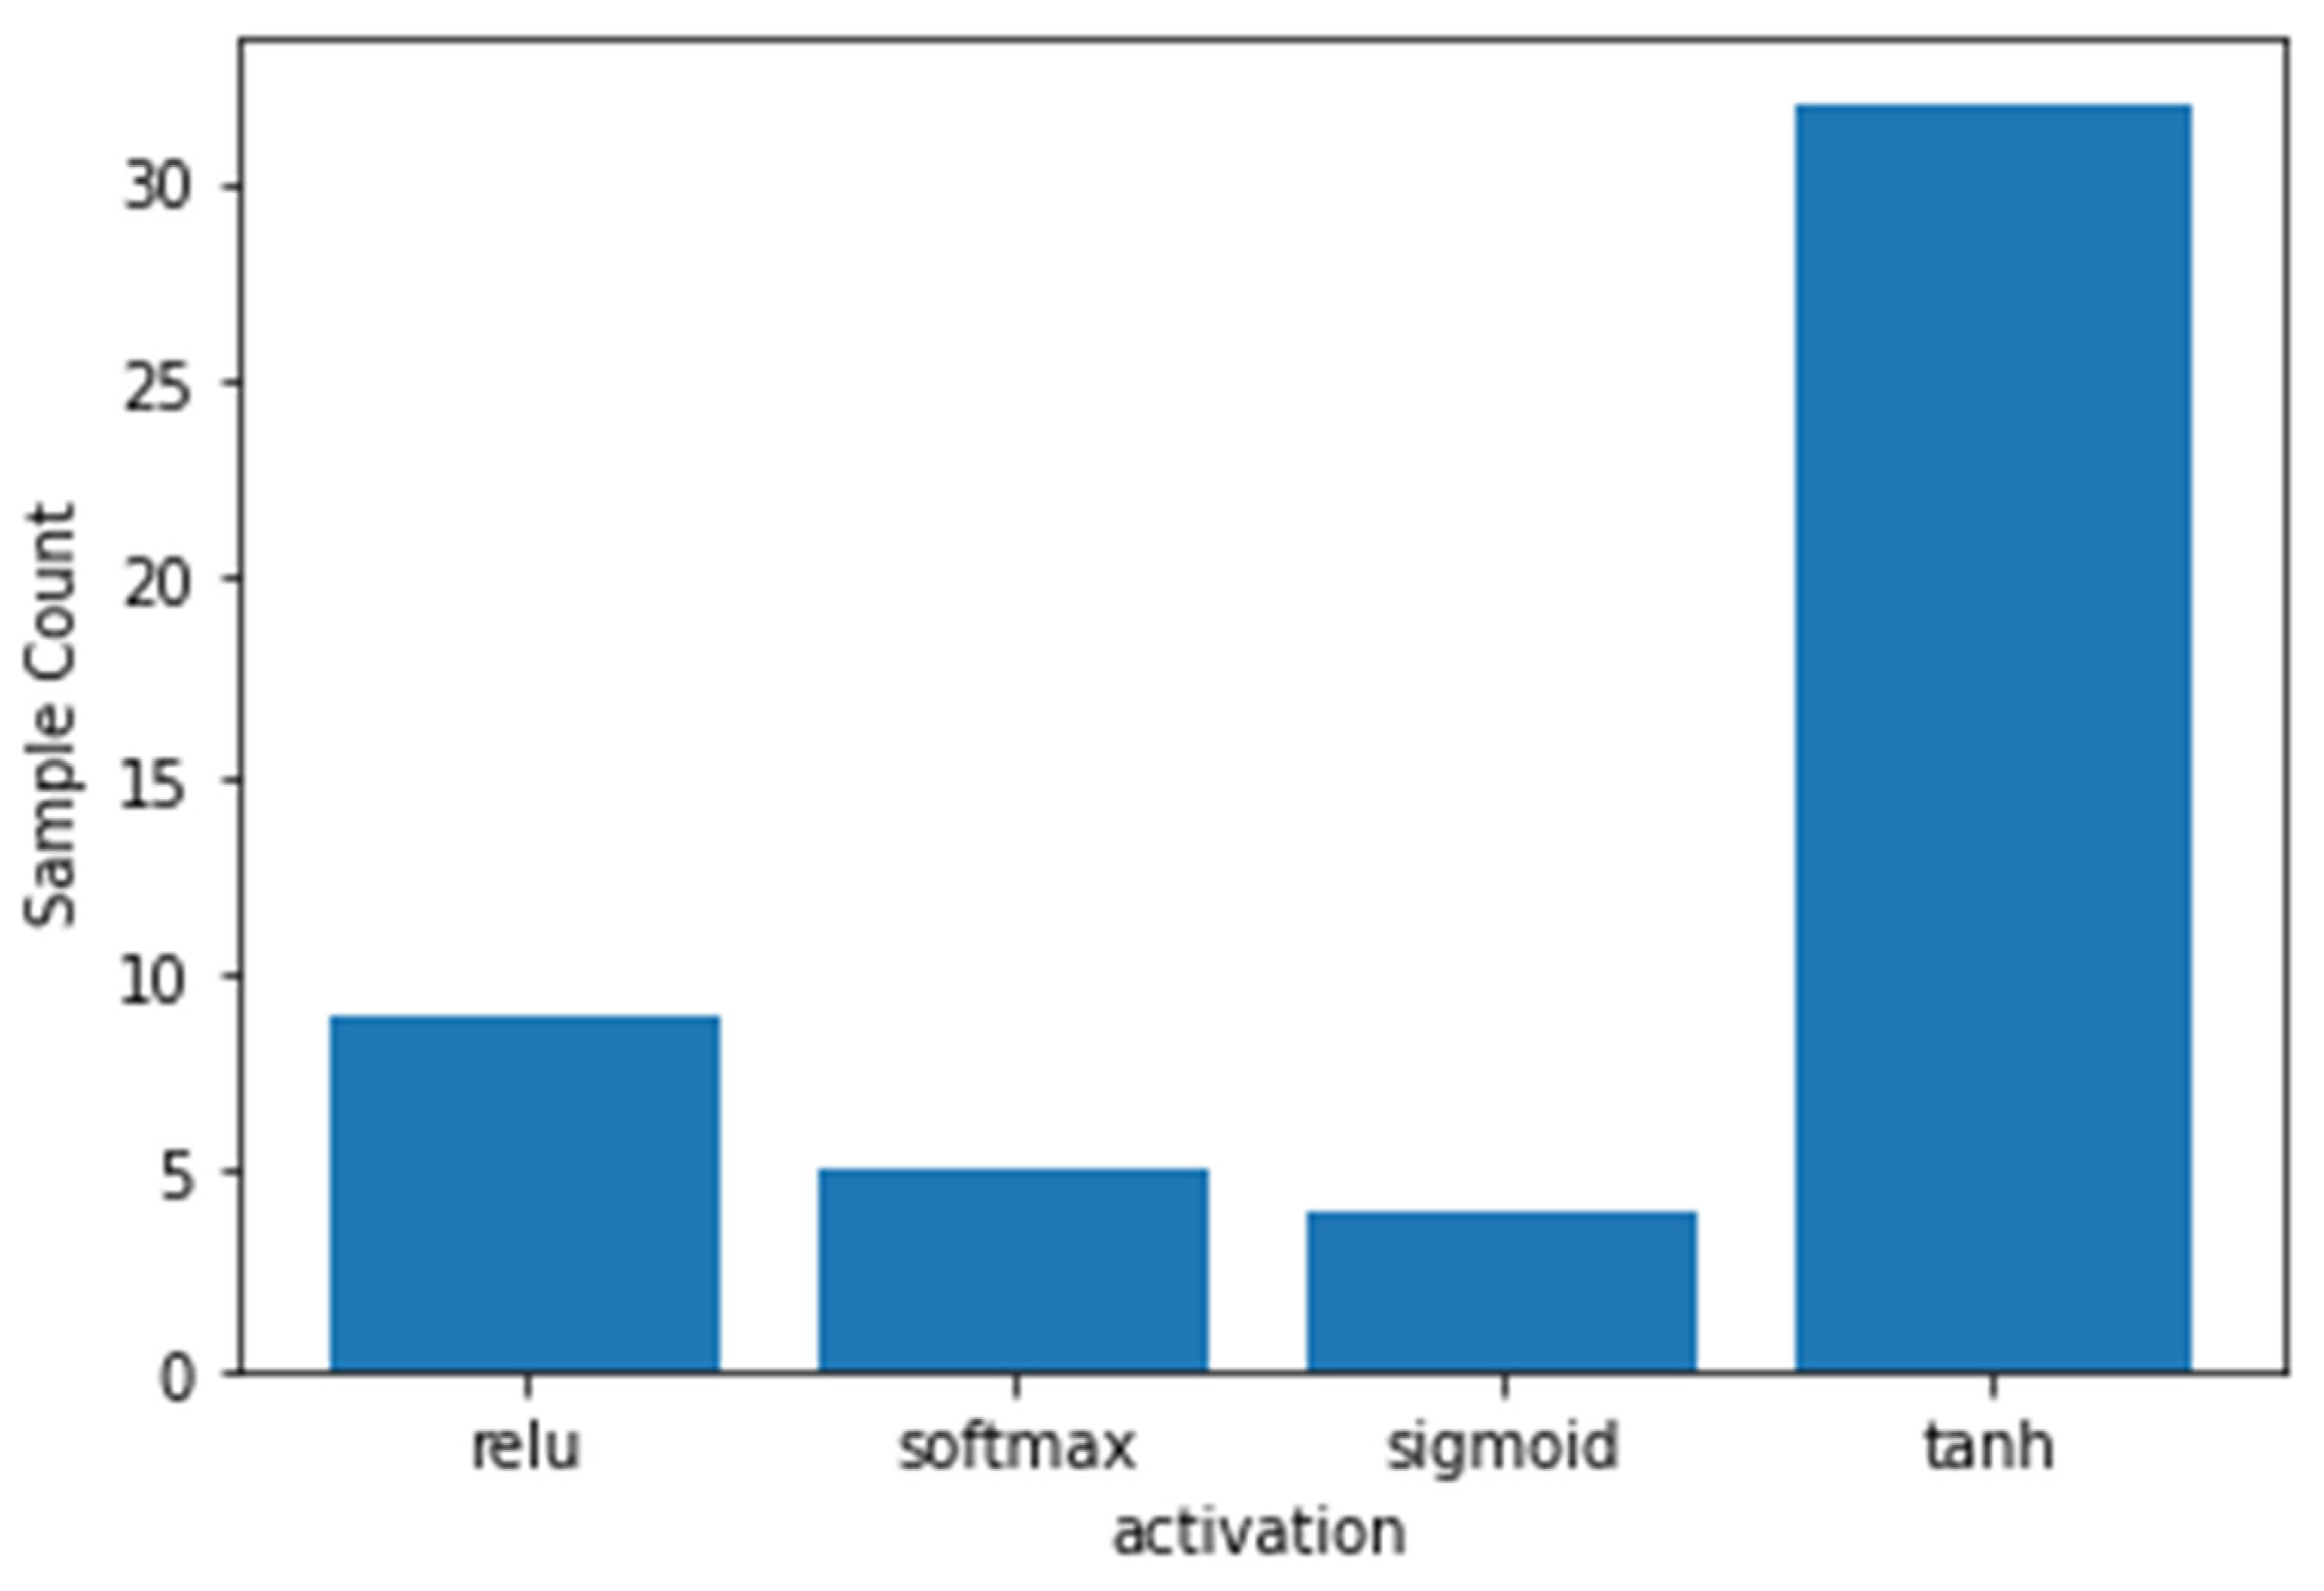
3.1. Optimization of the Hyper-Parameters
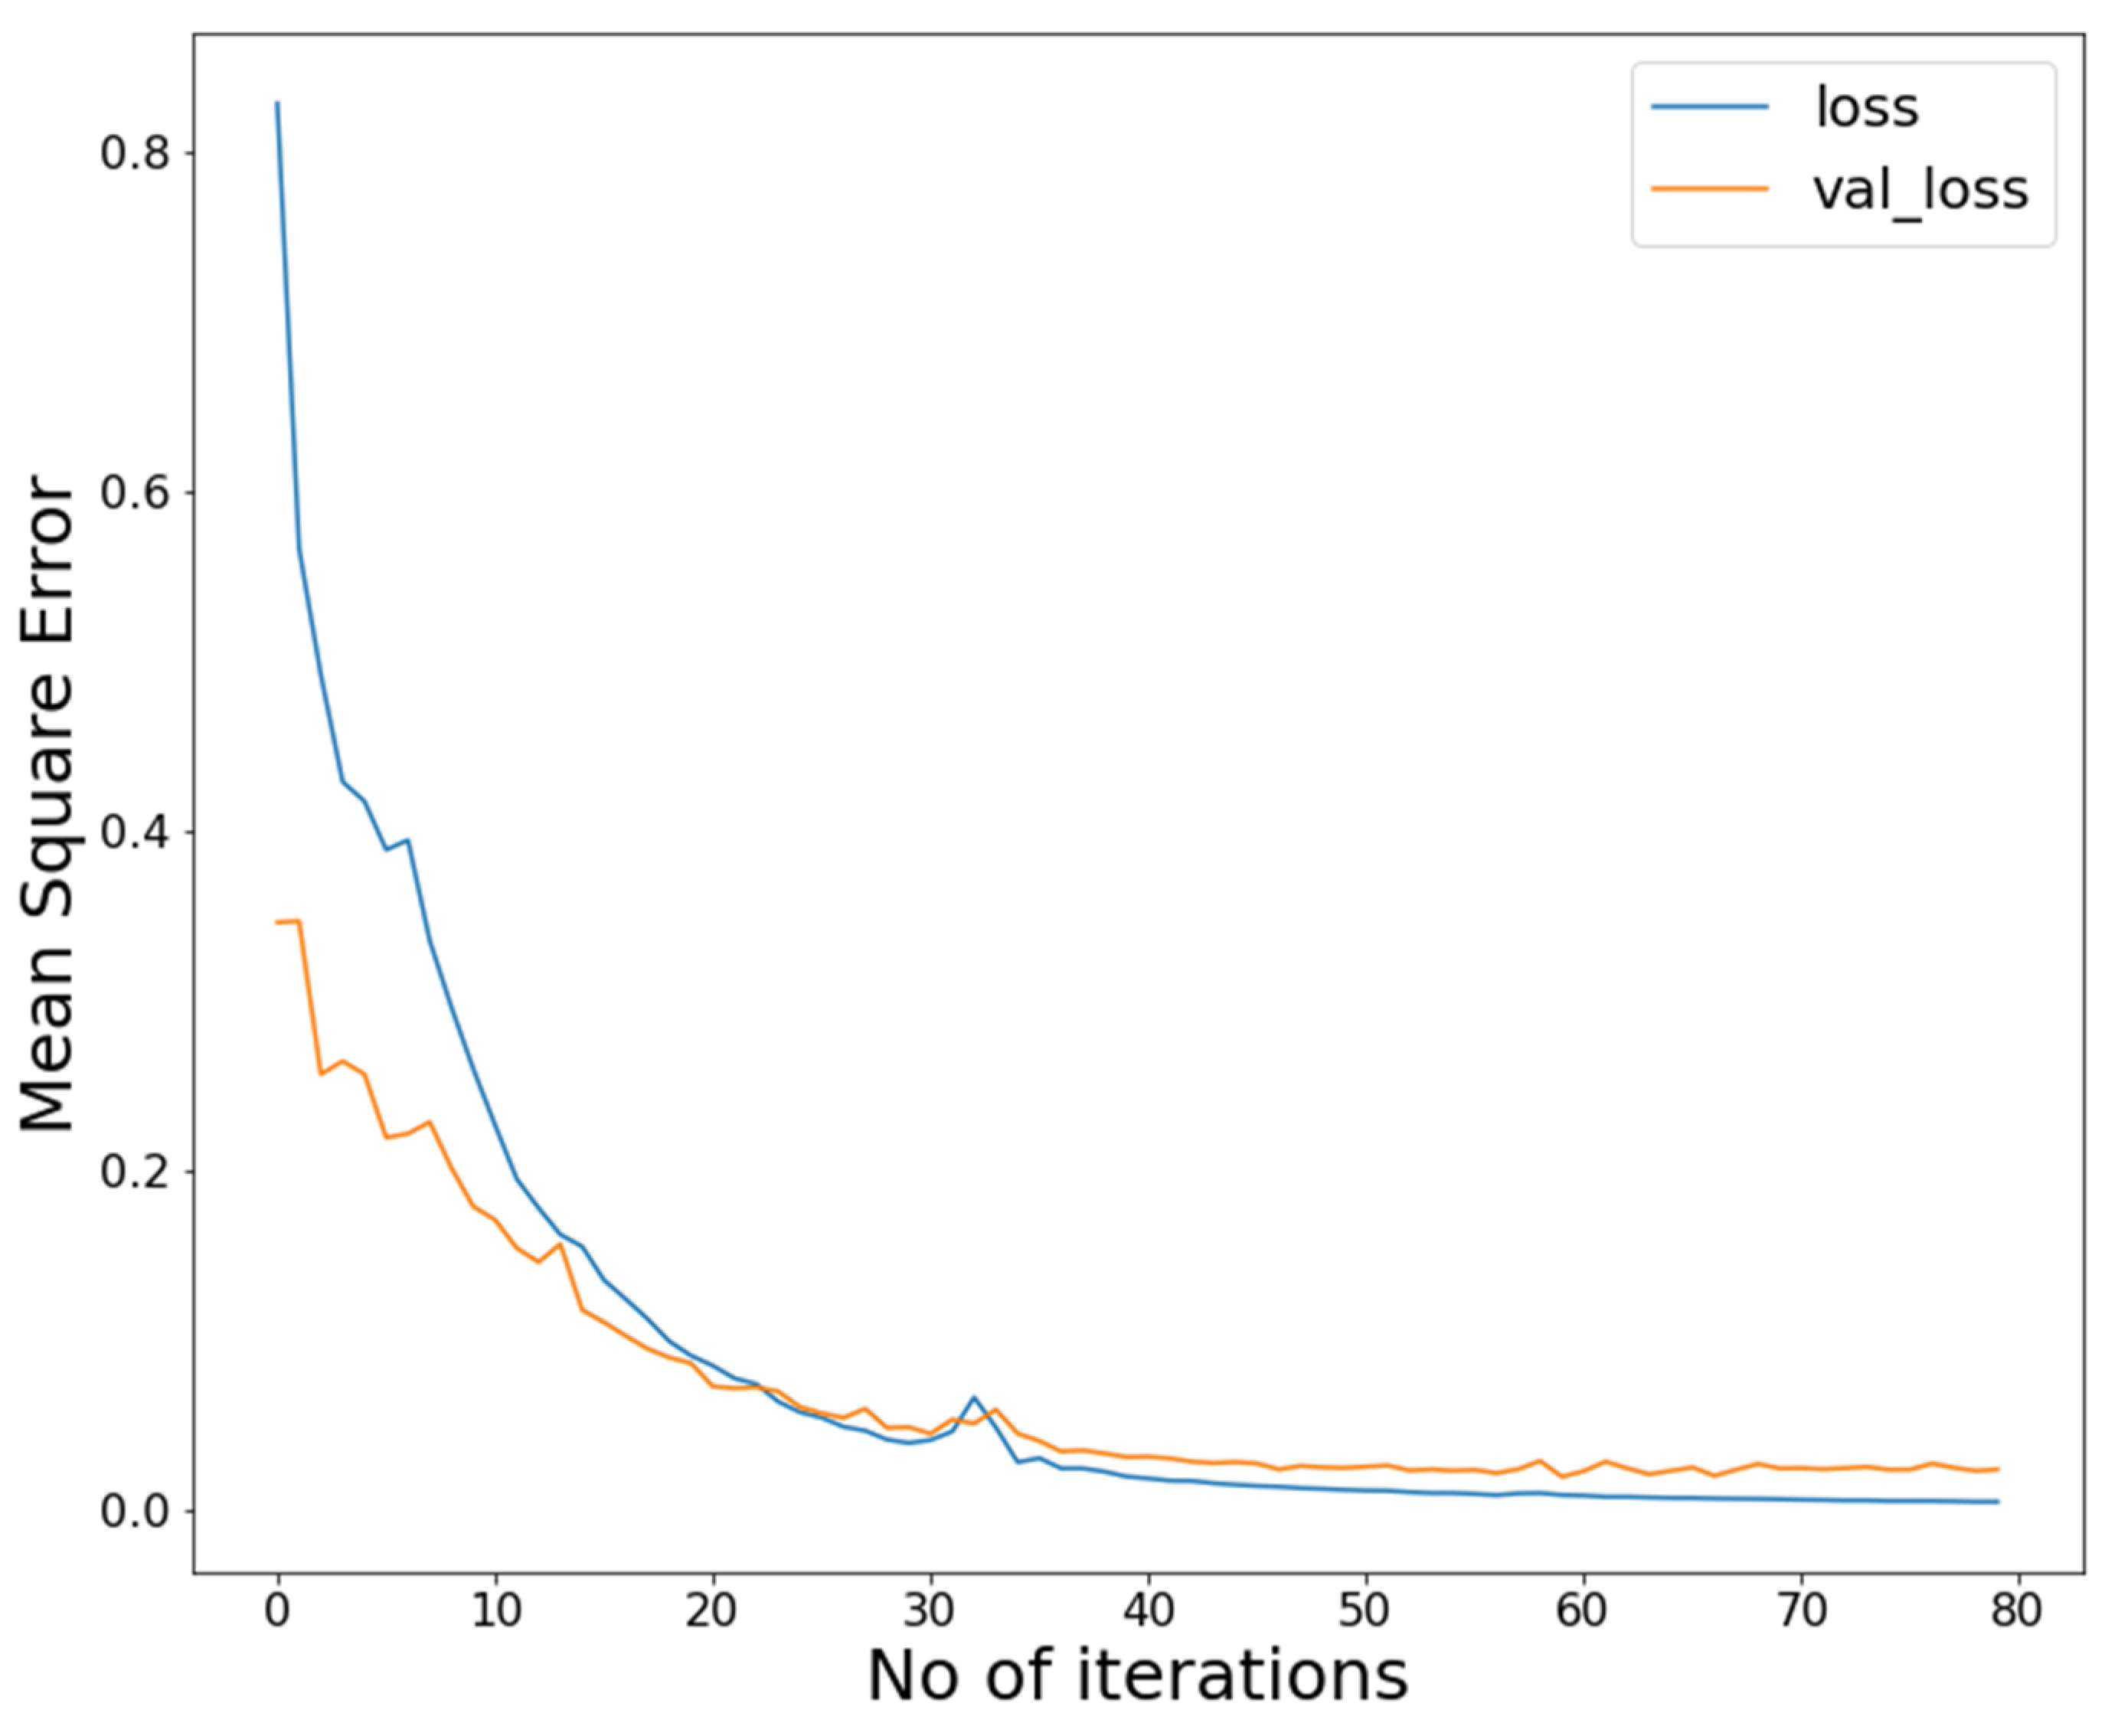
3.2. Training and Developing the Deep Neural Network
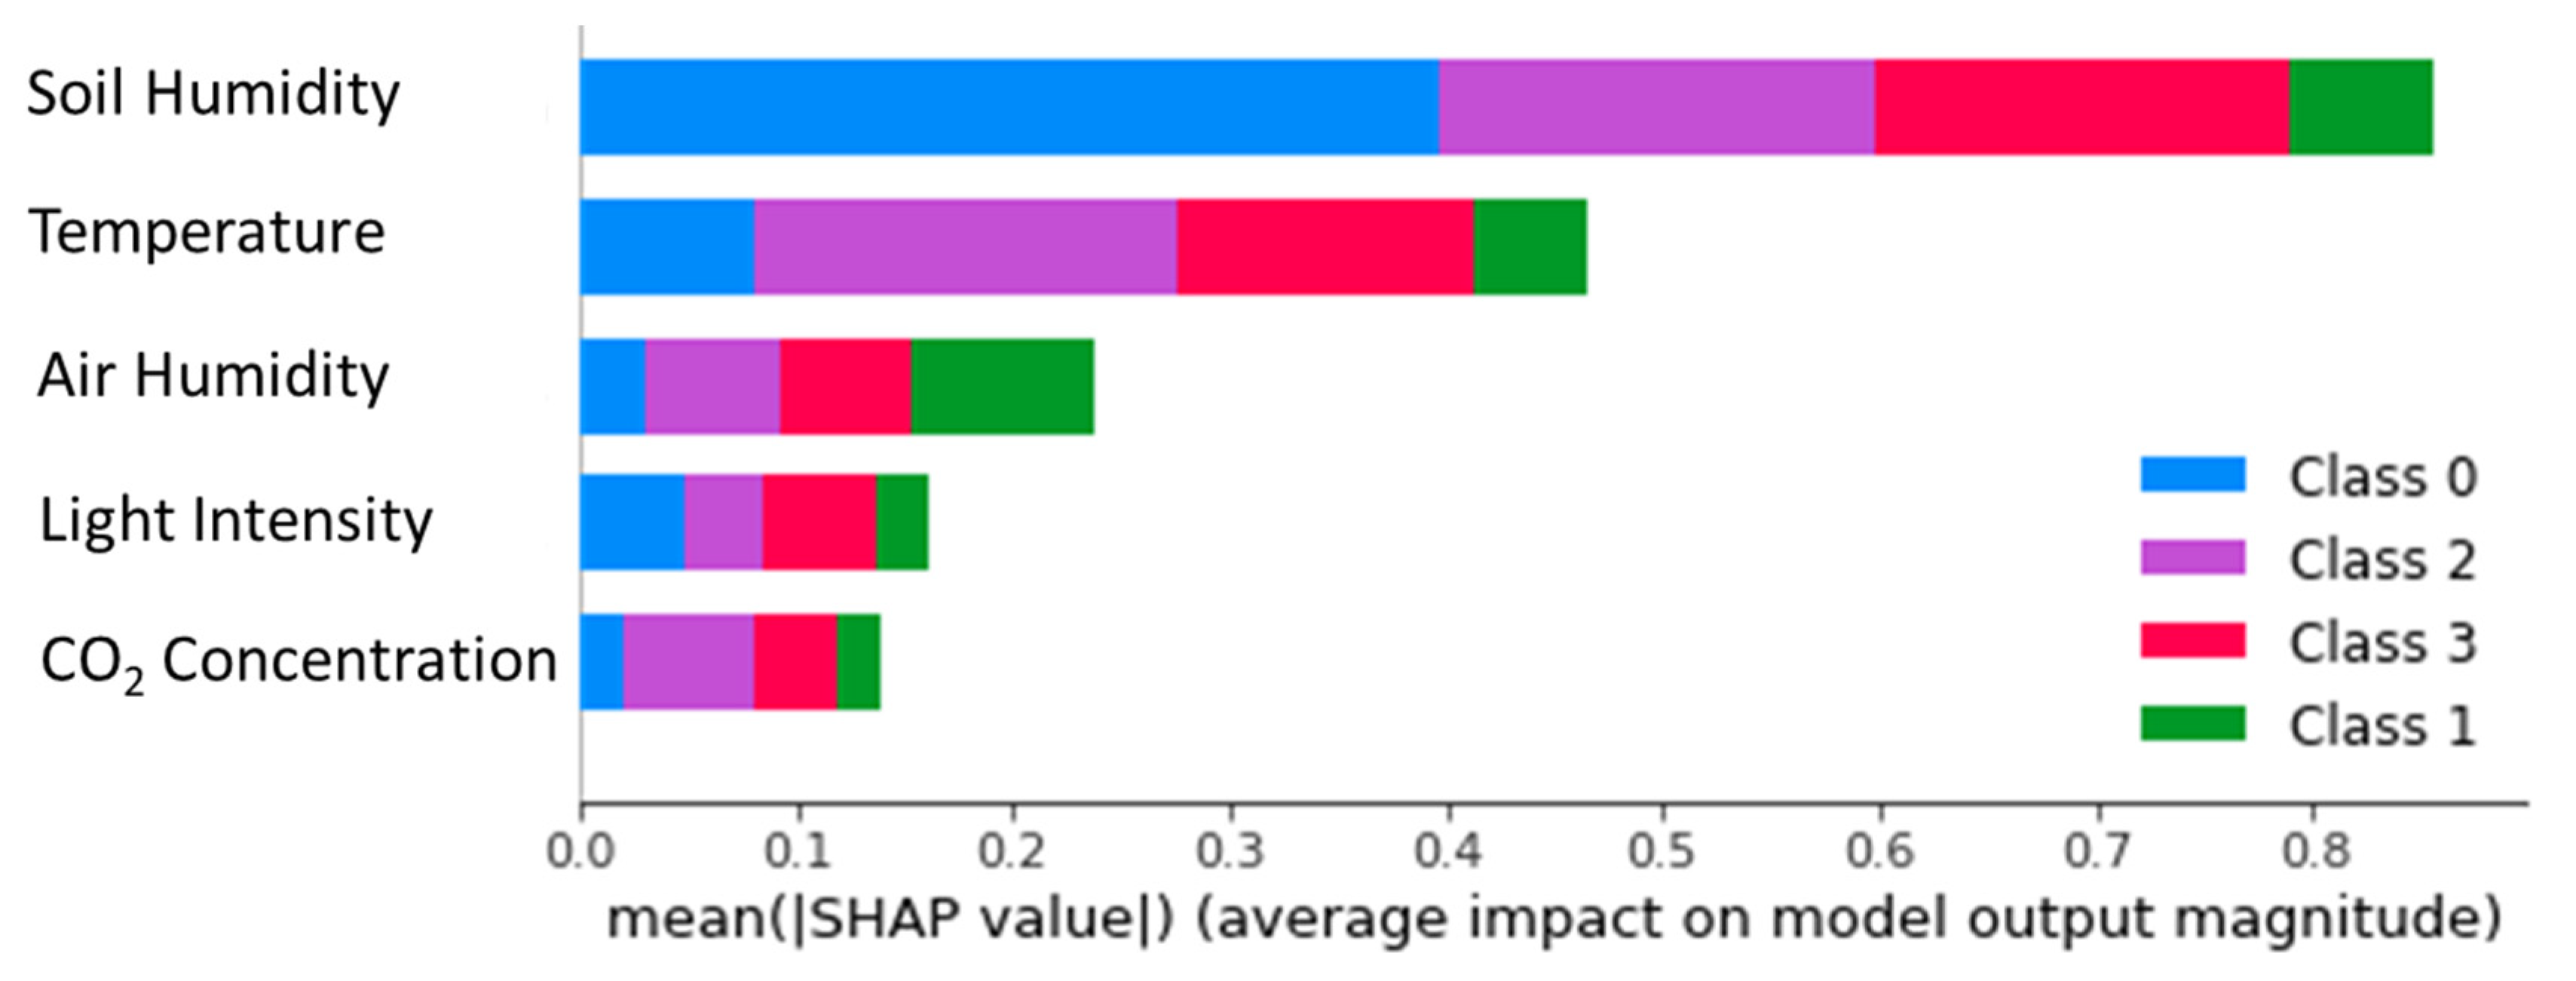
3.3. Sensitivity Analysis
4. Conclusions
- -
- The optimal set of hyper-parameters includes the learning rate (0.000416), the number of hidden layers (10), the number of neurons in each hidden layer (265), the activation function (tanh), batch size (36), Adam decay (0.007963), and number of iterations (80).
- -
- An optimal and highly accurate BO-DNN surrogate model (based on 300 experimental data points) was developed for a quick and reliable classification of the rose yield environment considering the most influential variables including soil humidity, temperature and humidity of air, CO2 concentration, and light intensity (lux) into its architecture.
- -
- The proposed surrogate models can accurately classify the rose yield environments (classified into four classes such as soil without water, correct environment, too hot, and very cold environments).
- -
- The developed model can classify different roses yield environments with an overall accuracy of 0.98. The very high accuracy of the proposed surrogate models originates from the inclusion of the most influential parameters as the inputs of the model.
- -
- This study provides an easy, quick, reliable, and intelligent method to identify and perform corrective measures to improve the quality of the roses. With the proposed method, greenhouse environments can be evaluated and selected for an efficient crop yield of roses and other vegetables and fruits.
Author Contributions
Funding
Institutional Review Board Statement
Informed Consent Statement
Data Availability Statement
Acknowledgments
Conflicts of Interest
References
- Shamshiri, R.; Ismail, W.I.W. A review of greenhouse climate control and automation systems in tropical regions. J. Agric. Sci. Appl. 2013, 2, 176–183. [Google Scholar] [CrossRef]
- Shamshiri, R.R.; Hameed, I.A.; Balasundram, S.K.; Ahmad, D.; Weltzien, C.; Yamin, M. Fundamental research on unmanned aerial vehicles to support precision agriculture in oil palm plantations. In Agricultural Robots—Fundamentals and Application; Intech Open: London, UK, 2018; pp. 91–116. [Google Scholar]
- Jung, D.-H.; Kim, H.S.; Jhin, C.; Kim, H.-J.; Park, S.H. Time-serial analysis of deep neural network models for prediction of climatic conditions inside a greenhouse. Comput. Electron. Agric. 2020, 173, 105402. [Google Scholar] [CrossRef]
- El Ghoumari, M.; Tantau, H.-J.; Serrano, J. Non-linear constrained MPC: Real-time implementation of greenhouse air temperature control. Comput. Electron. Agric. 2005, 49, 345–356. [Google Scholar] [CrossRef]
- Seginer, I.; McClendon, R. Methods for optimal control of the greenhouse environment. Trans. ASAE 1992, 4, 1299–1307. [Google Scholar] [CrossRef]
- Reddy, M.N.; Rao, N. GIS Based Decision Support Systems in Agriculture; National Academy of Agricultural Research Management: Rajendranagar, India, 1995; pp. 1–11.
- Kaiwartya, O.; Abdullah, A.H.; Cao, Y.; Raw, R.S.; Kumar, S.; Lobiyal, D.K.; Isnin, I.F.; Liu, X.; Shah, R.R. T-MQM: Testbed-based multi-metric quality measurement of sensor deployment for precision agriculture—A case study. IEEE Sens. J. 2016, 16, 8649–8664. [Google Scholar] [CrossRef]
- Sarmah, K.; Deka, C.; Sharma, U.; Sarma, R. Role of GIS based technologies in sustainable agriculture resource planning & management using spatial decision support approach. Int. J. Innov. Res. Eng. Manag. 2018, 5, 30–34. [Google Scholar]
- Pawlowski, A.; Sánchez-Molina, J.; Guzmán, J.; Rodríguez, F.; Dormido, S. Evaluation of event-based irrigation system control scheme for tomato crops in greenhouses. Agric. Water Manag. 2017, 183, 16–25. [Google Scholar] [CrossRef]
- Bhat, S.A.; Huang, N.-F. Big Data and AI Revolution in Precision Agriculture: Survey and Challenges. IEEE Access 2021, 9, 110209–110222. [Google Scholar] [CrossRef]
- Sajjad, U.; Hussain, I.; Hamid, K.; Bhat, S.A.; Ali, H.M.; Wang, C.-C. A deep learning method for estimating the boiling heat transfer coefficient of porous surfaces. J. Therm. Anal. Calorim. 2021, 145, 191–1913. [Google Scholar] [CrossRef]
- Hamid, K.; Sajjad, U.; Yang, K.S.; Wu, S.-K.; Wang, C.-C. Assessment of an energy efficient closed loop heat pump dryer for high moisture contents materials: An experimental investigation and AI based modelling. Energy 2022, 238, 121819. [Google Scholar] [CrossRef]
- Asfahan, H.M.; Sajjad, U.; Sultan, M.; Hussain, I.; Hamid, K.; Ali, M.; Wang, C.-C.; Shamshiri, R.R.; Khan, M.U. Artificial intelligence for the prediction of the thermal performance of evaporative cooling systems. Energies 2021, 14, 3946. [Google Scholar] [CrossRef]
- Sajjad, U.; Hussain, I.; Wang, C.-C. A high-fidelity approach to correlate the nucleate pool boiling data of roughened surfaces. Int. J. Multiph. Flow 2021, 142, 103719. [Google Scholar] [CrossRef]
- Nasrollahi, H.; Ahmadi, F.; Ebadollahi, M.; Nobar, S.N.; Amidpour, M. The greenhouse technology in different climate conditions: A comprehensive energy-saving analysis. Sustain. Energy Technol. Assess. 2021, 47, 101455. [Google Scholar]
- Shamshiri, R.R.; Hameed, I.A.; Thorp, K.R.; Balasundram, S.K.; Shafian, S.; Fatemieh, M.; Sultan, M.; Mahns, B.; Samiei, S. Greenhouse Automation Using Wireless Sensors and IoT Instruments Integrated with Artificial Intelligence; InTech Open: London, UK, 2021. [Google Scholar]
- Bheemanahalli, R.; Gajanayake, B.; Lokhande, S.; Singh, K.; Seepaul, R.; Collins, P.; Reddy, K.R. Physiological and pollen-based screening of shrub roses for hot and drought environments. Sci. Hortic. 2021, 282, 110062. [Google Scholar] [CrossRef]
- van Klompenburg, T.; Kassahun, A.; Catal, C. Crop yield prediction using machine learning: A systematic literature review. Comput. Electron. Agric. 2020, 177, 105709. [Google Scholar] [CrossRef]
- Zeng, Y.; Pu, X.; Du, J.; Yang, X.; Li, X.; Mandal, M.; Nabi, S.; Yang, T.; Yang, J. Molecular mechanism of functional ingredients in barley to combat human chronic diseases. Oxid. Med. Cell. Longev. 2020, 2020, 3836172. [Google Scholar] [CrossRef]
- Erazo, M.; Rivas, D.; Pérez, M.; Galarza, O.; Bautista, V.; Huerta, M.; Rojo, J.L. Design and implementation of a wireless sensor network for rose greenhouses monitoring. In Proceedings of the IEEE 2015 6th International Conference on Automation, Robotics and Applications (ICARA), Queenstown, New Zealand, 17–19 February 2015; pp. 256–261. [Google Scholar]
- Plaut, Z.; Zieslin, N. Productivity of greenhouse roses following changes in soil moisture and soil air regimes. Sci. Hortic. 1974, 2, 137–143. [Google Scholar] [CrossRef]
- Shamshiri, R.R.; Jones, J.W.; Thorp, K.R.; Ahmad, D.; Man, H.C.; Taheri, S. Review of optimum temperature, humidity, and vapour pressure deficit for microclimate evaluation and control in greenhouse cultivation of tomato: A review. Int. Agrophys. 2018, 32, 287–302. [Google Scholar] [CrossRef]
- Shamshiri, R.R.; Kalantari, F.; Ting, K.; Thorp, K.R.; Hameed, I.A.; Weltzien, C.; Ahmad, D.; Shad, Z.M. Advances in greenhouse automation and controlled environment agriculture: A transition to plant factories and urban agriculture. Int. J. Agric. Biol. Eng. 2018, 11, 1–22. [Google Scholar] [CrossRef]
- Zhu, N.; Liu, X.; Liu, Z.; Hu, K.; Wang, Y.; Tan, J.; Huang, M.; Zhu, Q.; Ji, X.; Jiang, Y. Deep learning for smart agriculture: Concepts, tools, applications, and opportunities. Int. J. Agric. Biol. Eng. 2018, 11, 32–44. [Google Scholar] [CrossRef]
- Zheng, Y.-Y.; Kong, J.-L.; Jin, X.-B.; Wang, X.-Y.; Su, T.-L.; Zuo, M. CropDeep: The crop vision dataset for deep-learning-based classification and detection in precision agriculture. Sensors 2019, 19, 1058. [Google Scholar] [CrossRef] [PubMed] [Green Version]
- Elavarasan, D.; Vincent, P.D. Crop yield prediction using deep reinforcement learning model for sustainable agrarian applications. IEEE Access 2020, 8, 86886–86901. [Google Scholar] [CrossRef]
- Mohan, P.; Patil, K.K. Deep learning based weighted SOM to forecast weather and crop prediction for agriculture application. Int. J. Intell. Eng. Syst. 2018, 11, 167–176. [Google Scholar] [CrossRef]
- Altikat, S. Prediction of CO2 emission from greenhouse to atmosphere with artificial neural networks and deep learning neural networks. Int. J. Environ. Sci. Technol. 2021, 18, 3169–3178. [Google Scholar] [CrossRef]
- Mekonnen, Y.; Namuduri, S.; Burton, L.; Sarwat, A.; Bhansali, S. Machine learning techniques in wireless sensor network based precision agriculture. J. Electrochem. Soc. 2019, 167, 037522. [Google Scholar] [CrossRef]
- Tay, A.; Lafont, F.; Balmat, J.-F. Forecasting pest risk level in roses greenhouse: Adaptive neuro-fuzzy inference system vs artificial neural networks. Inf. Process. Agric. 2020, 8, 368–397. [Google Scholar] [CrossRef]
- Wilmer Champutiz, P.R.-M.; Fuentes, E.; Peluffo, D. Roses Greenhouse Cultivation Database Repository (RosesGreenhDB). In IEEE Dataport; IEEE: New York, NY, USA, 2019. [Google Scholar]


| Parameter | Data Range |
|---|---|
| Soil humidity (kPa) | 124–821 |
| Light intensity (lux) | 0–54612.5 |
| Temperature (°C) | 15.9–40.2 |
| Air humidity (%) | 39.2–96.9 |
| CO2 concentration (ppm) | 34–243 |
| Environment | Class 0, 1, 2, and 3 |
| Hyper Parameter | Investigated Range |
|---|---|
| Learning rate | 0.0001–0.1 |
| Adam decay | 0.000001–0.01 |
| Input nodes | 1–5 |
| Dense layers | 1–10 |
| Dense nodes | 1–500 |
| Batch size | 1–100 |
| Activation function | Softmax, Sigmoid, ReLU, tanh |
| Optimization Method | Gaussian Process |
|---|---|
| Learning rate | 0.000416 |
| No. of hidden layers | 10 |
| No. of neurons in input layer | 5 |
| No. of neurons in each hidden layer | 265 |
| Activation function | tanh |
| Batch size | 36 |
| Adam decay | 0.007963 |
| No. of neurons in output layer | 4 |
| No. of iterations | 80 |
| Precision | Recall | F1-Score | |
|---|---|---|---|
| 0 | 1.00 | 1.00 | 1.00 |
| 1 | 0.80 | 1.00 | 0.89 |
| 2 | 1.00 | 1.00 | 1.00 |
| 3 | 1.00 | 0.94 | 0.97 |
| Accuracy | 0.98 | ||
| Macro Avg. | 0.95 | 0.98 | 0.96 |
| Weighted Avg. | 0.99 | 0.98 | 0.98 |
| Model No. | Input Features | Confusion Heat Map | Overall Accuracy |
|---|---|---|---|
| 1 | soil humidity light intensity temperature air humidity CO2 concentration | 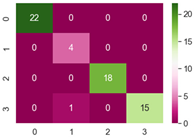 | 0.98 |
| 2 | light intensity temperature air humidity CO2 concentration |  | 0.98 |
| 3 | soil humidity temperature air humidity CO2 concentration |  | 0.98 |
| 4 | soil humidity light intensity air humidity CO2 concentration | 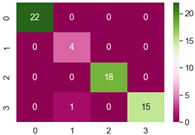 | 0.98 |
| 5 | soil humidity light intensity temperature CO2 concentration | 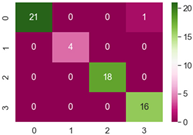 | 0.98 |
| 6 | soil humidity light intensity temperature air humidity | 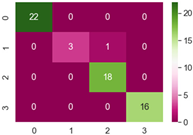 | 0.98 |
Publisher’s Note: MDPI stays neutral with regard to jurisdictional claims in published maps and institutional affiliations. |
© 2021 by the authors. Licensee MDPI, Basel, Switzerland. This article is an open access article distributed under the terms and conditions of the Creative Commons Attribution (CC BY) license (https://creativecommons.org/licenses/by/4.0/).
Share and Cite
Bhat, S.A.; Huang, N.-F.; Hussain, I.; Bibi, F.; Sajjad, U.; Sultan, M.; Alsubaie, A.S.; Mahmoud, K.H. On the Classification of a Greenhouse Environment for a Rose Crop Based on AI-Based Surrogate Models. Sustainability 2021, 13, 12166. https://doi.org/10.3390/su132112166
Bhat SA, Huang N-F, Hussain I, Bibi F, Sajjad U, Sultan M, Alsubaie AS, Mahmoud KH. On the Classification of a Greenhouse Environment for a Rose Crop Based on AI-Based Surrogate Models. Sustainability. 2021; 13(21):12166. https://doi.org/10.3390/su132112166
Chicago/Turabian StyleBhat, Showkat Ahmad, Nen-Fu Huang, Imtiyaz Hussain, Farzana Bibi, Uzair Sajjad, Muhammad Sultan, Abdullah Saad Alsubaie, and Khaled H. Mahmoud. 2021. "On the Classification of a Greenhouse Environment for a Rose Crop Based on AI-Based Surrogate Models" Sustainability 13, no. 21: 12166. https://doi.org/10.3390/su132112166
APA StyleBhat, S. A., Huang, N.-F., Hussain, I., Bibi, F., Sajjad, U., Sultan, M., Alsubaie, A. S., & Mahmoud, K. H. (2021). On the Classification of a Greenhouse Environment for a Rose Crop Based on AI-Based Surrogate Models. Sustainability, 13(21), 12166. https://doi.org/10.3390/su132112166