Abstract
The Yangtze River Economic Belt (YREB) is an important part of China’s “two screens and three belts” strategic ecological security barrier, and the urban agglomeration along the YREB is the core of its economic development. However, it has suffered the most from frequent and severe flood disasters that were affected by torrential rains, urbanization, and human activities, with climate change intensifying the potential occurrence of flood disasters in this area. Based on the CMIP6 climate data, this study constructed a flood risk assessment index system and assessed the temporal and spatial changes of the flood risk in the YREB during 2020–2050 under four shared socioeconomic pathways (SSP) scenarios, including SSP126, SSP245, SSP370, and SSP585. From the perspective of temporal change, the results showed that at the grid level, the area of middle-low risk (0.55 < R ≤ 0.65) accounted for 60% of the total area of the YREB and area of high-risk (R > 0.85) fluctuated first and then decreased under the four scenarios, with the area of high-risk being largest in the future under the SSP585 scenario. Specifically, at the city level, around half of the cities in the YREB had faced high flood risk and the risk showed an increasing trend during 2020–2050 under the SSP370 scenario. From the perspective of spatial change, the flood risk of the YREB presented a spatial pattern of low in the west and high in the east, with high risk mainly concentrated in the cities in the lower reaches of the YREB and also Chongqing and Sichuan. Compared with SSP126 and SSP245 scenarios, it showed that high-risk areas were larger under high emission scenarios SSP370 and SSP585, which were mostly concentrated in middle and lower reaches of the YREB and the cities of Chongqing and Chengdu during 2020–2050. Especially, flood risk showed an increasing trend in the middle and lower reaches of the YREB during 2020–2050, and the regions with high vulnerability would have greater socio-economic losses. The finding would provide scientific support for resilience improvement, risk reduction and management, and formulating policies to achieve green and sustainable development in the YREB.
1. Introduction
Climate change has a serious impact on the water cycle process, and the risk of flood disasters has become a major challenge affecting global security and sustainable development [1]. The Fifth Assessment Report of the Intergovernmental Panel on Climate Change (IPCC) firstly analyzed the impact of climate change on floods and other disaster events. It found that increased precipitation intensity and variability would increase the risk of floods and droughts, and some ecosystems and many human systems had significant vulnerability and exposure to extreme weather events [2]. In addition, flood disaster has caused billions of dollars economic losses and affected thousands of people every year globally [3]. Climate change would cause variation in the water cycle and intensify uneven distribution of precipitation, which may further aggravate extreme events and hinder the sustainable development of society and economy [4]. Asia has become a region with high frequency of floods and storm surges. Drought, storm surges, and floods have become the three major flood disasters threatening socio-economic development in China [5]. Therefore, scientific assessment of flood risk under future climate change has great significance for mitigating disasters, reducing socio-economic losses, and promoting regional sustainable development.
As the process of urbanization accelerates and the global population grows, assessing the flood risk of cities and urban agglomerations in a changing environment is conducive to disaster adaption and management. The application of shared socioeconomic pathways (SSP) and representative concentration pathway (RCP) scenarios in climate change analysis and disaster risk assessment can help provide possible mitigation and response strategies. Most scientific assessments for disaster risk are based on climate change scenarios and emission scenarios [6,7,8]. These scenarios have been developed in the field of natural hazard assessment or physical changes in the climate system. However, it lacks consideration of socio-economic development scenarios, especially in terms of vulnerability and adaptability. The SSPs have addressed the challenges of adaption and been closely linked to climate change, vulnerability, adaption, and disaster risk [9]. Thus, the SSP and RCP scenarios can be combined together for the future assessment of hazard and vulnerability. The Coupled Model Intercomparison Project (CMIP) has released climatic data under different climate models, and flood risk assessment based on the CMIP data has become a hot topic [10]. CMIP6 constructed a rectangular framework for SSP and RCP, which is better than CMIP5 in accuracy statistics and reduces the error between precipitation and temperature [11]. Apurv et al. (2015) analyzed the impact of climate change on floods in the Yarlung Zangbo Basin based on the CMIP5 model data and found that the increase in the frequency and intensity of precipitation caused by climate change may further increase the peak flood disaster and the total flood volume [12]. Most studies have assessed the risks of storms, floods, droughts, and high temperature disasters under climate change based on the CMIP5 data. While, there are very few studies focused on assessment of disaster risk with CMIP6 data. In addition, for China, the data of population and GDP for vulnerability assessment that considered the impact of the fertility policy were less combined with the CIMP6 data for disaster risk assessment.
Flood risk is the combination of the probability of extreme weather events and the potential adverse consequences. It mainly depends on hazard and vulnerability, where vulnerability is a function of exposure, sensitivity, and capacity [13,14,15]. Therefore, assessment of urban flood risk in a changing environment should consider the spatial and temporal interdependencies among hazards and vulnerability. For example, Weerasinghe et al. (2018) comprehensively evaluated the flood risk in Sri Lanka by considering the exposure and vulnerability indexes from the three aspects of society, economy, and housing [16]. In addition, the development of numerical models has provided a means to assess disaster risk due to extreme climate change. The research on flood risk assessment, simulation, and prediction commonly estimates the hazard component from climatic projections of atmospheric variables, which are then used to estimate the future disaster risk through hydrological models and statistical analysis [17,18]. At present, there are various methods for disaster risk assessment, including historical disaster mathematical statistics analysis [19,20], fuzzy environmental risk assessment [21,22], fuzzy data envelopment analysis [23], fuzzy SSP scenario analysis [24], Strength, Weakness, Opportunity, and Strategies (SWOT) models [25], machine learning models (MLMs) [26,27], multi-criteria decision analysis (MCDA) [28,29,30], and artificial intelligence [31]. Ntajal et al. (2017) assessed the flood risk in different areas based on a risk assessment model that combined indicator analysis and GIS technology [32]. Some studies have combined environmental data based on remote sensing, machine learning, and GIS technology to improve accuracy and reduce the uncertainty of flood risk assessment [33]. Among these methods, fuzzy approaches deal with the fuzzy logic and have an advantage in complex uncertainty problem-solving and analysis in disaster risk assessment. Fuzzy analytic hierarchy process (FAHP) is a method which can deal with uncertainties of decision problems and have an advantage in objective and quantitative assessment [34].
The Yangtze River Economic Belt (YREB) is one of flood-prone areas in China, where flood disasters have attracted much attention. However, the changes of flood risk under future climate change are not clear in the YREB. Therefore, taking the YREB as the research object, this study aims to assess flood risk during 2020–2050 under different SSP-RCP scenarios from the perspectives of hazard and vulnerability using the FAHP. Firstly, this study constructed the assessment index and model of flood risk from perspectives of hazard and vulnerability. Then, indicators for the risk assessment were processed, for example, climatic indexes were calculated based on CMIP6 data and the data of population and GDP were processed with consideration of the impact of China’s fertility policy referring to the study of Jing et al. (2019) [35]. Finally, the spatiotemporal changes of flood risk in the YREB during 2020–2050 under the four scenarios of SSP126, SSP245, SSP370, and SSP585 were assessed and analyzed.
2. Materials and Methods
2.1. Study Area
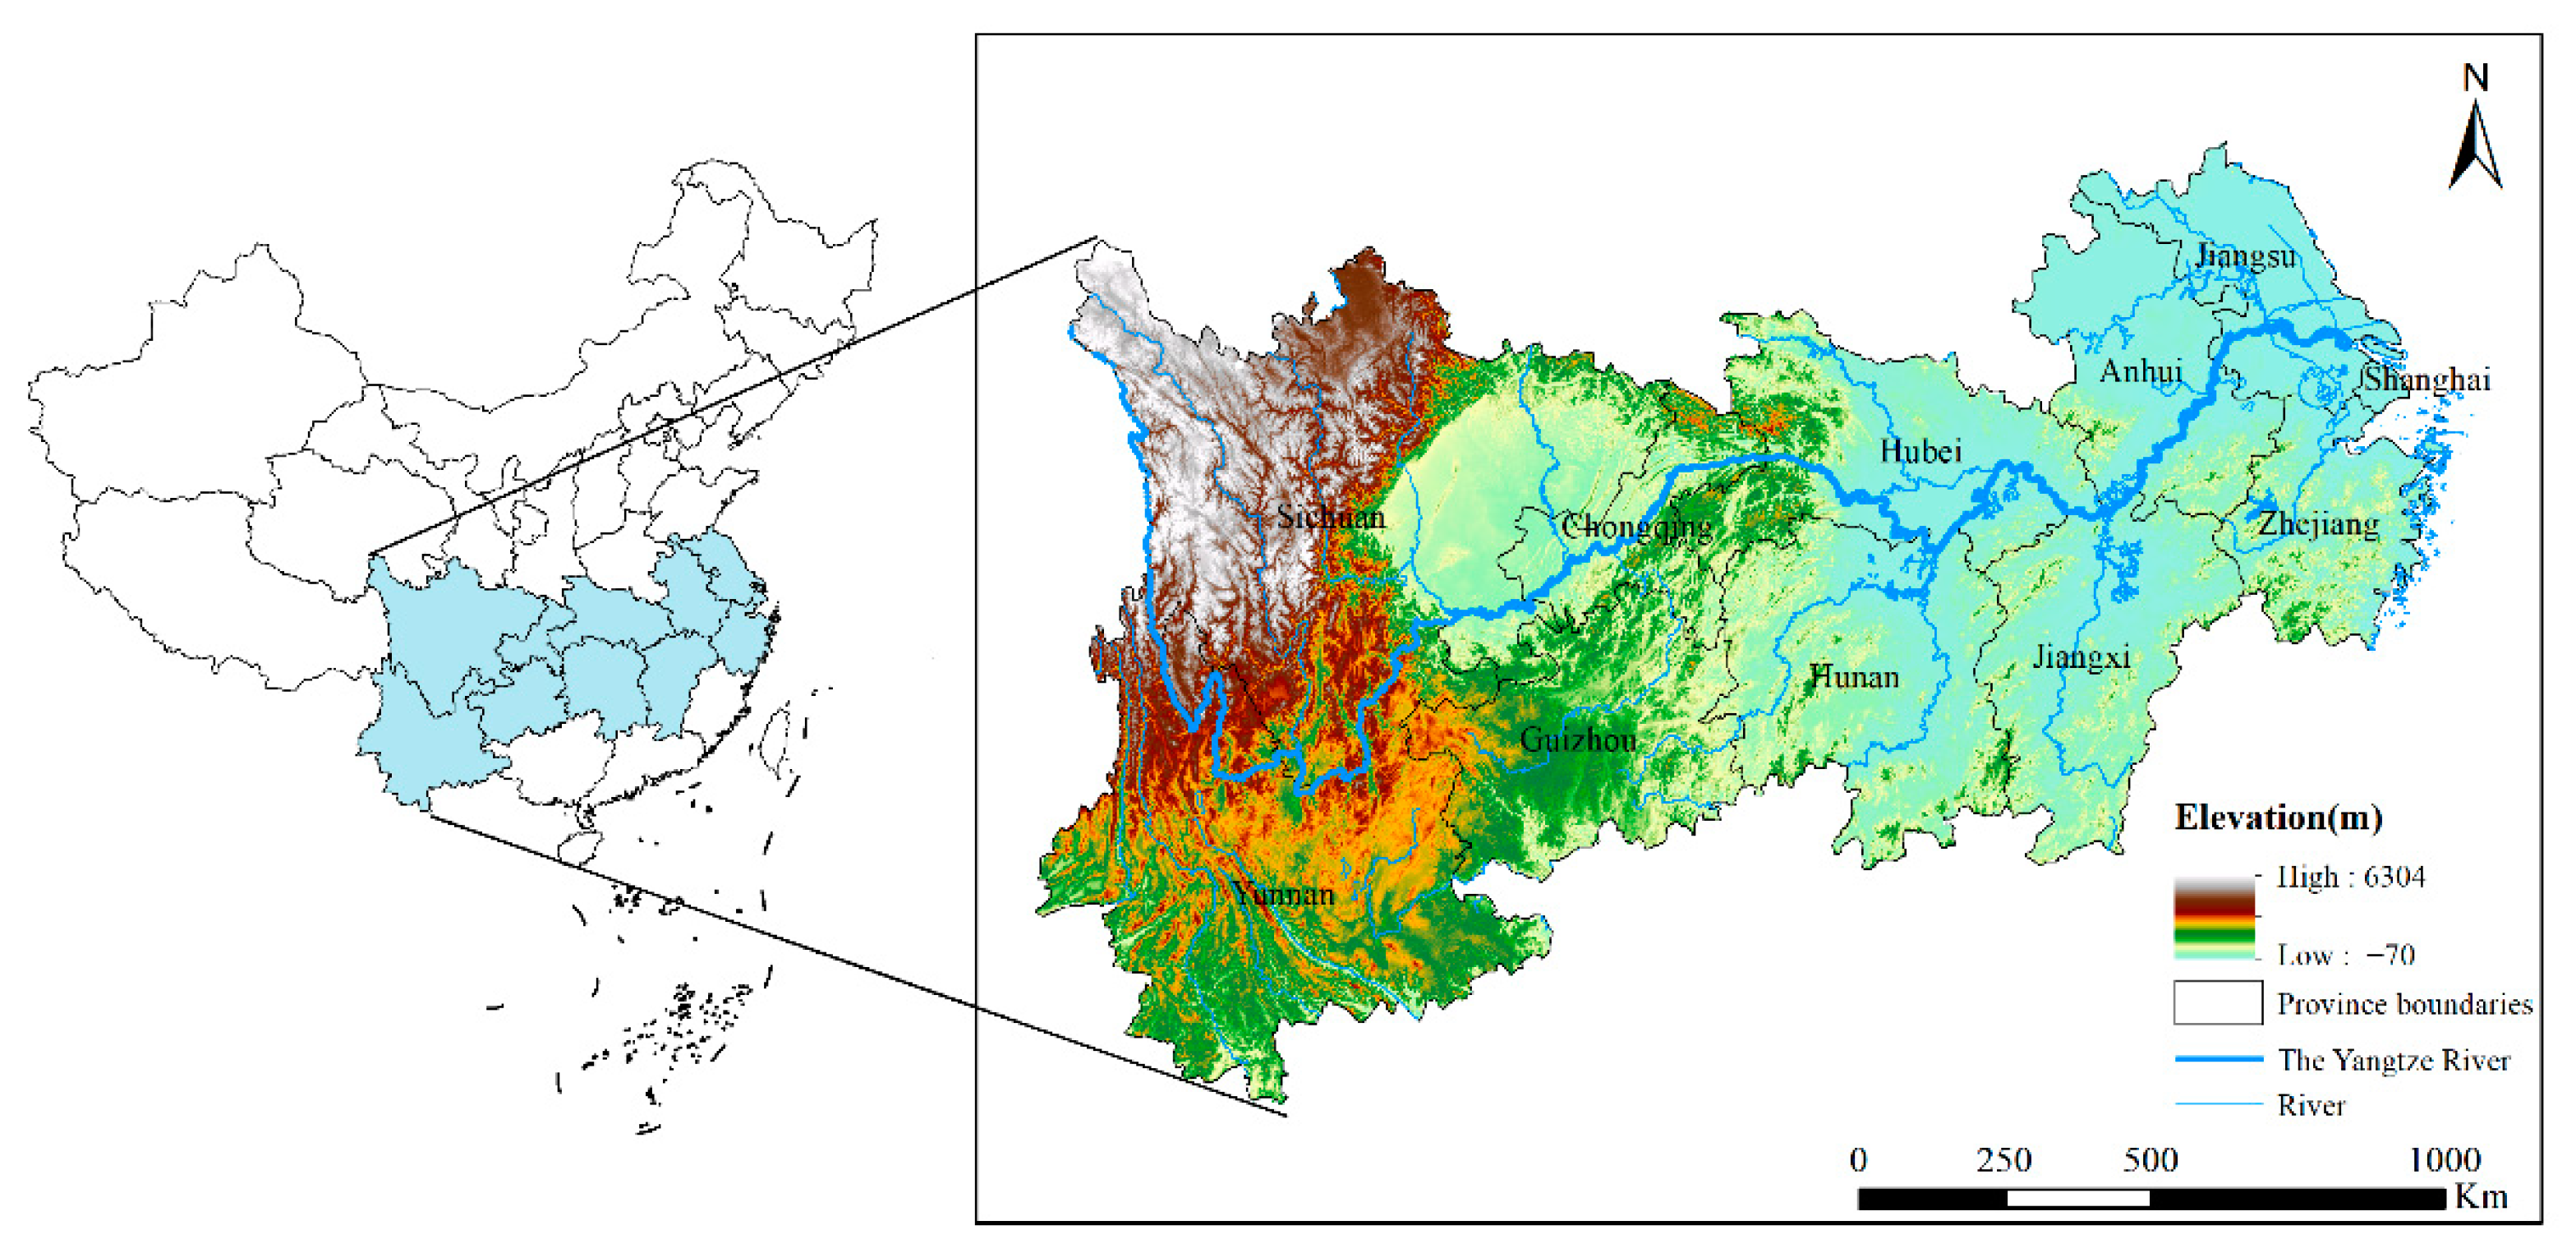
The YREB is an important region for agricultural production, as well as a strategic development zone for economic growth with a dense population in China (Figure 1). It includes nine provinces (Sichuan, Yunnan, Guizhou, Hunan, Hubei, Jiangxi, Anhui, Jiangsu, and Zhejiang) and two municipalities (Shanghai and Chongqing). It also has three national level urban agglomerations, including the Yangtze River Delta urban agglomerations, the Yangtze River Middle Reaches urban agglomerations, and the Chengdu-Chongqing urban agglomeration. In 2015, the gross domestic product (GDP) of the YREB was USD 4.12 trillion and the size of its population was approximately 6.16 billion, which accounted for 42.3% of China’s GDP and 40% of China’s population. The annual average precipitation is 1100mm and the precipitation variability is large. More than 50% of the precipitation in this area occurs from June to August. Most areas of the YREB are low-lying, thus the dense water network coupled with the influence of the monsoon, can easily cause flood disasters. Thus, the YREB had suffered from high frequency of flood disasters. It had several catastrophic floods in 1931, 1949, 1954, 1991, and 1998 [36]. For instance, the Taihu Lake Basin was hit by heavy rains, which caused severe floods in two provinces and one city (Jiangsu, Zhejiang and Shanghai) surrounding the Taihu Lake from June to July in 1991. In addition, the winter snow cover area of the Qinghai-Tibet Plateau in 2019–2020 was significantly more than that of the previous year, which indirectly led to the strengthening of convective activities in the middle and lower reaches of the YREB in China with more precipitation. It resulted in more flood disasters and led to secondary disasters such as mudslides and landslides also happened frequently. The floods in 2020 affected 63.46 million people and caused a direct economic loss of RMB 178.96 billion in the YREB. Therefore, assessing flood risk under climate change has significance for socio-economic development in YREB.
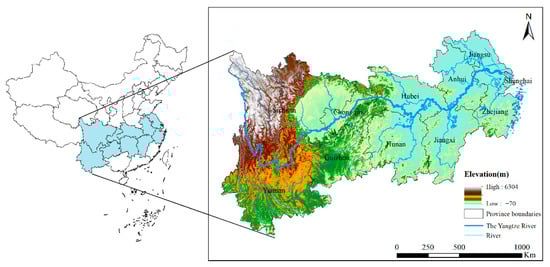
Figure 1.
Geographical location of the Yangtze River Economic Belt.
2.2. Data
2.2.1. Index System for Water-Disaster Risk Assessment
Natural disaster risk is formed under the joint action mechanism of hazard and the vulnerability of the disaster bearer. Thus, this study constructed the index system for flood risk from the perspectives of hazard and vulnerability (Table 1). Hazard refers to the frequency and severity of damage or threats to people, property, systems, or functions. Climate change has increased the frequency and intensity of extreme events, which are generally measured by extreme precipitation. According to 27 extreme event indicators defined by the World Meteorological Organization, the study selected maximum consecutive five-day precipitation (RX5D) and number of days with precipitation of more than 20 mm (R20) to indicate the intensity and duration of precipitation annually [37]. The study also considered the impact of the terrain environment in the YREB, and selected indicators of the relief ratio and river density. Vulnerability was the degree of injury or damage caused by potential hazards to all properties in the region. The bearers of flood disasters are generally population, buildings, farmland, etc. Therefore, population density, economic density, and the proportion of farmland were selected as indicators to a construct flood risk assessment index system under climate change. Based on the triangular fuzzy analytic hierarchy (AHP) process, the weights of each indicator in the index system were determined.

Table 1.
Flood risk assessment index system under SSP-RCP scenarios.
2.2.2. Data Sources
In this study, the data of the seven indicators that were selected to assess the flood risk in the YREB are shown in Table 2. The indicator of RX5D and R20 represented the frequency and intensity of extreme events. The RX5D and R20 of year 2020–2050 were calculated based on the daily precipitation data, which was obtained from the CMIP6 database. Relief ratio was calculated based on digital elevation model (DEM), which was derived from the Geospatial Data Cloud site, Computer Network Information Centre, Chinese Academy of Sciences. River density was determined by river systems in the YREB, which were collected from the Gaode’s product center. In addition, vulnerability was determined with population density, economic density, and the proportion of farmland. The fertility policy has affected population growth and economic development. Therefore, the data of population and GDP of years 2020–2050 were calculated based on the impact of China’s fertility policy referring to the study of Jing et al. (2019) [35]. The proportion of farmland was determined by land use data, which was collected from the Data Center for Resources and Environmental Sciences, Chinese Academy of Sciences.
Table 2.
Input data for flood risk assessment.
2.3. Methods
2.3.1. CMIP6 SSP-RCP Scenarios
In order to assess the relationship between socio-economic development and climate change, IPCC has successively developed Scenario A, IS92, SRES, and RCP scenarios. Based on different SSP and the latest trends in anthropogenic carbon emissions, CMIP6 proposed a new projection scenario, namely a rectangular combination of different SSPs and RCPs. An SSP scenario is the future development of society without climate change or climate policy. SSP1 to SSP5 represent the five different development routes for societal trends, i.e., sustainable development, middle of the road developments, global fragmentation, strong inequality and rapid economic growth based on a fossil-fuel intensive energy system. Combined with the RCP scenarios, the following scenarios were selected, including SSP585, SSP370, SSP245, and SSP126 (Table 3). SSP585 is the updated RCP8.5 scenario. SSP5 is the only pathway that can achieve anthropogenic radiation of 8.5 W/m2 in 2100. SSP370 is the new radiative forcing scenario and represents a high social vulnerability and relatively high anthropogenic radiative forcing scenario, which is very important for research on climate change impacts, mitigation, and adaptation. SSP245 is the updated RCP4.5 scenario and represents a combination of moderate social vulnerability and moderate shooting force. SSP126 is the updated RCP2.6 scenario and represents the combined effects of low vulnerability, low mitigation pressure, and low radiative forcing.
Table 3.
Descriptions of SSP-RCP scenarios.
In the simulation model performance of inter-annual variability, the performance of GFDL-CM4 and EC-Earth3 in the CMIP6 model is better than other models. Compared with the CMIP5 model, the CMIP6 model can better simulate the climate average state and trend change characteristics of the extreme precipitation index and has a higher correlation coefficient with the observation [38]. In addition, the multi-model ensemble average is generally better than a single model in simulating extreme precipitation. Therefore, this study selected seven climate models of CESM2, CESM2-WACCM, EC-Earth3-Veg, GFDL-CM4, GFDL-ESM4, MPI-ESM1-2-HR, and EC-Earth3 (2020–2050), and constructed a multi-model ensemble average to derive the precipitation in the YREB.
2.3.2. Flood Risk Assessment Model
In this study, hazard and vulnerability are the major components of flood risk. Therefore, the flood risk (R) can be expressed by Equation (1):
where R is the flood risk, H is the hazard indicator, V is the vulnerability indicator.
The hazard and vulnerability indexes were quantified by specific metrics. Hazard index can be defined by Equation (2):
where are indicators for hazard, including maximum consecutive five-day precipitation, number of days with precipitation of more than 20 mm, relief ratio, and river density; are the weights of the indicators that calculated based on triangular fuzzy AHP.
In addition, vulnerability index can be expressed by Equation (3):
where are indicators for vulnerability, including population density, economy density, and the proportion of farmland; are the weights of the indicators that are calculated based on triangular fuzzy AHP.
Therefore, flood risk index can be expressed by Equation (4):
where and are the weights of the hazard index and vulnerability index. Hazard and vulnerability are two important factors of flood risk, thus, = = 0.5. To ensure the calculation results are comparable and standard, all the indicators for flood risk assessment were standardized using the minimum-to-maximum standardization method, and the values of the risk ranges from 0 to 1.
2.3.3. Frequency Statistics Analysis
In this study, frequency statistics of flood risk of cities were used to analyze the changes in the number of cities that appear in different risk intervals. Frequency statistical analysis can help determine the number and distribution of cities in different risk intervals. It can also show the concentration and difference of flood risk in different time periods. To get the frequency of the flood risk, we firstly broke the risk values of 0–1 into 10 intervals, with 0.1 as the interval range. Then, the number of cities that appear in different risk intervals was counted. Finally, the graph of frequency statistics of flood risk of cities in the YREB was formed to investigate the changes in urban flood risk in different periods.
3. Results
3.1. The Temporal Changes of Flood Risk in the YREB during 2020–2050
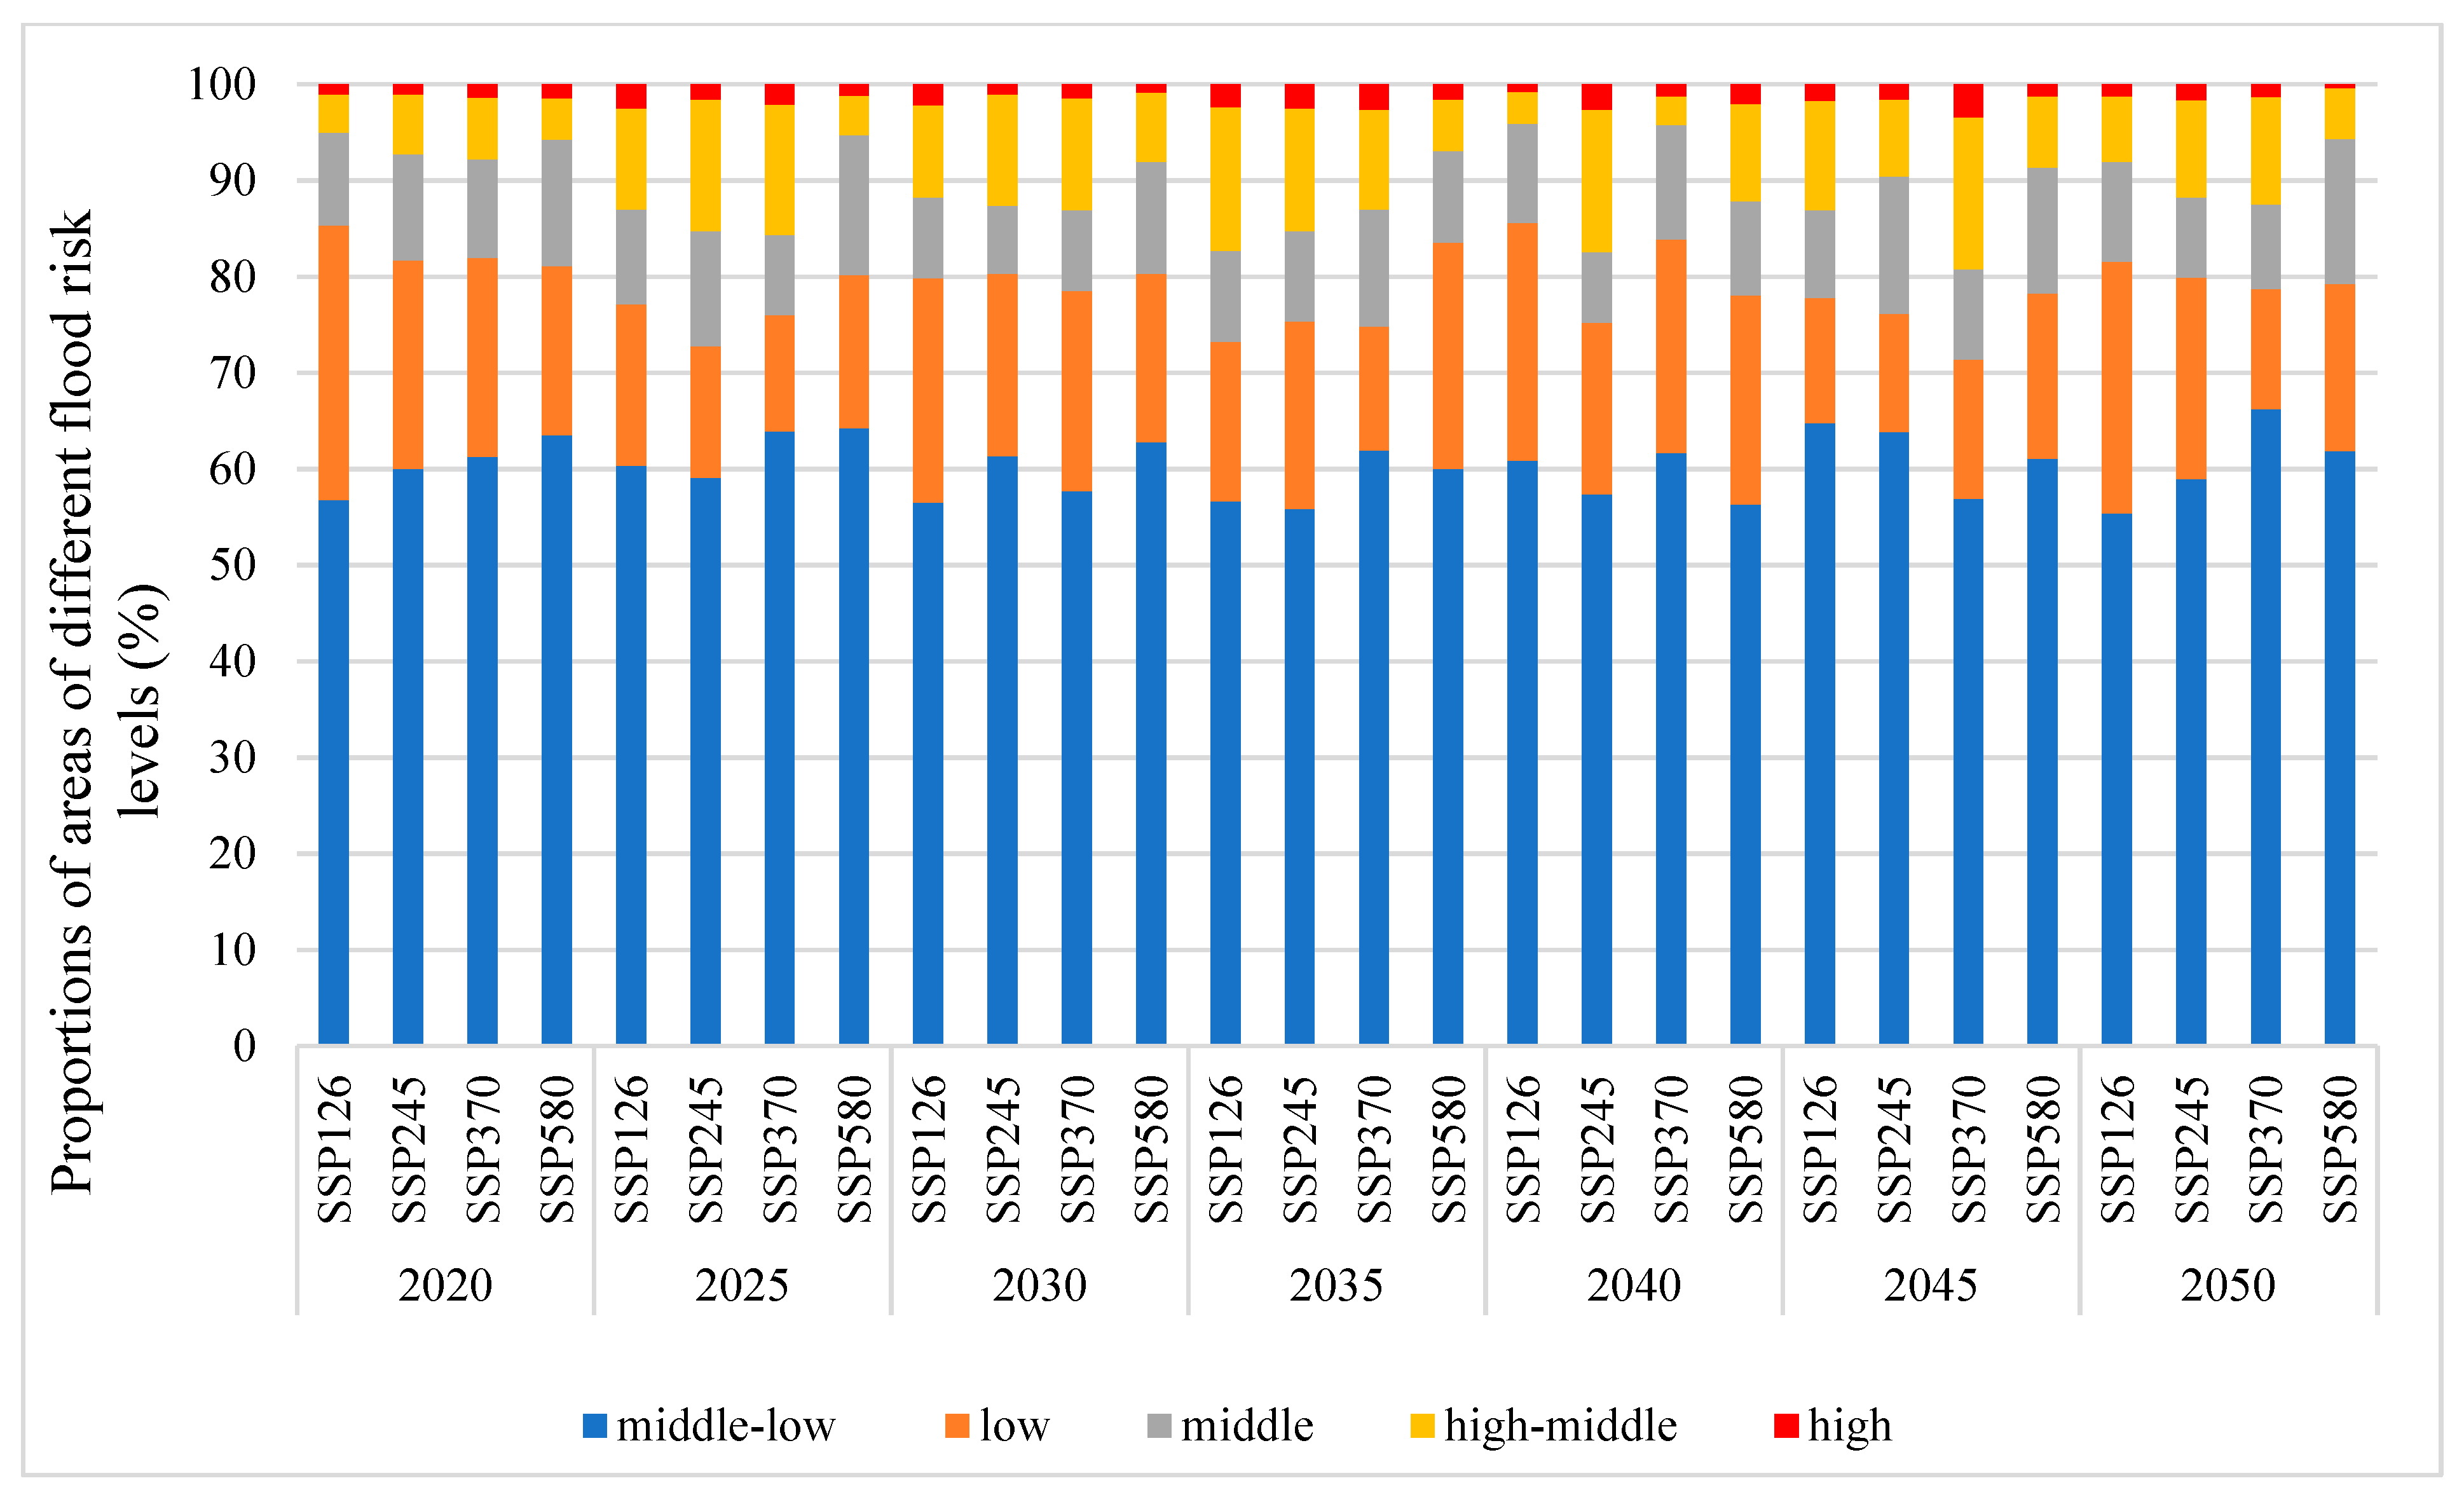
In this study, the flood risk in the YREB was assessed under different SSP-RCP scenarios during 2020–2050 and the risk was divided into five levels, namely high risk (R > 0.85), high-middle risk (0.75 < R ≤ 0.85), middle risk (0.65 < R ≤ 0.75), middle-low risk (0.55 < R ≤ 0.65), and low risk (R ≤ 0.55). The evolution characteristics of the proportion of areas of different risk levels in the YREB under different scenarios were analyzed (Figure 2). It showed that, at the grid level, the area of middle-low risk accounted for the most, with around 60% of the total area of the YREB, meaning that most areas faced potential flood risk. The high-risk area of flood disasters in the YREB had different characteristics under different scenarios. The area of high-risk fluctuated first and then decreased under all scenarios. Under the SSP126 scenario, the high-middle risk areas would be relatively high from 2020 to 2035. The dependence on fossil energy and population growth would be slow, and the risk of flood disasters could be reduced after 2035 under the SSP126 scenario. Under the SSP370 scenario, which is highly dependent on fossil energy, the population will grow rapidly, and the risk of flood disasters will increase. In 2045, the area with high risk of flood disasters could be three times that under the SSP126 scenario. Compared to the SSP126, SSP245, and SSP370 scenarios, the risk of flood disasters in the YREB under SSP585 showed an increasing trend. In 2040, the areas of high-risk flood disasters in SSP370 and SSP126 scenarios were both at a relatively low level. However, the area of high-risk flood disaster in the SSP585 scenario reached 2.09%, which was 1.66 and 2.55 times that of the SSP370 and SSP126 scenarios, respectively.
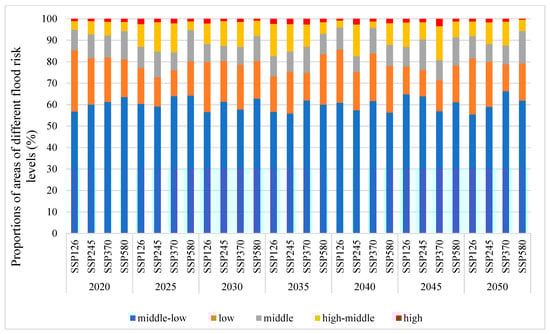
Figure 2.
Changes in proportions of areas of different flood risk levels to the total area of the YREB under different SSP-RCP scenarios during 2020–2050.
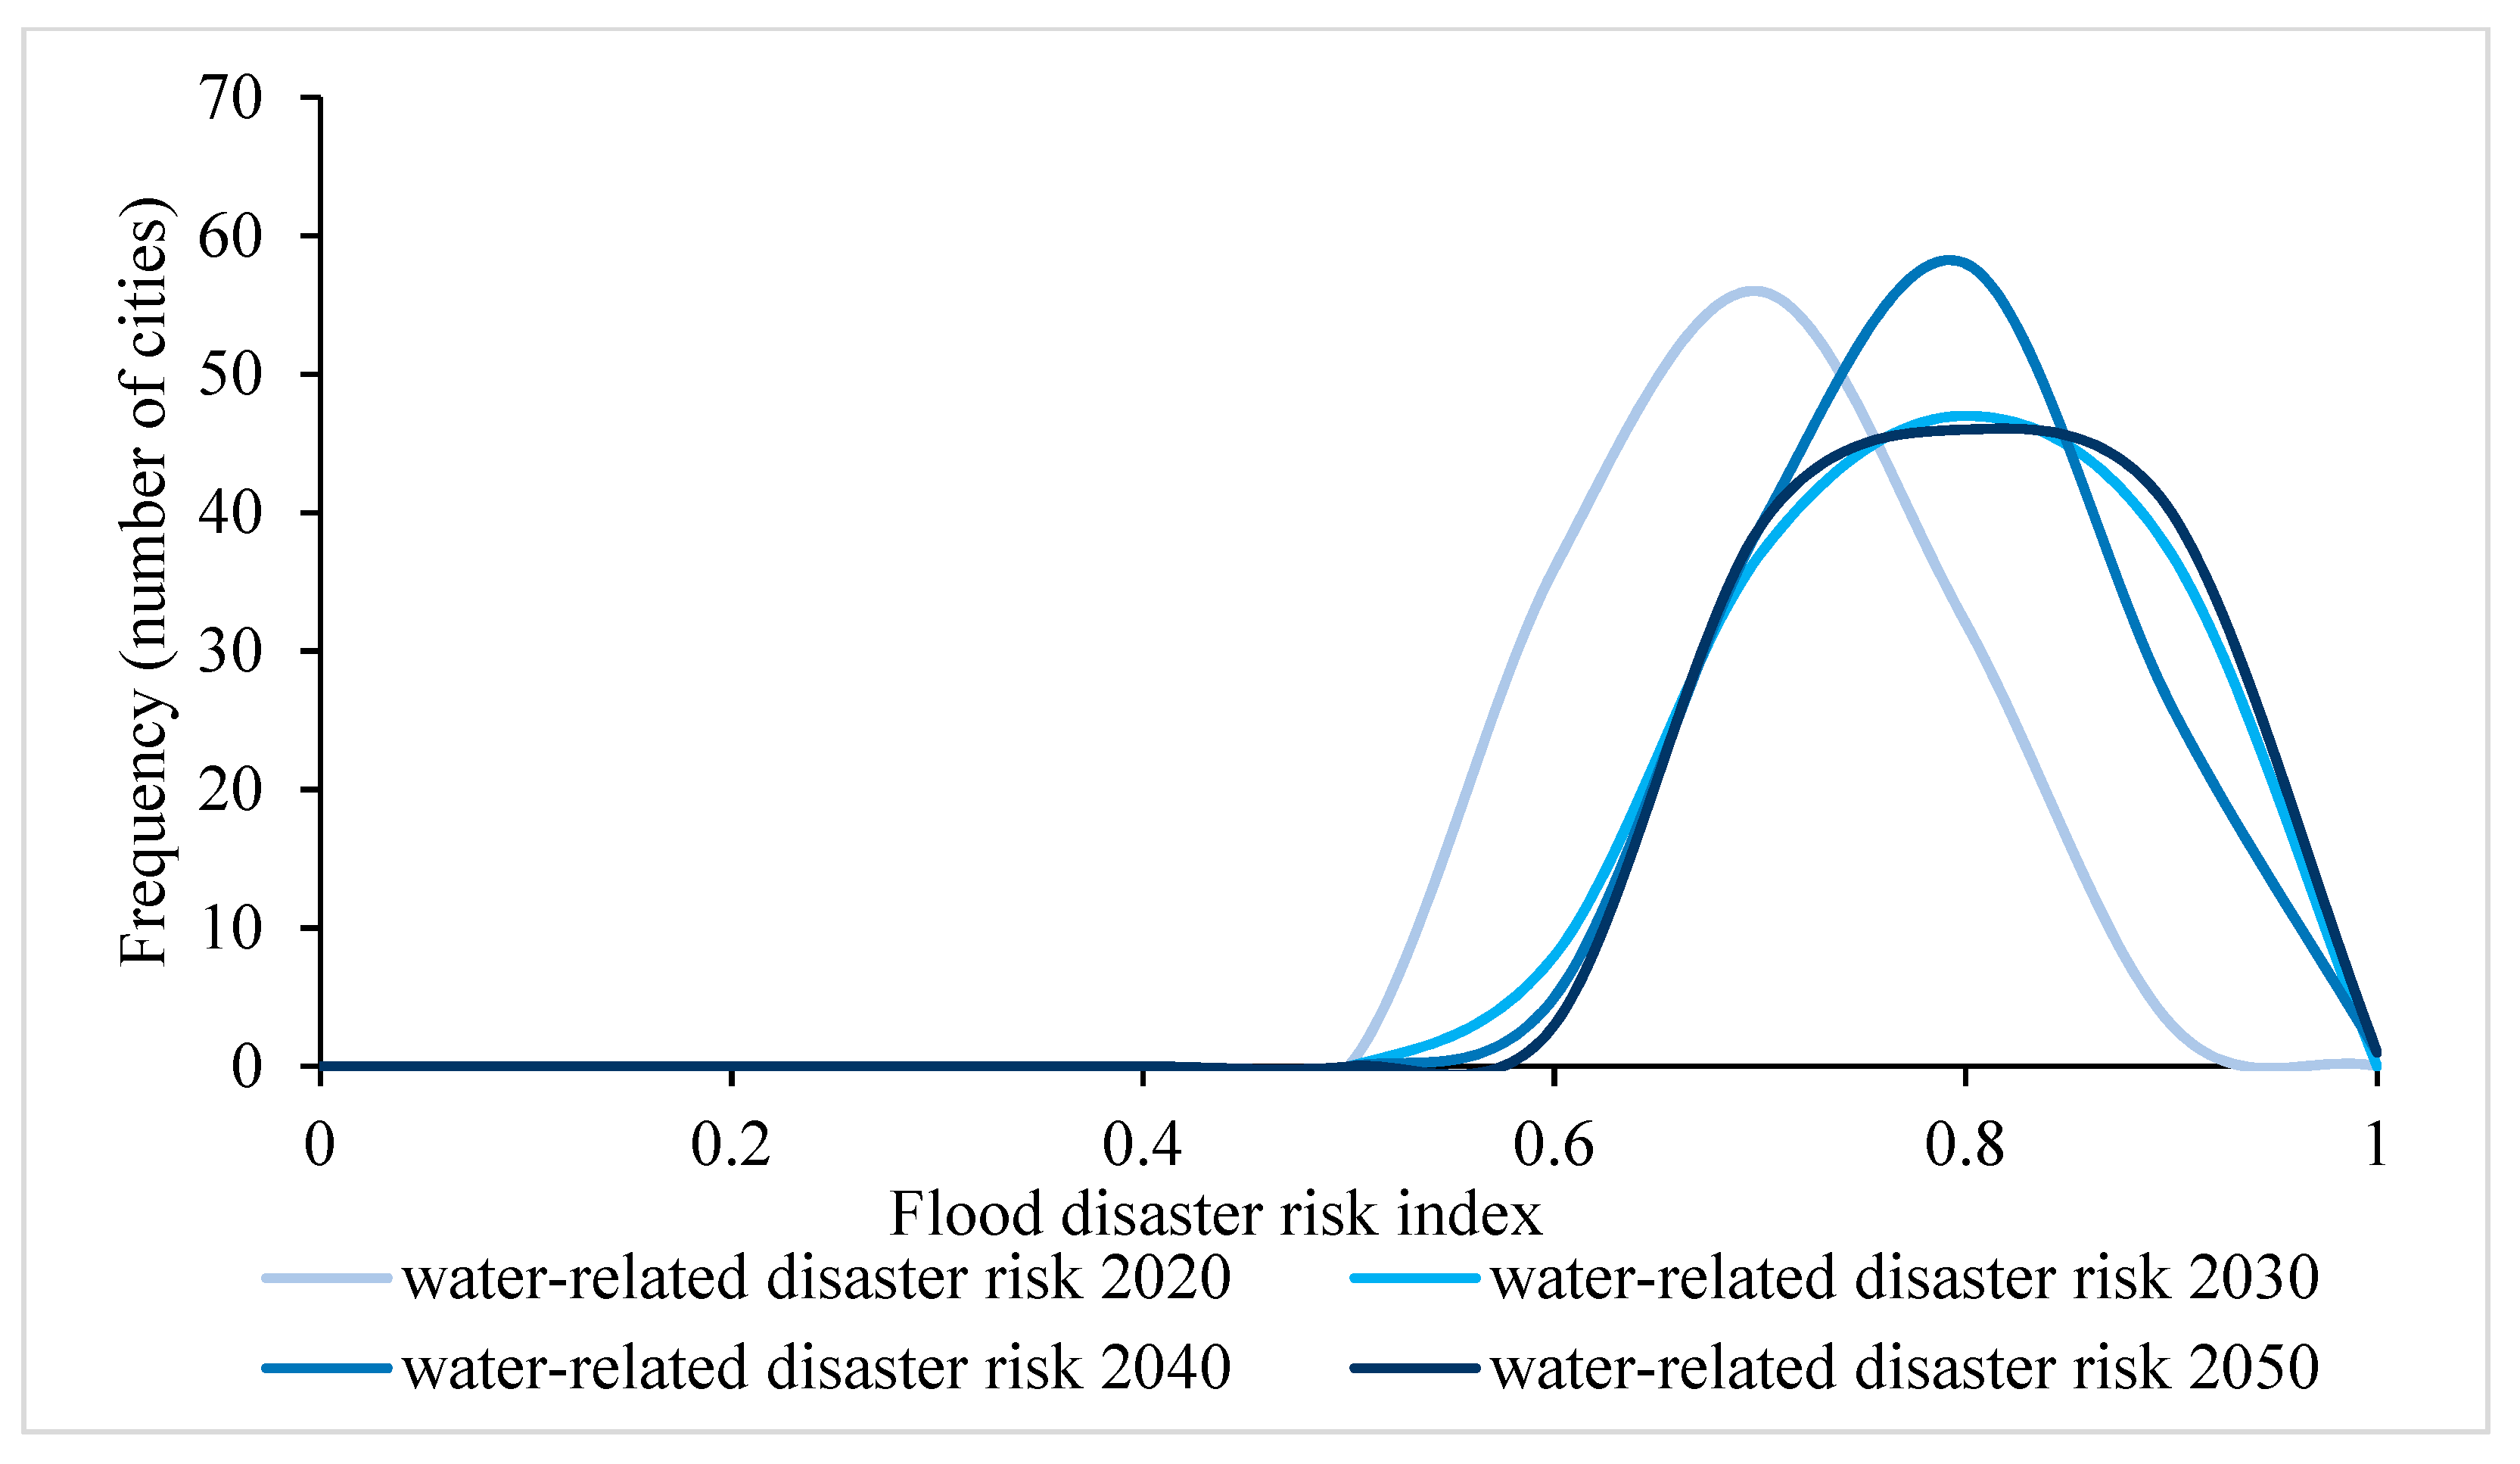
Except for the SSP585 scenario, SSP126, SSP245, and SSP370 were widely used in extreme climate studies. In this study, we selected the SSP370 scenario to clarify the changes of flood risk among cities in the YREB. At the city level, based on the frequency distribution patterns of the values of flood risk of cities in the YREB during 2020–2050 under the SSP370 scenario (Figure 3), it could be seen that the risk distribution only had one peak, and the peak shifted to a higher value interval from 2020 to 2050. It showed that flood risk had an overall increasing trend in the YREB. Specifically, the frequencies of flood risk peaked in the interval of 0.7–0.8 (56 times), 0.8–0.9 (46 times), 0.8–0.9 (58 times), and 0.8–0.9 (46 times) in 2020, 2030, 2040, and 2050, respectively, indicating that around half of the cities in the YREB had faced high flood risk. Compared with 2020, the risk of flood disaster showed an increasing trend in 2030, 2040, and 2050. The frequency in the interval of 0.8–0.9 decreased from 58 to 46 during 2040–2050. However, the frequency in the interval of 0.0–1.0 increased from 26 to 40 during this period. It can be seen that flood risk of most cities was high and did not decrease much during 2040–2050. There was still great potential for cities to improve resilience, including increasing the density of roads, improving the drainage network system, and strengthening infrastructure construction. Overall, flood risk of cities showed an increasing trend from 2020 to 2050 in the YREB and some measures should be taken to improve urban resilience.
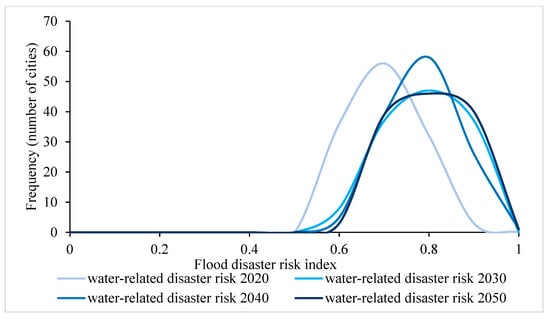
Figure 3.
Frequency statistics of flood risk of cities in the YREB during 2020–2050 under SSP370 scenario.
3.2. Spatial Changes of Flood Risk in the YREB during 2020–2050
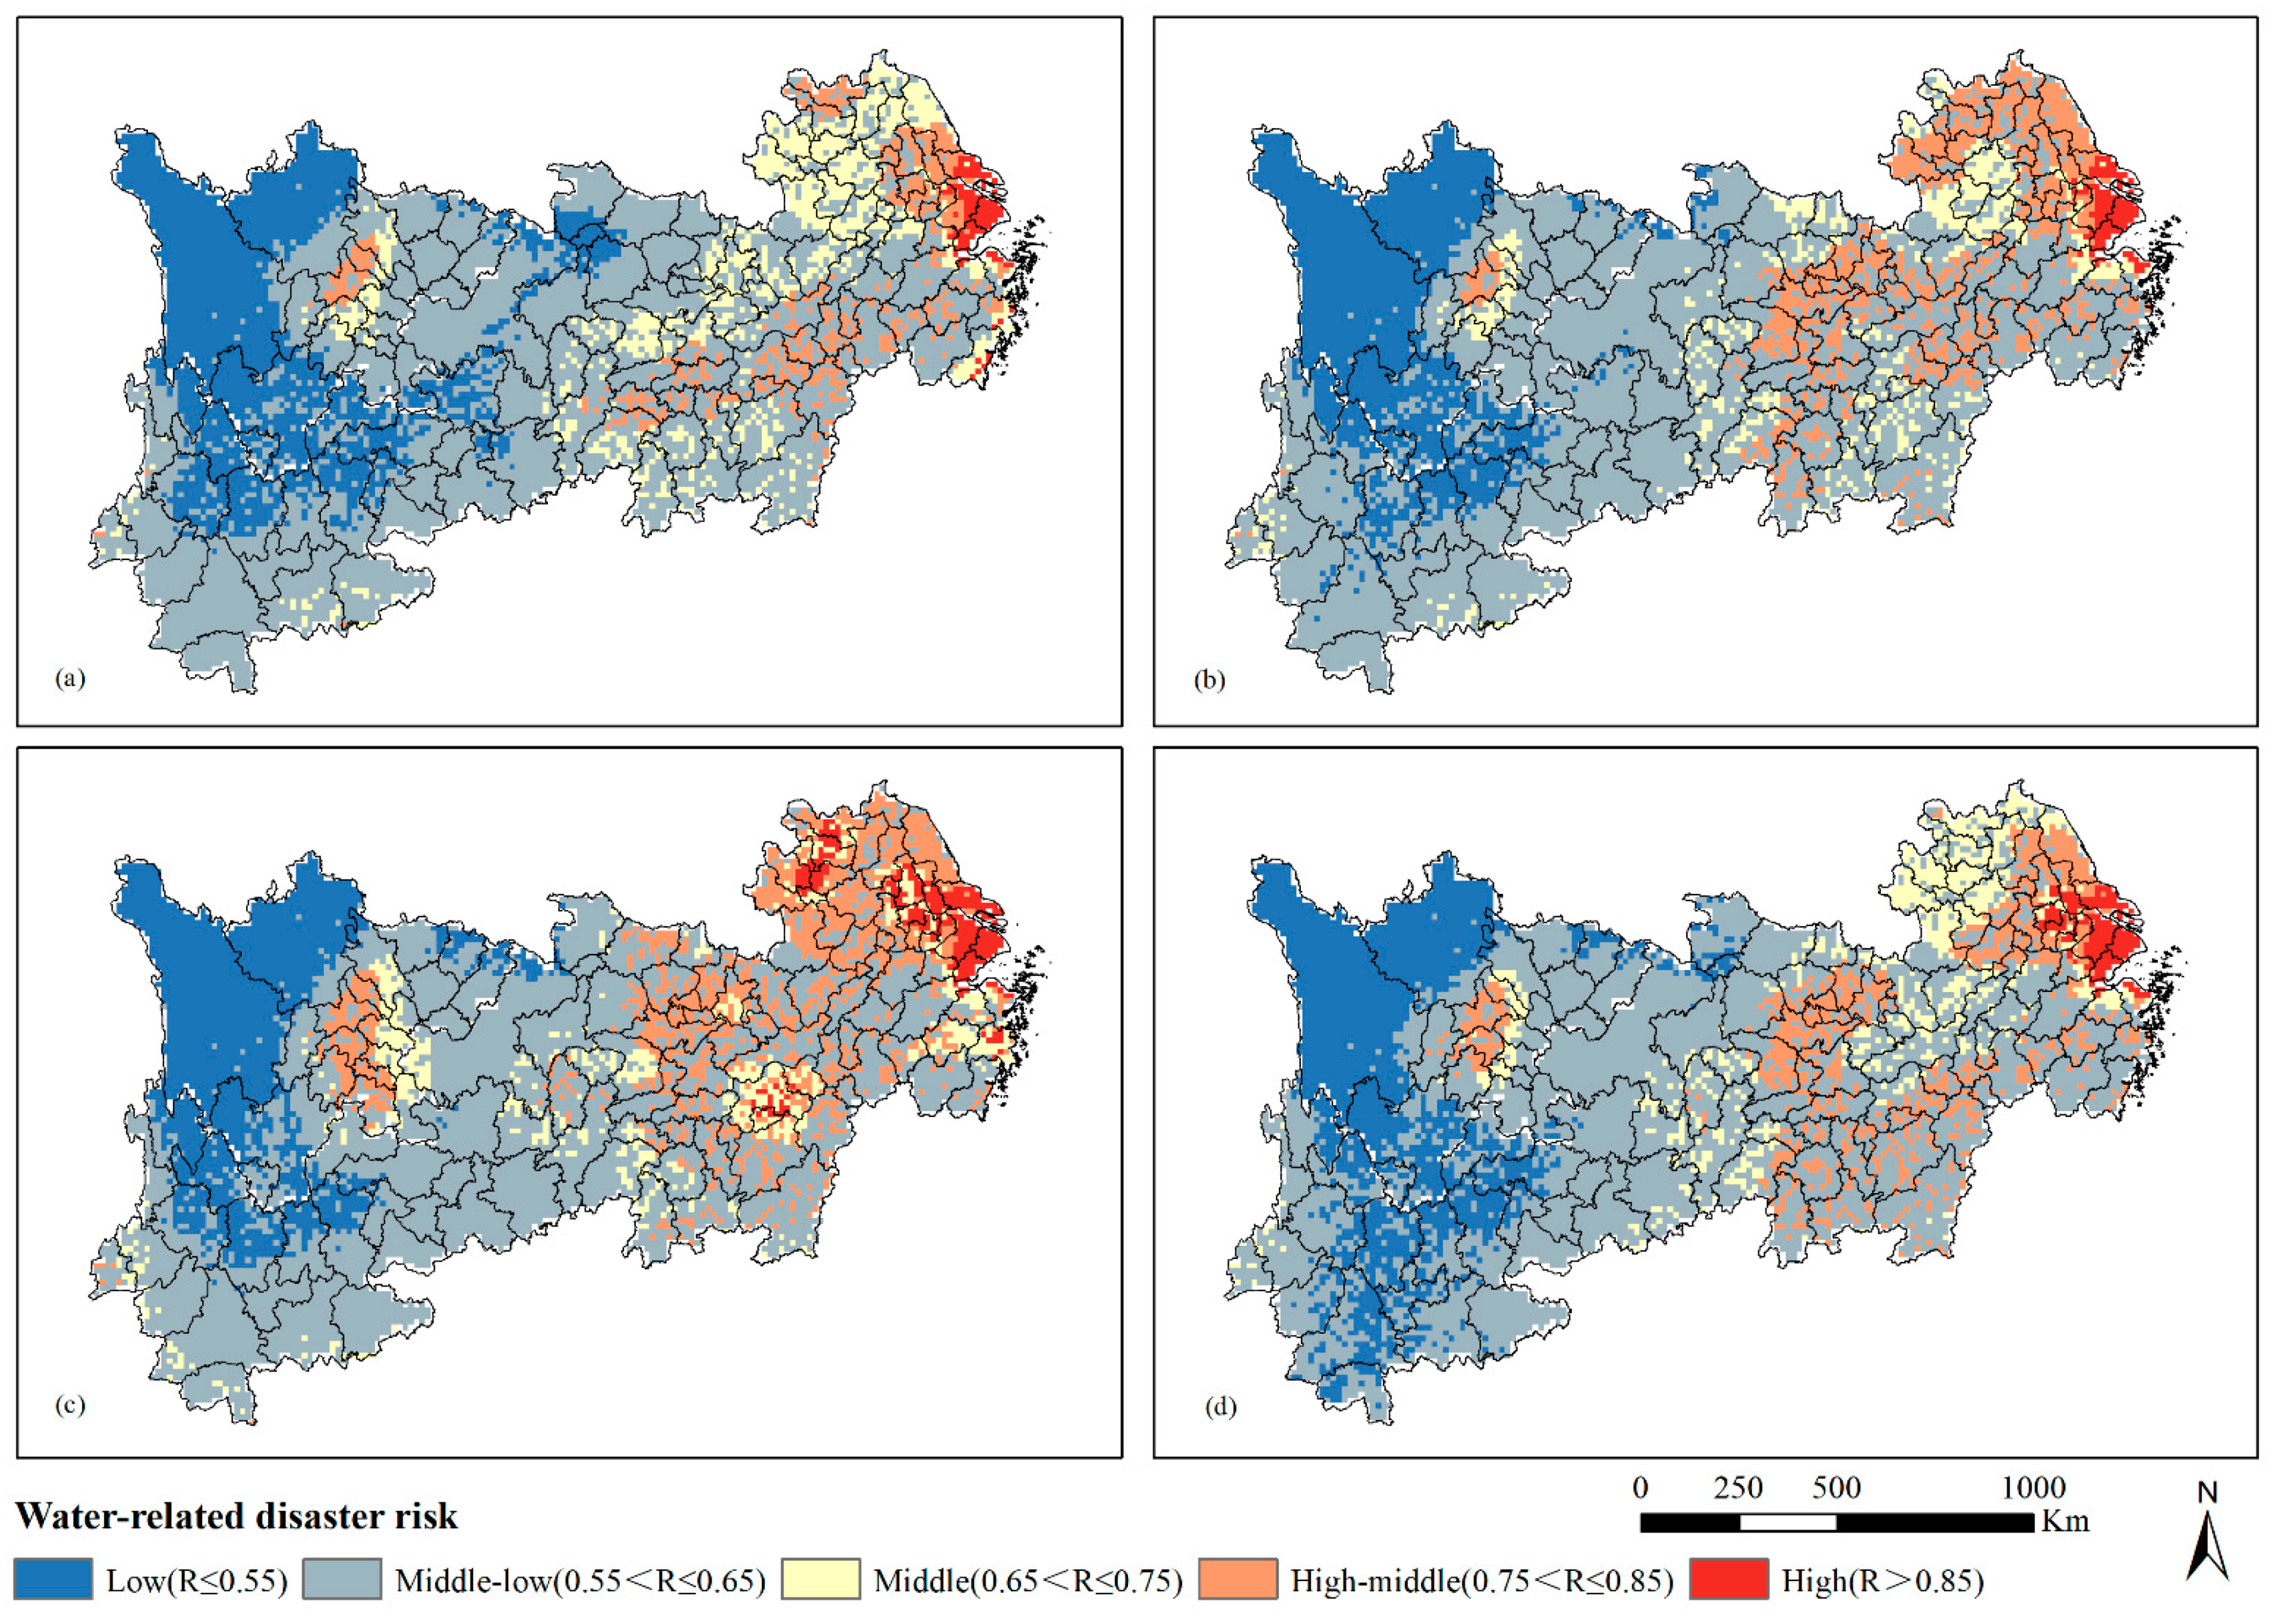
The spatial pattern of flood risk in the YREB showed that, under the sustainable development-low emission (SSP126) scenario, the high-risk areas (R > 0.85) were mainly concentrated in the northern regions of the lower reaches of the YREB (Shanghai, Changzhou, etc.) (Figure 4). The distribution of high-middle risk area (R > 0.65) showed obvious agglomeration characteristics, which were mainly manifested with Chengdu and Wuhan as the agglomeration centers in the upper and middle reaches of the YREB. The area of high-risk regions in the YREB increased and then decreased during 2020–2050, with the highest in 2030, accounting for 2.16% of the total area of the YREB, and the lowest is in 2040, accounting for only 0.82% of the total area. In 2030, the disaster-prone areas of the YREB were mainly concentrated in Chengdu and the middle and lower reaches of the Yangtze River, and the high-risk areas were concentrated along the Yangtze River (Shanghai). The sustainable development pathway (SSP126) met the requirements of the United Nations Sustainable Development Goals. Therefore, with the characteristics of low vulnerability and low mitigation challenges (SSP126), the risk of flood disasters in the YREB showed a decreasing trend.
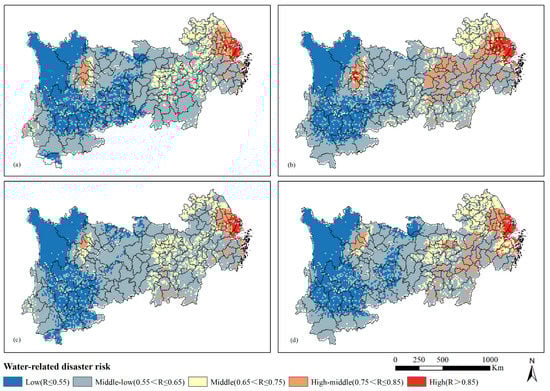
Figure 4.
Spatiotemporal changes of flood risk under SSP126 scenario: (a) 2020; (b) 2030; (c) 2040; (d) 2050.
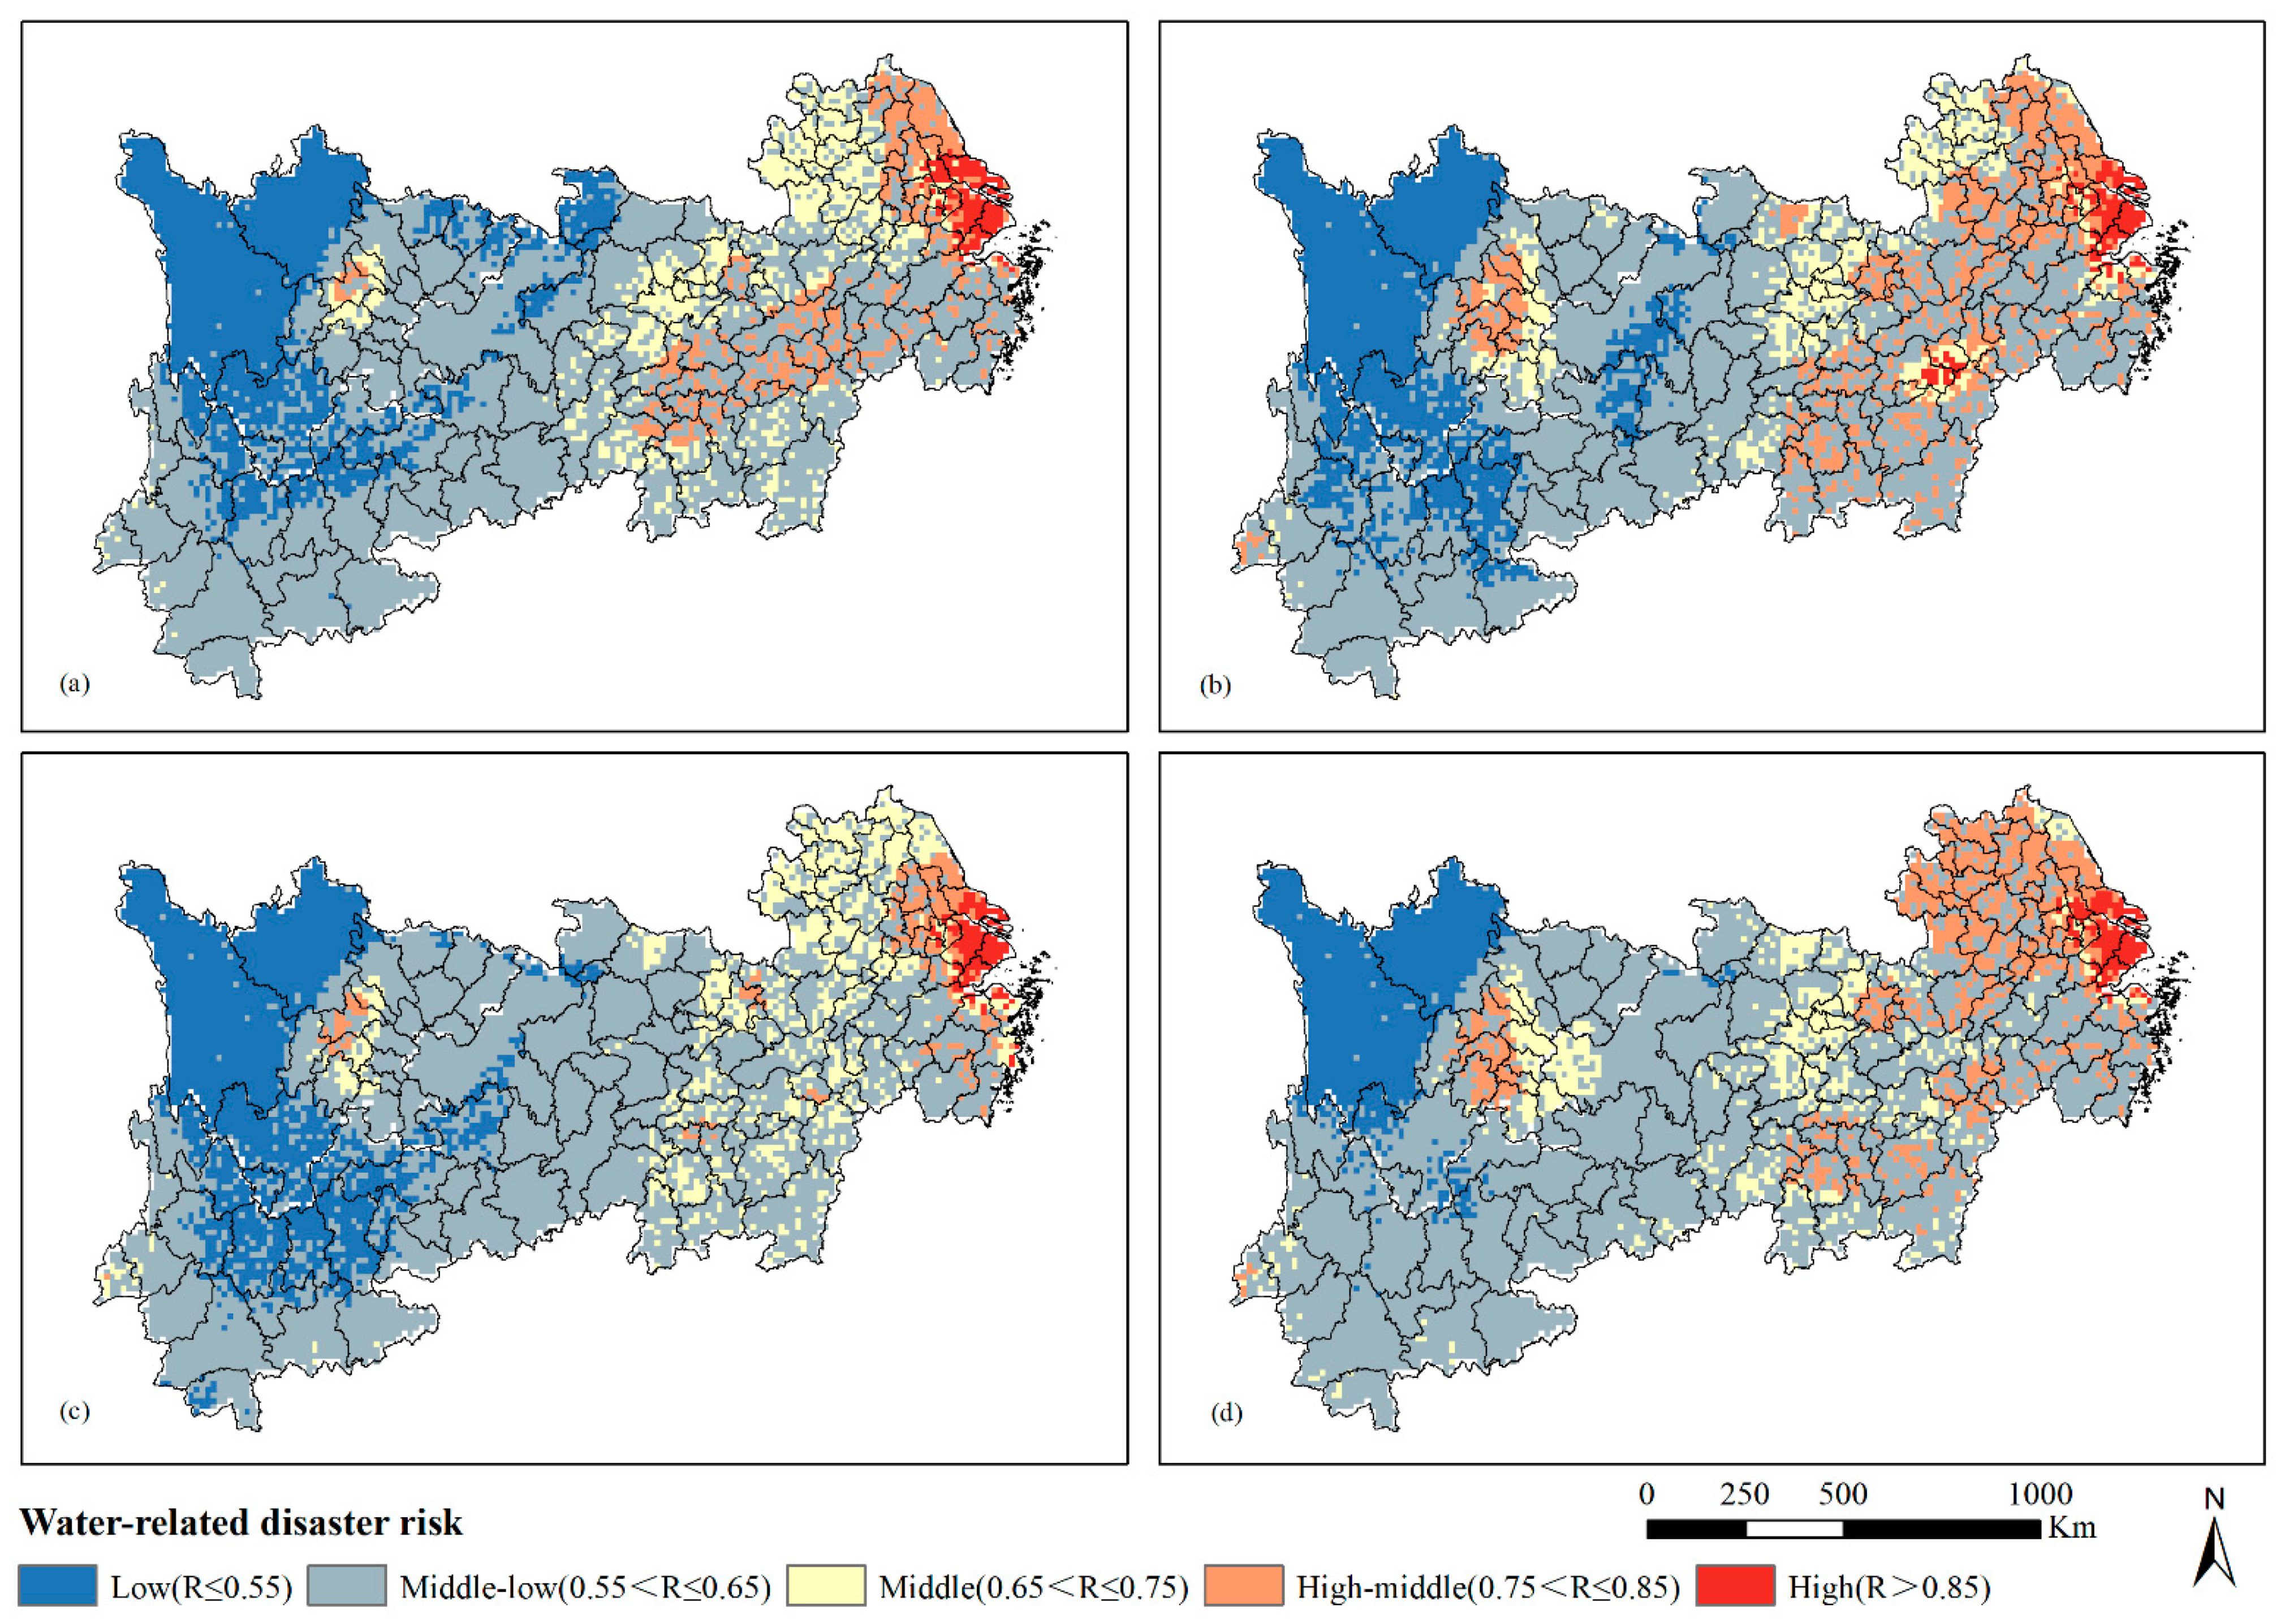
Under the moderate development-medium emission (SSP245) scenario, the high-risk areas (R > 0.85) were also mainly concentrated in the northern regions of the lower reaches (Shanghai, Nanjing, Bengbu, and Bozhou), and Yichun city in the middle reaches of the YREB (Figure 5). The high-middle risk areas were mainly concentrated in the middle and lower reaches of the YREB. The area of the high-risk regions in the YREB increased and then decreased during 2020–2050, with highest in 2040, accounting for 2.65% of the total area of the YREB, and the lowest in 2020, accounting for 1.07% of the total area of the YREB. In 2040, the disaster-prone areas of the YREB were mainly concentrated in Chengdu and the middle and lower reaches of the YREB. The high-risk areas were concentrated in Shanghai, Jiangsu and Yichun, Jiangxi. The medium development path (SSP2) has made progress in terms of technological progress, energy consumption, etc. In addition, the income levels of various countries are approaching, and the social vulnerability presents moderate characteristics. With the addition of moderate radiative forcing, compared with the sustainable development-low emission (SSP12.6) scenario, the YREB has higher socio-economic losses due to flood disasters caused by climate change.
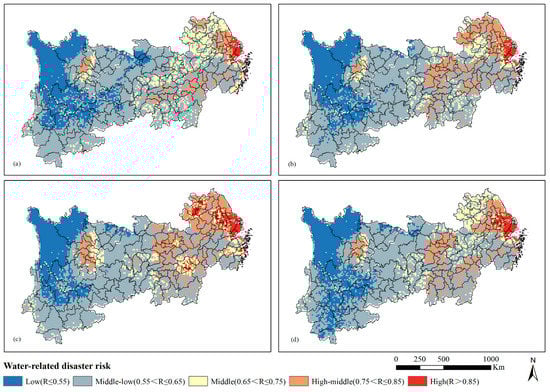
Figure 5.
Spatiotemporal changes of flood risk under SSP245 scenario: (a) 2020; (b) 2030; (c) 2040; (d) 2050.
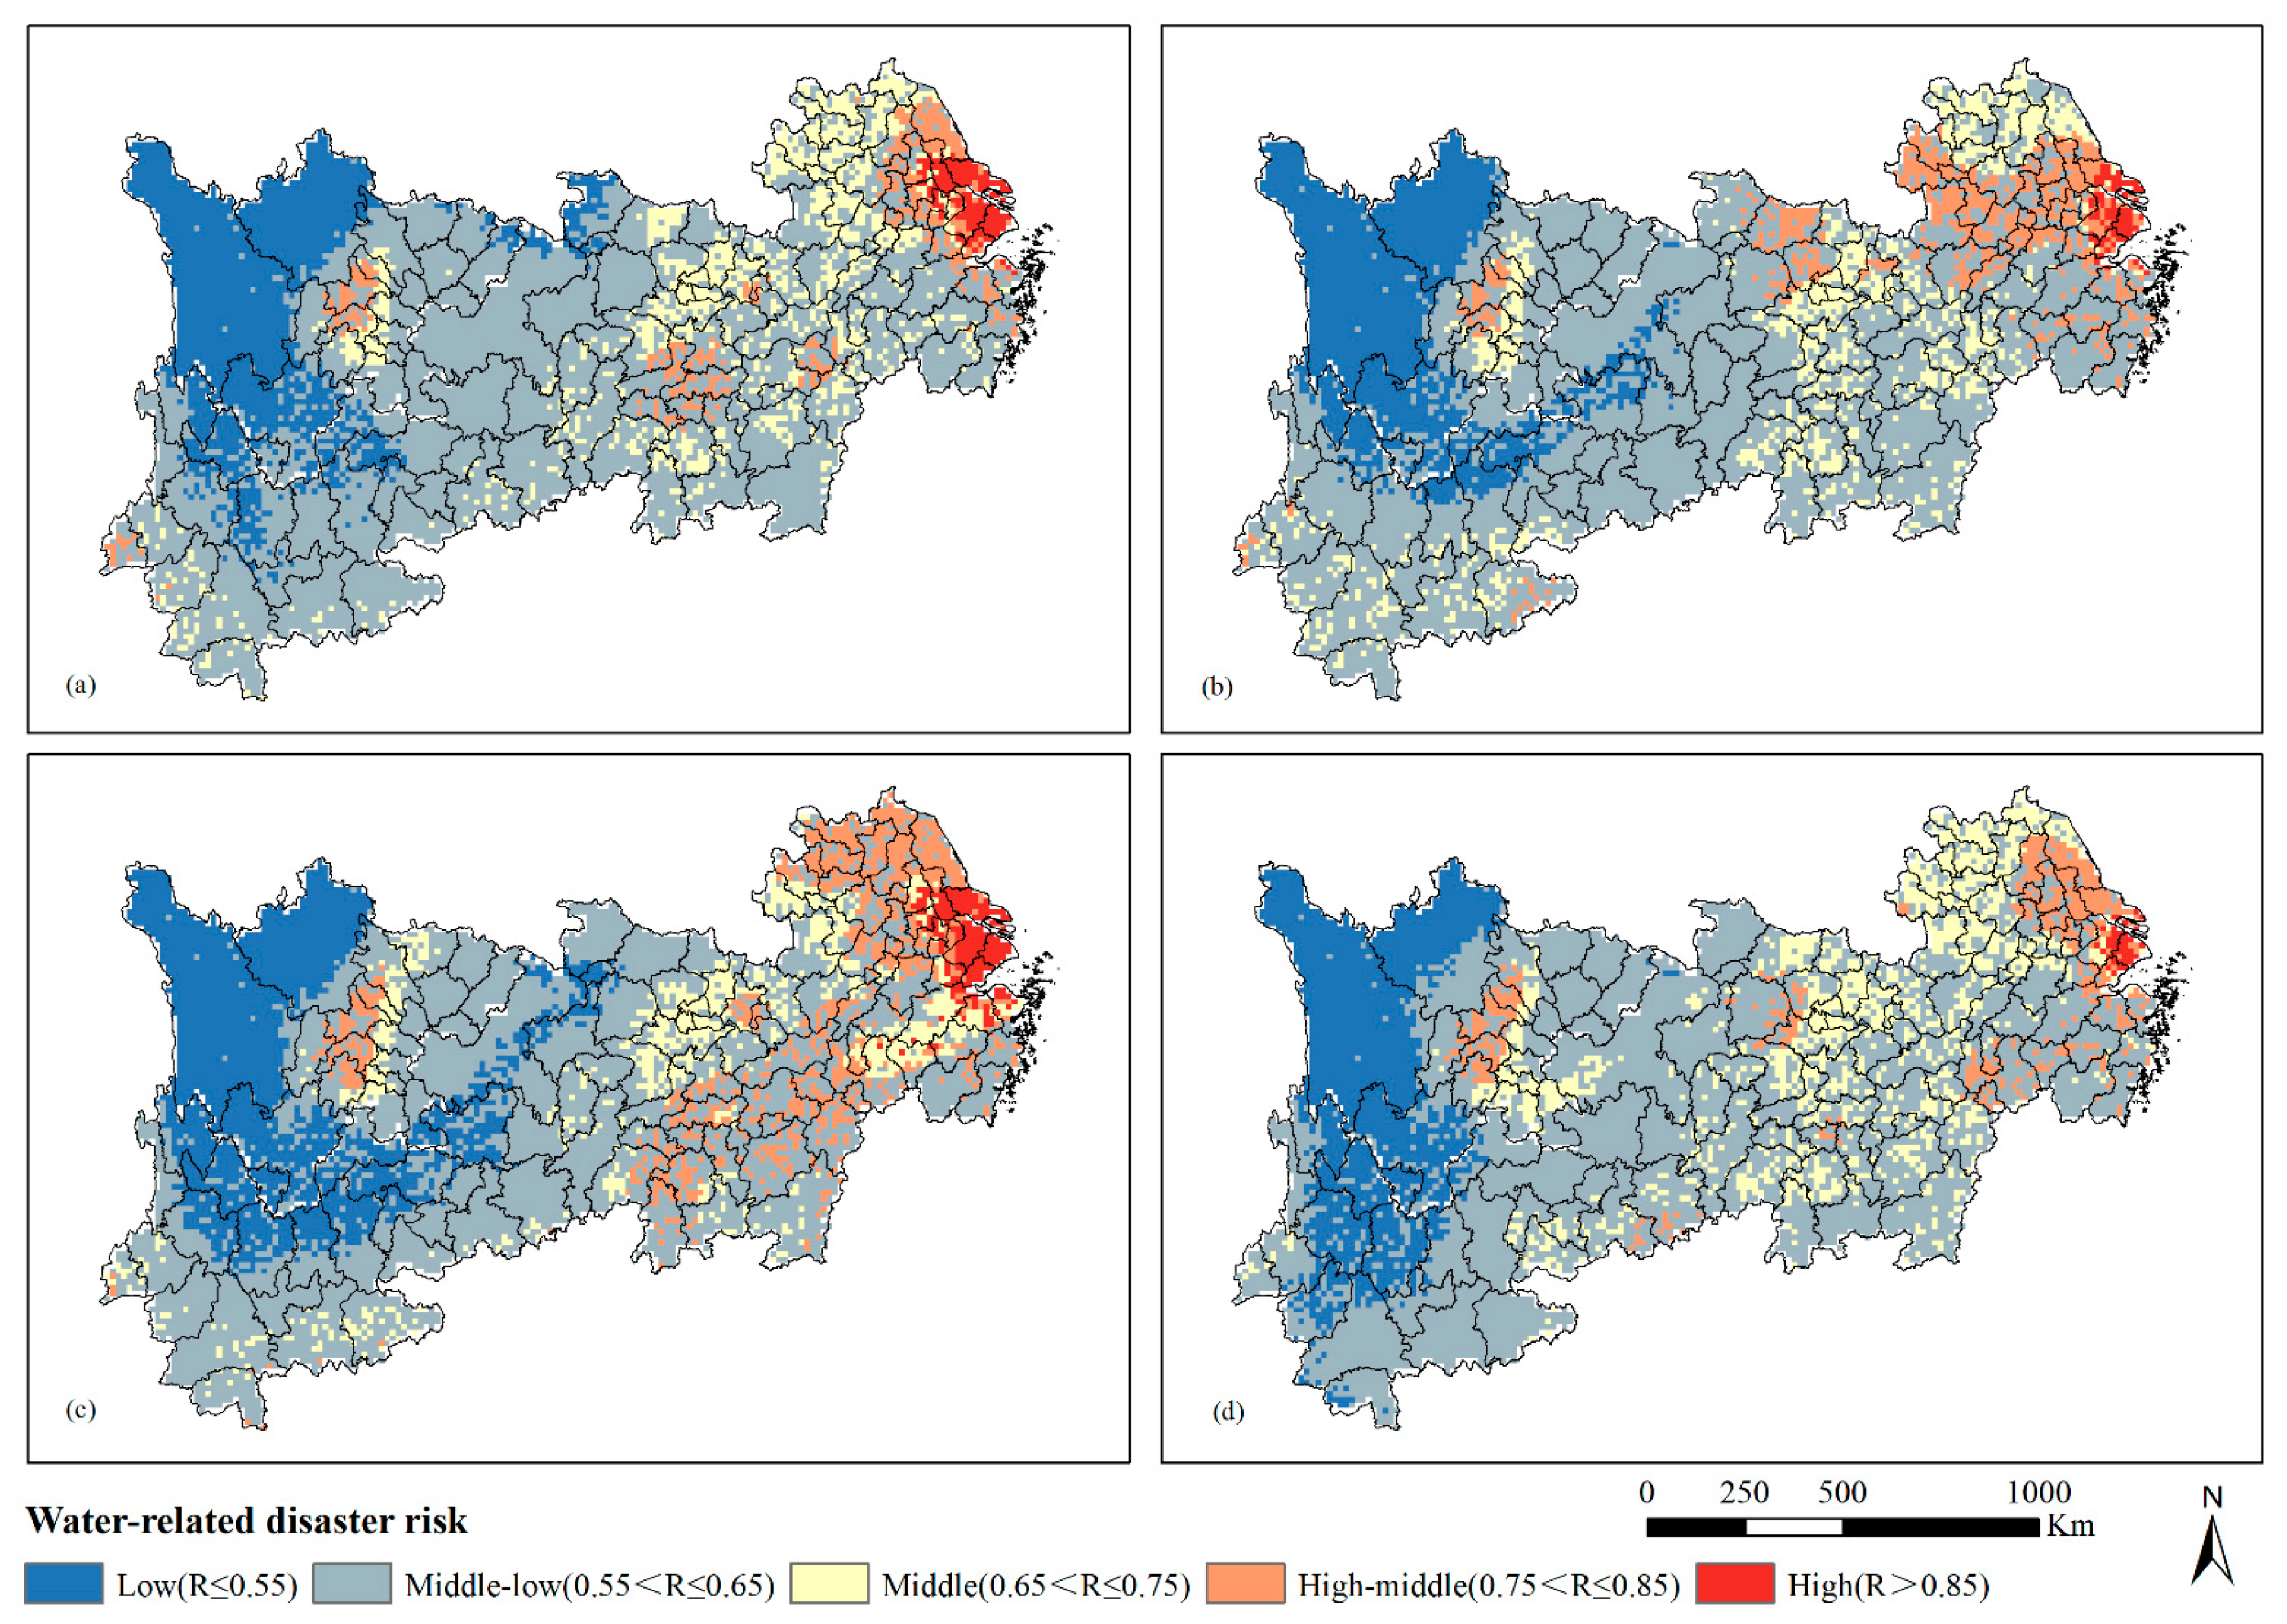
Under the local development-higher emissions (SSP370) scenario, the high-risk areas (R > 0.85) were also mainly concentrated in the northern regions (Shanghai, Suzhou, Jiaxing) in the lower reaches of the YREB (Figure 6). The area of the high-risk regions in the YREB increased first and then decreased during 2020–2050, with the highest in 2030, accounting for 1.47% of the total area of the YREB, and the lowest in 2040, accounting for 1.26% of the total area of the YREB. In 2030, the disaster-prone areas of the YREB were mainly concentrated in Chengdu and the middle and lower reaches. High-risk areas were concentrated in Shanghai, Suzhou, Jiaxing, Nanchang, and Yichun. The local development path (regional competition path) relies heavily on fossil fuel energy. The regional division of labor lacks coordination, and the trend of deglobalization is obvious. Most countries maintain a growing income level of residents, and their social vulnerability presents high characteristics. Considering the impacts of relatively high radiative forcing, compared with SSP126 and SSP245 scenarios, the YREB has higher socio-economic losses due to climate change induced floods. In 2030, the economic loss per unit area of the high-risk area under the SSP370 scenario was 1.1 times that under the SSP126 scenario; in 2040, the area of the high-risk area under the SSP370 scenario was 1.54 times that under the SSP126 scenario. Therefore, under the SSP370 scenario, climate change has the most extensive damage and higher GDP losses, especially in poorer and warmer regions. This unequal development would lead to higher economic losses.
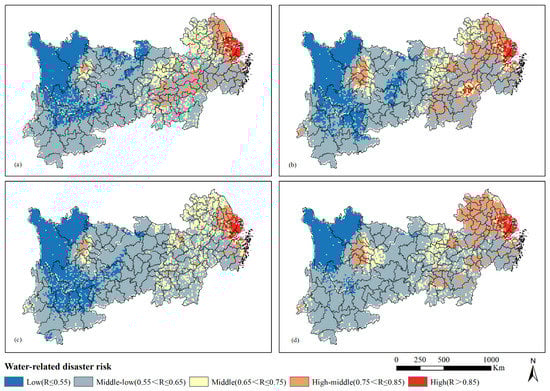
Figure 6.
Spatiotemporal changes of flood risk under SSP370 scenario: (a) 2020; (b) 2030; (c) 2040; (d) 2050.
Under the conventional development-high emission (SSP585) scenario, the high-risk areas (R > 0.85) were also mainly concentrated in the northern regions of the lower reaches of the YREB (Figure 7). The area of the high-risk region in the YREB showed a fluctuating trend, with the highest in 2040, accounting for 2.09% of the total area of the YREB, and the lowest in 2030, accounting for 0.84% of the total area of the YREB. In 2040, the high-risk areas of the YREB would be concentrated in Shanghai, Jiangsu, and Jiaxing. Under the conventional development path (fossil fuel-based development path), the socio-economic development is rapid, extreme poverty is basically eliminated and education is popularized on a large scale, but a large amount of greenhouse gas is emitted, which has high social vulnerability. Therefore, climate change would cause great socio-economic losses in this scenario. The regions with high vulnerability may face greater risks of flood disasters.

Figure 7.
Spatiotemporal changes of flood risk under SSP585 scenario: (a) 2020; (b) 2030; (c) 2040; (d) 2050.
Based on the comparison of the spatiotemporal changes of flood risk under different SSP-RCP scenarios, it can be seen that in terms of flood risk, a larger area of high-risk corresponded to higher emission scenarios, which were mostly concentrated in middle and lower reaches of the YREB and the cities of Chongqing, Chengdu during 2020–2050. In middle and lower reaches of the YREB, flood risk showed an increasing trend and the regions with high vulnerability would have greater socio-economic losses. Notably, considering all cities, scenarios, and future periods, high-emission scenarios exhibited an increasing frequency of high risk.
4. Discussion
Flood risk was subject to changes of socio-economic development and the possible influence of a changing climate. According to the risk definition proposed by the IPCC, many studies have assessed flood risk by considering comprehensive socio-economic and ecological impacts. Zhang et al. (2020) revealed that high-risk areas were concentrated in the middle and lower reaches of the Yangtze River Basin, the eastern coastal regions, Chongqing and Sichuan [39]. In addition, flood disasters could trigger natural hazards. Gao et al. (2021) found that the risks triggered by flood disasters were concentrated in the eastern area and central area [40]. Considering the impacts of climate change, the extreme precipitation had increasing trends in the middle and lower reaches of the YREB [41,42]. CMIP has provided the latest climatic data for future climate scenarios, and it has been widely used in many studies. For example, Bai et al. (2019) assessed the impact of climate change on flood risks and found that the high emission scenario resulted in increasing flood risks in the future [43]. The high-risk areas were mainly distributed in coastal regions in southeastern China and the eastern part of Sichuan under RCP8.5 scenario [44]. In this study, the results were similar to the above-mentioned studies that the area of high flood risk was mainly concentrated in the lower reaches of the YREB, Chongqing and Sichuan.
Water-related disasters can be categorized as floods, storms, waves, slides, and droughts (Table 4). In the upper reaches of the YREB, flash floods, landslides, and droughts are the main types of water-related disasters. In terms of Sichuan province, due to the low terrain and numerous mountains, flash floods are more likely to occur in this region. Chengdu has a high density of population and economy, which increases the potential vulnerability and flood risk. The average annual flood risk is about 0.77 during 2020–2050. Landslides can be initiated by storms, precipitation, and glacial melt. The development of mountainous terrain has increased the risk from landslide hazards. Chongqing is a typical city with mountains accounting for 76% of the area and hills for 22%. Affected by climate change, landslides would become the main types of secondary disaster related with flood disaster. Due to the changes of precipitation, droughts are more likely to happen in Guizhou province. Tongling is a high-risk city with average annual flood risk of 0.76. In the middle reaches of the YREB, fluvial floods are main types of water-related disasters. This is because Hunan, Hubei, and Jiangxi provinces have dense distributions of rivers and lakes. The extreme precipitation would increase the frequency of fluvial floods. Wuhan and Nanchang are high-risk cities in Hubei and Jiangxi provinces, with both average annual flood risks of 0.81. Factors such as rapid urbanization and imperfect drainage system have also caused frequent waterlogging in Wuhan. In the lower reaches of the YREB, fluvial floods and storms are two main types of water-related disaster risk. These provinces and cities mostly are coastal areas and more likely to be affected by storms. Nantong, Jiaxing, and Huai’an are high-risk cities in Jiangsu, Zhejiang, and Anhui provinces, with average annual flood risks of 0.89, 0.87, and 0.82, respectively. In addition, saltwater intrusion is most likely to occur in Shanghai. Due to increased demand from economic activities, largescale saltwater intrusion has threatened the water supply in the Yangtze Delta region, especially Shanghai. Therefore, policy makers should focus on different types of water-related disaster mitigation measures, especially for flood disasters.
Table 4.
The main types of water-related disasters in the YREB.
In addition, flood risks showed different spatial patterns under various SSP-RCP scenarios. Extreme precipitation is recognized as a key factor of climate changes. In terms of hazard factor, extreme precipitation can increase the frequency of flood disasters. The different socio-economic pathways would lead to deviations in vulnerability index. The socio-economic pathway has influenced the growth rates of population and GDP, which can result in various socio-economic losses. The flood risk of the YREB presented a spatial pattern of low in the west and high in the east, with high risk mainly concentrated in the cities in the lower reaches of the YREB, Chongqing, and Sichuan. The YREB has the problem of unbalanced economic development level. The eastern region accounts for less than one third of the total area of the YREB, but it contributes more than 50% of GDP. Moreover, the spatial distribution of resources and productivity is one of the main reasons for the unbalanced economic development between regions. The eastern regions are mostly coastal areas, which have high levels of economic development and productivity. These factors can increase the vulnerability in the eastern regions. In addition, affected by the terrain, the eastern regions are more likely to be affected by extreme precipitation. Therefore, the flood risk in eastern regions is higher than that in the western regions.
The flood risk of the YREB changed in different time periods and regions, which may depend on different factors. For example, the urbanization process of YREB and extreme precipitation are the major factors affecting the flood risk. The rapid urbanization may cause potential disruptive impacts, including large flood-prone areas, high flood disasters, and environmental problems [45]. The growing population would increase vulnerability, as vulnerability-prone areas were mainly concentrated in densely populated areas. Satellite imaging revealed that there was an increased proportion of the population exposed to floods, and climate change would increase further the proportion of the affected population [46,47]. In addition, flood risk can be also affected by topography, the distance to rivers, and human activities. In future research, the comprehensive assessment of flood risk should combine more various factors under more climate change scenarios. Moreover, it is essential to develop models of risk assessment and decision support, which can better cope with challenges caused by climate change in the future. However, there were still some uncertainties existing in various factors when using the CMIP data to assess future flood risk, including the resolution of climate models, scenario parameters, as well as the estimation of GDP and population. Therefore, the flood risk assessment accuracy can be further improved by downscaling climate parameters in the future.
The flood risk assessment results indicated that the lower reaches of the YREB and coastal regions would be a key area for future climate change adaptation and risk mitigation. Flood mitigation infrastructure and natural ecosystems could reduce hazard of the flood disasters. Satellite technology and monitoring systems can track changes of flood disasters and population, which could help improve resilience in the YREB. Risk management and mitigation can be achieved with these measures in the future. Furthermore, the government should focus on flash floods and landslides in the upper reaches of the YREB, fluvial floods in the middle reaches of the YREB, fluvial floods and storms in the lower reaches of the YREB. Through resilience improvement, construction of drainage systems, application of satellite technology, and disaster monitoring and early warning systems, the mitigation of flood risk and sustainable development of the YREB can be realized.
5. Conclusions
Affected by climate change, the frequency, intensity, and severity of extreme events have increased, hindering the sustainable development of the economy of the YREB. Thus, assessing the risk of flood disasters in the YREB under the changing environment is an important basis for improving urban risk management capabilities and achieving regional sustainable development. This study constructed a flood risk assessment index system, then analyzed the temporal and spatial changes of flood risk in the YREB during 2020–2050 under four climate change scenarios of SSP126, SSP245, SSP370, and SSP585. It showed that the characteristics of flood risk in the YREB were different under different scenarios. The area of middle-low risk accounted for 60% of the total area of YREB and area of high-risk fluctuated first and then decreased under the four scenarios, with the area of high-risk being largest in the future under the SSP585 scenario. Due to high dependence on fossil energy, under the SSP585 scenario, the flood risk showed an increasing trend during 2020–2050. The area of high-risk flood disaster in 2040 under the SSP585 scenario was 1.66 and 2.55 times that under the SSP370 and SSP126 scenarios, respectively. In addition, under the SSP370 scenario, frequency statistics of flood risk of cities indicated that around half of the cities in the YREB had faced high flood risk and the risk had showed an increasing trend from 2020 to 2050.
The spatial pattern of flood risk in the YREB showed that high-risk areas were mainly concentrated in the lower reaches of the YREB, Chongqing, and Sichuan. The overall spatial pattern of flood risk was low in the west and high in the east of the YREB. In addition, the risk gradually shifted from regions of the lower reaches of the YREB (Shanghai, Jiaxing, and Suzhou) to that of the middle reaches (Jiangxi, Hubei, Anhui), and gradually spread outward from Chengdu in the upper reaches during 2020–2050. Based on the comparison of the spatiotemporal changes of flood risk under different SSP-RCP scenarios, the results indicated that the high-risk areas had an increasing trend under high emission scenarios SSP370 and SSP585. Therefore, assessing flood risk under climate change has great significance for risk reduction and risk management.
Author Contributions
Conceptualization, Z.L.; methodology, L.P.; formal analysis, Z.L. and L.P.; data curation, L.P.; writing—original draft preparation, L.P.; writing—review and editing, Z.L.; visualization, L.P.; supervision, Z.L. All authors have read and agreed to the published version of the manuscript.
Funding
This research was funded by the National Nature Science Foundation of China (Grant No. 41890824 and 71804175).
Institutional Review Board Statement
Not applicable.
Informed Consent Statement
Not applicable.
Data Availability Statement
All data and materials are available upon request.
Acknowledgments
We would like to thank the reviewers for their thoughtful comments that helped improve the quality of this work.
Conflicts of Interest
The authors declare no conflict of interest.
References
- United Nations Office for Disaster Risk Reduction (UNDRR). United Nations Office for Disaster Risk Reduction 2019 Annual Report. 2020. Available online: https://www.undrr.org/media/47138/download (accessed on 15 May 2021).
- Stocker, T.F.; Qin, D.H.; Plattner, G.-K.; Tignor, M.M.B.; Allen, S.K.; Boschung, J.; Nauels, A.; Xia, Y.; Bex, V.; Midgley, P.M. IPCC Climate Change 2013: The Physical Science Basis. In Contribution of Working Group I to the Fifth Assessment Report of the Intergovernmental Panel on Climate Change; Cambridge University Press: Cambridge, UK; New York, NY, USA, 2014; 1535p. [Google Scholar]
- Centre for Research on the Epidemiology of Disasters, United Nations Office for Disaster Risk Reduction (UNDRR). The Human Cost of Disasters. An Overview of the Last 20 Years (2000–2019). 2020. Available online: https://www.undrr.org/publication/human-cost-disasters-overview-last-20-years-2000-2019 (accessed on 15 May 2021).
- Wang, G.Q.; Zhang, J.Y.; Jin, J.L.; Pagano, T.C.; Calow, R.; Bao, Z.X.; Liu, C.S.; Liu, Y.L.; Yan, X.L. Assessing water resources in China using PRECIS projections and a VIC model. Hydrol. Earth Syst. Sci. 2012, 16, 231–240. [Google Scholar] [CrossRef] [Green Version]
- Lyu, H.M.; Xu, Y.S.; Cheng, W.C.; Arulrajah, A. Flooding hazards across southern China and prospective sustainability measures. Sustainability 2018, 10, 1682. [Google Scholar] [CrossRef] [Green Version]
- Wu, S.H.; Pan, T.; He, S.F. Climate change risk research: A case study on flood disaster risk in China. Adv. Clim. Chang. Res. 2012, 3, 92–98. [Google Scholar]
- Forino, G.; von Meding, J.; Brewer, G.; Gajendran, T. Disaster risk reduction and climate change adaptation policy in Australia. Procedia Econ. Financ. 2014, 18, 473–482. [Google Scholar] [CrossRef] [Green Version]
- Carrão, H.; Naumann, G.; Barbosa, P. Global projections of drought hazard in a warming climate: A prime for disaster risk management. Clim. Dynam. 2018, 50, 2137–2155. [Google Scholar] [CrossRef] [Green Version]
- Van Ruijven, B.J.; Levy, M.; Agrawal, A.; Biermann, F.; Birkmann, J.; Carter, T.R.; Ebi, K.L.; Garschagen, M.; Jones, B.; Jones, R.; et al. Enhancing the relevance of global shared socio-economic pathways for climate change impacts, vulnerability and adaptation research. Clim. Chang. 2014, 122, 481–494. [Google Scholar] [CrossRef] [Green Version]
- Eyring, V.; Bony, S.; Meehl, G.A.; Senior, C.A.; Stevens, B.; Stouffer, R.J.; Taylor, K.E. Overview of the Coupled Model Intercomparison Project Phase 6 (CMIP6) experimental design and organization. Geosci. Model. Dev. 2016, 9, 1937–1958. [Google Scholar] [CrossRef] [Green Version]
- Bağçaci, S.Ç.; Yucel, I.; Duzenli, E.; Yilmaz, M.T. Intercomparison of the expected change in the temperature and the precipitation retrieved from CMIP6 and CMIP5 climate projections: A Mediterranean hot spot case, Turkey. Atmos. Res. 2021, 256, 105576. [Google Scholar] [CrossRef]
- Apurv, T.; Mehrotra, R.; Sharma, A.; Goyal, M.K.; Dutta, S. Impact of climate change on floods in the Brahmaputra basin using CMIP5 decadal predictions. J. Hydrol. 2015, 527, 281–291. [Google Scholar] [CrossRef]
- Alfieri, L.; Feyen, L.; Dottori, F.; Bianchi, A. Ensemble flood risk assessment in Europe under high end climate scenarios. Global. Environ. Chang. 2015, 35, 199–212. [Google Scholar] [CrossRef]
- Metin, A.D.; Dung, N.V.; Schröter, K.; Guse, B.; Apel, H.; Kreibich, H.; Vorogushyn, S.; Merz, B. How do changes along the risk chain affect flood risk? Nat. Hazard. Earth Syst. 2018, 18, 3089–3108. [Google Scholar] [CrossRef] [Green Version]
- Vorogushyn, S.; Bates, P.D.; De Bruijn, K.; Castellarin, A.; Kreibich, H.; Priest, S.; Schröter, K.; Bagli, S.; Blöschl, G.; Domeneghetti, A.; et al. Evolutionary leap in large-scale flood risk assessment needed. Wires Water 2018, 5, e1266. [Google Scholar] [CrossRef] [Green Version]
- Weerasinghe, K.M.; Gehrels, H.; Arambepola, N.M.S.I.; Vajja, H.P.; Herath, J.M.K.; Atapattu, K.B. Qualitative flood risk assessment for the western province of Sri Lanka. Procedia Eng. 2018, 212, 503–510. [Google Scholar] [CrossRef]
- Tramblay, Y.; Amoussou, E.; Dorigo, W.; Mahé, G. Flood risk under future climate in data sparse regions: Linking extreme value models and flood generating processes. J. Hydrol. 2014, 519, 549–558. [Google Scholar] [CrossRef]
- Ward, P.J.; Van Pelt, S.C.; De Keizer, O.; Aerts, J.C.J.H.; Beersma, J.J.; Van den Hurk, B.J.J.M.; Te Linde, A.H. Including climate change projections in probabilistic flood risk assessment. J. Flood. Risk. Manag. 2014, 7, 141–151. [Google Scholar] [CrossRef]
- Grežo, H.; Močko, M.; Izsoff, M.; Vrbičanová, G.; Petrovič, F.; Straňák, J.; Muchova, Z.; Slamova, M.; Olah, B.; Machar, I. Flood risk assessment for the long-term strategic planning considering the placement of industrial parks in Slovakia. Sustainability 2020, 12, 4144. [Google Scholar] [CrossRef]
- Naz, S.; Ahsanuddin, M.; Inayatullah, S.; Siddiqi, T.; Imtiaz, M. Copula-based bivariate flood risk assessment on Tarbela Dam, Pakistan. Hydrology 2019, 6, 79. [Google Scholar] [CrossRef] [Green Version]
- Wang, Y.; Zhang, J.; Guo, E.; Sun, Z. Fuzzy comprehensive evaluation-based disaster risk assessment of desertification in Horqin Sand Land, China. Int. J. Environ. Res. Public Health 2015, 12, 1703–1725. [Google Scholar] [CrossRef] [PubMed] [Green Version]
- Akter, M.; Jahan, M.; Kabir, R.; Karim, D.S.; Haque, A.; Rahman, M.; Salehin, M. Risk assessment based on fuzzy synthetic evaluation method. Sci. Total Environ. 2019, 658, 818–829. [Google Scholar] [CrossRef]
- Zhao, R.; Liu, S.; Liu, Y.; Zhang, L.; Li, Y. A safety vulnerability assessment for chemical enterprises: A hybrid of a data envelopment analysis and fuzzy decision-making. J. Loss Prevent. Proc. 2018, 56, 95–103. [Google Scholar] [CrossRef]
- Rohat, G. Projecting drivers of human vulnerability under the shared socioeconomic pathways. Int. J. Environ. Res. Public Health 2018, 15, 554. [Google Scholar] [CrossRef] [PubMed] [Green Version]
- Majd, S.N.; Tabibian, M.; Aminzadeh, B. The Analysis of Crisis Management of Natural Disasters in Nazarabad Using SWOT Model. J. Appl. Environ. Biol. Sci. 2014, 4, 35–45. [Google Scholar]
- Chen, J.; Huang, G.; Chen, W. Towards better flood risk management: Assessing flood risk and investigating the potential mechanism based on machine learning models. J. Environ. Manag. 2021, 293, 112810. [Google Scholar] [CrossRef] [PubMed]
- Khan, T.A.; Shahid, Z.; Alam, M.; Su’Ud, M.M.; Kadir, K. Early flood risk assessment using machine learning: A comparative study of SVM, Q.-SVM, K-NN and LDA. In Proceedings of the 13th International Conference on Mathematics, Actuarial Science, Computer Science and Statistics (MACS 2019), Karachi, Pakistan, 14–15 December 2019; IEEE: Piscataway, NJ, USA, 2019; pp. 1–7. [Google Scholar]
- Waghwala, R.K.; Agnihotri, P. Flood risk assessment and resilience strategies for flood risk management: A case study of Surat City. Int. J. Disaster Risk Reduct. 2019, 40, 101155. [Google Scholar] [CrossRef]
- Rubio, C.J.; Yu, I.S.; Kim, H.Y.; Jeong, S.M. Index-based flood risk assessment for Metro Manila. Water. Suppl. 2020, 20, 851–859. [Google Scholar] [CrossRef]
- Ghosh, A.; Kar, S.K. Application of analytical hierarchy process (AHP) for flood risk assessment: A case study in Malda district of West Bengal, India. Nat. Hazards 2018, 94, 349–368. [Google Scholar] [CrossRef]
- Yigitcanlar, T.; Desouza, K.C.; Butler, L.; Roozkhosh, F. Contributions and risks of artificial intelligence (AI) in building smarter cities: Insights from a systematic review of the literature. Energies 2020, 13, 1473. [Google Scholar] [CrossRef] [Green Version]
- Ntajal, J.; Lamptey, B.L.; Mahamadou, I.B.; Nyarko, B.K. Flood disaster risk mapping in the lower Mono river basin in Togo, West Africa. Int. J. Disast Risk Reduct. 2017, 23, 93–103. [Google Scholar] [CrossRef]
- Ghanbarpour, M.R.; Saravi, M.M.; Salimi, S. Floodplain inundation analysis combined with contingent valuation: Implications for sustainable flood risk management. Water Resour. Manag. 2014, 28, 2491–2505. [Google Scholar] [CrossRef]
- Chan, H.K.; Sun, X.; Chung, S.H. When should fuzzy analytic hierarchy process be used instead of analytic hierarchy process? Decis. Support Syst. 2019, 125, 113114. [Google Scholar] [CrossRef]
- Jing, C.; Tao, H.; Jiang, T.; Wang, Y.J.; Zhai, J.Q.; Cao, L.G.; Su, B.D. Population, urbanization and economic scenarios over the Belt and Road region under the shared socioeconomic pathways. J. Geogr. Sci. 2019, 30, 68–84. [Google Scholar] [CrossRef] [Green Version]
- Li, Z.Q.; Wu, Y.; Yang, L.Y.; Du, J.Z.; Deng, B.; Zhang, J. Carbon isotopes and lignin phenols for tracing the floods during the past 70 years in the middle reach of the Changjiang River. Acta. Oceanol. Sin. 2020, 39, 33–41. [Google Scholar] [CrossRef]
- Kale, S. Climatic trends in the temperature of Çanakkale city, Turkey. Nat. Eng. Sci. 2017, 2, 14–27. [Google Scholar] [CrossRef] [Green Version]
- Lin, W.; Chen, H. Assessment of model performance of precipitation extremes over the mid-high latitude areas of Northern Hemisphere: From CMIP5 to CMIP6. Atmos. Ocean Sci. Lett. 2020, 13, 598–603. [Google Scholar] [CrossRef]
- Zhang, D.F.; Shi, X.G.; Xu, H.; Jing, Q.N.; Pan, X.C.; Liu, T.; Wang, H.Z.; Hou, H.M. A GIS-based spatial multi-index model for flood risk assessment in the Yangtze River Basin, China. Environ. Impact Asses. 2020, 83, 106397. [Google Scholar] [CrossRef]
- Gao, Y.; Cao, G.Z.; Ni, P.; Tang, Y.; Liu, Y.T.; Bi, J.; Ma, Z.W. Natural hazard triggered technological risks in the Yangtze River Economic Belt, China. Sci. Rep. 2021, 11, 13842. [Google Scholar] [CrossRef]
- Fang, J.; Kong, F.; Fang, J.Y.; Zhao, L. Observed changes in hydrological extremes and flood disaster in Yangtze River Basin: Spatial–temporal variability and climate change impacts. Nat. Hazards 2018, 93, 89–107. [Google Scholar] [CrossRef]
- Yu, Z.B.; Gu, H.H.; Wang, J.G.; Xia, J.; Lu, B.H. Effect of projected climate change on the hydrological regime of the Yangtze River Basin, China. Stoch. Environ. Res. Risk Assess. 2018, 32, 1–16. [Google Scholar] [CrossRef]
- Bai, Y.; Zhang, Z.N.; Zhao, W.G. Assessing the impact of climate change on flood events using HEC-HMS and CMIP5. Water. Air. Soil. Poll. 2019, 230, 1–13. [Google Scholar] [CrossRef]
- Xu, Y.; Zhang, B.; Zhou, B.T.; Dong, S.Y.; Yu, L.; Li, R.K. Projected flood risks in China based on CMIP5. Adv. Clim. Chang. Res. 2014, 5, 57–65. [Google Scholar]
- Gu, C.L.; Hu, L.Q.; Zhang, X.M.; Wang, X.D.; Guo, J. Climate change and urbanization in the Yangtze River Delta. Habitat. Int. 2011, 35, 544–552. [Google Scholar] [CrossRef]
- Tellman, B.; Sullivan, J.A.; Kuhn, C.; Kettner, A.J.; Doyle, C.S.; Brakenridge, G.R.; Erickson, D.A.; Slayback, D.A. Satellite imaging reveals increased proportion of population exposed to floods. Nature 2021, 596, 80–86. [Google Scholar] [CrossRef] [PubMed]
- Jongman, B. The fraction of the global population at risk of floods is growing. Nature 2021, 596, 37–38. [Google Scholar] [CrossRef] [PubMed]

Publisher’s Note: MDPI stays neutral with regard to jurisdictional claims in published maps and institutional affiliations. |
© 2021 by the authors. Licensee MDPI, Basel, Switzerland. This article is an open access article distributed under the terms and conditions of the Creative Commons Attribution (CC BY) license (https://creativecommons.org/licenses/by/4.0/).