
Geographic Distribution and Influencing Factor Analysis of Green Residential Buildings in China

Abstract
:1. Introduction
2. Literature Review
3. Data Description and Research Methods
3.1. Data Description
3.2. Research Methods
3.2.1. Spatial Correlation Analysis
3.2.2. Agglomeration Degree Analysis
3.2.3. Influencing Factors Analysis
4. Geographic Distribution and Spatial Correlation of GRBs
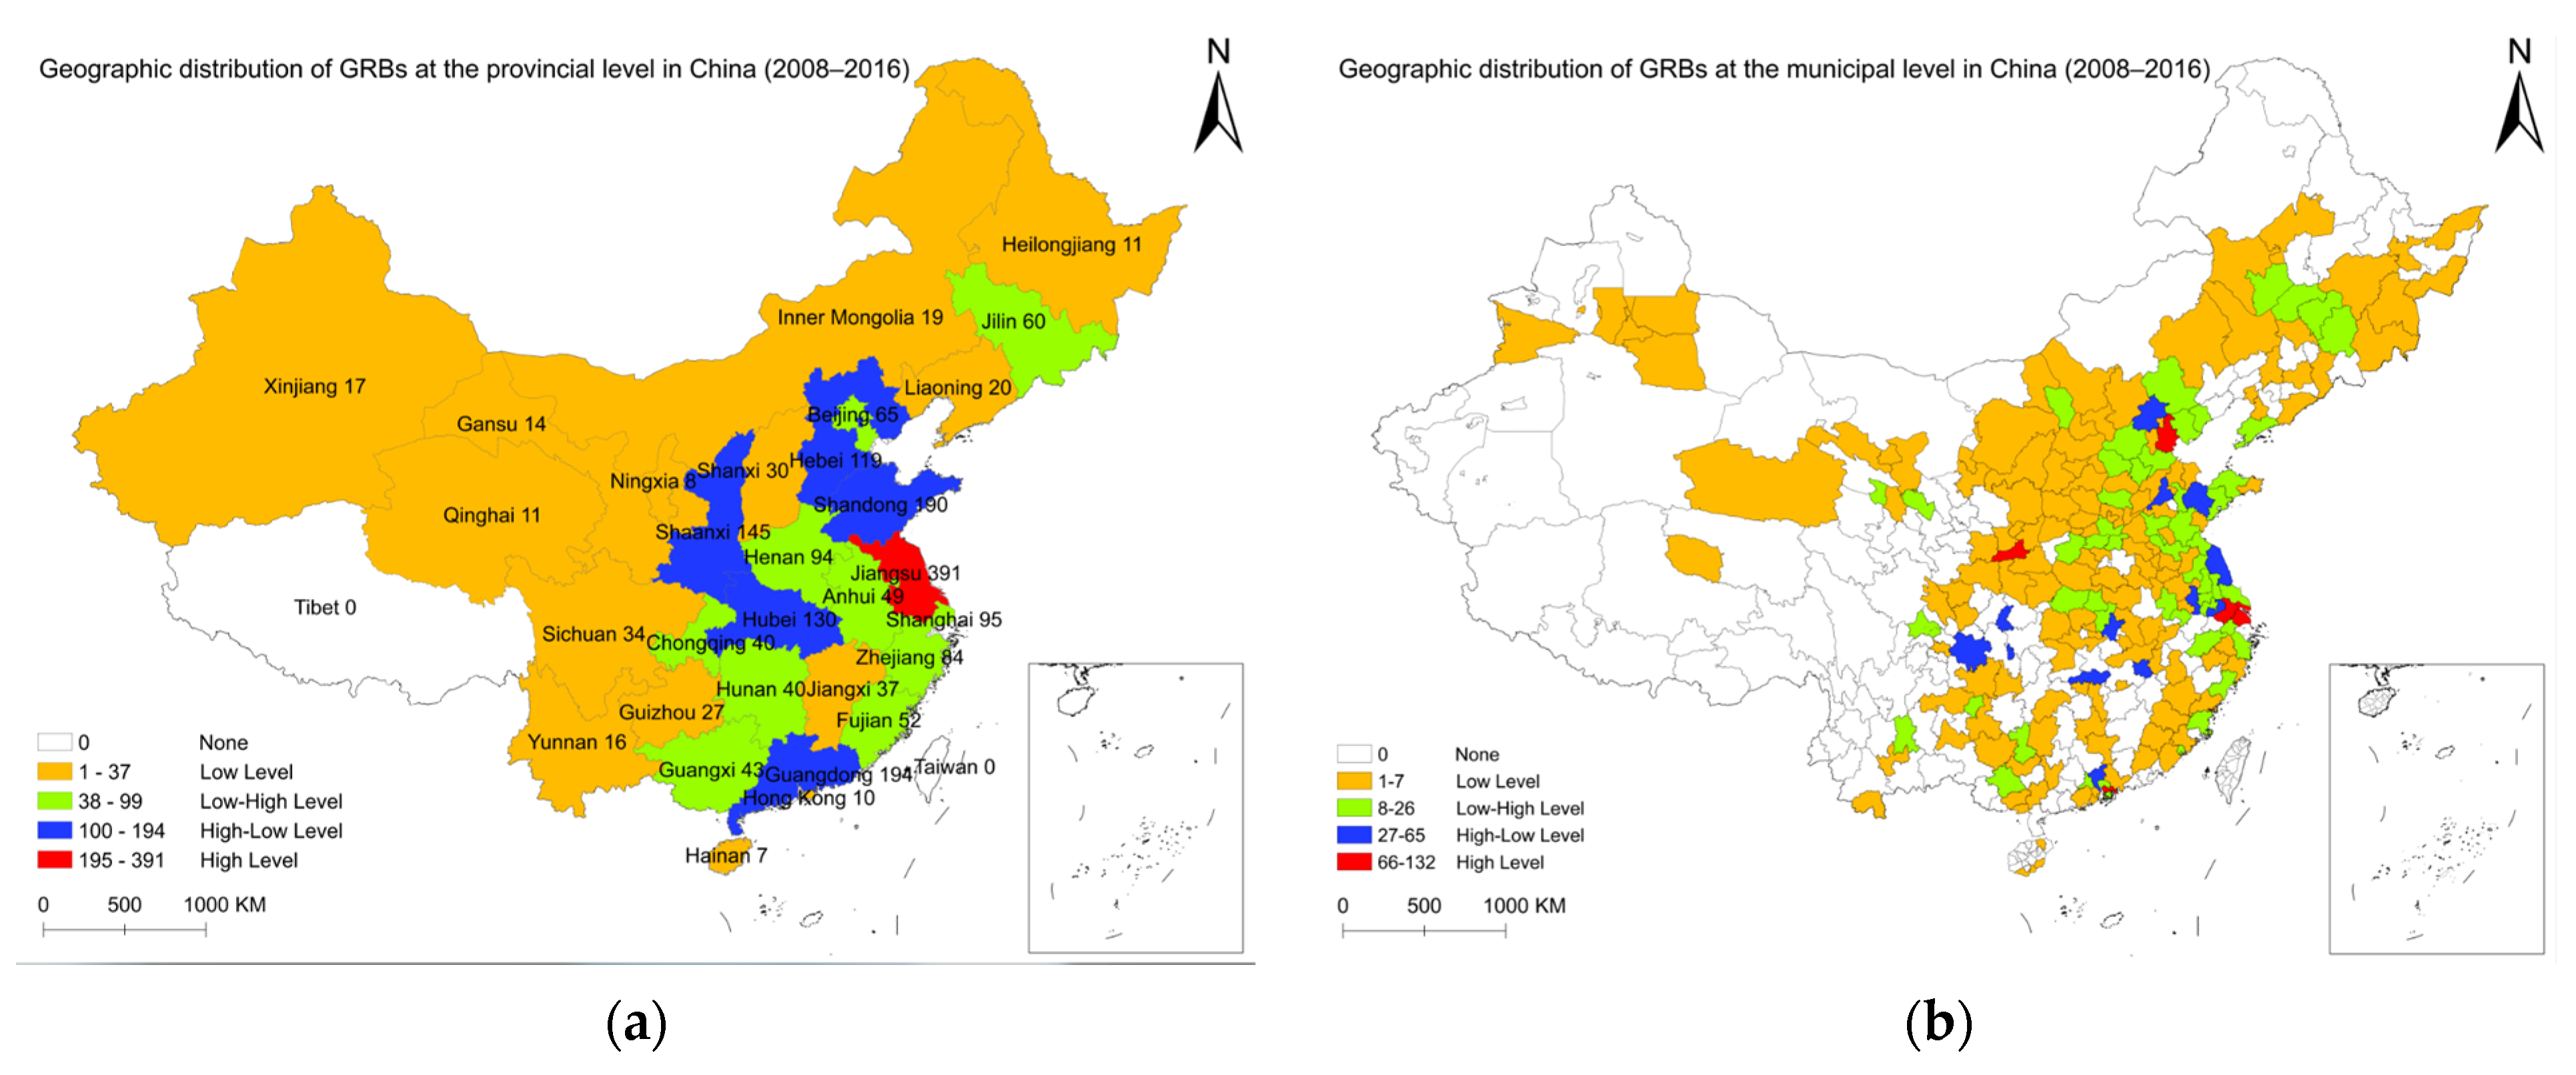
4.1. Geographic Distribution of GRBs
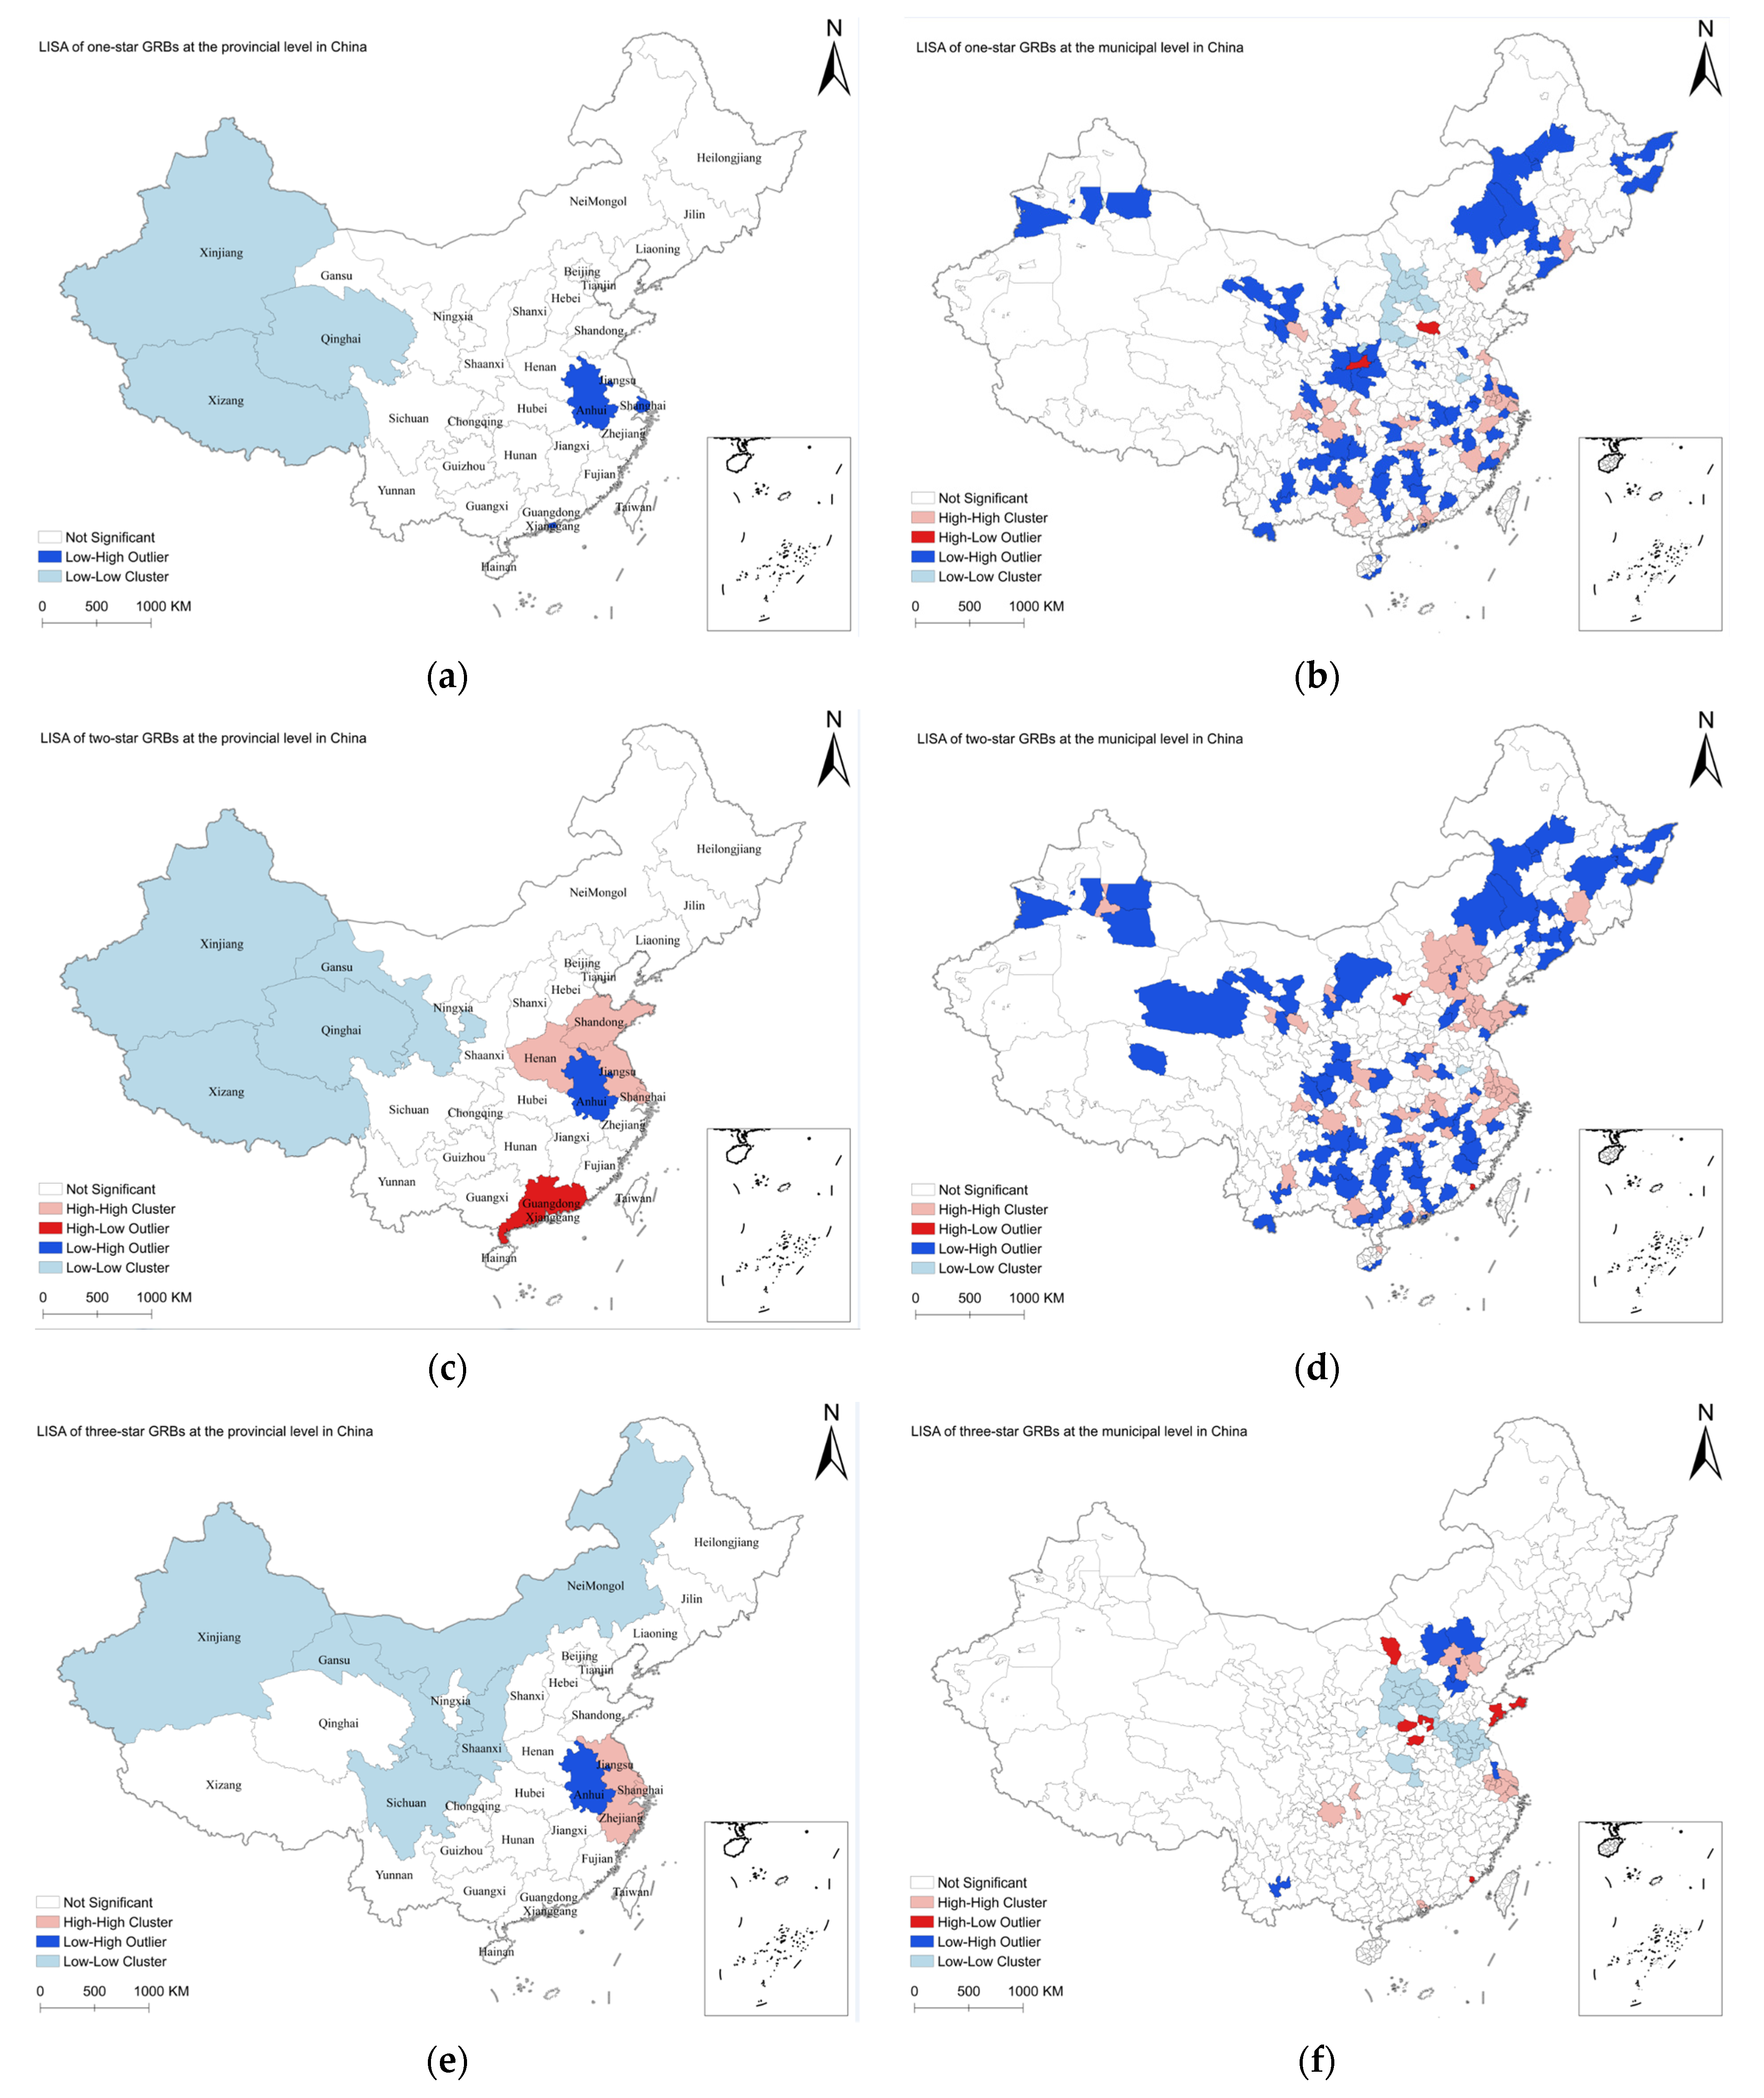
4.2. Spatial Correlation of GRBs’ Distribution
4.3. Agglomeration Degree Analysis of GRBs
5. Influencing Factors of GRBs Development
6. Conclusions
Author Contributions
Funding
Institutional Review Board Statement
Informed Consent Statement
Data Availability Statement
Acknowledgments
Conflicts of Interest
References
- Zhang, X. Green real estate development in China: State of art and prospect agenda—A review. Renew. Sustain. Energy Rev. 2015, 47, 1–13. [Google Scholar] [CrossRef]
- Zou, Y.; Zhao, W.; Zhong, R. The spatial distribution of green buildings in China: Regional imbalance, economic fundamentals, and policy incentives. Appl. Geogr. 2017, 88, 38–47. [Google Scholar] [CrossRef]
- A Statistic National Bureau of China Statistical Yearbook. 2019. Available online: http://www.stats.gov.cn/tjsj/ndsj/2019/indexch.htm (accessed on 19 June 2021).
- China Building Energy Consumption Research Report 2020 Released. Available online: https://cabee.org/site/content/24021.html (accessed on 3 February 2021).
- Kats, G. The Costs and Financial Benefits of Green Buildings: A Report to California’s Sustainable Building Task Force 2003. Available online: http://citeseerx.ist.psu.edu/viewdoc/download;jsessionid=EE14BBCE4C2EF6E6315B38857249245D?doi=10.1.1.174.2149&rep=rep1&type=pdf (accessed on 19 October 2021).
- No, S.; Won, C. Comparative Analysis of Energy Consumption between Green Building Certified and Non-Certified Buildings in Korea. Energies 2020, 13, 1049. [Google Scholar] [CrossRef] [Green Version]
- Look, Green Building So Energy-Saving. Available online: https://c.m.163.com/news/a/G8F4AB2V0518JG8L.html?spss=newsapp (accessed on 19 October 2021).
- Darko, A.; Zhang, C.; Chan, A.P. Drivers for green building: A review of empirical studies. Habitat Int. 2017, 60, 34–49. [Google Scholar] [CrossRef]
- Assessment Standard for Green Building (National Standard of the People’s Republic of China, GB/T 50378-2019). Available online: http://www.mohurd.gov.cn/wjfb/201905/t20190530_240717.html (accessed on 3 September 2021).
- Song, Y.; Li, C.; Zhou, L.; Chen, Y.; Zhang, H. Factors affecting green building development at the municipal level: A cross-sectional study in China. Energy Build. 2021, 231, 110560. [Google Scholar] [CrossRef]
- Teng, J.; Wu, X.; Liu, Y. Status and Suggestion for the Development of Green Certification Projects in China. J. Eng. Manag. 2017, 31, 29–33. [Google Scholar] [CrossRef]
- Qiu, B.; Li, D.; Wu, Z. Study on the Character of Chinese Green Building Spatial Evolution. Urban Stud. 2017, 24, 149. [Google Scholar]
- Hao, T.; Wang, J.; Zhang, Z. Study on Spatial Evolution of Chinese Green Building. In Proceedings of the 2018 14th International Green Building and Building Energy Conservation Conference & New Technology and Products Fair, Zhuhai, China, 2 April 2018; China City Press: Beijing, China, 2018; pp. 266–271. [Google Scholar]
- Li, D. Regional Differences among the Development Models of Green Buildings in China—Based on statistical data from 2006 to 2014. Hous. Sci. 2019, 29, 35–43. [Google Scholar] [CrossRef]
- Annual Report on Green Real Estate Development in China 2020. Available online: http://www.ugreen.cn/newsDetail/10106 (accessed on 3 February 2021).
- Dong, C. Discussion on the Problems and Countermeasures of Green Housing. Constr. Econ. 2013, 363, 87–90. [Google Scholar] [CrossRef]
- Zeng, H. Research on Influential Factors of Developing Green Buildings in Real Estate Enterprises. Master’s Thesis, Zhejiang University, Hangzhou, China, 2013. Available online: https://kns.cnki.net/KCMS/detail/detail.aspx?dbname=CMFD201401&filename=1013341007.nh (accessed on 6 June 2020).
- Wang, L. Study on the Development of Green House in the Perspective of Main Player. Master’s Thesis, Chang’an University, Xi’an, China, 2017. Available online: https://kns.cnki.net/KCMS/detail/detail.aspx?dbname=CMFD201801&filename=1017868740.nh (accessed on 2 March 2021).
- Liu, A. Empirical Research on the Influence of Information and Product Attributes on Consumers’ Green House Purchase Behavior. Master’s Thesis, Xi’an University of Architecture and Technology, Xi’an, China, 2017. [Google Scholar] [CrossRef]
- Geng, X. Study on the Development of Green Residence Based on Game Theory. Master’s Thesis, Qingdao University of Technology, Qingdao, China, 2015. [Google Scholar] [CrossRef]
- Wang, P. Study on Green Building Incentive Countermeasures Based on Evolutionary Game Theory. Master’s Thesis, East China Normal University, Shanghai, China, 2015. Available online: https://kns.cnki.net/KCMS/detail/detail.aspx?dbname=CMFD201502&filename=1015345607.nh (accessed on 2 March 2021).
- Liu, L.Z.; Gu, J. Review of Green Housing Development in China. Shanghai Real Estate 2019, 29–33. [Google Scholar] [CrossRef]
- Lian, S.; Liang, H. Comparative Study on Green Building Development between China and Foreign Countries. Constr. Sci. Technol. 2021, 7580. [Google Scholar] [CrossRef]
- Liu, X.; Li, P. Spatial and Temporal Evolution and Driving Mechanism of Green Building Area in China. Ecol. Econ. 2021, 37, 88–94. [Google Scholar]
- Zhang, L.; Wu, J.; Liu, H. Policies to enhance the drivers of green housing development in China. Energy Policy 2018, 121, 225–235. [Google Scholar] [CrossRef]
- Zhou, Y. State power and environmental initiatives in China: Analyzing China’s green building program through an ecological modernization perspective. Geoforum 2015, 61, 1–12. [Google Scholar] [CrossRef] [Green Version]
- Zhang, Y. Research on the Influencing Factors of Green Residential Certification Willingness of Real Estate Development Enterprises. Master’s Thesis, Xi’an University of Architecture and Technology, Xi’an, China, 2019. [Google Scholar] [CrossRef]
- Chau, C.K.; Tse, M.S.; Chung, K.Y. A choice experiment to estimate the effect of green experience on preferences and willingness-to-pay for green building attributes. Build. Environ. 2010, 45, 2553–2561. [Google Scholar] [CrossRef]
- Darko, A.; Chan, A.P.C. Critical analysis of green building research trend in construction journals. Habitat Int. 2016, 57, 53–63. [Google Scholar] [CrossRef]
- YIP, S.C.T. The Geography of Green Buildings in Chinese Cities. Mod. Urban Res. 2012, 27, 42–48. [Google Scholar]
- Zhang, L. Study on the Driving Mechanism of Green Housing Development in Chinese Cities. Ph.D. Thesis, Tsinghua University, Beijing, China, 2018. [Google Scholar] [CrossRef]
- Jia, Y. Space Difference Measure of Green Building Development in China Based on the Theil Index. Master’s Thesis, Xi’an University of Architecture and Technology, Xi’an, China, 2015. [Google Scholar] [CrossRef]
- Windapo, A.O. Examination of Green Building Drivers in the South African Construction Industry: Economics versus Ecology. Sustainability 2014, 6, 6088–6106. [Google Scholar] [CrossRef] [Green Version]
- Zhang, W. Research on Green Building Industrial Agglomeration Based on the Comparative Advantage of City. Master’s Thesis, Shanghai Normal University, Shanghai, China, 2013. [Google Scholar] [CrossRef]
- Kaza, N.; Lester, T.W.; Rodriguez, D.A. The spatio-temporal clustering of green buildings in the United States. Urban Stud. 2013, 50, 3262–3282. [Google Scholar] [CrossRef]
- Zhao, D.; He, B.; Johnson, C.; Mou, B. Social problems of green buildings: From the humanistic needs to social acceptance. Renew. Sustain. Energy Rev. 2015, 51, 1594–1609. [Google Scholar] [CrossRef]
- Hu, H.; Geertman, S.; Hooimeijer, P. The willingness to pay for green apartments: The case of Nanjing, China. Urban Stud. 2014, 51, 3459–3478. [Google Scholar] [CrossRef]
- Wu, Y.; Xu, R. Green building development in China-based on heat pump demonstration projects. Renew. Energy 2013, 53, 211–219. [Google Scholar] [CrossRef]
- Wu, Z.; Jiang, M.; Cai, Y.; Wang, H.; Li, S. What Hinders the Development of Green Building? An Investigation of China. Int. J. Environ. Res. Public Health 2019, 16, 3140. [Google Scholar] [CrossRef] [PubMed] [Green Version]
- Ma, J.; Cheng, J.C.P. Identification of the numerical patterns behind the leading counties in the U.S. local green building markets using data mining. J. Clean Prod. 2017, 151, 406–418. [Google Scholar] [CrossRef]
- Gao, Y.; Yang, G.; Xie, Q. Spatial-Temporal Evolution and Driving Factors of Green Building Development in China. Sustainability 2020, 12, 2773. [Google Scholar] [CrossRef] [Green Version]
- Qi, G.Y.; Shen, L.Y.; Zeng, S.X.; Jorge, O.J. The drivers for contractors’ green innovation: An industry perspective. J. Clean Prod. 2010, 18, 1358–1365. [Google Scholar] [CrossRef]
- Yang, M.; Hou, P.; Ye, Y. Influencing Factors and Regional Heterogeneity of the Price Premium of High-Star Grade Green Residential Buildings in China: An Empirical Research Based on the Hedonic Model. Huadong Shifan Daxue Xuebao (Humanit Soc. Ed.) 2020, 52, 181–192. [Google Scholar] [CrossRef]
- Darko, A.; Chan, A.P.; Manu, O.; Ameyaw, E.E. Drivers for implementing green building technologies: An international survey of experts. J. Clean Prod. 2017, 145, 386–394. [Google Scholar] [CrossRef] [Green Version]
- Mendes, M.; Pala, A. Type I Error Rate and Power of Three Normality Tests. Int. Technol. J. 2003, 2, 135–139. [Google Scholar] [CrossRef]
- Artusi, R.; Verderio, P.; Marubini, E. Bravais-Pearson and Spearman correlation coefficients: Meaning, Test of hypothesis and confidence interval. Int. J. Biol. Markers 2002, 17, 148–151. [Google Scholar] [CrossRef]
- Shong, N. Pearson’s Versus Spearman’s and Kendall’s Correlation Coefficients for Continuous Data. Master’s Thesis, University of Pittsburgh, Pittsburgh, PA, USA, 2010. Available online: http://d-scholarship.pitt.edu/8056/ (accessed on 17 August 2021).

| Dimension | Code | Factor | Unit | Obs. | Min. | Max. | Mean | K-S Value a |
|---|---|---|---|---|---|---|---|---|
| Economic factors | GDP | Gross domestic product | CNY 100 million | 42 | 955 | 22,523 | 6214.71 | 0.169 *** |
| GPBR | General public budget revenue | CNY 100 million | 42 | 47 | 4422 | 748.36 | 0.227 *** | |
| Social factors | GPBE: ECEP | General public budget expenditure: Energy conservation and environmental protection | CNY 100 million | 42 | 4.66 | 639.45 | 40.3 | 0.389 *** |
| RGAAQ | Rate of good ambient air quality | % | 42 | 52.80% | 98.86% | 77.09% | 0.065 | |
| YRP | Year-end resident population | 10,000 persons | 42 | 209 | 2968 | 854.71 | 0.197 *** | |
| PPPLC | Proportion of permanent population living in cities | % | 42 | 42.89% | 100% | 68.15% | 0.116 | |
| PPRA 15–59 | Proportion of permanent residents aged 15–59 | % | 42 | 42.51% | 83.28% | 69.36% | 0.206 *** | |
| UHPCDIR | Urban households per capita, disposable income of the residents | CNY | 42 | 20,130 | 44,353 | 29,643.52 | 0.13 * | |
| UHPCFSH | Urban households per capita, floor space of houses | sq. m | 42 | 22.9 | 40.5 | 32.32 | 0.06 | |
| NGIHE | Number of general institutions of higher education | spot | 42 | 6 | 90 | 35.35 | 0.115 | |
| PPREU | Proportion of permanent residents with education above university level | % | 42 | 8.96% | 36.74% | 20.42% | 0.076 | |
| Real-estate market factors | IRED: RB | Investment in real-estate development: residential buildings | CNY 100 million | 42 | 65 | 1920 | 665.02 | 0.139 ** |
| CRB: CNA | Commercial residential buildings: Construction area | 10,000 sq. m | 42 | 998 | 17,646 | 4501.11 | 0.168 *** | |
| CRB: NCA | Commercial residential buildings: New commenced area | 10,000 sq. m | 42 | 275 | 4137 | 1138.51 | 0.163 *** | |
| CRB: CMA | Commercial residential buildings: Completion area | 10,000 sq. m | 42 | 169 | 2900 | 726.14 | 0.161 *** | |
| CRB: SA | Commercial residential buildings: Sale area | 10,000 sq. m | 42 | 198 | 4360 | 999.86 | 0.167 *** | |
| COV | Cross output value of construction industry | CNY 100 million | 42 | 120 | 7254 | 1858.39 | 0.155 ** | |
| CRB: P | Commercial residential buildings: Price | CNY/sq. m | 42 | 2517 | 30,956 | 9946.88 | 0.264 *** |
| Grade | Provincial Level | Municipal Level | ||||||
|---|---|---|---|---|---|---|---|---|
| Moran’s I | Z-Score | p-Value | Pattern | Moran’s I | Z-Score | p-Value | Pattern | |
| One-star | −0.022 | 0.082 | 0.935 | Random | −0.037 | −0.695 | 0.487 | Random |
| Two-star | 0.327 | 3.746 | 0 * | Clustered | 0.112 | 2.224 | 0.026 | Clustered |
| Three-star | 0.294 | 3.338 | 0 * | Clustered | 0.156 | 3.197 | 0 * | Clustered |
| Province | Leading City | CR1 | CR2 | CR3 | CR4 |
|---|---|---|---|---|---|
| Jiangsu | Suzhou, Nanjing | 34.76% | 53.22% | 64.38% | 72.1% |
| Guangdong | Shenzhen, Guangzhou | 47.17% | 79.25% | 86.79% | 94.34% |
| Shaanxi | Xi’an, Xianyang | 37.5% | 56.25% | 70.31% | 84.38% |
| Shandong | Jinan, Weifang, Yantai | 25.85% | 44.22% | 53.74% | 61.9% |
| Hubei | Wuhan, Suizhou | 40.91% | 56.06% | 69.7% | 77.27% |
| Zhejiang | Ningbo, Hangzhou | 41.46% | 75.61% | 92.68% | 96.34% |
| Hebei | Shijiazhuang, Baoding | 24.69% | 39.51% | 50.62% | 61.73% |
| Henan | Luoyang, Zhengzhou, Xinxiang | 28.79% | 42.42% | 56.06% | 65.15% |
| Fujian | Xiamen, Fuzhou | 50% | 88.89% | 94.44% | 100% |
| Hunan | Changsha | 84.62% | 92.31% | 100% | |
| Guangxi | Nanning | 57.14% | 76.19% | 90.48% | 95.24% |
| Anhui | Hefei, Wuhu | 34.62% | 65.38% | 73.08% | 80.77% |
| Jilin | Changchun | 48.48% | 66.67% | 84.85% | 100% |
| Jiangxi | Nanchang | 63.64% | 90.91% | 100% | |
| Shanxi | Yuncheng, Taiyuan, Changzhi | 23.81% | 42.86% | 57.14% | 66.67% |
| Sichuan | Chengdu | 100% | |||
| Guizhou | Guiyang | 100% | |||
| Liaoning | Shenyang, Dalian | 44.44% | 88.89% | 100% | |
| Yunnan | Kunming | 93.33% | 100% | ||
| Gansu | Lanzhou | 100% | |||
| Inner Mongolia | Hohhot | 58.33% | 75% | 91.67% | 100% |
| Heilongjiang | Harbin | 100% | |||
| Hainan | Haikou | 50% | 66.67% | 83.33% | 100% |
| Xinjiang | Urumqi | 35.29% | 64.71% | 76.47% | 88.24% |
| Qinghai | Xining | 70% | 90% | 100% | |
| Ningxia | Yinchuan | 83.33% | 100% |
| Variable | Two-Star Count | Three-Star Count | ||
|---|---|---|---|---|
| ρ-Value | p-Value | ρ-Value | p-Value | |
| GDP | 0.52 *** | 0 | 0.639 *** | 0 |
| GPBR | 0.454 *** | 0.003 | 0.674 *** | 0 |
| GPBE: ECEP | 0.591 *** | 0 | 0.54 *** | 0 |
| RGAAQ | −0.35 3 ** | 0.022 | 0.105 | 0.509 |
| YRP | 0.585 *** | 0 | 0.481 *** | 0.001 |
| PPPLC | 0.077 | 0.627 | 0.464 *** | 0.002 |
| PPRA 15–59 | 0.091 | 0.569 | 0.525 *** | 0 |
| UHPCDIR | 0.373 ** | 0.015 | 0.654 *** | 0 |
| UHPCFSH | 0.328 ** | 0.034 | 0.028 | 0.858 |
| NGIHE | 0.215 | 0.172 | 0.497 *** | 0.001 |
| PPREU | 0.046 | 0.775 | 0.406 *** | 0.008 |
| IRED: RB | 0.428 *** | 0.005 | 0.566 *** | 0 |
| CRB: CNA | 0.399 *** | 0.009 | 0.441 *** | 0.003 |
| CRB: NCA | 0.418 *** | 0.006 | 0.425 *** | 0.005 |
| CRB: CMA | 0.422 *** | 0.005 | 0.468 *** | 0.002 |
| CRB: SA | 0.421 *** | 0.005 | 0.48 *** | 0.001 |
| COV | 0.408 *** | 0.007 | 0.619 *** | 0 |
| CRB: P | 0.142 | 0.368 | 0.662 *** | 0 |
Publisher’s Note: MDPI stays neutral with regard to jurisdictional claims in published maps and institutional affiliations. |
© 2021 by the authors. Licensee MDPI, Basel, Switzerland. This article is an open access article distributed under the terms and conditions of the Creative Commons Attribution (CC BY) license (https://creativecommons.org/licenses/by/4.0/).
Share and Cite
Guo, K.; Yuan, Y. Geographic Distribution and Influencing Factor Analysis of Green Residential Buildings in China. Sustainability 2021, 13, 12060. https://doi.org/10.3390/su132112060
Guo K, Yuan Y. Geographic Distribution and Influencing Factor Analysis of Green Residential Buildings in China. Sustainability. 2021; 13(21):12060. https://doi.org/10.3390/su132112060
Chicago/Turabian StyleGuo, Ke, and Yongbo Yuan. 2021. "Geographic Distribution and Influencing Factor Analysis of Green Residential Buildings in China" Sustainability 13, no. 21: 12060. https://doi.org/10.3390/su132112060
APA StyleGuo, K., & Yuan, Y. (2021). Geographic Distribution and Influencing Factor Analysis of Green Residential Buildings in China. Sustainability, 13(21), 12060. https://doi.org/10.3390/su132112060