Abstract
Air pollution is fatal. Fine particles, such as PM2.5, in ambient air might be the cause of many physical and psychological disorders, including cognitive decline. This is why educational policymakers are adopting sustainable mobility, and other policy measures, to make their campuses carbon-neutral; however, car-dependent cities and their university campuses are still lagging behind in this area. This study attempts to model the spatial heterogeneity and determinants of PM2.5 at the King Abdulaziz University campus in Jeddah, which is ranked first among the Saudi Arabian universities, as well as in the MENA region. We developed four OLS and GWR models of different peak and off-peak periods during weekdays in order to estimate the determinants of the PM2.5 concentration. The number of cars, humidity, temperature, windspeed, distance from trees, and construction sites were the estimators in our analysis. Because of a lack of secondary data at a finer scale, we collected the samples of all dependent and independent variables at 51 locations on the KAU campus. Model selection was based on RSS, log-likelihood, adjusted R2, and AICc, and a modal comparison shows that the GWR variant of Model-2 outperformed the other models. The results of the GWR model demonstrate the geographical variability of the PM2.5 concentration on the KAU campus, to which the volume of car traffic is the key contributor. Hence, we recommend using the results of this study to support the development of a car-free and zero-carbon campus at KAU; furthermore, this study could be exploited by other campuses in Saudi Arabia and the Gulf region.
1. Introduction
Contaminated air is an issue of serious concern worldwide and causes one out of every nine deaths. It is also frightening to consider that exposure to PM2.5 has lowered the average life expectancy by one year, according to 2016 data [1]. The UNEP data further shows that fine particle pollution caused 17,795 deaths in 2019; this can be translated into 500 fatalities per 1 million people. There is no doubt that clean air is a boon for public health and an essential prerequisite for the healthy living of all human beings [2]. There are many root causes of air pollution, including several voluntary and nonvoluntary human activities, such as fossil-fuel-based vehicular transportation, manufacturing, and construction [3]. Furthermore, rapid urbanization and population growth have made the problem of air pollution even worse in both developed and developing countries [4,5,6]. Automobiles are the major source of fine particle air pollution—a study in Sao Paulo confirmed that a trucker’s strike was associated with potential economic and health benefits [7]. A study in Mexico showed that people living in spatial proximity to high-traffic roads are highly exposed to traffic-related air pollution, which is a matter of grave concern for urban planners and public health professionals, while another study in Santiago, Chile, identified three distinct episodes of fine particle air pollution, which is helpful in the mitigation of PM2.5 and PM10 pollutants in urban settings [8,9].
In the past few decades, several studies, including those of Englert [10] and Valavanidis et al. [11], have confirmed that air pollution damages the physical and neurological health of urban residents, increases economic costs, and aggravates the unpleasant impacts of climate change. According to the EPA [12], outdoor air pollution encompasses a diverse blend of chemical, physical, and biological substances; however, this study considers solely the concentration of PM2.5 (fine particles with a diameter of less than 2.5 μm), as these fine particles pose serious threats to human health.
University campuses worldwide are faced with fine particle pollution, mainly PM2.5, and this is negatively affecting the health of university attendants [13,14]. We chose King Abdulaziz University (KAU) campus for our study for two reasons: firstly, the university mimics a small city and, secondly, campuses are a hub of innovation and sustainable development. In addition, universities have realized that pollution and resource consumption have increased on their campuses and in classrooms in the past few decades. This has compelled university administrations to consider devoting their best efforts to achieving sustainability in their indoor and outdoor environments [15,16].
Although several studies have modeled the determinant factors of PM2.5 levels and their spatial heterogeneity through GWR, there is a lack of studies performed at the micro level of the local geographical region, particularly at the level of a university campus. This gap is due to the unavailability of fine data at micro geographical scales, such as university campuses. Therefore, this study attempts to model the spatial distribution and determinants of PM2.5 at the campus of King Abdulaziz University, utilizing primary data collected by the authors. This paper is further organized into the following sections: Literature Review, Material and Methods, Results, Discussions, and Conclusions.
2. Literature Review
2.1. Health Consequences of Particulate Matter (PM2.5)
A number of epidemiological studies have been carried out to date demonstrating the impacts of deteriorated ambient air quality on human health, although the health effects of fine particulate matter depend on four factors: the source and composition of particulate matter, the time of exposure, its depth of travel inside the human body, and the age of the affected person. Persistent exposure to human-induced PM2.5 is positively associated with a series of pulmonary and cardiovascular diseases. For instance, in children, chronic exposure to PM2.5 poses risks for acute lung respiratory infections (ALRI), while in adults, it can generate chronic obstructive pulmonary disease (COPD), ischemic heart disease (IHD), cardiopulmonary disorders, lung cancer, and stroke [17,18,19]. Pope et al. [20] highlight that there is a 4–6% increased risk of cardiovascular and lung cancer mortality with each 10 mg/m3 increase in fine particulate matter in the air.
Ambient air pollutants might not only harm physical health, but can also cause damage to people’s nervous systems and cognitive abilities, leading to neurological disorders of different magnitudes, ranging from headaches and migraines, to strokes and various types of dementia [21]. In addition, a few studies have stated that the PM2.5 in the air contains certain neurotoxicants that can either produce or accelerate neurodegenerative diseases related to cognitive decline, schizophrenia, and brain damage. These studies strongly suggest that persistent exposure to the fine particulate matters present in ambient air might harm the central nervous system [22,23,24,25,26]. A recent study by Ranzani et al. [27] reported that adult human lungs have the capacity to purify 10,000 liters of air daily; however, increasing levels of pollutants could reduce immunity, resulting in increased inflammation and poor bone health.
2.2. Campus Response to Challenges of Poor Ambient Air Quality
Educational administrators have launched several initiatives to tackle toxic particulate matter and the other pollutants present in ambient air. The low-carbon campus project at the Massachusetts Institute of Technology [28] is an endeavor of the MIT Office of Sustainability (MITOS) to establish a healthy and low-carbon campus by exploiting the competence and experience of prestigious MIT alumni to create the testbed for expandable solutions. Four core components were explored to accomplish the goal of carbon neutrality at the MIT campus, including mobility, building, climate, and energy. Under the mobility theme, the students, faculty, and staff members of MIT are encouraged to select flexible, affordable, and low-impact modes of transportation, including walking and bicycle riding, with only a small number of members commuting by car.
Similarly, the University of Leeds [29] launched a living lab for their air quality project in 2017 that uses the inhouse air quality and pollution to enhance the environment and health of the community’s members. The living lab regularly helps to diminish emissions from vehicles and curb exposure to poor air quality. In a recent related project, the Institute for Transport Studies has been investigating pollution exposure to university staff, faculty, and students via commuter routes. Volunteers carry air quality monitoring devices while walking, using public transport, or driving; the results are used to make comparisons on the levels of pollution exposure between different transport modes and routes.
It is also noteworthy that smoking emits 10 times more air pollutants into the ambient air than a car. The smoking of one cigarette daily produces an equivalent PM2.5 level of 22 μg/m3 [30,31]. Considering this, universities, including KAU [32], have formulated strategies to create smoking-free campuses. In compliance with the Smoke Free Environments Act, 1990, of New Zeeland, which prohibits smoking in workplaces, Lincoln University [33] accepted the “Clean Air Policy”, aimed at providing a healthy and safe smoke-free working and learning environment on their campus.
Moreover, universities in developing economies are the worst affected by PM2.5 exposure and are struggling to transform their campuses towards carbon neutrality. According to Express Web Desk [34], the University of Hyderabad in India has recently introduced e-rickshaw services on weekdays from 8:00 a.m. to 6:00 p.m. This affordable (USD 0.14 per trip) and zero-emission commuting service might improve ambient air quality inside the university campus. Some other universities are trying to increase awareness about air pollution by disseminating and displaying information on air quality. The Central University of Columbia at Bogota has established an Air Quality Monitoring Network (Red de monitoreo de calidad del aire) that is equipped with low-cost sensors and Internet of Things technology [35]. The Times News Network [36] reported on Punjab University at Chandigarh (India) as an excellent example of this, as they have set up a Continuous Ambient Air Quality Monitoring Station (CAAQMS) that offers hourly data in real time. Air quality information is thus available to everyone through large electronic display panels. Xi’an Jiao Tong University in China is transforming its campus into a green energy-fueled smart campus, aiming to enhance ambient air quality for the academic community [37].
Furthermore, Monash University [38] has suggested that a future without change will be dismal; on the dangers of air pollution, they state, “We don’t believe in a future where people can’t go outside”.
If the current trends of air pollution continue, then breathing in ambient oxygen might significantly risk the health of people. The Monash Climate and Air Quality Research Group (CARE) maintain that the fine-particulate matter in ambient air can significantly accelerate the risk of miscarriage among pregnant women, and the group also found a robust association between air pollution and autism. In their plan to combat air pollution, Monash set the goal of attaining net zero emissions on Australian campuses by 2030. In Canada, the University of Victoria [39] has developed a Campus Cycling Plan to make their campus bicycle-friendly, with the goal of maximizing cycling, walking, public transit use, and carpooling up to 70% by expanding facilities for cycling by 10%. To promote bicycle riding in and around the campus, the university plans to improve the cycling network, the safety of bike-users in shared spaces, bicycle parking, bicycle sharing, and end-of-trip amenities for users of all age groups.
The Surgeon General [40] of the USA has urged American universities to construct walkable campuses, suggesting that walking is a win–win strategy for community health, as increased physical activity offers significant health benefits. Bopp, Kaczynski, and Wittman [41] suggest that colleges and universities should become the ultimate locations for walking. Policies related to walkable campuses may not only inspire students, faculty members, and personnel to embrace active living, but may also encourage students to consider future roles as public health professionals, urban planners, urban designers, transport planners, and architects. Stevens [42] reported that the University of Kentucky has installed a large amount of signage on their campus, with QR codes in collaboration with the WALK [Your City] app, which helps university students approximate the time required for traveling by foot as an alternative to driving. This also helps university researchers in their investigations into how university attendees use information technology to plan their day. Scott et al. [43] state that Canadian universities are working to make their campuses car-free. The University of British Columbia [39] has been successfully implementing its Transport Strategic Plan (TSP) since 1999 (reviewed in 2005). UBC has a large cycling and pedestrian network and is aspiring towards sustainable campus transit by 2040.
2.3. PM2.5 Modeling and Geographically Weighted Regression
Several studies before now have investigated the spatial heterogeneity and spatial dependence of PM2.5 on the associated socioeconomic and environmental factors, using geographically weighted regression (GWR). GWR permits the exploration of spatially varying relationships [44]. Nearly all the studies have validated that GWR addresses the implicit spatial attributes of PM2.5 data, and improves upon the outcomes offered by traditional OLS regression, which is nonspatial in nature [45].
Lin et al. [46] emphasize the urban green belt area, population density, and economic growth as the key factors affecting the concentration of PM2.5 in Chinese cities. Guan et al. [47] stressed that China’s foreign trade is responsible for most of the PM2.5 pollution. According to Hao and Liu [48], motor vehicles and industrial activities are the factors of PM2.5 exposure. Zhang et al. [49] deployed the enhanced vegetation index (EVI) with GWR, and concluded that meteorological parameters, together with fused aerosol optical depth (AOD) products, explain nearly 87% of the spatial variance in PM2.5 concentrations. Similarly, Pateraki et al. [50] concluded that humidity and temperature fluctuations were strongly correlated with PM2.5 concentration, while Onat and Stakeeva [51] affirmed that accelerated wind speed (>2m/s) might significantly lower the intensity of PM2.5.
In recent years, researchers have frequently used GWR models to understand PM2.5 exposure in various cities and regions. Through a generalized additive model (GAM), He and Lin [52] confirmed that the PM2.5 concentration change in Nanjing was strongly correlated with air pressure, water vapor pressure, and temperature. The seasonal and daily variability in PM2.5 levels was modeled by several spatial scientists in the Yangtze River delta region via GWR, while the spatiotemporal mapping of fine particle concentrations in mainland China was carried out by combining Bayesian maximum entropy (BME) with GWR [53,54].
Many types of GWR models have been effectively employed to quantify the spatiotemporal heterogeneity of PM2.5 pollution in Chinese cities. Zhai et al. [55] developed an enhanced-subset regression model, which combines Principal Component Analysis (PCA) and GWR to predict the independent variables responsible for spatial variations in the levels of PM2.5. Hajiloo, Hamzeh, and Gheysari [56] developed models to understand the impacts of metrological and environmental parameters on the intensity of PM2.5 using satellite data and GWR analysis. Other GWR-based studies by Cheng et al. [57], Dong et al. [58], and Lou et al. [59] demonstrated the various determinant factors responsible for the geographical heterogeneity of PM2.5.
A recent study by Gu et al. [60] suggested that PM2.5 increases in Chinese cities are positively associated with people’s income; growths in income in certain geographical areas have aggravated PM2.5 emissions. Wang and Wang [61] observed that the density of the population, the proportions of industrial land uses, car ridership, and the amount of foreign direct investment (FDI) all contribute significantly to the level of PM2.5, and show qualities of spatial heterogeneity. There were also significant variations in the levels of influence of these factors between different time periods and locations.
3. Material and Methods
3.1. Study Area
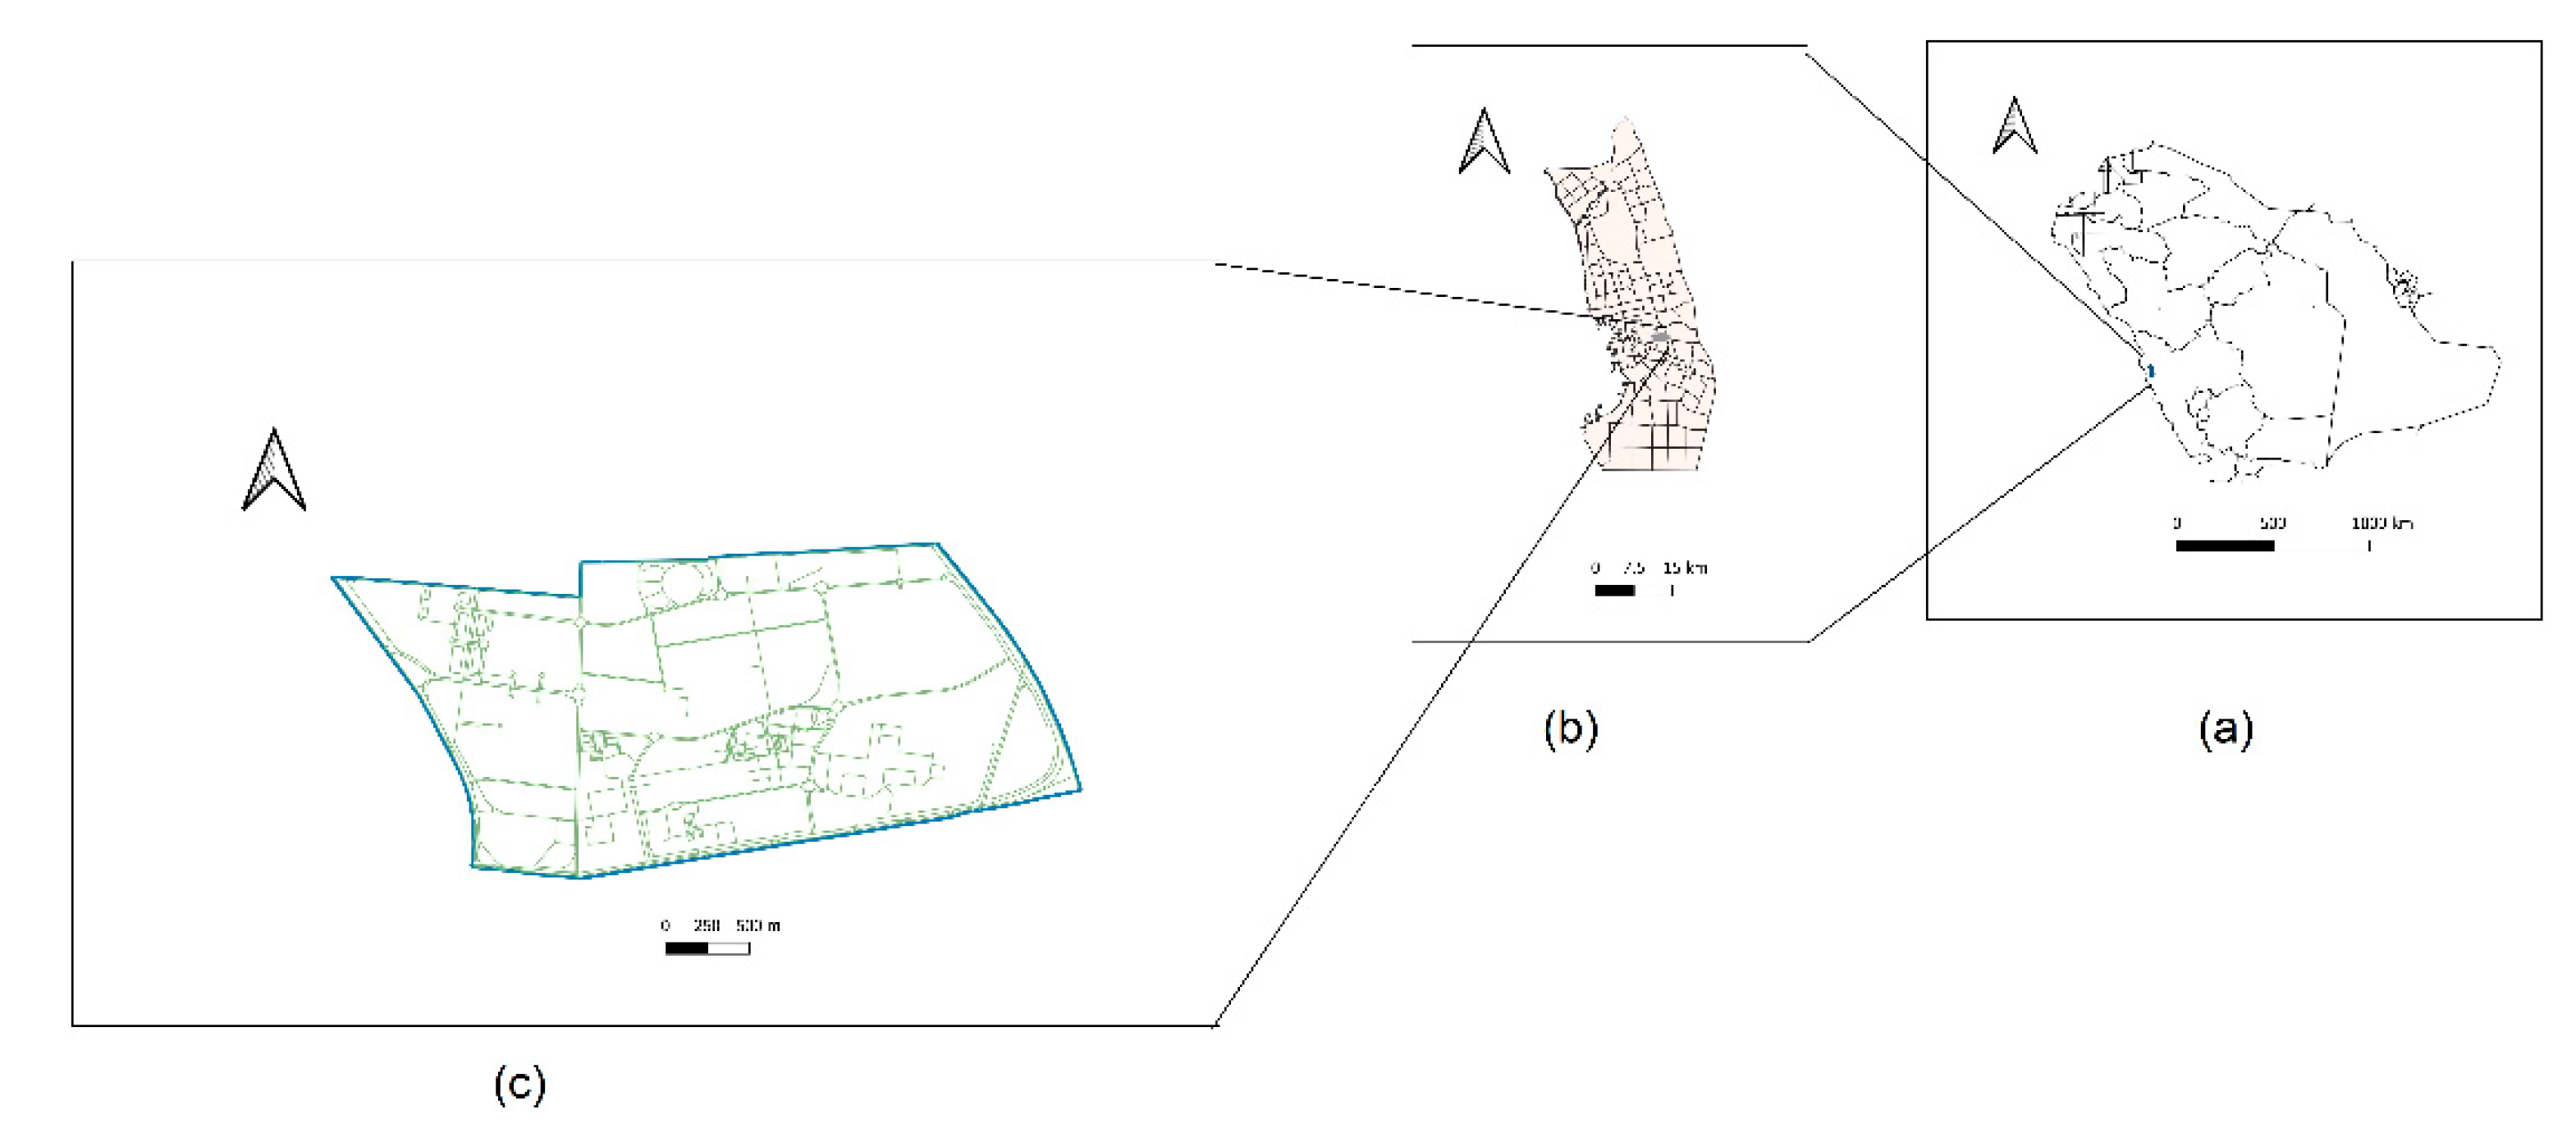
King Abdulaziz University, Jeddah, is a renowned public university in Saudi Arabia. The main campus of the university is situated between Prince Majid Road and Al-Haramin Expressway, spread over 6.35 square kilometers (Figure 1). It was set up in 1964 as a private university and, later, in 1974, became a public university by royal order. There are 77,000 full time students in the university at present, with 4059 academic faculty staff members, 4000 administrative staff members, and an additional 4200 support staff. The Vice Presidency for Projects KAU data show that the number of total daily trips through all six gates is approximately 56,000 during the academic semester.
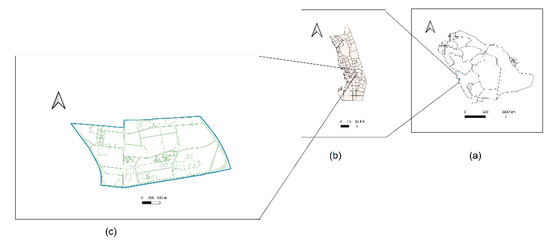
Figure 1.
Location of study area: (a) Kingdom of Saudi Arabia; (b) Jeddah City; and (c) King Abdulaziz University campus.
The university has five main gates through which one can enter and exit the campus and sample locations near these gates capture the attributes of adjacent districts. In the north, where Gates no. 2, 3 and 4 are located, the Al-Sulaymaniyah district is residential. The Al-Jamia district is in the south; it is residential, with some commercial streets, and is accessed via Gate no.6. The main gate, or Gate no. 1 (The Eagle Gate), opens into the west towards Al-Fahya district, which is also residential with some commercial streets. Gate no. 5 opens onto a service road next to Al-Haramin highway (Abruq Ar Rughama district) in the east. More than 90% of the traffic around the campus is directed towards or away from the university.
3.2. Methods
We chose our independent variables from previous studies that are relevant to the KAU campus, including the number of cars, the windspeed, the temperature, the humidity, distance from trees, and distance from construction sites [46,56,61]. In addition to the dependent variable, PM2.5, the data on the independent variables were collected at 51 locations inside the KAU campus, including the six entry and exit gates. The sampling period was from 29 September 2019 to 31 October 2019, with four distinct time points during weekdays (from Sunday to Thursday), inclusive of both peak and nonpeak traffic, and hourly data were recorded at 7 a.m., 9 a.m., 11 a.m., and 2 p.m. All of the independent variables were tested for multicollinearity. To ensure the representativeness of the sample locations, we employed the stratified random sampling technique in the QGIS environment, which has been found to be reliable in numerous ecological studies [62].
Multicollinearity may adversely affect the quality of estimators in a GWR model; hence, the detection of multicollinearity is a prerequisite when developing statistical models. The variance inflation factor (VIF) is a popular measure for detecting multicollinearity among independent variables [63]. We confirmed the absence of multicollinearity, as the VIF value for each predictor among the parameters was lower than 4 [64] (Table 1).

Table 1.
VIF and descriptive statistics for the variables.
Thereafter, four OLS and GWR models were developed to assess the contributory factors for the PM2.5 concentration on the KAU campus.
Ordinary least squares (OLS) is a linear least squares method for assessing the unknown parameters in a linear regression model. The OLS equation could be expressed as:
where m is the total number of predictors, while n denotes the number of observations, βi shows the coefficient to be estimated, and εi is used for random errors.
A GWR model is a special type of regression model that considers geographically varying parameters. The GWR4 software was used to calibrate the GWR models [65]. A conventional GWR equation is:
where yi, xki, and εi are the dependent variable, the kth independent variable, and the Gaussian error at location i, respectively; (ui,vi) is the x–y coordinate of the ith location; and the coefficients, βk (ui,vi), are the varying conditionals for the location.
yi= Σk βk (ui,vi) xki + εi
We developed four models to understand the spatial variability and the determinants of PM2.5 at the KAU campus. The OLS and GWR alternatives of each model were compared to choose the best fit, as suggested by Grekousis [64].
To test the significance of the regression coefficient in our models, we used a t-test under the set of assumptions called the Gauss–Markov conditions [66]. The equation for the t-scores is:
where t is the t-score for the regression estimate, β1, and S is the standard error. The null hypothesis for the t-test states that the t-score for the regression coefficient β1 is 0. For better visualization of the local t-scores (and local R2), we drew Voronoi polygons around sample locations. In general, Voronoi or Thiessen polygons help in mapping the influence area of an individual data point [67].
AICc estimates prediction errors. By default, GWR 4 facilitates comparisons of the relative quality of statistical models for a given dataset.
4. Results
4.1. OLS and GWR Regression Results
As mentioned earlier, we developed four different geographically weighted regression models to understand the key predictors that explain the levels of PM2.5 in the ambient air of the KAU campus.
The results of the OLS regression and GWR are summarized in Table 2, Table 3, Table 4, Table 5 and Table 6. The results in all four models are quite similar. However, the GWR models performed better than the OLS regression models.
Table 2.
OLS and GWR estimates (Model-1).
Table 3.
OLS and GWR estimates (Model-2).
Table 4.
OLS and GWR estimates (Model-3).
Table 5.
OLS and GWR estimates (Model-4).
Table 6.
Goodness of fit comparison for all four OLS and GWR models.
The results of Model-1 reveal that the two environmental parameters of wind speed and temperature, along with the distances from trees and construction sites, were not significant (p-value > 0.5) in either the OLS or GWR models (Table 2). The OLS results indicate that the number of cars and the humidity were significant predictors (p-value ≤ 0.5) in Model-1. Additionally, the regression coefficient suggests that a 1 unit increase in the number of cars increases the PM2.5 concentration by 0.915 units, and a 1 unit increase in humidity decreases the PM2.5 concentration by 0.122 units. The GWR models show that humidity was a significant parameter at 29.41% of the locations with a negative sign (Figure 2), while the number of cars was a significant predictor at 100% of the locations with a positive sign (Figure 3a).
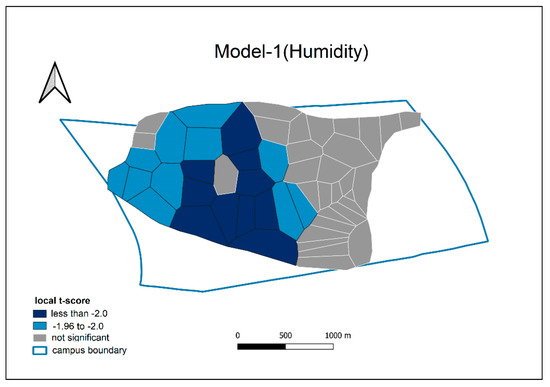
Figure 2.
Local t-scores for humidity in Model-1 (GWR).
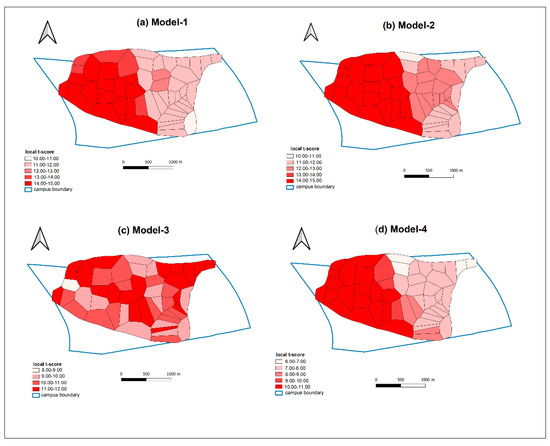
Figure 3.
Local t-scores for numbers of cars in GWR models (a) Model-1, (b) Model-2, (c) Model-3, and (d) Model-4 (all t-scores are significant because of t-values > 1.96).
The results of Models -2, -3, and -4 were not very dissimilar; however, the number of cars was the sole significant predictor (p-value ≤ 0.5) in all three models, while other parameters were found to be statically insignificant (p-value >0.5) in both the OLS and GWR models (Table 3, Table 4 and Table 5).
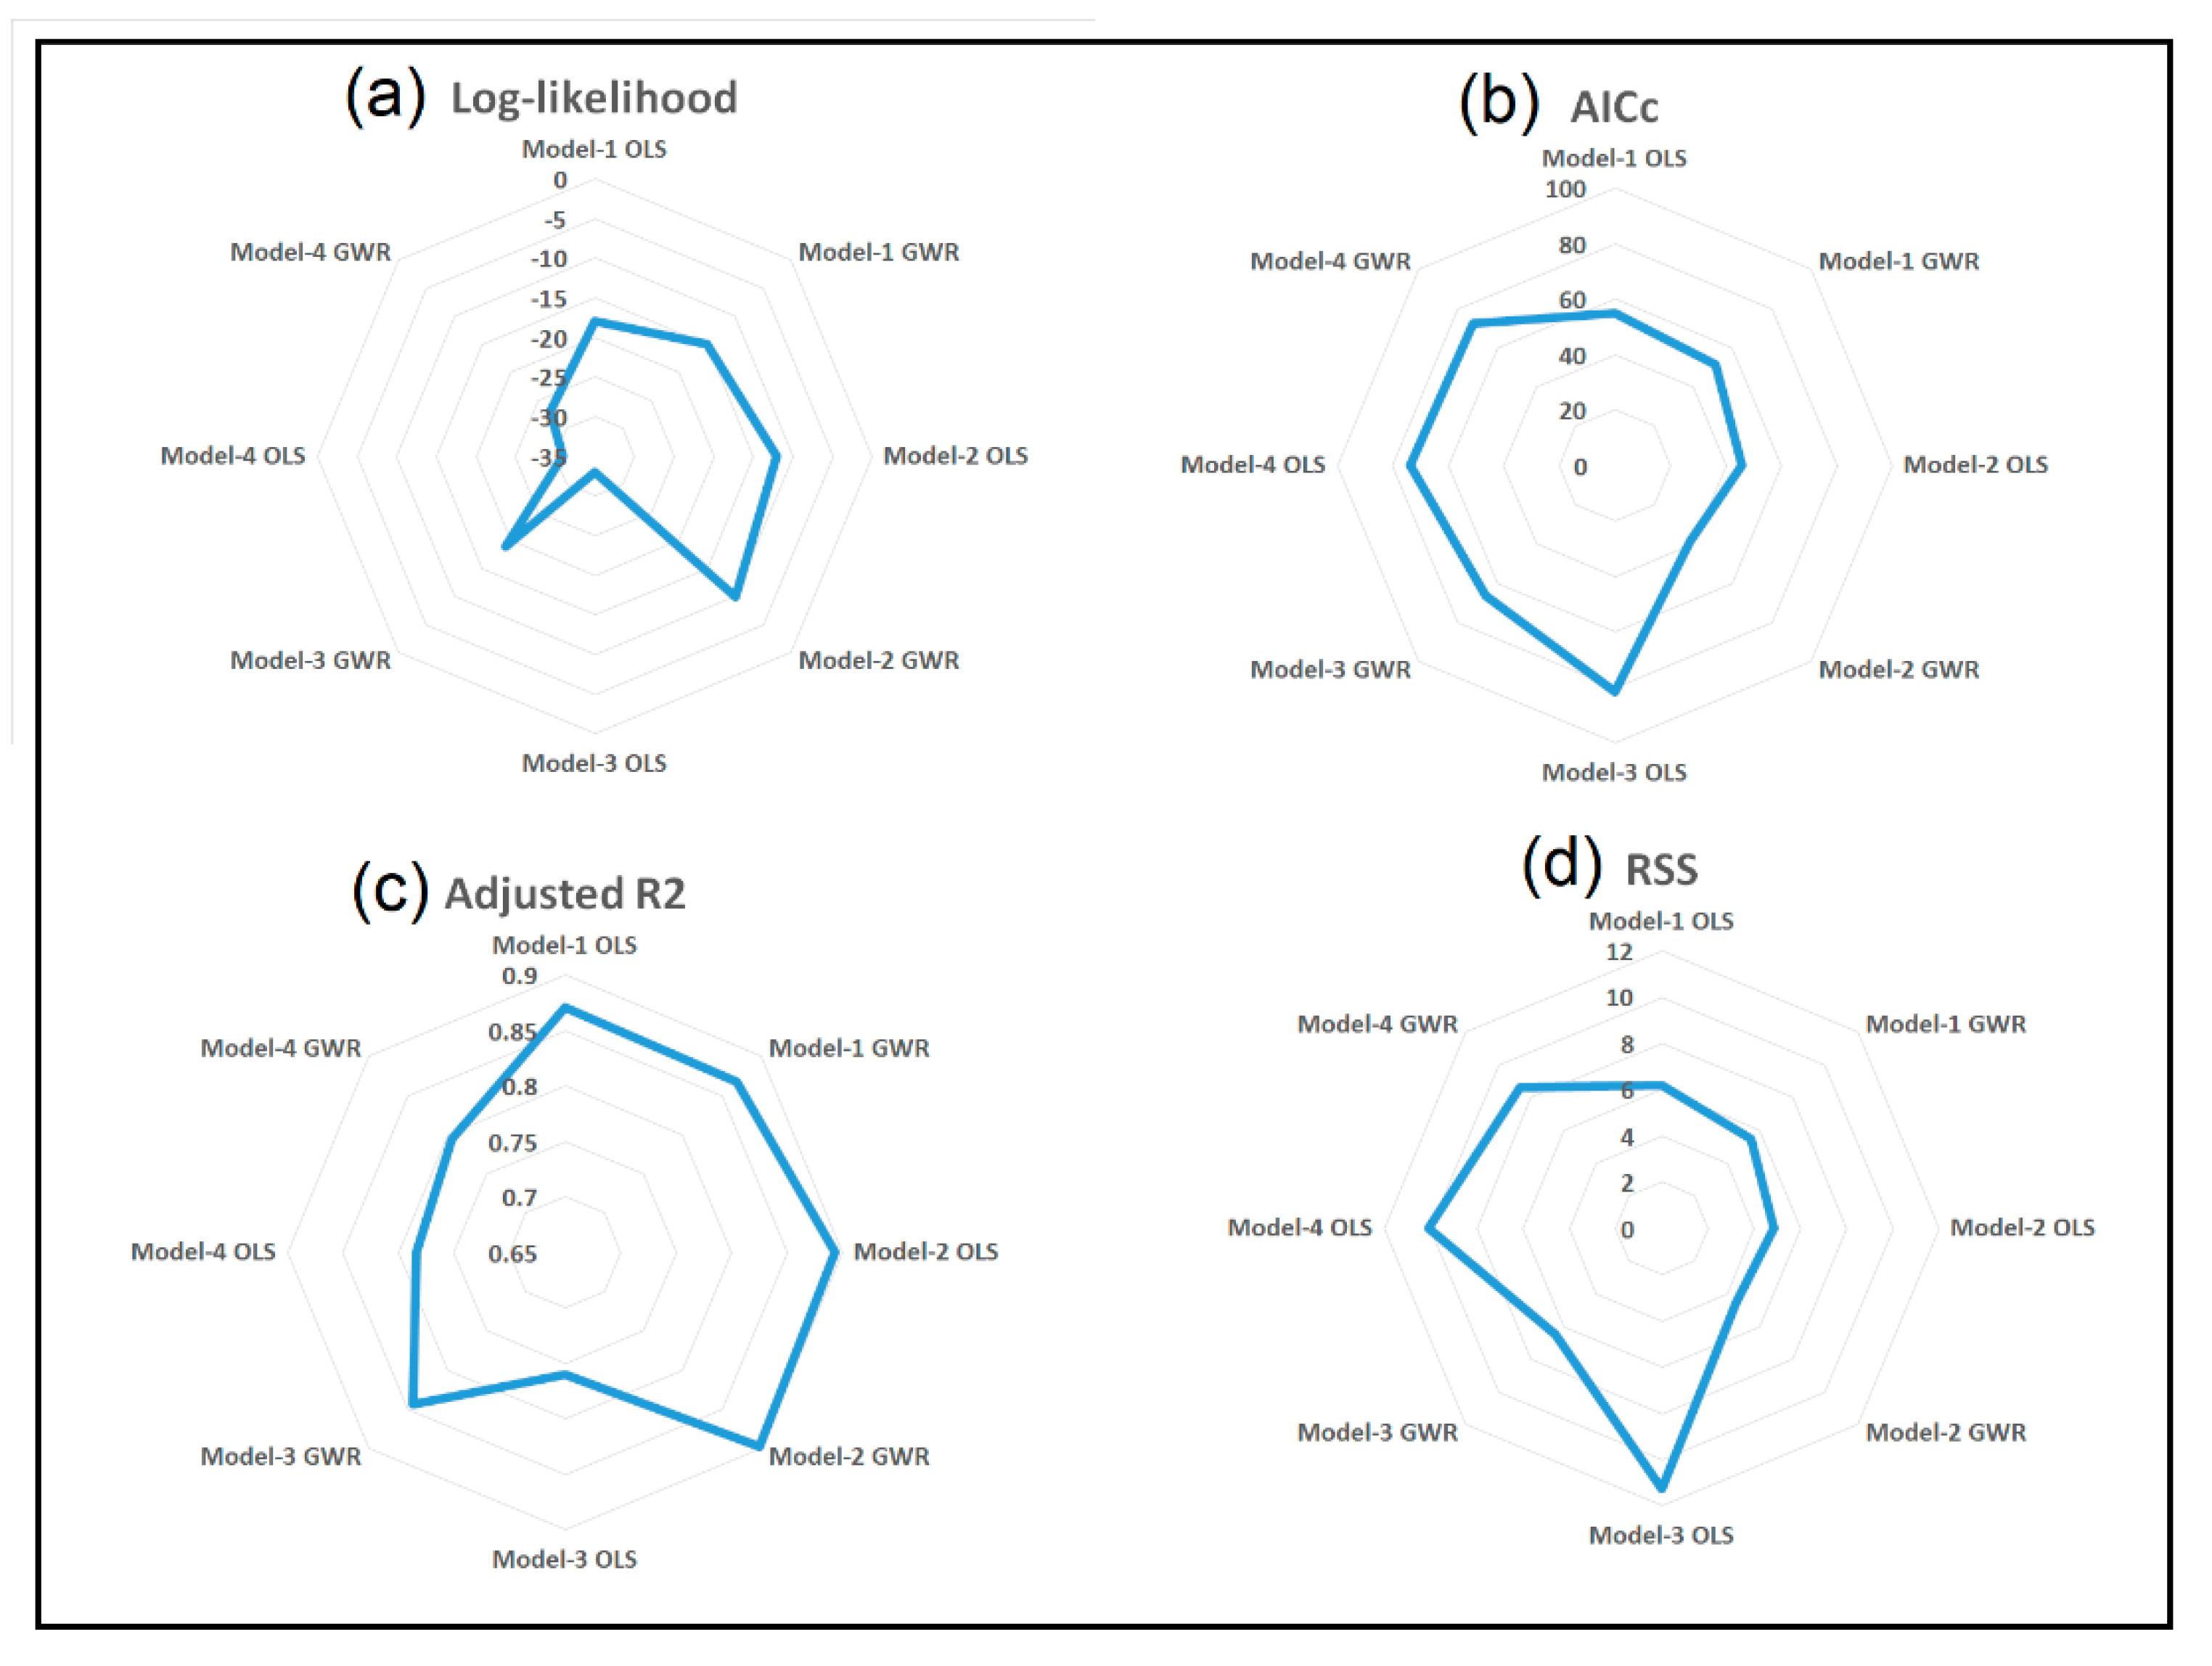
4.2. Model Comparison
We used the residual sum of squares (RSS), log-likelihood, adjusted R-squared, and corrected Akaike information criterion indices to estimate the suitability of the models. RSS, or the sum of the squared estimate of error (SEE), which is used to quantify the variance in a dataset, remained unexplained by the regression model [68]. Additionally, the corrected Akaike information criterion (AICc) is an estimator of estimation error, and thereby an indicator of the quality of the regression models for a given dataset. By default, GWR 4 facilitates comparisons between the relative quality of statistical models for a given dataset [69]. AICc facilitates a better model fit if the AICc value declines [64].
In effect, the lower values of RSS and AICc indicate the better fit of the model. Additionally, the log-likelihood function is a measure of how well a specific model fits the data. This function explains the suitability of a parameter for explaining an observed value [70]. Furthermore, R-squared is a coefficient of determination, and a modified version of R-squared is adjusted for the number of predictors in the model. This assesses the explanatory power of the linear regression models [71]. As regards the log-likelihood function-adjusted R-squared, comparatively higher values suggest a better fit.
The model comparison demonstrates (in Table 6 and Figure 4) that the RSS values in all four models are lower for the GWR variants than for OLS. For GWR, the RSS value is lowest (4.526) in Model-2, and highest (8.640) in Model-4. Similarly, the AICc value in all four models is again lower for the GWR variants, and the lowest AICc (38.435) is present in the GWR variant of Model-2. Next, the log-likelihood values are higher in all four GWR models than in OLS, and the GWR variant of Model-2 has the highest log-likelihood value (−10.667). Furthermore, the adjusted R2 values are higher in all GWR models in comparison to the OLS models. The highest adjusted R2 value (0.897) was reported in the GWR variant of Model-2. In brief, Model-2 has a better fit in all four models.
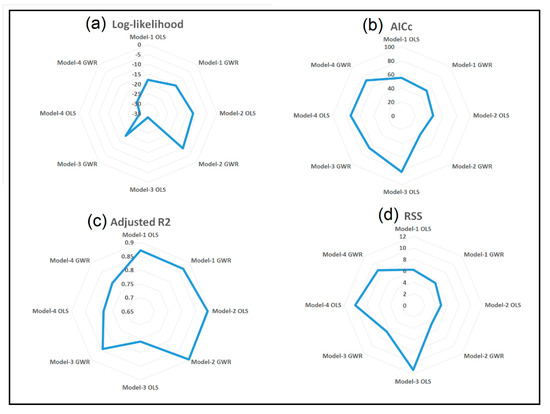
Figure 4.
Model comparison of (a) log-likelihood; (b) AICc; (c) adjusted R2; and (d) RSS.
5. Discussion
This study investigates the effects of various independent variables on the PM2.5 concentration at the KAU campus through OLS and GWR models. We showed that car traffic is the single most significant factor contributing to the presence of fine particles in the ambient air of KAU at the ground level.
This study has certain limitations related to sampling. We collected samples from 51 locations at four distinct times of the day for one month; however, extending the time of data collection to one year or more may capture seasonal variations in PM2.5 concentrations, resulting in more sophisticated models.
An earlier study by Khodeir et al. [72] confirmed that the main source of PM2.5 at the KAU campus is dense vehicular traffic; however, this study does not provide any evidence regarding the spatial variability of PM2.5 within the campus. A higher concentration of PM2.5 during peak hours (68–70 μg/m3) is a frightening result.
As mentioned earlier, prolonged exposure to fine particles might result in a higher prevalence of diseases, and even premature casualties. In general, ambient air quality at the KAU campus is the worst for pedestrians during peak hours. This makes a robust case for policymakers to make the campus car-free, as curbing sources of fine particle emissions might reduce deadly health consequences [73]. Our study reinforces the findings of Ruben Garnica-Monroy et al. [8], which suggest that the exposure of a population to roads with heavy traffic exposes it to higher health risks and necessitates changes in urban planning and public health policies.
Health consequences associated with fine particles have been well-researched in the global north and the global south, but there are very few studies in the Middle East region, particularly in Saudi Arabia. An important study by Nayebare et al. [73] noted that the PM2.5 concentration in Jeddah City is increasing the risk of cardiopulmonary and respiratory morbidity.
Through GWR models, we have specified the locations on the KAU campus that are at the greatest risk of PM2.5 exposure because of car use for on-campus mobility.
We recommend addressing the PM 2.5 concentration on the KAU campus through policies promoting walkability and bicycle riding, which will help to discourage car traffic, similar to other universities in the global north that are trying to make their campuses car-free and carbon-neutral.
6. Conclusions
Higher concentrations of PM2.5 at the ground level might accelerate many physical and cognitive diseases. In this study, we assembled data on dependent and independent variables at 51 locations on the KAU campus, and developed OLS- and GWR-based regression models to explain the spatial variability and determinants of PM2.5 exposure at the micro geographical scale. Unlike other studies, we used primary data to develop four OLS and GWR models, suggesting that car traffic is a significant factor in PM2.5 concentration on the KAU campus, while environmental factors and other activities (construction) are not significant at this scale. We compared all four models based on RSS, log-likelihood, adjusted R-squared, and AICc, and concluded that all the GWR estimates are better than the traditional OLS estimates, with Model-2 (attributing peak hour traffic in the morning) representing the best fit. On the basis of our findings, we recommend adopting sustainable mobility policies on the KAU campus in order to improve the general health of KAU students and staff.
Author Contributions
Data curation, and formal analysis by M.A.; methodology, writing, review and editing by A.T. All authors have read and agreed to the published version of the manuscript.
Funding
This project was funded by the Deanship of Scientific Research (DSR), King Abdulaziz University, Jeddah, under grant No. (DF-830-137-1441). The authors, therefore, gratefully acknowledge DSR technical and financial support.
Institutional Review Board Statement
Not applicable.
Informed Consent Statement
Not applicable.
Data Availability Statement
Data are available on request.
Conflicts of Interest
The authors declare no conflict of interest.
References
- UNEP. Pollution Action Note—Data You Need to Know. Available online: https://www.unep.org/interactive/air-pollution-note/ (accessed on 15 August 2021).
- Stauffer, A.; Perroud, S. Clean air policy challenges in Europe: Achieving air standards that prevent disease. Eur. J. Public Health 2020, 30. [Google Scholar] [CrossRef]
- Klompmaker, J.O.; Hoek, G.; Bloemsma, L.D.; Marra, M.; Wijga, A.H.; van den Brink, C.; Brunekreef, B.; Lebret, E.; Gehring, U.; Janssen, N.A.H. Surrounding green, air pollution, traffic noise exposure and non-accidental and cause-specific mortality. Environ. Int. 2020, 134, 105341. [Google Scholar] [CrossRef] [PubMed]
- An, X.; Hou, Q.; Li, N.; Zhai, S. Assessment of human exposure level to PM10 in China. Atmos. Environ. 2013, 70, 376–386. [Google Scholar] [CrossRef]
- Fang, T.; Guo, H.; Verma, V.; Peltier, R.E.; Weber, R.J. PM 2.5 water-soluble elements in the southeastern United States: Automated analytical method development, spatiotemporal distributions, source apportionment, and implications for heath studies. Atmos. Chem. Phys. 2015, 15, 11667–11682. [Google Scholar] [CrossRef] [Green Version]
- Fattore, E.; Paiano, V.; Borgini, A.; Tittarelli, A.; Bertoldi, M.; Crosignani, P.; Fanelli, R. Human health risk in relation to air quality in two municipalities in an industrialized area of Northern Italy. Environ. Res. 2011, 111, 1321–1327. [Google Scholar] [CrossRef] [PubMed]
- Debone, D.; Leirião, L.F.L.; Miraglia, S.G.E.K. Air quality and health impact assessment of a truckers’ strike in Sao Paulo state, Brazil: A case study. Urban Clim. 2020, 34, 100687. [Google Scholar] [CrossRef]
- Garnica-Monroy, R.; Garibay-Bravo, V.; Gonzalez-Gonzalez, A.; Martínez Salgado, H.; Hernández-Reyes, M. Spatial Analysis of Exposure to Traffic-Related Air Pollution in Mexico: Implications for Urban Planning to Improve Public Health. Appl. Spat. Anal. Policy 2021. [Google Scholar] [CrossRef]
- Toro, R.; Kvakić, M.; Klaić, Z.B.; Koračin, D. Exploring atmospheric stagnation during a severe particulate matter air pollution episode over complex terrain in Santiago, Chile. Environ. Pollut. 2019, 244, 705–714. [Google Scholar] [CrossRef]
- Englert, N. Fine particles and human health—A review of epidemiological studies. Toxicol. Lett. 2004, 149, 235–242. [Google Scholar] [CrossRef]
- Valavanidis, A.; Fiotakis, K.; Vlachogianni, T. Airborne Particulate Matter and Human Health: Toxicological Assessment and Importance of Size and Composition of Particles for Oxidative Damage and Carcinogenic Mechanisms. J. Environ. Sci. Health Part C 2008, 26, 339–362. [Google Scholar] [CrossRef]
- EPA. How Does PM Affect Human Health? Available online: https://www3.epa.gov/region1/airquality/pm-human-health.html (accessed on 9 September 2021).
- Gao, P.; Lei, T.; Jia, L.; Song, Y.; Lin, N.; Du, Y.; Feng, Y.; Zhang, Z.; Cui, F. Exposure and health risk assessment of PM 2.5 -bound trace metals during winter in university campus in Northeast China. Sci. Total Environ. 2017, 576, 628–636. [Google Scholar] [CrossRef]
- Chen, P.; Bi, X.; Zhang, J.; Wu, J.; Feng, Y. Assessment of heavy metal pollution characteristics and human health risk of exposure to ambient PM2.5 in Tianjin, China. Particuology 2015, 20, 104–109. [Google Scholar] [CrossRef]
- Mascarelli, A.L. How green is your campus? Nature 2009, 461, 154–155. [Google Scholar] [CrossRef] [PubMed] [Green Version]
- Stafford, S.L. How green is your campus? An Analysis of the factors that drives universities to embrace Sustainability. Contemp. Econ. Policy 2011, 29, 337–356. [Google Scholar] [CrossRef] [Green Version]
- Anenberg, S.C.; Horowitz, L.W.; Tong, D.Q.; West, J.J. An Estimate of the Global Burden of Anthropogenic Ozone and Fine Particulate Matter on Premature Human Mortality Using Atmospheric Modeling. Environ. Health Perspect. 2010, 118, 1189–1195. [Google Scholar] [CrossRef] [PubMed]
- Cao, Q.; Rui, G.; Liang, Y. Study on PM2.5 pollution and the mortality due to lung cancer in China based on geographic weighted regression model. BMC Public Health 2018, 18, 925. [Google Scholar] [CrossRef]
- Chowdhury, S.; Dey, S. Cause-specific premature death from ambient PM2.5 exposure in India: Estimate adjusted for baseline mortality. Environ. Int. 2016, 91, 283–290. [Google Scholar] [CrossRef]
- Pope III, C.A. Lung Cancer, Cardiopulmonary Mortality, and Long-term Exposure to Fine Particulate Air Pollution. JAMA 2002, 287, 1132. [Google Scholar] [CrossRef] [Green Version]
- Bandyopadhyay, A. Neurological Disorders from Ambient (Urban) Air Pollution Emphasizing UFPM and PM2.5. Curr. Pollut. Rep. 2016, 2, 203–211. [Google Scholar] [CrossRef] [Green Version]
- Ailshire, J.A.; Crimmins, E.M. Fine Particulate Matter Air Pollution and Cognitive Function Among Older US Adults. Am. J. Epidemiol. 2014, 180, 359–366. [Google Scholar] [CrossRef] [PubMed] [Green Version]
- Costa, L.G.; Cole, T.B.; Coburn, J.; Chang, Y.-C.; Dao, K.; Roque, P. Neurotoxicants Are in the Air: Convergence of Human, Animal, and In Vitro Studies on the Effects of Air Pollution on the Brain. Biomed Res. Int. 2014, 2014, 1–8. [Google Scholar] [CrossRef] [Green Version]
- Fu, P.; Yung, K.K.L. The association between PM2.5 exposure and neurological disorders. In Air Pollution, Climate, and Health; Elsevier: Amsterdam, The Netherlands, 2021; pp. 229–245. [Google Scholar]
- Kilian, J.; Kitazawa, M. The emerging risk of exposure to air pollution on cognitive decline and Alzheimer’s disease—Evidence from epidemiological and animal studies. Biomed. J. 2018, 41, 141–162. [Google Scholar] [CrossRef]
- Zhou, Y.-M.; Fan, Y.-N.; Yao, C.-Y.; Xu, C.; Liu, X.-L.; Li, X.; Xie, W.-J.; Chen, Z.; Jia, X.-Y.; Xia, T.-T.; et al. Association between short-term ambient air pollution and outpatient visits of anxiety: A hospital-based study in northwestern China. Environ. Res. 2021, 197, 111071. [Google Scholar] [CrossRef]
- Ranzani, O.T.; Milà, C.; Kulkarni, B.; Kinra, S.; Tonne, C. Association of Ambient and Household Air Pollution With Bone Mineral Content Among Adults in Peri-urban South India. JAMA Netw. Open 2020, 3, e1918504. [Google Scholar] [CrossRef]
- Massachusetts Institute of Technology. Designing the Zero-Carbon Campus of the Future. Available online: https://sustainability.mit.edu/topic/zero-carbon-campus#!introduction (accessed on 22 July 2021).
- University of Leeds. Living Lab for Air Quality. Available online: https://sustainability.leeds.ac.uk/the-living-lab/airquality/ (accessed on 6 July 2021).
- BBC. Smoking More Toxic than Car Fumes. Available online: http://news.bbc.co.uk/2/hi/health/3590578.stm (accessed on 8 July 2021).
- Muller, R.A.; Muller, E.A. Air Pollution and Cigarette Equivalence. Available online: http://berkeleyearth.org/air-pollution-and-cigarette-equivalence/ (accessed on 15 July 2021).
- King Abdulaziz University. King Abdulaziz University: Competition to Design “A Smoking-free University” Logo. Available online: https://www.kau.edu.sa/Content-0-EN-36146 (accessed on 5 July 2021).
- Lincoln University. Clean Air Policy. Available online: https://www.lincoln.ac.nz/assets/PoliciesAndProcedures/Clean-Air-Policy-.pdf (accessed on 9 July 2021).
- Express Web Desk. Hyderabad University Launches E-Rickshaws for Campus. Available online: https://indianexpress.com/article/cities/hyderabad/hyderabad-university-launches-e-rickshaws-for-campus-6162327/ (accessed on 12 July 2021).
- Columbia Central University. Red de Monitoreo de Calidad del Aire. Available online: https://www.ucentral.edu.co/noticentral/red-monitoreo-calidad-del-aire (accessed on 21 October 2021).
- Times News Network. Chandigarh: Air Quality Improves to ‘Moderate’. Available online: https://timesofindia.indiatimes.com/city/chandigarh/air-quality-improves-to-moderate/articleshow/71929952.cms (accessed on 5 July 2021).
- Grundfos. Green Energy Fuels Smart Campus in Western China. Available online: https://www.grundfos.com/solutions/learn/cases/green-energy-fuels-smart-campus-in-western-china (accessed on 22 August 2021).
- Monash University Air Pollution. Available online: https://www.monash.edu/future-without-change/air-pollution (accessed on 22 July 2021).
- University of Victoria. Campus Cycling Plan; University of Victoria: Victoria, BC, Canada, 2019. [Google Scholar]
- Surgeon General Step It Up! The Surgeon General’s Call to Action to Promote Walking and Walkable Communities. Available online: https://www.hhs.gov/surgeongeneral/reports-and-publications/physical-activity-nutrition/index.html (accessed on 18 July 2021).
- Bopp, M.; Kaczynski, A.; Wittman, P. Active Commuting Patterns at a Large, Midwestern College Campus. J. Am. Coll. Health 2011, 59, 605–611. [Google Scholar] [CrossRef] [PubMed] [Green Version]
- Stevens, A. How Colleges Are Stepping Up Campus Walkability. Available online: https://www.citylab.com/life/2015/12/how-colleges-are-stepping-up-campus-walkability/419220/ (accessed on 15 July 2021).
- Scott, A.; Nwadike, N.; Seibel, L.; Dosch, G.; Uchendu, N. Creating a Car Free Campus. Available online: http://umanitoba.ca/campus/sustainability/media/Creating_a_Car_Free_Campus.pdf (accessed on 11 July 2021).
- Páez, A.; Wheeler, D.C. Geographically Weighted Regression. In International Encyclopedia of Human Geography; Elsevier: Amsterdam, The Netherlands, 2009; pp. 407–414. [Google Scholar]
- Sheehan, K.R.; Strager, M.P.; Welsh, S.A. Advantages of Geographically Weighted Regression for Modeling Benthic Substrate in Two Greater Yellowstone Ecosystem Streams. Environ. Model. Assess. 2013, 18, 209–219. [Google Scholar] [CrossRef]
- Lin, G.; Fu, J.; Jiang, D.; Hu, W.; Dong, D.; Huang, Y.; Zhao, M. Spatio-Temporal Variation of PM2.5 Concentrations and Their Relationship with Geographic and Socioeconomic Factors in China. Int. J. Environ. Res. Public Health 2013, 11, 173–186. [Google Scholar] [CrossRef] [PubMed] [Green Version]
- Guan, D.; Su, X.; Zhang, Q.; Peters, G.P.; Liu, Z.; Lei, Y.; He, K. The socioeconomic drivers of China’s primary PM2.5 emissions. Environ. Res. Lett. 2014, 9. [Google Scholar] [CrossRef] [Green Version]
- Hao, Y.; Liu, Y.-M. The influential factors of urban PM2.5 concentrations in China: A spatial econometric analysis. J. Clean. Prod. 2016, 112, 1443–1453. [Google Scholar] [CrossRef]
- Pateraki, S.; Asimakopoulos, D.N.; Flocas, H.A.; Maggos, T.; Vasilakos, C. The role of meteorology on different sized aerosol fractions (PM10, PM2.5, PM2.5–10). Sci. Total Environ. 2012, 419, 124–135. [Google Scholar] [CrossRef]
- Onat, B.; Stakeeva, B. Personal exposure of commuters in public transport to PM2.5 and fine particle counts. Atmos. Pollut. Res. 2013, 4, 329–335. [Google Scholar] [CrossRef] [Green Version]
- He, X.; Lin, Z.-S. Interactive Effects of the Influencing Factors on the Changes of PM2.5 Concentration Based on GAM Model. Huan Jing Ke Xue Huanjing Kexue 2017, 38, 22–32. [Google Scholar] [CrossRef]
- Jiang, M.; Sun, W.; Yang, G.; Zhang, D. Modelling Seasonal GWR of Daily PM2.5 with Proper Auxiliary Variables for the Yangtze River Delta. Remote Sens. 2017, 9, 346. [Google Scholar] [CrossRef] [Green Version]
- Xiao, L.; Lang, Y.; Christakos, G. High-resolution spatiotemporal mapping of PM2.5 concentrations at Mainland China using a combined BME-GWR technique. Atmos. Environ. 2018, 173, 295–305. [Google Scholar] [CrossRef]
- Zhai, L.; Li, S.; Zou, B.; Sang, H.; Fang, X.; Xu, S. An improved geographically weighted regression model for PM2.5 concentration estimation in large areas. Atmos. Environ. 2018, 181, 145–154. [Google Scholar] [CrossRef]
- Hajiloo, F.; Hamzeh, S.; Gheysari, M. Impact assessment of meteorological and environmental parameters on PM2.5 concentrations using remote sensing data and GWR analysis (case study of Tehran). Environ. Sci. Pollut. Res. 2019, 26, 24331–24345. [Google Scholar] [CrossRef] [PubMed]
- Cheng, Z.; Luo, L.; Wang, S.; Wang, Y.; Sharma, S.; Shimadera, H.; Wang, X.; Bressi, M.; de Miranda, R.M.; Jiang, J.; et al. Status and characteristics of ambient PM2.5 pollution in global megacities. Environ. Int. 2016, 89–90, 212–221. [Google Scholar] [CrossRef] [PubMed]
- Dong, F.; Wang, Y.; Zheng, L.; Li, J.; Xie, S. Can industrial agglomeration promote pollution agglomeration? Evidence from China. J. Clean. Prod. 2020, 246, 118960. [Google Scholar] [CrossRef]
- Lou, C.-R.; Liu, H.-Y.; Li, Y.-F.; Li, Y.-L. Socioeconomic Drivers of PM2.5 in the Accumulation Phase of Air Pollution Episodes in the Yangtze River Delta of China. Int. J. Environ. Res. Public Health 2016, 13, 928. [Google Scholar] [CrossRef] [Green Version]
- Gu, K.; Zhou, Y.; Sun, H.; Dong, F.; Zhao, L. Spatial distribution and determinants of PM2.5 in China’s cities: Fresh evidence from IDW and GWR. Environ. Monit. Assess. 2021, 193, 15. [Google Scholar] [CrossRef] [PubMed]
- Wang, M.; Wang, H. Spatial Distribution Patterns and Influencing Factors of PM2.5 Pollution in the Yangtze River Delta: Empirical Analysis Based on a GWR Model. Asia-Pacific J. Atmos. Sci. 2021, 57, 63–75. [Google Scholar] [CrossRef]
- Barabesi, L.; Fattorini, L. Random versus stratified location of transects or points in distance sampling: Theoretical results and practical considerations. Environ. Ecol. Stat. 2013, 20, 215–236. [Google Scholar] [CrossRef]
- Mansfield, E.R.; Helms, B.P. Detecting Multicollinearity. Am. Stat. 1982, 36, 158–160. [Google Scholar] [CrossRef]
- Grekousis, G. Spatial Analysis Methods and Practice; Cambridge University Press: Cambridge, UK, 2020; ISBN 9781108614528. [Google Scholar]
- Oshan, T.; Li, Z.; Kang, W.; Wolf, L.; Fotheringham, A. mgwr: A Python Implementation of Multiscale Geographically Weighted Regression for Investigating Process Spatial Heterogeneity and Scale. ISPRS Int. J. Geo Inf. 2019, 8, 269. [Google Scholar] [CrossRef] [Green Version]
- Allen, M.P. The t test for the simple regression coefficient. In Understanding Regression Analysis; Springer: Boston, MA, USA, 1997; pp. 66–70. [Google Scholar]
- Harrison, B. Tips for quicker focused evaluation. In Data Room Management for Mergers and Acquisitions in the Oil and Gas Industry; Elsevier: Amsterdam, The Netherlands, 2020; pp. 145–167. [Google Scholar]
- Morgan, J.A.; Tatar, J.F. Calculation of the Residual Sum of Squares for all Possible Regressions. Technometrics 1972, 14, 317–325. [Google Scholar] [CrossRef]
- Hurvich, C.M.; Tsai, C.-L. A corrected akaike information criterion for vector autoregressive model selection. J. Time Ser. Anal. 1993, 14, 271–279. [Google Scholar] [CrossRef]
- Ishiguro, M.; Sakamoto, Y.; Kitagawa, G. Bootstrapping Log Likelihood and EIC, an Extension of AIC. Ann. Inst. Stat. Math. 1997, 49, 411–434. [Google Scholar] [CrossRef]
- Miles, J. R -Squared, Adjusted R -Squared. In Encyclopedia of Statistics in Behavioral Science; John Wiley & Sons, Ltd.: Chichester, UK, 2005. [Google Scholar]
- Khodeir, M.; Shamy, M.; Alghamdi, M.; Zhong, M.; Sun, H.; Costa, M.; Chen, L.-C.; Maciejczyk, P. Source apportionment and elemental composition of PM2.5 and PM10 in Jeddah City, Saudi Arabia. Atmos. Pollut. Res. 2012, 3, 331–340. [Google Scholar] [CrossRef] [Green Version]
- Schwartz, J.; Laden, F.; Zanobetti, A. The concentration-response relation between PM2.5 and daily deaths. Environ. Health Perspect. 2002, 110, 1025–1029. [Google Scholar] [CrossRef] [PubMed] [Green Version]
- Nayebare, S.R.; Aburizaiza, O.S.; Siddique, A.; Carpenter, D.O.; Arden Pope, C.; Mirza, H.M.; Zeb, J.; Aburiziza, A.J.; Khwaja, H.A. Fine particles exposure and cardiopulmonary morbidity in Jeddah: A time-series analysis. Sci. Total Environ. 2019, 647, 1314–1322. [Google Scholar] [CrossRef]


Publisher’s Note: MDPI stays neutral with regard to jurisdictional claims in published maps and institutional affiliations. |
© 2021 by the authors. Licensee MDPI, Basel, Switzerland. This article is an open access article distributed under the terms and conditions of the Creative Commons Attribution (CC BY) license (https://creativecommons.org/licenses/by/4.0/).