Abstract
This study investigated the R&D manipulation of Chinese listed companies under preferential tax policies based on the bunching approach. On this basis, differences in organizational performance aspirations were used to distinguish firm heterogeneity. This was to clarify how tax incentives affected firm innovation performance. The empirical results show that preferential tax policies can effectively reduce the actual tax burden of high-tech enterprises. Some companies have enjoyed corporate income tax breaks by manipulating R&D spending. The counterfactual estimate of R&D intensity shows that the elasticity of taxable income of R&D investment of listed companies in China is between 0.55 and 0.8. The elasticity of taxable income of manufacturing enterprises is between 0.6 and 0.75. Furthermore, within the R&D operating range, firm-level variations will affect innovation performance. The incentive effect of R&D activities of enterprises with a negative organizational performance aspiration gap is higher than that of enterprises with a positive organizational performance aspiration gap. The conclusion provides the basis for the country to improve preferential tax policies for high-tech enterprises.
1. Introduction
Classical economic theory and endogenous economic theory agree that technological innovation plays a vital role in the process of economic development. Therefore, the government has a motivation to seek the optimal allocation of resources by intervening and providing support to corporate R&D investment to promote enterprise technological innovation [1,2,3]. The following are stipulated in the outline of China’s 14th Five-Year Plan: improving the market-oriented technical innovation mechanism, strengthening the status of enterprise innovation’s main body, accelerating the enterprise agglomeration of various innovative elements, and formation of a market-oriented technology innovation system in which enterprise is the main body, is market-oriented, and in which there is depth of fusion. The abuse of scientific and technological achievements is a necessary factor hindering sustainable development. One of the ways to solve this problem is to promote scientific and technological innovation. A preferential tax policy is one of the general policies of OECD countries to support enterprises’ technological innovation, including accelerated depreciation policies and R&D tax incentives [4,5,6]. One part of the tax policy formulation strategy is sustainable economic development, encouraging and guiding enterprise ecological innovation. The policy action environment and drivers of innovation performance lead to more sustainable business models [7,8,9]. Recent studies have shown that companies respond positively to such policies [10,11,12,13]. A source for the improvement of enterprises’ scientific and technological innovation strength is the steady increase of R&D investment intensity [14,15]. The large size of China’s manufacturing sector gives it a growing competitive advantage. Therefore, tax incentives to support the high-quality development of the manufacturing industry are of primary importance.
The risks of R&D activities themselves will hinder the improvement of enterprises’ R&D input intensity; for example, in R&D failure or a long product recovery cycle, the output is not proportional to the input, and R&D achievements are imitated by peers [16,17]. At present, China mainly uses preferential tax policies to encourage enterprises to increase R&D investment levels. The reduction of the tax rate effectively reduces the risks to enterprises of R&D activities utilizing the internalization of economic benefits, thus encouraging enterprises to increase their R&D investment. China has formulated correspondingly preferential tax policies for high-tech enterprises with high R&D investment intensity. Accordingly, high-tech enterprises have clear conditions for identification. As a core index, the ratio of R&D investment to sales revenue (also known as R&D intensity) has a clear threshold, which becomes the key to whether an enterprise can obtain income tax benefits. Threshold rules create unnecessary incentives for companies to avoid tax.
For China in the transitional period, the gradual improvement of the policy environment and the rapid development of the market economy together constitute a complex environment for enterprises [18]. In response to the convergence of public policy pressure and the differentiation of market competition, how organizations make strategic choices has always been a focus of researchers [19]. The Behavioral Theory of the Firm has laid a foundation for further analysis of corporate strategic adjustment behavior. It holds that decision-makers will choose a psychological satisfaction value as a reference point in the decision-making process, which is the expected level of enterprise operation at the organizational level [20]. This thinking is broadly consistent with the assumptions of prospect theory [21]. The managers may have completely different decision-making behaviors under the situation of positive and negative performance expectations.
In the differentiation between policy pressure and market competition, an important reference point for enterprises making strategic decisions is the expected level of the enterprise operation. Increasing the intensity of R&D investment reduces the time cost of innovation decision-making by allowing firms to improve their innovation performance more quickly. The expected performance feedback of enterprises also has an impact on innovation performance.
The main contents of this paper are as follows: first, we construct the factual distribution and counterfactual distribution of the R&D intensity of listed companies to investigate whether enterprises are engaged in R&D manipulation. Then, based on the results of the counterfactual estimation, we measure the degree of corporate behavior distortion under the tax incentive policy. This paper selects enterprises within the R&D manipulation range as research samples and uses the Poisson regression model to investigate the impact of firm characteristics such as R&D investment on innovation performance. We analyze the mechanism of management decisions on innovation performance under different organizational performance aspiration gaps.
The first element of originality in this article is the combination of policy actions and R&D investment in line with the requirements of sustainable development. This accurately estimates the distortion degree of corporate behavior of listed companies under the tax avoidance incentive at the micro-level. The second element of originality is that the differences in organizational performance expectations are used to distinguish firm heterogeneity and analyze the characteristics of organizational strategic choice under the influence of tax preference convergence. A third original aspect of this article is the causality identification strategy constructed by the bunching approach. It is helpful to maintain the sustainability of policy implementation and make enterprises develop in a green direction.
2. Literature Review
2.1. Threshold Rules for Tax Incentives
Scale-based tax exemption or threshold rules are widespread in tax incentive policies, which leads to tax avoidance by enterprises in order to meet or avoid the threshold. The response of large US companies to the VAT threshold was to break into smaller entities, reflecting an obvious tax avoidance strategy [22]. In Pakistan, companies gather rapidly at the kink point between turnover and profit in the tax system and self-employed people actively respond to individual income tax brackets [10,11]. The French employee threshold (50 people) has a significant impact on the distribution of enterprise size and productivity [12,23]. In Spain, large companies avoid stricter enforcement by clustering just below the tax enforcement threshold [24,25]. In China, there are clusters of enterprises near the threshold of R&D tax incentives [3,26,27].
2.2. The Application of Bunching Approach
Traditional policy evaluation methods include differences-in-differences (DID) and regression discontinuity design (RD). They do not apply to cases in which the samples of the treatment and control groups are not randomly distributed in a pre-extraction point system. The bunching approach uses the distribution curves observed in reality to conduct high-order nonparametric estimation to obtain counterfactual curves [28,29]. As a new empirical method, this method has achieved good results when dealing with a pre-breakpoint system, such as the progressive individual income tax system, the retirement system, and Medicare [30,31,32].
2.3. The Impact of Organizational Performance Expectation Gap on Firm Decision Making
According to the theory of enterprise behavior and performance feedback theory, the expected performance of an enterprise in the current year will be determined by referring to the historical performance and the average performance of the industry in that year [33]. The performance aspiration gap is obtained by calculating the actual performance minus the expected performance. When an enterprise has a negative organizational performance aspiration gap, the performance gap urges bounded rational managers to solve the current problem state by increasing R&D investment to make the actual performance reach the expected performance level. When an enterprise has a positive organizational performance aspiration gap, the mentality of satisfying the status quo will hinder the improvement of R&D investment [34]. Prospect theory analyzes this from the micro-level. First of all, it assumes that people are loss-averse, and a negative organizational performance aspiration gap involves the prospect of a loss. Managers will take more steps to avoid certain losses [21]. Based on the complementarity of the two theories, managers have different decision-making behaviors under different organizational performance aspirations. In the context of tax incentives, corporate feedback to expected performance is also reflected in innovation performance [35].
2.4. Firm Level Factors Affecting Innovation Performance
Research on the impact of the macro-environment on innovation mainly focuses on the influence of the environment of the legal system and fiscal and tax policies on enterprise innovation. Under preferential tax policy, enterprises not only conduct innovation to promote technological progress and maintain a competitive advantage, but also conduct innovation to obtain other benefits, which is a kind of strategic behavior [36,37,38]. Empirical evidence shows that law, product market competition, investor attitudes to failure, financial development, and institutional ownership influence innovation [39,40,41,42,43]. The degree to which an enterprise makes strategic adjustments mainly depends on the following factors: the relationship between the organization and the external environment, organizational resources and capabilities, characteristics of management within the organization, mutual support between middle managers and employees, characteristics of internal directors, the organization’s previous operating performance, and media attention [32,44,45,46,47]. Tax cuts do give companies an incentive to spend more on research and development and produce new products [48,49]. The tax burden will reduce the internal cash flow of enterprises [50]. Internal financing is one of the important sources of funds for enterprises’ innovation activities [51]. Too high a tax rate would encourage companies to turn to debt [52]. When the corporate income tax rate goes down, the wages that employees receive go up significantly [53].
The existing research focuses on the factors influencing enterprise innovation activities. Few studies have analyzed the level of organizational performance aspirations in the context of tax incentives. This paper aims to explore the effect of preferential taxation policies on high-tech enterprises in China. It is important fully understand the changes in enterprise behavior choice during the implementation of preferential taxation policies for high-tech enterprises in China. Therefore, we hope to explore the mechanism of the impact of the organizational performance aspiration gap on enterprise innovation decisions.
3. Materials and Methods
3.1. Data and Variables
This paper takes the preferential income tax policy of high-tech enterprises as the research object. The financial statement data disclosed by listed companies from 2015 to 2019 are used as the research basis. The screening procedures for the data of listed companies are as follows: (1) exclude the companies that are missing or have not disclosed their R&D investments throughout the sample period; (2) since the number of enterprises with a sales revenue of less than 200 million is small (less than 100), enterprises with sales revenue of less than 200 million are deleted; (3) exclude financial enterprises; (4) exclude enterprises with abnormal data, such as R&D investment higher than sales revenue, etc. The number of samples after screening is shown in Table 1. Manufacturing enterprises are selected according to the industry classification and code of national economy published by the National Bureau of Statistics of China (GB/T 4754-2017). All data are from the CSMAR database and the Wind database.

Table 1.
Sample number of enterprises from 2015 to 2019.
Enterprises reduce costs by increasing financial leverage to obtain the tax shield value of debt. Therefore, the innovative performance model of enterprise behavior decision-making will comprehensively consider the power subjects (controlling shareholders and management CEO) and the debt ratio and other factors in the organization. The first is enterprise competence. The number of invention patent applications in the financial statements represents the R&D performance, and the logarithm of the R&D investment and the total sales revenue in the financial statements represent the R&D investment and the operating level, respectively. The second is the debt structure of the enterprise, which is expressed by the following proportion: the ratio of interest-paying debt = (short-term borrowing + long-term borrowing due within one year + long-term borrowing)/total assets. The third is the rights of the enterprise, based on the natural logarithm of the total amount of the top three company executives’ pay, SOE and CEO in the enterprise financial statements. Combined with the identification method of high-tech enterprises, industry effect and annual effect are set as control variables.
Table 2 shows the variables used in this article and their names in the financial statements or calculations. The corresponding descriptive statistics are given in Table 3.
Table 2.
Variables and their meanings.
Table 3.
Descriptive statistics of variables.
3.2. Methods
3.2.1. Bunching Approach
First, we estimated the distribution of counterfactual firms near the breakpoint by using the distribution of firms not affected by the policy. In terms of progressive tax rates, the basic regression of counterfactual estimation is as follows:
where is the number of samples within the R&D proportion interval and is the R&D level corresponding to the R&D proportion interval . and are the upper and lower bounds of the segment distorted by the system, and is an indicator function. Since the beginning and end of the twisted section of the bending system are obvious, the values of and can be directly determined by the distribution curve.
In the process of estimating Equation (1), two parameters need to be determined in advance. One is the upper limit and lower limit of the operating interval, i.e., [,]; the other is the order of the polynomial fitting. Diamond and Persson [54] provide a data-driven method, B = M, to determine the optimal interval and the optimal order. B represents the bunching mass on one side of the breakpoint caused by manipulation (Equation (2)). M represents the missing mass of enterprises on the other side. See Equation (3).
Income tax for high-tech enterprises is a taxation system based on progressive rates. Under this tax system, the breakpoint changes the average tax rate rather than the marginal rate. Therefore, according to the adjustment of Kleven and Waseem [11], the increase in the average tax rate at the breakpoint is approximated to the increase in the marginal tax rate. Then the taxable income elasticity is
3.2.2. Poisson Regression Model
There are differences in the behaviors taken by the management when the enterprise is in business performance and business distress, which will also affect the behavior choices of the enterprise, especially in terms of the innovation decisions of the enterprise. Therefore, we used the difference between actual performance and expected performance to distinguish heterogeneous R&D manipulators.
The variable of organizational performance expectation gap was measured by Equation (6), which was set up as follows:
where is the (t − 1) year performance expectation gap of the enterprise, and is the performance of the enterprise in the (t − 1) and (t − 2) years, respectively, and is the average performance of all enterprises in the industry in (t − 1) years except the enterprise itself. In addition, α is the weight coefficient and is a value between (0,1]. The value of α does not affect the robustness of the results.
The high-tech enterprises in the R&D manipulation range have stripped endogenous influence from this paper. We established the following regression model to analyze the impact of enterprise characteristics on R&D performance:
4. Results
4.1. Enterprise R&D Manipulation Test and Taxable Income Elasticity
4.1.1. Enterprise R&D Manipulation Test and Elasticity of Taxable Income
The types of institutional breakpoints are divided into bending breakpoints and fault breakpoints. The preferential tax policies for high-tech enterprises studied in this paper are bending breakpoints. R&D manipulation causes clustering distribution of enterprises at bending breakpoints. The marginal tax burden of individuals located on the right side of the critical point decreases after the R&D intensity exceeds a critical point. Each individual moves to a higher R&D intensity by increasing their R&D investment with the goal of 3%. Finally, the cluster distribution of enterprises forms at the target R&D intensity.
According to the ratio of R&D investment to sales revenue of a full sample of listed companies in China from 2015 to 2019, the distribution pattern observed in reality is consistent with the model’s prediction. Companies that spend less than 3% on R&D have increased their R&D spending to more than 3%. This leads to a clustered distribution at 3% of the critical point. Figure 1 shows the clustering distribution of R&D intensity of a full sample of listed companies. From 2015 to 2019, the number of companies on the right side of the enterprise R&D intensity of 3% increased by leaps and bounds, showing a clustering phenomenon. Therefore, the research and development manipulation phenomenon of high-tech enterprises can be studied by the bunching approach.
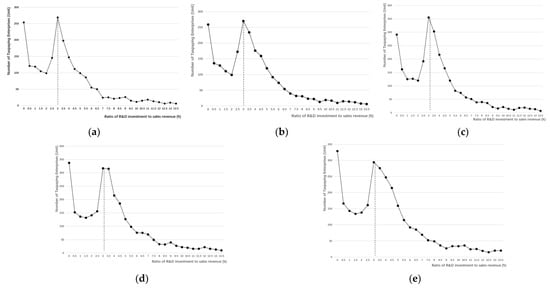
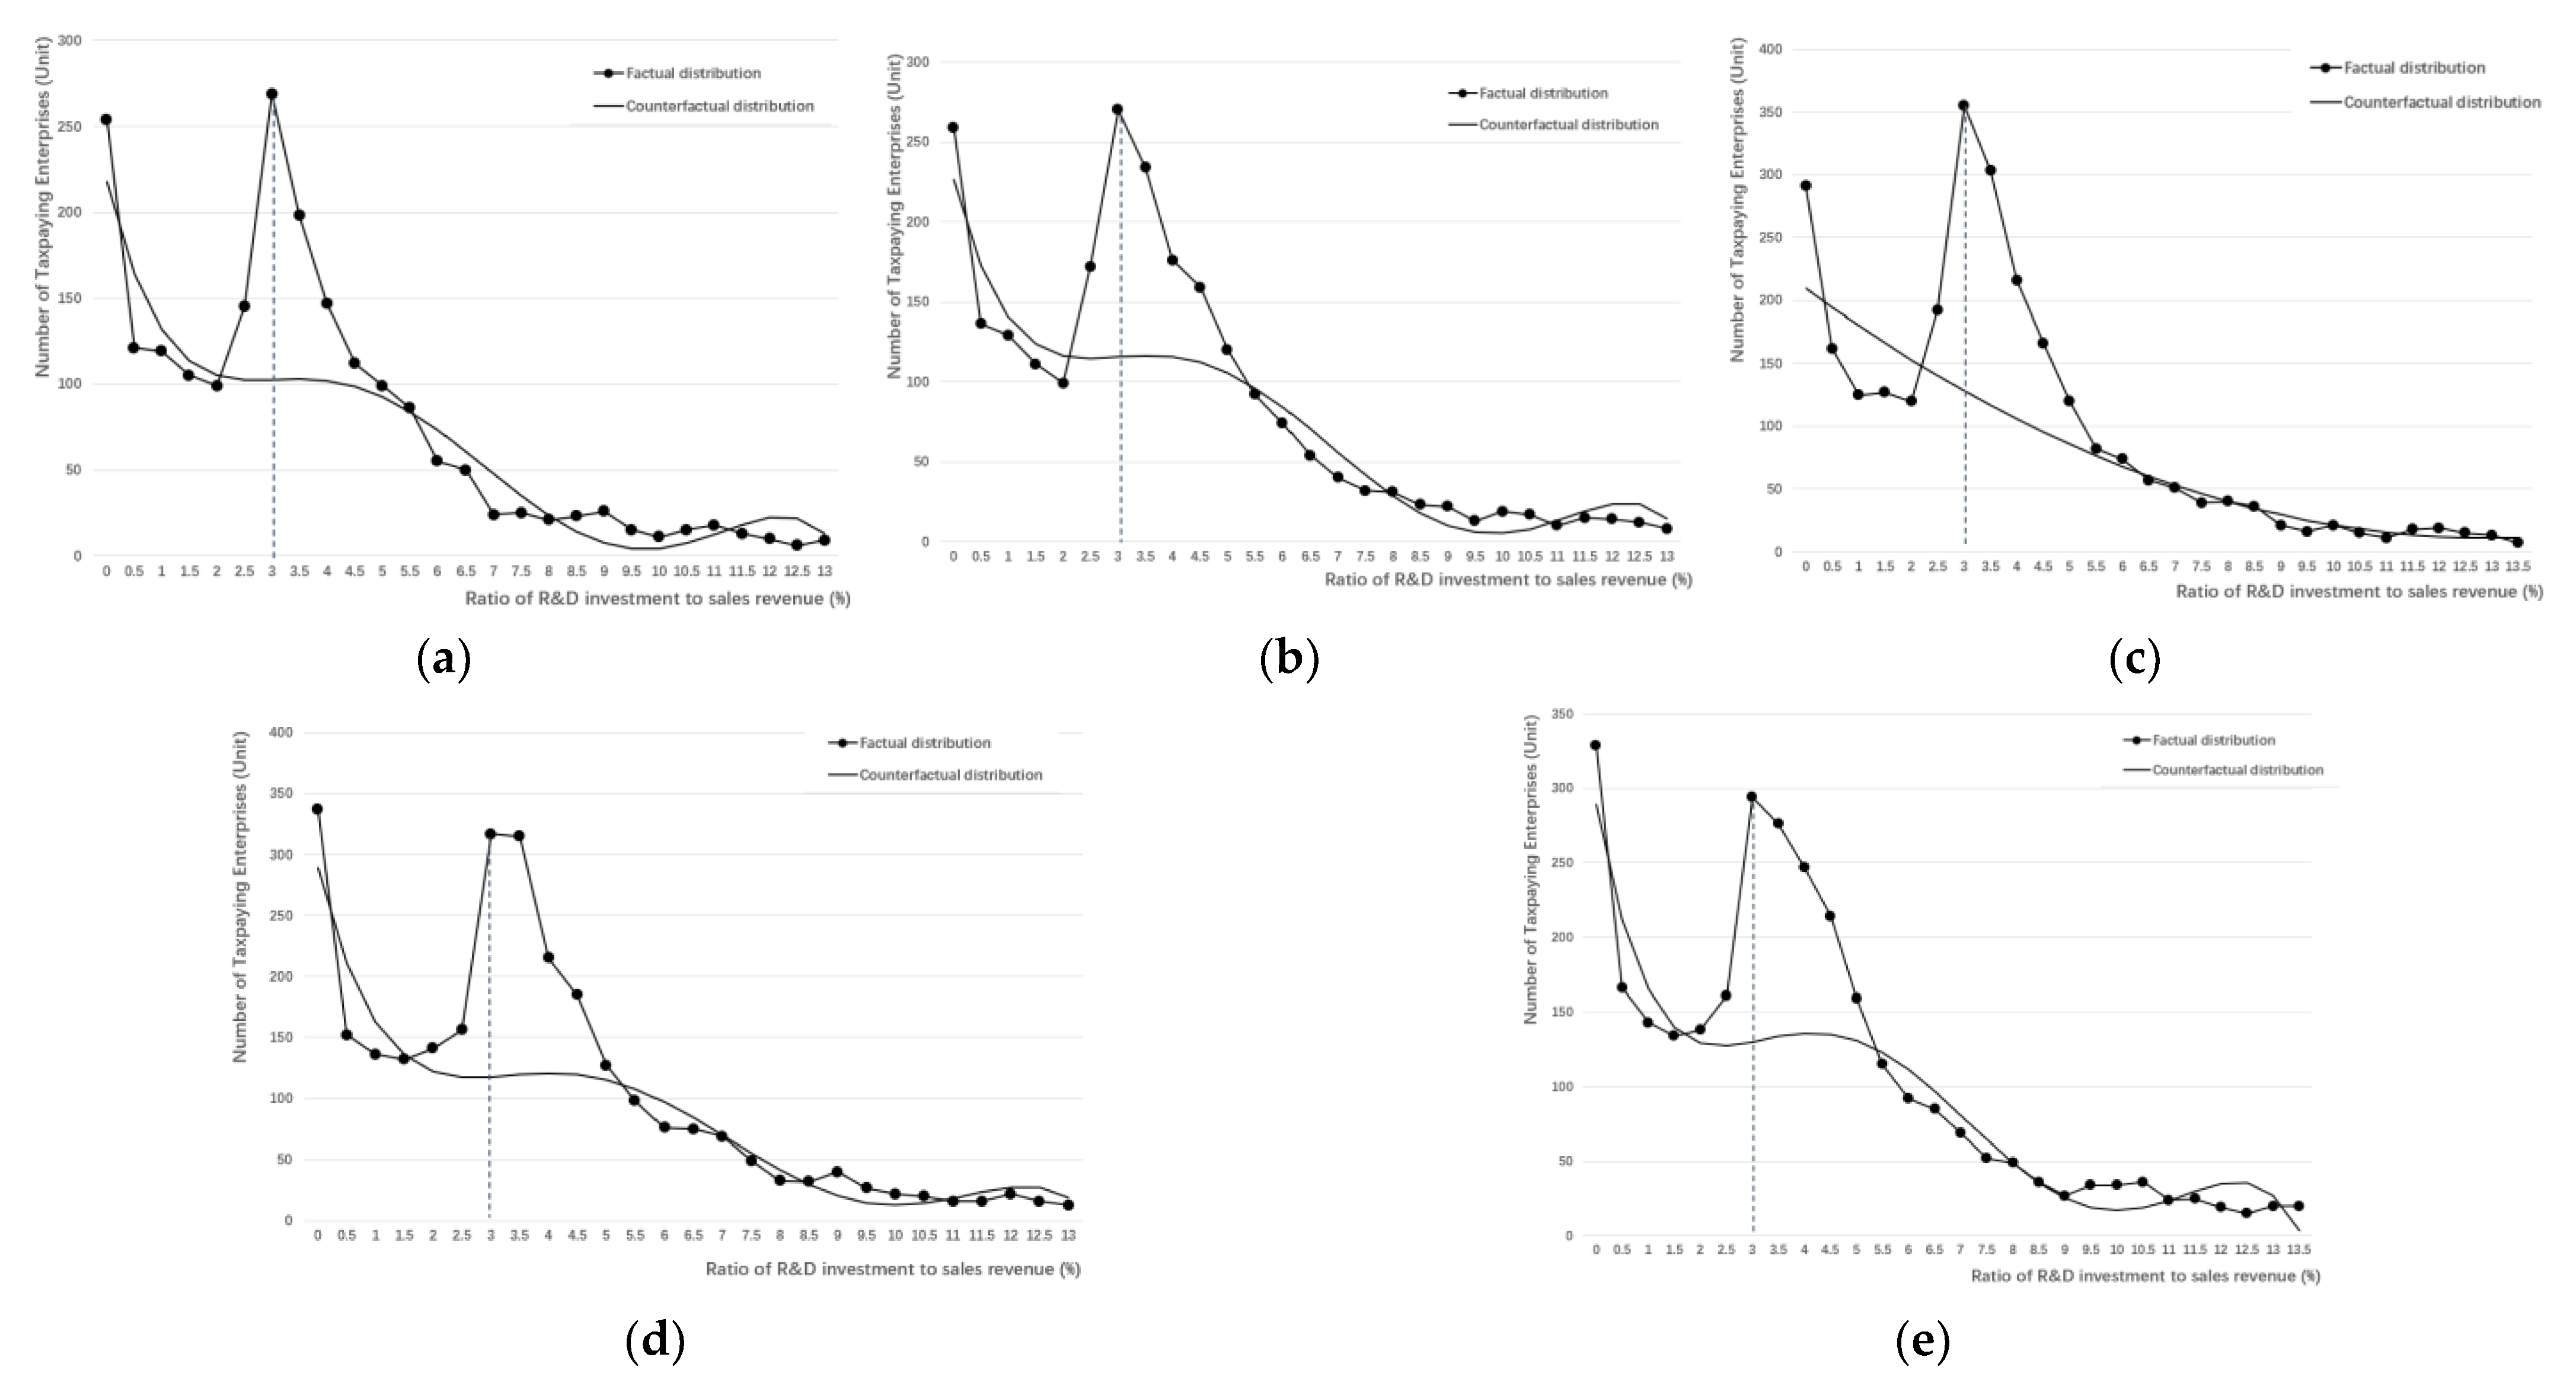
Figure 1.
Cluster distribution of R&D intensity of the full sample of listed companies. (a) Cluster distribution of R&D intensity of the full sample of listed companies in 2015; (b) Cluster distribution of R&D intensity of the full sample of listed companies in 2016; (c) Cluster distribution of R&D intensity of the full sample of listed companies in 2017; (d) Cluster distribution of R&D intensity of the full sample of listed companies in 2018; (e) Cluster distribution of R&D intensity of the full sample of listed companies in 2019.
Regression estimation of counterfactual distribution was carried out according to Equation (1), and the regression results are shown in Table 4. The R&D intensity of enterprises were divided into several subdistricts according to 0.5%. The data from 2015 to 2019 were taken as samples, and the number of observed samples in each interval count was used to draw the frequency distribution curve of the whole market. Columns (1)–(6) in Table 4 show the frequency distribution of high-order regression characterizations without institutional distortions. In 2017, the second-order regression of enterprise frequency distribution was significantly positive at the 1% level. The fifth-order regression of frequency distribution in the remaining years was significantly positive at the 1% level. Columns (7)–(10) in Table 4 were used to absorb the degree of deviation from the counterfactual distribution in reality (when there is no institutional breakpoint), showing the part distorted by institutions near the single extraction point .
Table 4.
Regression estimation results of counterfactual distribution of the full sample of listed companies.
We extracted the coefficients obtained from columns (1)–(6) in Table 4. Then we excluded columns (7)–(10) from the estimation of the deviation of the distorted section. The first part is retained to fit the frequency of counterfactual distribution in the R&D proportion interval. According to Equations (2) and (3), we obtained the cluster value B and the value of the counterfactual curve. In this way, we could measure the market reaction. The fact distribution and counterfactual distribution were plotted in combination with Figure 1, as shown in Figure 2. The upper and lower bounds of the cluster distribution were, respectively, g− = 3% and, g+ (3.81%, 3.98%). Therefore, the degree of corporate behavior distortion under the preferential tax policy of high-tech enterprises is ∆g (0.81%, 0.98%).
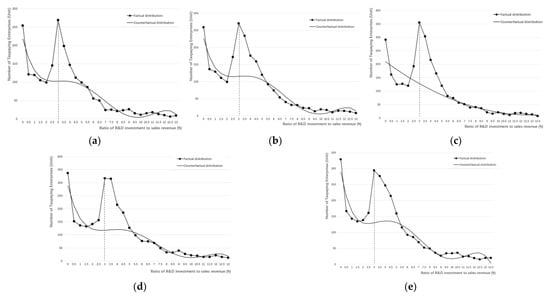
Figure 2.
Factual distribution and counterfactual distribution of R&D intensity of the full sample of listed companies. (a) Factual distribution and counterfactual distribution of R&D intensity of the full sample of listed companies in 2015; (b) Factual distribution and counterfactual distribution of R&D intensity of the full sample of listed companies in 2016; (c) Factual distribution and counterfactual distribution of R&D intensity of the full sample of listed companies in 2017; (d) Factual distribution and counterfactual distribution of R&D intensity of the full sample of listed companies in 2018; (e) Factual distribution and counterfactual distribution of R&D intensity of the full sample of listed companies in 2019.
Taxable income elasticity is the core index used to evaluate the loss of tax efficiency and further analyze the change in welfare level. The cluster analysis method can completely solve the endogenous bias in the estimation process, and the results are more robust. Based on the R&D investment of listed enterprises in China from 2015 to 2019, the tax elasticity of R&D investment calculated from Equation (4) is 0.55–0.8. This indicates that the growth rate of R&D investment of Chinese enterprises is higher than that of the R&D investment tax.
4.1.2. Elasticity of Taxable Income from R&D Investment in Manufacturing Industry
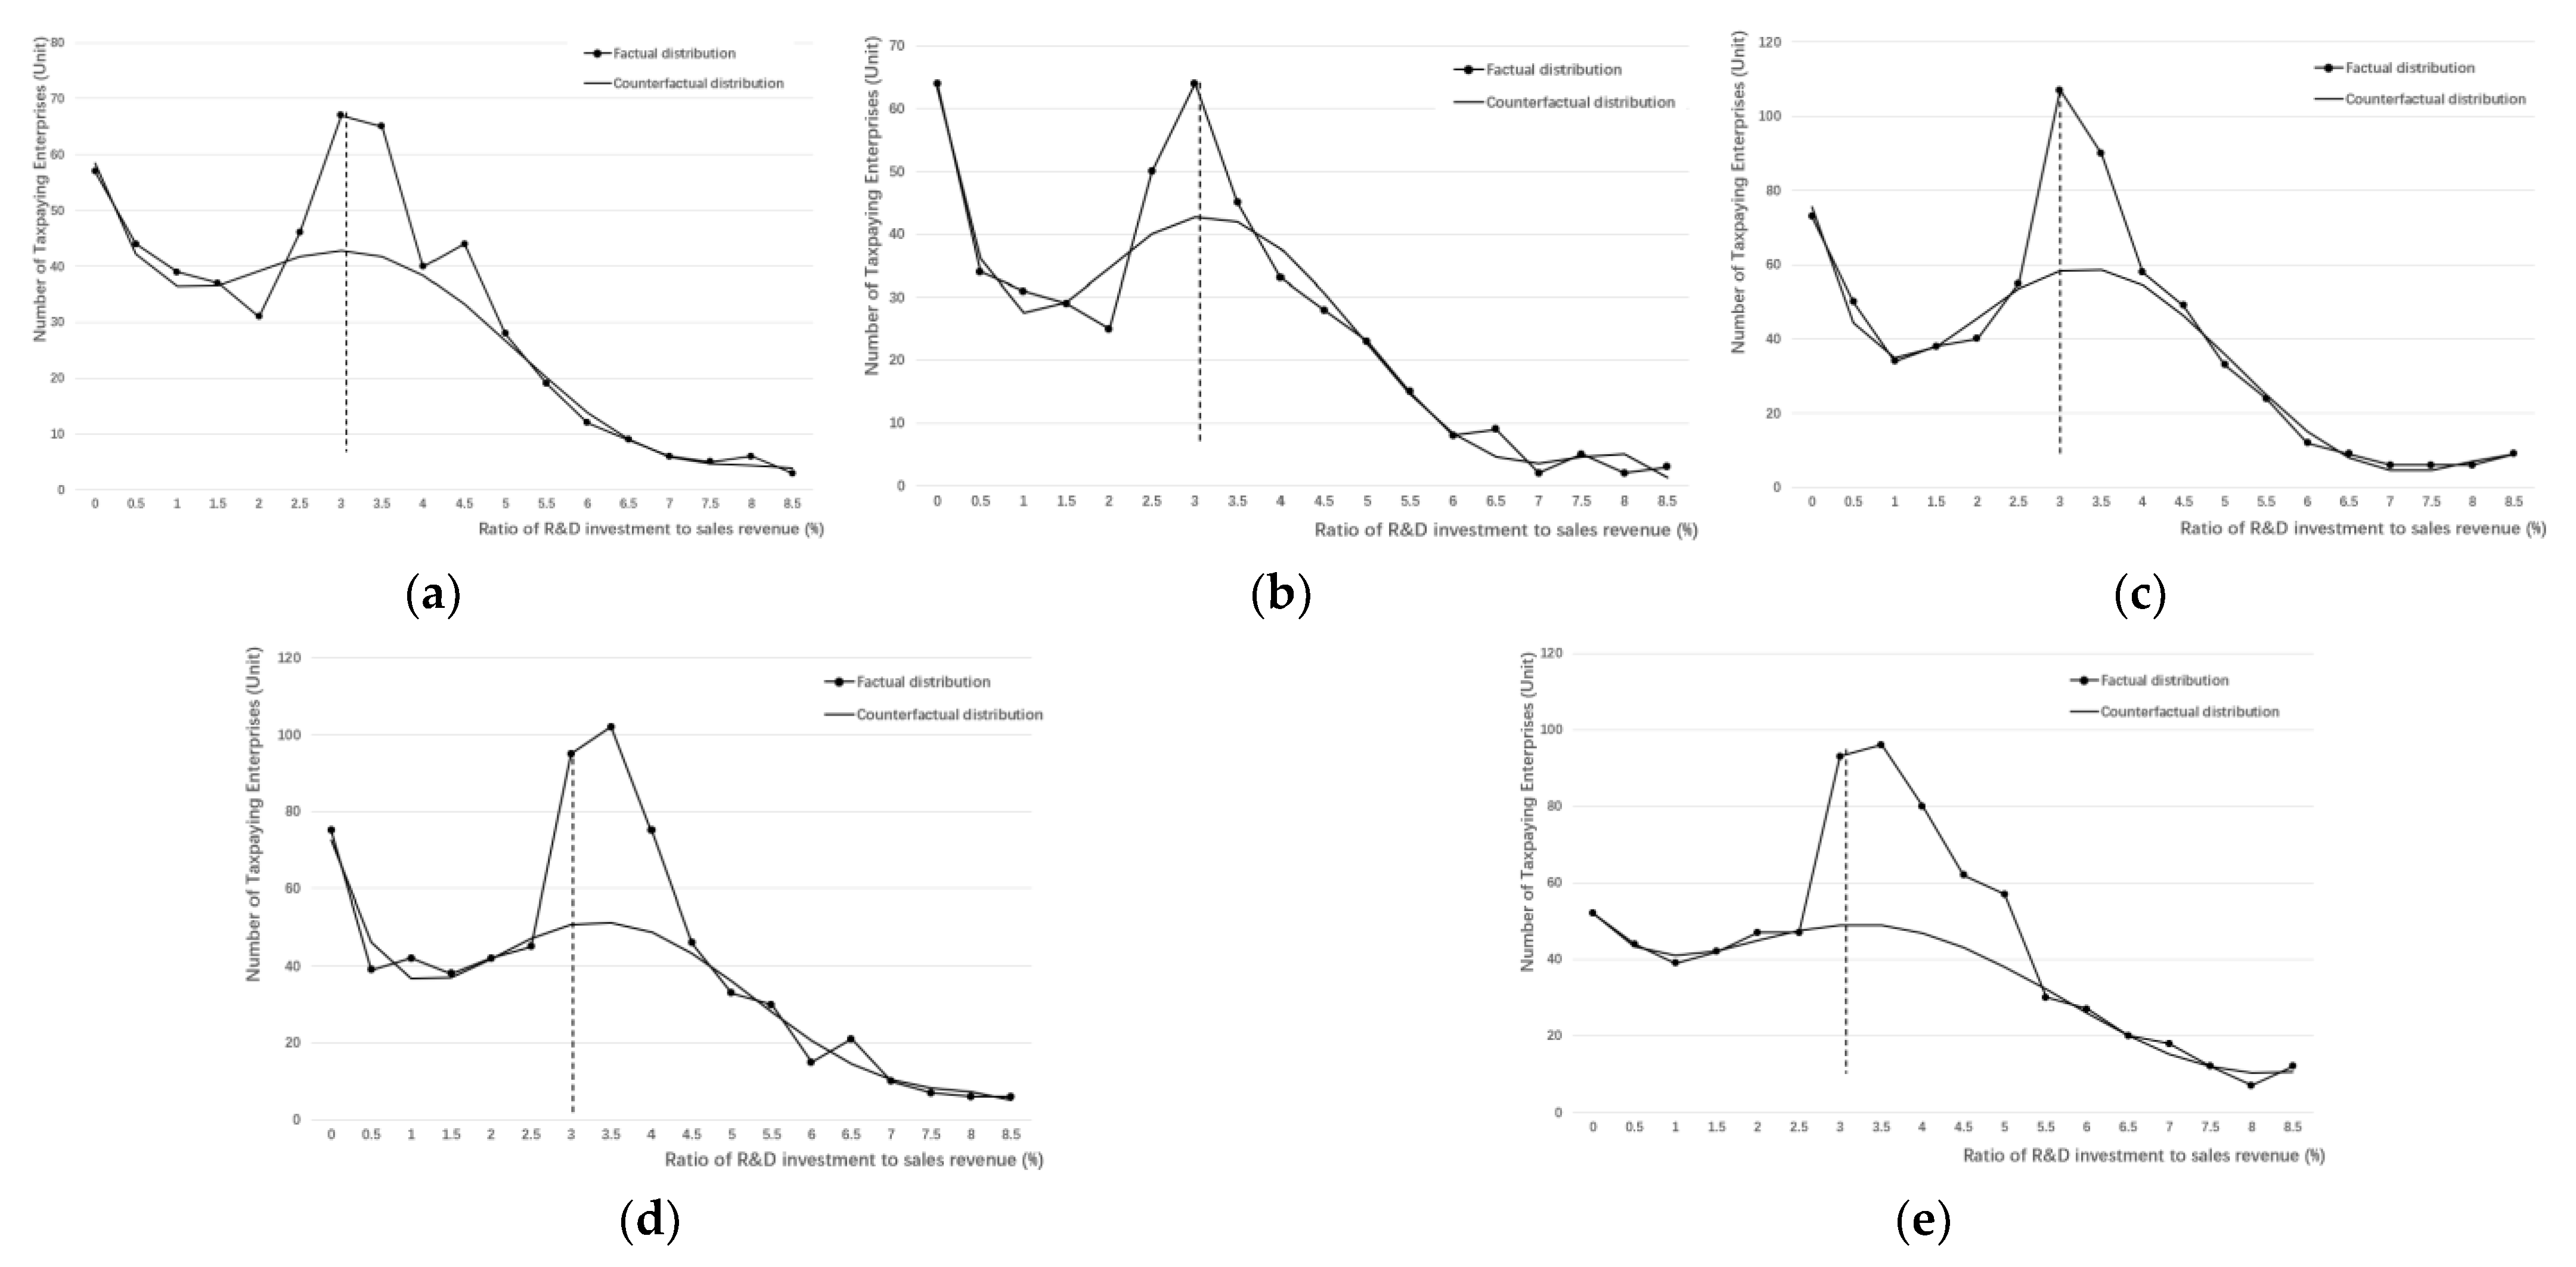
Table 5 shows the results of counterfactual estimation of R&D intensity of listed manufacturing companies in China according to Equation (1). Columns (1)–(6) in Table 5 show the frequency distribution of high-order regression characterizations without distortions of tax incentives. The fifth-order regression of frequency distribution from 2015 to 2019 was significantly positive at the 1% level. Columns (7)–(10) in Table 5 are used to absorb the extent to which the distribution deviates from the counterfactual distribution in reality (without institutional breakpoints), showing the part distorted by institutions near the single extraction point . Extract the coefficients obtained from columns (1)–(6) in Table 5. Exclude (7)–(10) from the estimation of the deviation of the distorted section. The first part can be retained to fit the frequency of counterfactual distribution in the R&D proportion interval. According to Equations (2) and (3), we can get the value of the cluster value B and the value of the counterfactual curve to calculate the reaction degree of the market ∆g.
Table 5.
Regression estimation results of counterfactual distribution of manufacturing enterprises.
The upper and lower bounds of the cluster distribution are g− = 3% and, g+ (3.85%, 3.95%). The degree of corporate behavior distortion under the preferential tax policy for high-tech enterprises is ∆g (0.85%, 0.95%). Figure 3 draws a counterfactual distribution curve based on the above counterfactual estimation results. The tax elasticity of R&D investment, calculated with Equation (4), is 0.6–0.75. This means that the elastic fluctuation range of taxable income of China’s manufacturing enterprises is narrower than the overall level, and the degree of distortion under the preferential tax policies is lower than the whole level. Comparing the taxable income elasticity between the manufacturing industry and the whole level, the growth rate of R&D investment tax in China’s manufacturing enterprises is lower than that of R&D investment. The tax burden on manufacturing enterprises to improve R&D intensity is lower than the overall level of the society, which encourages the manufacturing industry to increase R&D input intensity and promote high-quality innovation in economic development.
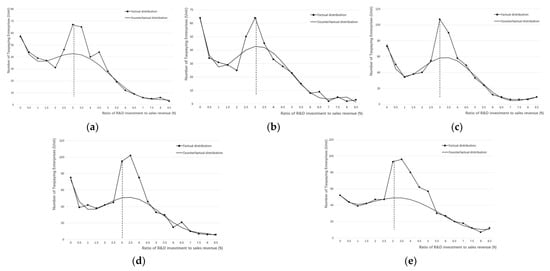
Figure 3.
Factual distribution and counterfactual distribution of R&D intensity of manufacturing enterprises. (a)Factual distribution and counterfactual distribution of R&D intensity of manufacturing enterprises in 2015; (b)Factual distribution and counterfactual distribution of R&D intensity of manufacturing enterprises in 2016; (c) Factual distribution and counterfactual distribution of R&D intensity of manufacturing enterprises in 2017; (d)Factual distribution and counterfactual distribution of R&D intensity of manufacturing enterprises in 2018; (e)Factual distribution and counterfactual distribution of R&D intensity of manufacturing enterprises in 2019.
4.2. The Impact of Management Decisions on R&D Performance
Based on the degree of behavior distortion of listed companies and manufacturing firms in China, this paper further studies the effects of a series of firm characteristics on R&D performance under different expected performance levels by taking firms within the R&D manipulation range as the research object. There are differences in the behaviors of the management when the enterprise has a positive or negative performance gap. Under a performance aspiration gap in heterogeneous organizations, enterprises in the distorted section of the tax incentive system have different contribution degrees of R&D investment to R&D performance when carrying out R&D activities. Therefore, an empirical analysis was conducted on the impact of heterogeneity by sampling the positive or negative organizational performance aspiration gap.
As the dependent variable is a counting variable, the Poisson regression model is adopted. The required data are screened according to the following steps based on the data in Table 1: (1) the R&D intensity of the enterprise is between 3% and the upper bound of the R&D manipulation interval; (2) the enterprise data should be continuous and the disclosure information should cover all the research variables. The final retained sample is panel data of 194 enterprises from 2015 to 2019. Among them, 70 enterprises had a positive organizational performance aspiration gap and 124 enterprises had a negative organizational performance aspiration gap. Due to space limitations, we only report the situation of α = 0.5, α = 0.2 and α = 0.8 as shown by the robustness test. Substituting it into Equation (6), the regression results are as shown in Table 6.
Table 6.
Regression results of R&D performance with different organizational performance aspiration gaps (2015–2019).
Table 6 shows the results of Equation (6) as follows: (1) test results of the impact of the organizational performance expectation gap on enterprise innovation performance; (2) the influence of firm capability, firm debt structure, and firm rights on firm innovation performance; (3) the effect of the organizational performance expectation gap on promoting enterprise technological innovation by influencing the contribution of firm characteristics to firm innovation performance. In Table 6, column (1) is listed as the test result where the organizational performance expectation gap is positive; column (2) is listed as the test result where the organizational performance expectation gap is negative. The result of column (1) shows that, at the level of 1%, the regression coefficient of firm characteristics is significantly positive. Column (2) indicates that the regression coefficient of firm characteristics is significantly positive at the level of 5%, indicating that all the explanatory variables of firm characteristics selected in this paper have an impact on firm innovation output.
It can be seen from the sample regression results in column (1) of Table 6 that, where the gap between organizational performance aspirations is positive, both R&D investment and sales revenue have a positive impact on enterprise R&D performance. Sales revenue reflects an enterprise’s operating ability, which determines the basis of R&D investment. Both sales revenue and R&D input have a positive impact on R&D output. However, the R&D investment is higher than the sales revenue. The interest-bearing debt ratio and the company’s largest shareholder shareholding ratio both play an inhibiting role. The rights and interests of managers and the subject of enterprise rights play a promoting role.
It can be seen from the sample regression results in column (2) of Table 6, where the organizational performance aspiration gap is negative, that both R&D investment and sales revenue have a positive impact on enterprise R&D performance. The results are consistent with the positive expectation level. Comparing the data in column (1) of Table 6, we see that the impact coefficient of R&D investment increased from 0.3623 to 0.4339. When the actual performance was lower than the expected performance, the promoting effect of R&D investment on R&D performance was more significant. The influence of the debt structure on firm innovation performance changed, and the influence coefficient of interest-paying debt ratio changed from negative to positive. This shows that an increase in the debt level will promote the R&D output of enterprises under the current situation.
Next, we compared the explanatory variable coefficients in columns (1) and (2) of Table 6. On the one hand, enterprises with a positive organizational performance aspiration gap have achieved higher actual performance than expected, but the resultant mentality of wanting to maintain the status quo makes enterprises relax their management of R&D activities, which weakens the R&D performance and is not conducive to the improvement of the technological innovation level or to the long-term growth of enterprises. On the other hand, the role of the enterprise rights subject in the case of a negative organizational performance aspiration gap is contrary to that with a positive organizational performance aspiration gap. R&D manipulation deviates from the normal development track of the enterprise, damages the shareholders’ rights and corporate interests, and hinders the future development of the enterprise.
There are significant differences in the impact of factors such as R&D investment, debt ratio, and share proportion of the largest shareholder on the firm’s R&D performance under different organizational performance aspiration gap scenarios. This is not only reflected in the degree of influence of different variables, but also has positive and negative effects for the same variable. When the organizational performance aspiration gap is positive, the influence of the corporate R&D investment on the R&D performance is significantly lower than that of the firm’s decision when the organizational performance aspiration gap is negative. This reflects the fact that the management decisions in the context of the gap between performance aspirations of different organizations is a significant reason for influencing the contribution of R&D investment to R&D performance. When an enterprise is experiencing good performance, the benefit embezzlement motivation will inhibit the contribution of R&D investment to R&D performance. Similarly, when the firm is in business distress, the desire of management to prevent reputational punishment will promote the contribution of R&D investment to R&D performance. In addition, under different organizational performance aspiration gaps, the interest-bearing debt ratio also has an opposite influence on the enterprise’s R&D output. The interest-bearing debt ratio has a negative influence on the corporate R&D output when the organizational performance aspiration gap is positive. Otherwise, there is a positive correlation. This result is similar to the effect of R&D input on R&D output, and the tax shield value of corporate debt is reflected in the reduction in taxable income. When the actual performance is lower than the expected performance, under the influence of this gap, the debt ratio will stimulate enterprises to carry out R&D activities. When actual performance is higher than expected performance, firms focus more on the value of the tax shield of the debt ratio than on innovative R&D activities.
Therefore, unilateral improvement of R&D investment cannot effectively improve R&D performance. The mismatch between R&D investment and R&D performance still exists. The enterprise innovation driven by tax preferential policy cannot achieve the expected effect. It is difficult to achieve sustainable development requirements.
4.3. Robustness Test
4.3.1. Robustness Tests for Varying Time
We tested the robustness of the estimated results by transforming time intervals based on the characteristics of the clustering method. We replaced the time interval of the above panel data with 2016–2018 and 2017–2019, respectively, and substituted them into Equation (6) for the regression. The selected samples were 305 enterprises in the R&D manipulation range from 2016 to 2018 and 305 enterprises in the R&D manipulation range from 2017 to 2019. Among them, 111 had a positive organizational performance aspiration gap and 194 had a negative organizational performance aspiration gap. The results are shown in Table 7 and Table 8.
Table 7.
Regression results of R&D performance with different organizational performance aspiration gaps (2016–2018)..
Table 8.
Regression results of R&D performance with different organizational performance aspiration gaps (2017–2019).
Table 7 and Table 8 show that the estimation results of various enterprise characteristics are all significant. The sign before the coefficient is consistent with the previous estimate. Although the values of the coefficients are slightly different from the previous results, the relative sizes of the coefficients under different performance aspiration gaps are consistent, indicating that the estimated results are robust.
4.3.2. Robustness Test for Changing Weights
To enhance the robustness and persuasibility of the results, we calculated Equation (5) with = 0.2 and = 0.8, respectively, and carried out a regression of Equation (6). The regression results showed that the previous test results had not changed substantially. The conclusion was still robust. Table 9 and Table 10 shows the test results of = 0.2 and = 0.8, respectively.
Table 9.
Regression results of R&D performance with different organizational performance aspiration gaps (2015–2019)
Table 10.
Regression results of R&D performance with different organizational performance aspiration gaps (2015–2019)
5. Conclusions
Since the economy entered the new normal, the government has sought to constantly improve national policies for high-tech enterprises. It aims to improve the innovation environment of high-tech enterprises, enhance the vitality of high-tech enterprises, and promote their high-quality development. Therefore, it is of great practical significance to objectively evaluate the policy effect of large-scale tax reductions and clarify whether the tax reduction policy improves the development environment and development quality.
Due to enterprises’ R&D manipulation in the implementation of tax incentives, it is hard to apply the traditional causality identification methods of DID and RD. Therefore, we used the bunching approach to investigate the impact of tax incentives on the R&D investment level of high-tech enterprises based on the financial statement data of A-share full-sample listed companies from 2015 to 2019. The results showed that there were R&D manipulation behaviors in high-tech enterprises in China. The elasticity of taxable income in manufacturing enterprises is lower than its overall level in society. This means that the tax burden of increasing the R&D input of manufacturing enterprises is lower than the whole level for listed companies. We obtained new findings in the further study of corporate behavior in the tax manipulation interval. Enterprises tend to increase their R&D investment and actively adjust their debt structure when the actual performance is lower than expected. The tax shield value of debt is not conducive to the innovation output of high-tech enterprises when the actual performance is higher than expected.
The policy implications of the conclusions are as follows. Since there is a sharp drop in income tax rates near the breakpoint of tax incentives, companies have an incentive to obtain tax breaks by manipulating R&D investment. This is essentially a distortion of corporate behavior, which is not conducive to the precise implementation of policies and will lead to the loss of some tax revenue. Therefore, we should strengthen the examination of the financial behavior and tax behavior of enterprises based on further implementing preferential tax policies for high-tech enterprises. We should improve the early warning system of enterprise tax payment to prevent enterprises from avoiding tax payment obligations by manipulating tax payment through improper means. It is important that tax payments truly benefit the high-tech enterprises that need support and meet the policy requirements. We should strengthen the support of preferential tax policies for the manufacturing industry, further reduce the flexibility of taxable income of R&D input, and accelerate the innovation-driven development process of the manufacturing industry. In addition, enterprises can adjust the debt scale and debt structure in the heterogeneity of the organizational performance aspiration gap. A change in the corporate tax structure will affect the development space of enterprises to a certain extent and have negative effects on policy implementation. Therefore, it is still necessary to pay attention to the impact of the tax system design on the debt structure of enterprises while further implementing the preferential tax policy for high-tech enterprises.
This paper analyzes the phenomenon of R&D manipulation in Chinese listed companies and discusses the effect of the expected performance level on the transmission mechanism of firm behavior. With the gradual maturity of preferential tax policies for high-tech enterprises, scholars have carried out studies on the different characteristics of enterprises in enterprise decision making, such as the heterogeneity between state-owned enterprises and non-state-owned enterprises, and the psychological aspirations of enterprise executives. These directions lay a foundation for further research on the influence of different enterprise characteristics on the incentive effect of tax incentive policies. At the same time, although we have already discussed the influence of enterprise characteristics on innovation performance under the different organizational performance aspiration gaps, it is still necessary to further enrich the propagation path of such influence so as to better conduct enterprise innovation management and improve the preferential tax policies for high-tech enterprises. In addition, when analyzing the incentive effect of tax incentive policies in the future, the factors affecting enterprise heterogeneity should be more detailed to make policy structural adjustment more targeted.
Author Contributions
Conceptualization, W.S., K.Y. and Z.L.; formal analysis, W.S., K.Y. and Z.L.; methodology, W.S.; data curation, W.S.; validation, W.S.; writing—original draft, W.S.; writing—review and editing, W.S. and Z.L.; supervision, K.Y. and Z.L. All authors have read and agreed to the published version of the manuscript.
Funding
This research was funded by the National Natural Science Foundation of China, grant no. 41701593; Social Science Planning Research Project of Shandong Province, grant no. 16DJJJ06; and Qingdao Social Science Planning Project, grant no. QDSKL1601014; China Scholarship Council Program, grant no. 202006330107.
Institutional Review Board Statement
Not applicable.
Informed Consent Statement
Not applicable.
Data Availability Statement
The data presented in this study are available on request from the corresponding author. The data are not publicly available due to legal and privacy issues.
Acknowledgments
The authors are grateful to the anonymous reviewers and the editor for their constructive comments and suggestions for this paper.
Conflicts of Interest
The authors declare no conflict of interest.
References
- Freeman, C. National Systems of Innovation: The Case of Japan Technology Policy and Economics Performance-Lessons from Japan; Pinter Publishers: London, UK, 1987. [Google Scholar]
- Rauter, R.; Globocnik, D.; Perl-Vorbach, E.; Baumgartner, R.J. Open innovation and its effects on economic and sustainability innovation performance. J. Innov. Knowl. 2019, 4, 226–233. [Google Scholar] [CrossRef]
- Wang, S.; Chen, G.; Huang, D. Can the New Energy Vehicle Pilot Policy Achieve Green Innovation and Emission Reduc-tion?—A Difference-in-Differences Analysis on the Evaluation of China’s New Energy Fiscal Subsidy Policy. Sustainability 2021, 13, 8643. [Google Scholar] [CrossRef]
- Guellec, D.; Van Pottelsberghe, B. Does Government Support Stimulate Private R&D? OECD Econ. Stud. 1997, 29, 95–122. [Google Scholar]
- Steinmüller, E.; Thunecke, G.U.; Wamser, G. Corporate income taxes around the world: A survey on forward-looking tax measures and two applications. Int. Tax Public Financ. 2018, 26, 418–456. [Google Scholar] [CrossRef] [Green Version]
- Rego, S.; Wilson, R.J. Equity Risk Incentives and Corporate Tax Aggressiveness. J. Account. Res. 2012, 50, 775–810. [Google Scholar] [CrossRef]
- Costa, J. Carrots or Sticks: Which Policies Matter the Most in Sustainable Resource Management? Resources 2021, 10, 12. [Google Scholar] [CrossRef]
- Gordon, P. Preferential Tax Treatment of Capital Gains, Optimal Dividend Policy, and Capital Budgeting. Q. J. Econ. 1972, 86, 226–242. [Google Scholar] [CrossRef]
- Clemens, F.; Samina, S. How will brexit affect tax competition and tax harmonization? The role of discriminatory taxa-tion. Natl. Tax J. 2021, 72, 111–138. [Google Scholar] [CrossRef]
- Best, M.C.; Brockmeyer, A.; Kleven, H.J.; Spinnewijn, J.; Waseem, M. Production versus Revenue Efficiency with Limited Tax Capacity: Theory and Evidence from Pakistan. J. Political Econ. 2015, 123, 1311–1355. [Google Scholar] [CrossRef] [Green Version]
- Kleven, H.J.; Waseem, M. Using Notches to Uncover Optimization Frictions and Structural Elasticities: Theory and Evidence from Pakistan. Q. J. Econ. 2013, 128, 669–723. [Google Scholar] [CrossRef] [Green Version]
- Garicano, L.; Lelarge, C.; Van Reenen, J. Firm Size Distortions and the Productivity Distribution: Evidence from France. Am. Econ. Rev. 2016, 106, 3439–3479. [Google Scholar] [CrossRef] [Green Version]
- Plank, J.; Doblinger, C. The firm-level innovation impact of public R&D funding: Evidence from the German renewable en-ergy sector. Energy Policy. 2018, 113, 430–438. [Google Scholar] [CrossRef]
- Buravleva, Y.; Tang, D.; Bethel, B.J. Incentivizing Innovation: The Causal Role of Government Subsidies on Lithium-Ion Bat-tery Research and Development. Sustainability 2021, 13, 8309. [Google Scholar] [CrossRef]
- Alfawaire, F.; Atan, T. The Effect of Strategic Human Resource and Knowledge Management on Sustainable Competitive Advantages at Jordanian Universities: The Mediating Role of Organizational Innovation. Sustainability 2021, 13, 8445. [Google Scholar] [CrossRef]
- Song, S.; Hossin, M.A.; Yin, X.; Hosain, M.S. Accelerating Green Innovation Performance from the Relations of Network Po-tential, Absorptive Capacity, and Environmental Turbulence. Sustainability 2021, 13, 7765. [Google Scholar] [CrossRef]
- Khan, M.A.; Qin, X.Z.; Jebran, K.; Ullah, I. Uncertainty and R&D investment: Does product market competition matter? Res. Int. Bus. Finan. 2020, 52, 101167. [Google Scholar] [CrossRef]
- Harju, J.; Matikka, T.; Rauhanen, T. Compliance costs vs. tax incentives: Why do entrepreneurs respond to size-based regula-tions? J. Public. Econ. 2019, 173, 139–164. [Google Scholar] [CrossRef]
- Peng, M.W.; Heath, P.S. The Growth of the Firm in Planned Economies in Transition: Institutions, Organizations and Strategic Choice. Acad. Manage. Rev. 1996, 21, 492–528. [Google Scholar] [CrossRef] [Green Version]
- Cyert, R.M.; March, J.M. A Behavioral Theory of the Firm; Wiley-Blackwell: Hoboken, NJ, USA, 1963; Volume 2, pp. 169–187. [Google Scholar]
- Kahneman, D.; Tversky, A. Prospect Theory: An Analysis of Decision under Risk. Econometrica 1979, 47, 263–291. [Google Scholar] [CrossRef] [Green Version]
- Onji, K. The response of firms to eligibility thresholds: Evidence from the Japanese value-added tax. J. Public Econ. 2009, 93, 766–775. [Google Scholar] [CrossRef] [Green Version]
- Gourio, F.; Roys, N. Size-dependent regulations, firm size distribution, and reallocation. Quant. Econ. 2014, 5, 377–416. [Google Scholar] [CrossRef] [Green Version]
- Almunia, M.; Lopez-Rodriguez, D. Under the Radar: The Effects of Monitoring Firms on Tax Compliance. Am. Econ. J. Econ. Policy 2018, 10, 1–38. [Google Scholar] [CrossRef] [Green Version]
- Náñez Alonso, S.L. The Tax Incentives in the IVTM and “Eco-Friendly Cars”: The Spanish Case. Sustainability 2020, 12, 3398. [Google Scholar] [CrossRef] [Green Version]
- Jia, J.; Ma, G. Do R&D tax incentives work? Firm-level evidence from China. China Econ. Rev. 2017, 46, 50–66. [Google Scholar] [CrossRef]
- Song, M.; Wang, S.; Zhang, H.Y. Could environmental regulation and R&D tax incentives affect green product innovation? J. Clean. Prod. 2020, 258, 0959–6526. [Google Scholar] [CrossRef]
- Chen, Z.; Liu, Z.; Serrato, J.C.S.; Xu, D.Y. Notching R&D Investment with Corporate Income Tax Cuts in China. Am. Econ. Rev. 2021, 111, 2065–2100. [Google Scholar] [CrossRef]
- Chen, W.-R. Determinants of Firms’ Backward- and Forward-Looking R&D Search Behavior. Organ. Sci. 2008, 19, 609–622. [Google Scholar] [CrossRef]
- Saez, E. Do Taxpayers Bunch at Kink Points? Am. Econ. J. Econ. Policy 2010, 2, 180–212. [Google Scholar] [CrossRef] [Green Version]
- Brown, K.M. The link between pensions and retirement timing: Lessons from California teachers. J. Public Econ. 2013, 98, 1–14. [Google Scholar] [CrossRef]
- Liran, E.; Amy, F.; Paul, S. The Response of Drug Expenditure to Nonlinear Contract Design: Evidence from Medicare Part D. Q. J. Econ. 2015, 130, 841–899. [Google Scholar] [CrossRef] [Green Version]
- Greve, H.R. Organizational Learning from Performance Feedback: A Behavioral Perspective on Innovation and Change; Cambridge University Press: Cambridge, UK, 2003. [Google Scholar]
- Greve, H.R. Investment and the Behavioral Theory of the Firm: Evidence from Shipbuilding Industry. Corp. Chang. 2003, 12, 1051–1076. [Google Scholar] [CrossRef]
- Tan, Y.; Jamile, S.M.; Eduardo, M.C.; Md, K.; Giuseppe, I. Stimulating technological innovation through incentives: Percep-tions of Australian and Brazilian firms. Techno. Forecast. Soc. 2019, 146, 403–412. [Google Scholar] [CrossRef] [Green Version]
- Cui, A.S.; Calantone, R.J.; Griffith, D.A. Strategic change and termination of interfirm partnerships. Strat. Manag. J. 2010, 32, 402–423. [Google Scholar] [CrossRef]
- Boeker, W. Strategic Change: The Influence of Managerial Characteristics and Organizational Growth. Aca. Manage. J. 1997, 40, 152–170. [Google Scholar] [CrossRef]
- Sonenshein, S.; Dholakia, U. Explaining Employee Engagement with Strategic Change Implementation: A Meaning-Making Approach. Organ. Sci. 2012, 23, 1–23. [Google Scholar] [CrossRef]
- Haynes, K.T.; Hillman, A. The effect of board capital and CEO power on strategic change. Strat. Manag. J. 2010, 31, 1145–1163. [Google Scholar] [CrossRef]
- Meyer, A.; Goes, J.; Brooks, G. The Challenge of Change. In Longitudinal field Research Methods: Studying Processes in Organizational Change; Oxford University Press: New York, NY, USA, 1993; Volume 1, pp. 66–111. [Google Scholar]
- Bednar, M.K.; Boivie, S.; Prince, N.R. Burr Under the Saddle: How Media Coverage Influences Strategic Change. Organ. Sci. 2013, 24, 910–925. [Google Scholar] [CrossRef]
- Franco, M.; Merton, H.M. Corporate Income Taxes and the Cost of Capital: A Correction. Ame. Econ. Rev. 1963, 53, 433–443. [Google Scholar]
- Tong, T.W.; He, W.; He, Z.-L.; Lu, J. Patent Regime Shift and Firm Innovation: Evidence from the Second Amendment to China’s Patent Law. Acad. Manag. Proc. 2014, 2014, 14174. [Google Scholar] [CrossRef]
- Audia, P.G.; Locke, E.A.; Smith, K.G. The Paradox of Success: An Archival and a Laboratory Study of Strategic Persistence Following Radical Environmental Change. Aca. Manage. J. 2000, 43, 837–853. [Google Scholar] [CrossRef]
- Edgerton, J. Investment incentives and corporate tax asymmetries. J. Public Econ. 2010, 94, 936–952. [Google Scholar] [CrossRef]
- Desai, M.A.; Goolsbee, A. Investment, overhang, and tax policy. Brook. Pap. Econ. Act 2004, 2, 285–355. [Google Scholar] [CrossRef]
- Burgelman, R.A. Intraorganizational Ecology of Strategy Making and Organizational Adaptation: Theory and Field Re-search. Organ. Sci. 1991, 2, 239–262. [Google Scholar] [CrossRef]
- Bloom, N.R.; Griffith, J.; Van, R. Do R&D Tax Credits Work? Evidence from a Panel of Countries 1979–1997. J. Public. Econ. 2002, 85, 1–31. [Google Scholar] [CrossRef]
- Mukherjee, A.; Singh, M.; Zaldokas, A. Do Corporate Taxes Hinder Innovation? J. Financ. Econ. 2017, 124, 195–221. [Google Scholar] [CrossRef]
- Himmelberg, C.P.; Petersen, B.C. R&D and Internal Finance: A Panel Data Study of Small Firms in High Tech Industries. Rev. Econ. Stat. 1994, 76, 38–51. [Google Scholar] [CrossRef]
- Heider, F.; Ljungqvist, A. As certain as debt and taxes: Estimating the tax sensitivity of leverage from state tax changes. J. Financial Econ. 2015, 118, 684–712. [Google Scholar] [CrossRef]
- Anja, T.; Zeljko, T. Culture as antecedent of national innovation performance: Evidence from neo-configurational perspec-tive. J. Bus. Res. 2021, 125, 385–396. [Google Scholar] [CrossRef]
- Fuest, C.; Peichl, A.; Siegloch, S. Do Higher Corporate Taxes Reduce Wages? Micro Evidence from Germany. Am. Econ. Rev. 2018, 108, 393–418. [Google Scholar] [CrossRef] [Green Version]
- Diamond, R.; Persson, P.E.F. The Long-term Consequences of Teacher Discretion in Grading of High-stakes Tests. NBER. 2016, 22207. [Google Scholar] [CrossRef]
Publisher’s Note: MDPI stays neutral with regard to jurisdictional claims in published maps and institutional affiliations. |
© 2021 by the authors. Licensee MDPI, Basel, Switzerland. This article is an open access article distributed under the terms and conditions of the Creative Commons Attribution (CC BY) license (https://creativecommons.org/licenses/by/4.0/).