1. Introduction
Since the early 1990s, a large empirical literature in economics has established a persuasive link between institutions and long-run economic development [
1,
2,
3,
4,
5,
6,
7,
8,
9,
10,
11,
12]. Institutional quality is a broad concept that refers to law, individual rights and the provision of government regulation and services. A breakdown in these attributes undermines and weakens the institutional framework supporting economic development. Although the causality of the relationship between strong institutions and long-run economic development may be in doubt [
2], the possibility that economic progress, institutional quality and good governance go hand-in-hand is rarely questioned. Recent evidence also shows that more effective institutions and governance are essential to reducing extreme poverty and achieving other development goals that are important to low and middle-income economies [
13].
This raises an important question. As the world shifts its focus towards making development more “sustainable”, as reflected in the UN’s Agenda 2030, are weak institutions and governance inhibiting long-term progress towards sustainability, especially in poorer economies? For example, does a break down in factors such as the effective rule of law, an uncertain business climate, insecure property rights and the presence of social norms that are not conducive to market-based trade and transactions, constrain sustainable development? [
10,
11].
In 2015, the General Assembly of the United Nations (UN) formally adopted “The 2030 Agenda for Sustainable Development”. This provides a framework for “peace and prosperity for people and the planet, now and into the future” [
14]. The centerpiece of Agenda 2030 are the 17 Sustainable Development Goals (SDGs). As Jeffrey Sachs emphasized, the SDGs “aim for a combination of economic development, environmental sustainability and social inclusion” [
15], p. 2206. Attaining the SDGs can be viewed as sustainable development in its broadest sense, through achieving progress across economic, social and environmental systems simultaneously [
16,
17,
18]. This approach has been called the systems approach to sustainability, and is attributed to Barbier (1987) [
19]. The 17 SDGs can be attributed to the economic, social and environmental systems. For example SDG 1: No Poverty, and SDG 8 Good Jobs and Economic Growth are goals within the economic system. SDG 13 Climate Action and SDG 14 Life below Water are environmental system goals. Within the social system goals, SDG 10 Reduced Inequality and SDG 16 Peace, Justice and Institutions reside [
16,
17,
18].
The systems approach to sustainability contrasts with the economists’ capital approach to sustainability [
20]. The capital approach to sustainability treats nature as a form of capital. In order to ensure that future generations have at least the same economic opportunities, and thus the same economic welfare, as the present generation, the capital approach to sustainability entails managing and enhancing a portfolio of assets. This portfolio of assets comprise the total capital stock, which consists of physical, human and natural capital. In addition to maintaining or enhancing the total stock of capital, any essential natural capital needs to be kept “intact” due to imperfect substitution, irreversible losses and uncertainty over values [
20].
Within the SDGs systems approach to sustainability, institutional attributes seem to be under-represented in the 17 SDGs of Agenda 2030. Only one of the goals, SDG 16 Peace, Justice and Strong Institutions, includes these attributes, and they are narrowly defined. For example, the 23 indicators currently proposed by the UN to track progress towards SDG 16 focus mainly on reducing violence, conflict and political instability rather than on broader measures of institutional quality and governance [
21]. Although peace and political stability are essential to sustainable development, strong institutions also imply creating the economy-wide business and market conditions to sustain economic progress and development through promoting effective government, the rule of law, reducing unnecessary regulation, greater accountability and minimizing corruption and risk. As summarized by the World Bank: “Strong institutions and conducive business climates can set the stage for vigorous growth. Institutions can promote forms of economic activity that are associated with greater economic complexity and higher productivity growth by encouraging human capital accumulation and innovative activities.” [
22], p. 40.
In this article, we examine further whether better institutional quality and a more conducive business climate can help or hinder advancement towards the 17 Sustainable Development Goals (SDGs) of UN Agenda 2030. To assess attainment of these goals, we make use of our existing analysis of the net welfare changes of advancement towards the 17 SDGs over the period 2000–2018. We do this at the world level, for the group of low-income countries and for nine representative developing countries [
17]. For the same sets of countries, we contrast and compare our estimates of net welfare gains or losses with two institutional quality and governance indicators over the same period.
Given that institutional quality is a broad concept that reflects the state of the law, individual rights and the provision of government regulation and services within a country, it is difficult to obtain precise indicators and reliable data. We use the Worldwide Governance Indicators (WGI) [
23] and Country Risk Classification (CRC) of the Organization for Economic Cooperation and Development (OECD) [
24] as our two broad institutional quality and governance measures. Although such indicators have attracted some criticisms, they have become widely accepted and used by policy makers and academics [
11]. The WGI include not only an indicator representing political stability and absence of violence, but also indicators for control of corruption, government effectiveness, regulatory quality, rule of law, voice and accountability. The CRC measures broadly the risk of “doing business” in a country. It includes a measure of credit risk and a qualitative assessment of other factors that contribute to country level risk, such as natural disasters including floods, earthquakes and other natural hazards, as well as man-made crises such as war, expropriation, revolution, civil disturbance. We use the WGI to construct an overall indicator of institutional quality and the CRC to represent country risk.
We find that SDG welfare gains are somewhat correlated with institutional quality and highly correlated with lower country risk. Ineffective institutions and country risk seem to be especially associated with a lack of SDG progress in poorer economies. The implication is that the inability to improve governance may be constraining the long-term welfare and development of many poorer economies. On the positive side, countries with better quality institutions and lower risk appear to have made overall gains towards fulfilling the SDGs. These results suggest that effective institutions and good governance are associated with long-run development and greater sustainability. Long-term progress towards the SDGs may hinge on improved institutional quality and reduced country risk.
2. Materials and Methods
We have previously developed a methodological approach in order to assess progress towards the 17 SDGs, based on welfare economics [
16,
17]. Our approach to estimating the possible net benefits of making progress towards one SDG goal, while accounting for simultaneous declines or improvements in achieving other goals, is based on standard economic methods for measuring the welfare effects arising from changes in imposed quantities [
25,
26]. Here, we use the approach previously developed by Barbier and Burgess [
16] to estimate the welfare effects of progress in attaining one SDG while accounting for interactions in achieving other SDGs. In essence, this analytical framework allows us to estimate the “willingness to pay” (WTP) in dollar terms by a representative individual for an improvement in one SDG indicator, whilst taking into account possible simultaneous changes–positive or negative–in other SDG indicators. The reason it is important to do this is that many assessments have shown that, since 2000, there has been considerable variation from country to country in the progress towards attaining the SDGs, as well as between the world and low-income economies. Furthermore, that progress in attaining any individual goal may have led to the reduction (or increase) of achievement in other goals [
16,
17,
27,
28,
29,
30].
We have applied our method at the world level, for the group of low-income countries and for nine representative developing countries over the period 2000–2018 [
17]. We use the World Bank’s classification of countries by income [
31]. Low-income economies are defined by the World Bank as those with a Gross National Income (GNI) per capita of 1045 USD or less in 2020; lower middle-income economies are those with a GNI per capita between 1046 USD and 4095 USD; and upper middle-income economies are those with a GNI per capita between 4096 USD and 12,695 USD. The remaining countries of the world are classified as high income, with a GNI per capita of 12,536 USD or more. The nine representative countries we chose are Malawi, Rwanda and Uganda (three low-income economies), Bangladesh, Bolivia and the Kyrgyz Republic (three lower middle-income economies) and Colombia, Dominican Republic and Indonesia (three upper middle-income economies). In selecting these countries, we also took into account the extent to which a country has made progress since 2000 towards achieving the main goal used in our analysis, which is SDG 1 No Poverty. For each income group we chose three countries that showed long-term poverty reduction since 2000, and our nine countries vary between those with small to very large declines in poverty. Finally, in choosing countries, we also considered their geographic distribution. Consequently, we selected three countries each from Asia, Latin America and the Caribbean, and Sub-Saharan Africa [
17].
Table 1 summarizes the 17 SDGs and the main indicators that we used to measure progress towards each goal. In our analysis, we chose SDG 1 No Poverty as the benchmark indicator. We estimate the change in per capita welfare from any reduction in 2000–2018 poverty rates, and adjust this to take account of any gains or losses that may occur when simultaneously achieving each of the other 16 SDGs. Further details on how we chose these indicators and the methods we use to measure these welfare gains or losses can be found in [
11]. For SDG 16, Peace, Justice and Strong Institutions, we use as a representative indicator
political stability and absence of violence/terrorism from the Worldwide Governance Indicators (WGI) [
23] (
Table 1).
In this article, we contrast and compare our estimates from our previous study of the net welfare changes of progress towards the 17 SDGs over 2000–2018 [
17], with two institutional quality and governance measures over the same period at the world level, for the group of low-income countries and for nine representative developing countries. Here, we use the Worldwide Governance Indicators (WGI) [
23] and Country Risk Classification (CRC) of the Organization for Economic Cooperation and Development (OECD) [
24] for our two broad institutional quality and governance measures, respectively.
The World Governance Indicators consists of six measures of institutional quality and governance. These include
political stability and absence of violence/terrorism, which measures perceptions of the likelihood of political instability and/or politically-motivated violence, including terrorism. The second indicator,
control of corruption, reflects perceptions of the extent to which public power is exercised for private gain, including both petty and grand forms of corruption, as well as “capture” of the state by elites and private interests. The third indicator,
government effectiveness, indicates perceptions of the quality of public services, the quality of the civil service and the degree of its independence from political pressures, the quality of policy formulation and implementation, and the credibility of the government’s commitment to such policies. The fourth indicator,
regulatory quality, reflects perceptions of the ability of the government to formulate and implement sound policies and regulations that permit and promote private sector development. The fifth indicator,
rule of law, captures perceptions of the extent to which agents have confidence in and abide by the rules of society, and in particular the quality of contract enforcement, property rights, the police, and the courts, as well as the likelihood of crime and violence. And finally the sixth indicator,
voice and accountability, measures perceptions of the extent to which a country’s citizens are able to participate in selecting their government, as well as freedom of expression, freedom of association, and a free media [
23].
These six measures of Worldwide Governance Indicators are scaled, with the lowest value at −2.5 and the highest value at 2.5. The current database covers the period from 1996 to 2019, and includes over 200 countries. Using this information, we are able to derive a measure of institutional quality based on an average of the six measures in the WGI from 2000 to 2018 at the world level, for the group of low-income countries and for nine representative developing countries. Finally, we rescale this average institutional quality indicator over 2000 to 2018 from 0 (lowest value) to 5 (highest value).
According to the OECD, its Country Risk Classification (CRC) is “one of the most fundamental building blocks of the Arrangement rules on minimum premium rates for credit risk” [
24]. Consequently, the CRC is a broad measure of country risk, which “encompasses transfer and convertibility risk (i.e., the risk a government imposes capital or exchange controls that prevent an entity from converting local currency into foreign currency and/or transferring funds to creditors located outside the country) and cases of force majeure (e.g., war, expropriation, revolution, civil disturbance, floods, earthquakes)” [
24].
The CRC is scaled from 0 (lowest) to 7 (highest). The current classification covers 201 countries from 1999 to 2021. Consequently, for each country we take the average of its final year score over 2000 to 2018, and thus construct an average measure of this period at the world level, for the group of low-income countries and for nine representative developing countries.
3. Results
Table 2 summarizes the comparison of our estimates of the changes in net welfare from progress towards the 17 SDGs over the period from 2000 to 2018 with average institutional quality and average country risk over the same period at the world level, for the group of low-income countries and for nine representative developing countries.
Our analysis of changes in net welfare from progress towards the 17 sustainable development goals shows that there are substantial differences in the level of interactions among the SDGs and the corresponding net welfare effects at the global level compared to that experienced by low-income countries [
17]. At the global level, there are some welfare losses through tradeoffs with declining SDG indictors over 2000–2018, but these losses are mostly compensated by increases in other SDG indictors. Once such interactions are taken into account, there is an overall net gain in welfare of 3633 USD per person on average at the world level from 2000 to 2018 (
Table 2). Therefore, our welfare analysis suggests that there has been an overall enhancement in sustainability at the global level from 2000 to 2018.
In comparison, for poor economies, the tradeoffs from declining SDG indicators surpass the gains in welfare from improving indicators over the period from 2000 to 2018. As a result, for low-income countries, these interactions imply that countries in this group have experience a net loss in welfare over the period from 2000 to 2018 of 29 USD per person on average. This means that in contrast to the world as a whole, low-income economies experienced an overall reduction rather than an improvement in sustainability from 2000 to 2018.
This difference in the sustainability performance of poorer economies is also demonstrated across our nine representative countries. Here, we see that all nine countries benefit from progress towards SDG 1 No Poverty. However, when we take into account interactions with other SDGs, the less well-off countries tend to perform less well. For example, two of the three low-income economies–Rwanda and Uganda–and two of the three lower middle-income economies–Bolivia and the Kyrgyz Republic–all experience an overall loss in sustainability over the period from 2000 to 2018. In contrast, over this same period, the three upper middle-income economies demonstrate substantial gains from overall increase in sustainability over the period from 2000 to 2018 (
Table 2).
As
Table 2 shows, a similar pattern emerges for average institutional quality over 2000–2018, which ranges from 0 (low quality) to 5 (high quality). The world displays a much higher level of effective institutions and governance (2.5) than low-income countries (1.4). However, institutional quality is more mixed among our nine representative countries. For example, Colombia, Dominican Republic and Indonesia (our three upper middle-income economies) generally have the highest institutional quality, as well as Bolivia (which is a lower middle-income economy), and also Malawi and Rwanda (which are low-income countries).
Country risk appears to be much more closely associated with net welfare gains and losses (
Table 2). This indicator measure ranges from 0 (low risk) to 7 (high risk). Once again, low-income countries display much higher risk (6.9) compared to the world on average (4.5). This is also the case at the country level. For example, Malawi, Rwanda and Uganda (our three low-income countries) show country risk levels of 7.0, 6.8 and 6.4 respectively. Very high country risk (7.0) is also displayed by the Kyrgyz Republic, which is a lower middle-income economy, and Bangladesh and Bolivia (also middle-income economies), have slightly lower risk at 5.7 and 6.3 respectively. In contrast, the country risk for the three countries in the upper middle-income category are close to the world average.
4. Discussion
Figure 1 and
Figure 2 further aid the interpretation of these results, especially with respect to understanding whether institutional quality and governance help or hinder progress towards the 17 Sustainable Development Goals (SDGs) of UN Agenda 2030.
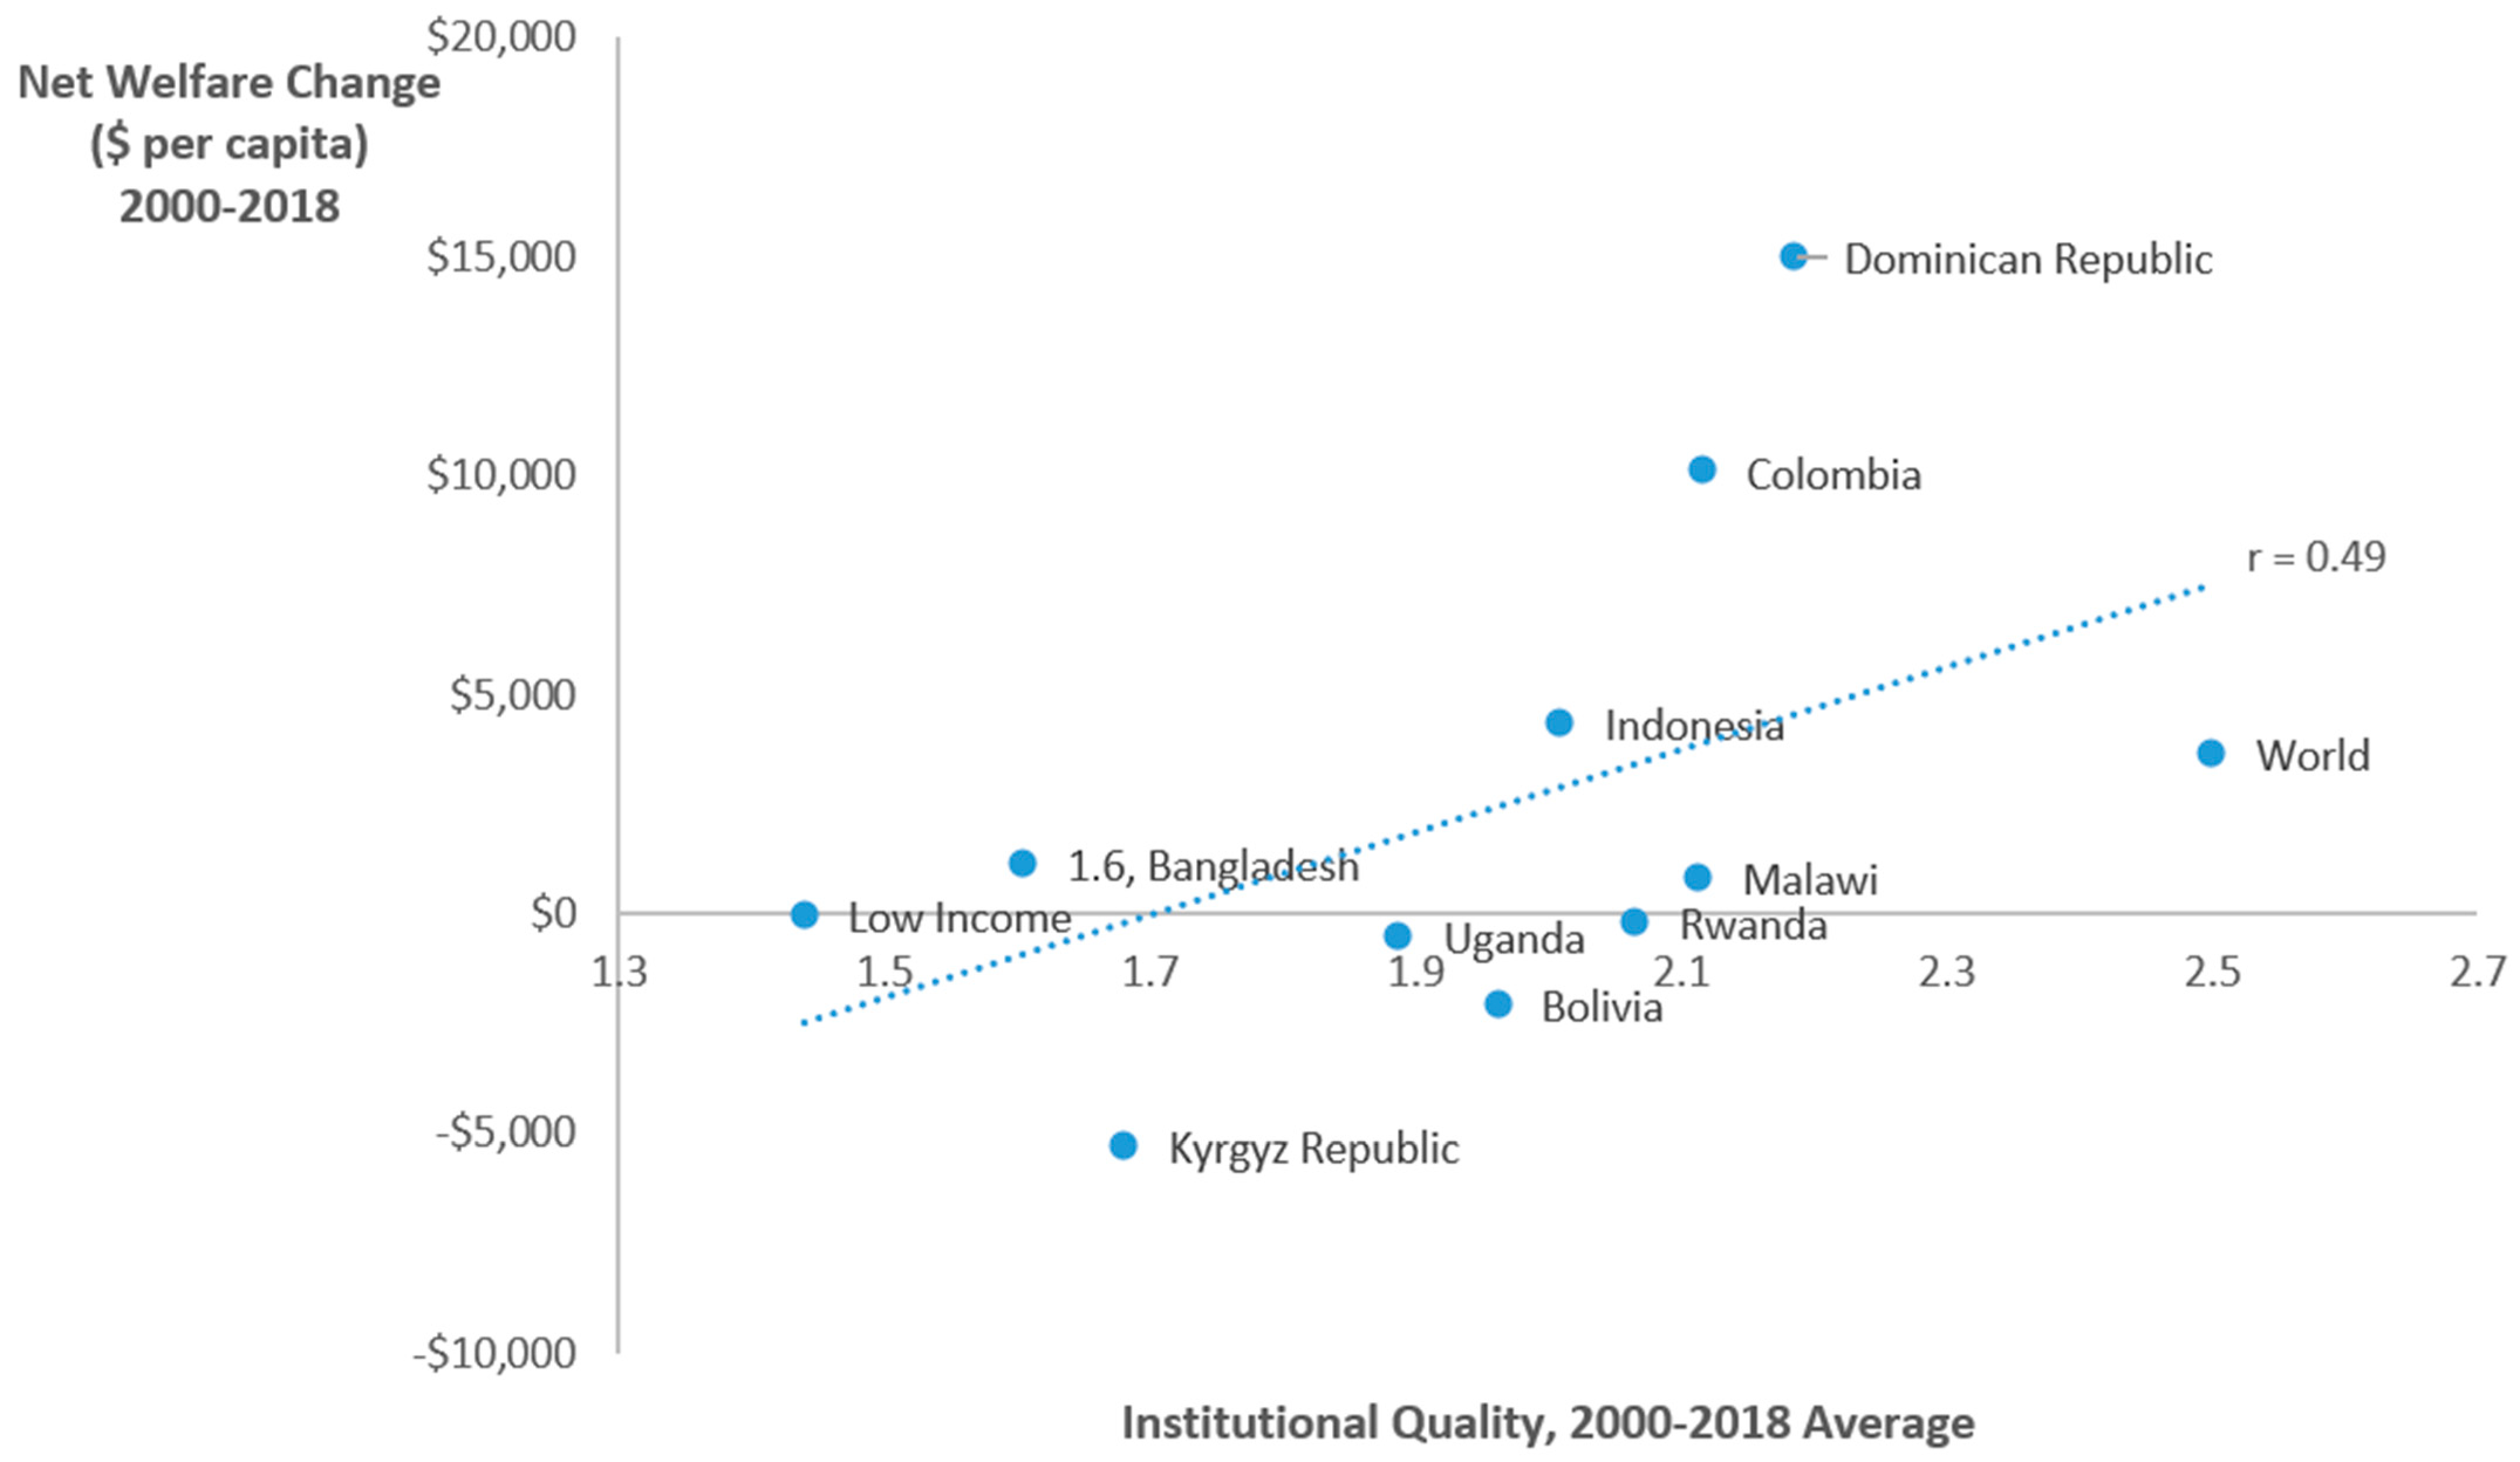
Figure 1 depicts the pairwise comparison between net welfare gains or losses from attaining the SDGs over 2000–2018 with average institutional quality over this period for the world level, for the group of low-income countries and for nine representative developing countries. Across these estimates, institutional quality displays modest correlation (0.49) with net welfare change in progress towards sustainability over 2000–2018.
As
Figure 1 shows, the association between more effective institutions, good governance and progress towards the SDGs over 2000–2018 cannot be ruled out. On the whole, countries with better institutional quality achieved more progress compared to those with weaker institutions. Especially notable is that Colombia, Dominican Republic and Indonesia (the three upper middle-income countries), appear to show reasonable institutional quality for developing countries and achieved significant net welfare gains through SDG progress over 2000–2018.
Overall, by comparing and contrasting our welfare analysis [
17] to average institutional quality over 2000–2018 we are able to provide some evidence to support the view that institutional effectiveness and good governance are essential for successful long-run sustainable development [
1,
2,
3,
4,
5,
6,
7,
8,
9,
10,
11,
12,
13,
22]. As our results show for our three upper middle-income countries, there appears to be a synergistic relationship between economic progress, sustainability and enhancements in institutional quality. Unfortunately, several countries appear to be experiencing a trade-off between institutional quality and making progress towards the 17 SDGs. In particular, for poorer countries, the lack of progress towards sustainability and strengthening governance may create a chronic problem that undermines progress on long-term development and improvements in welfare.
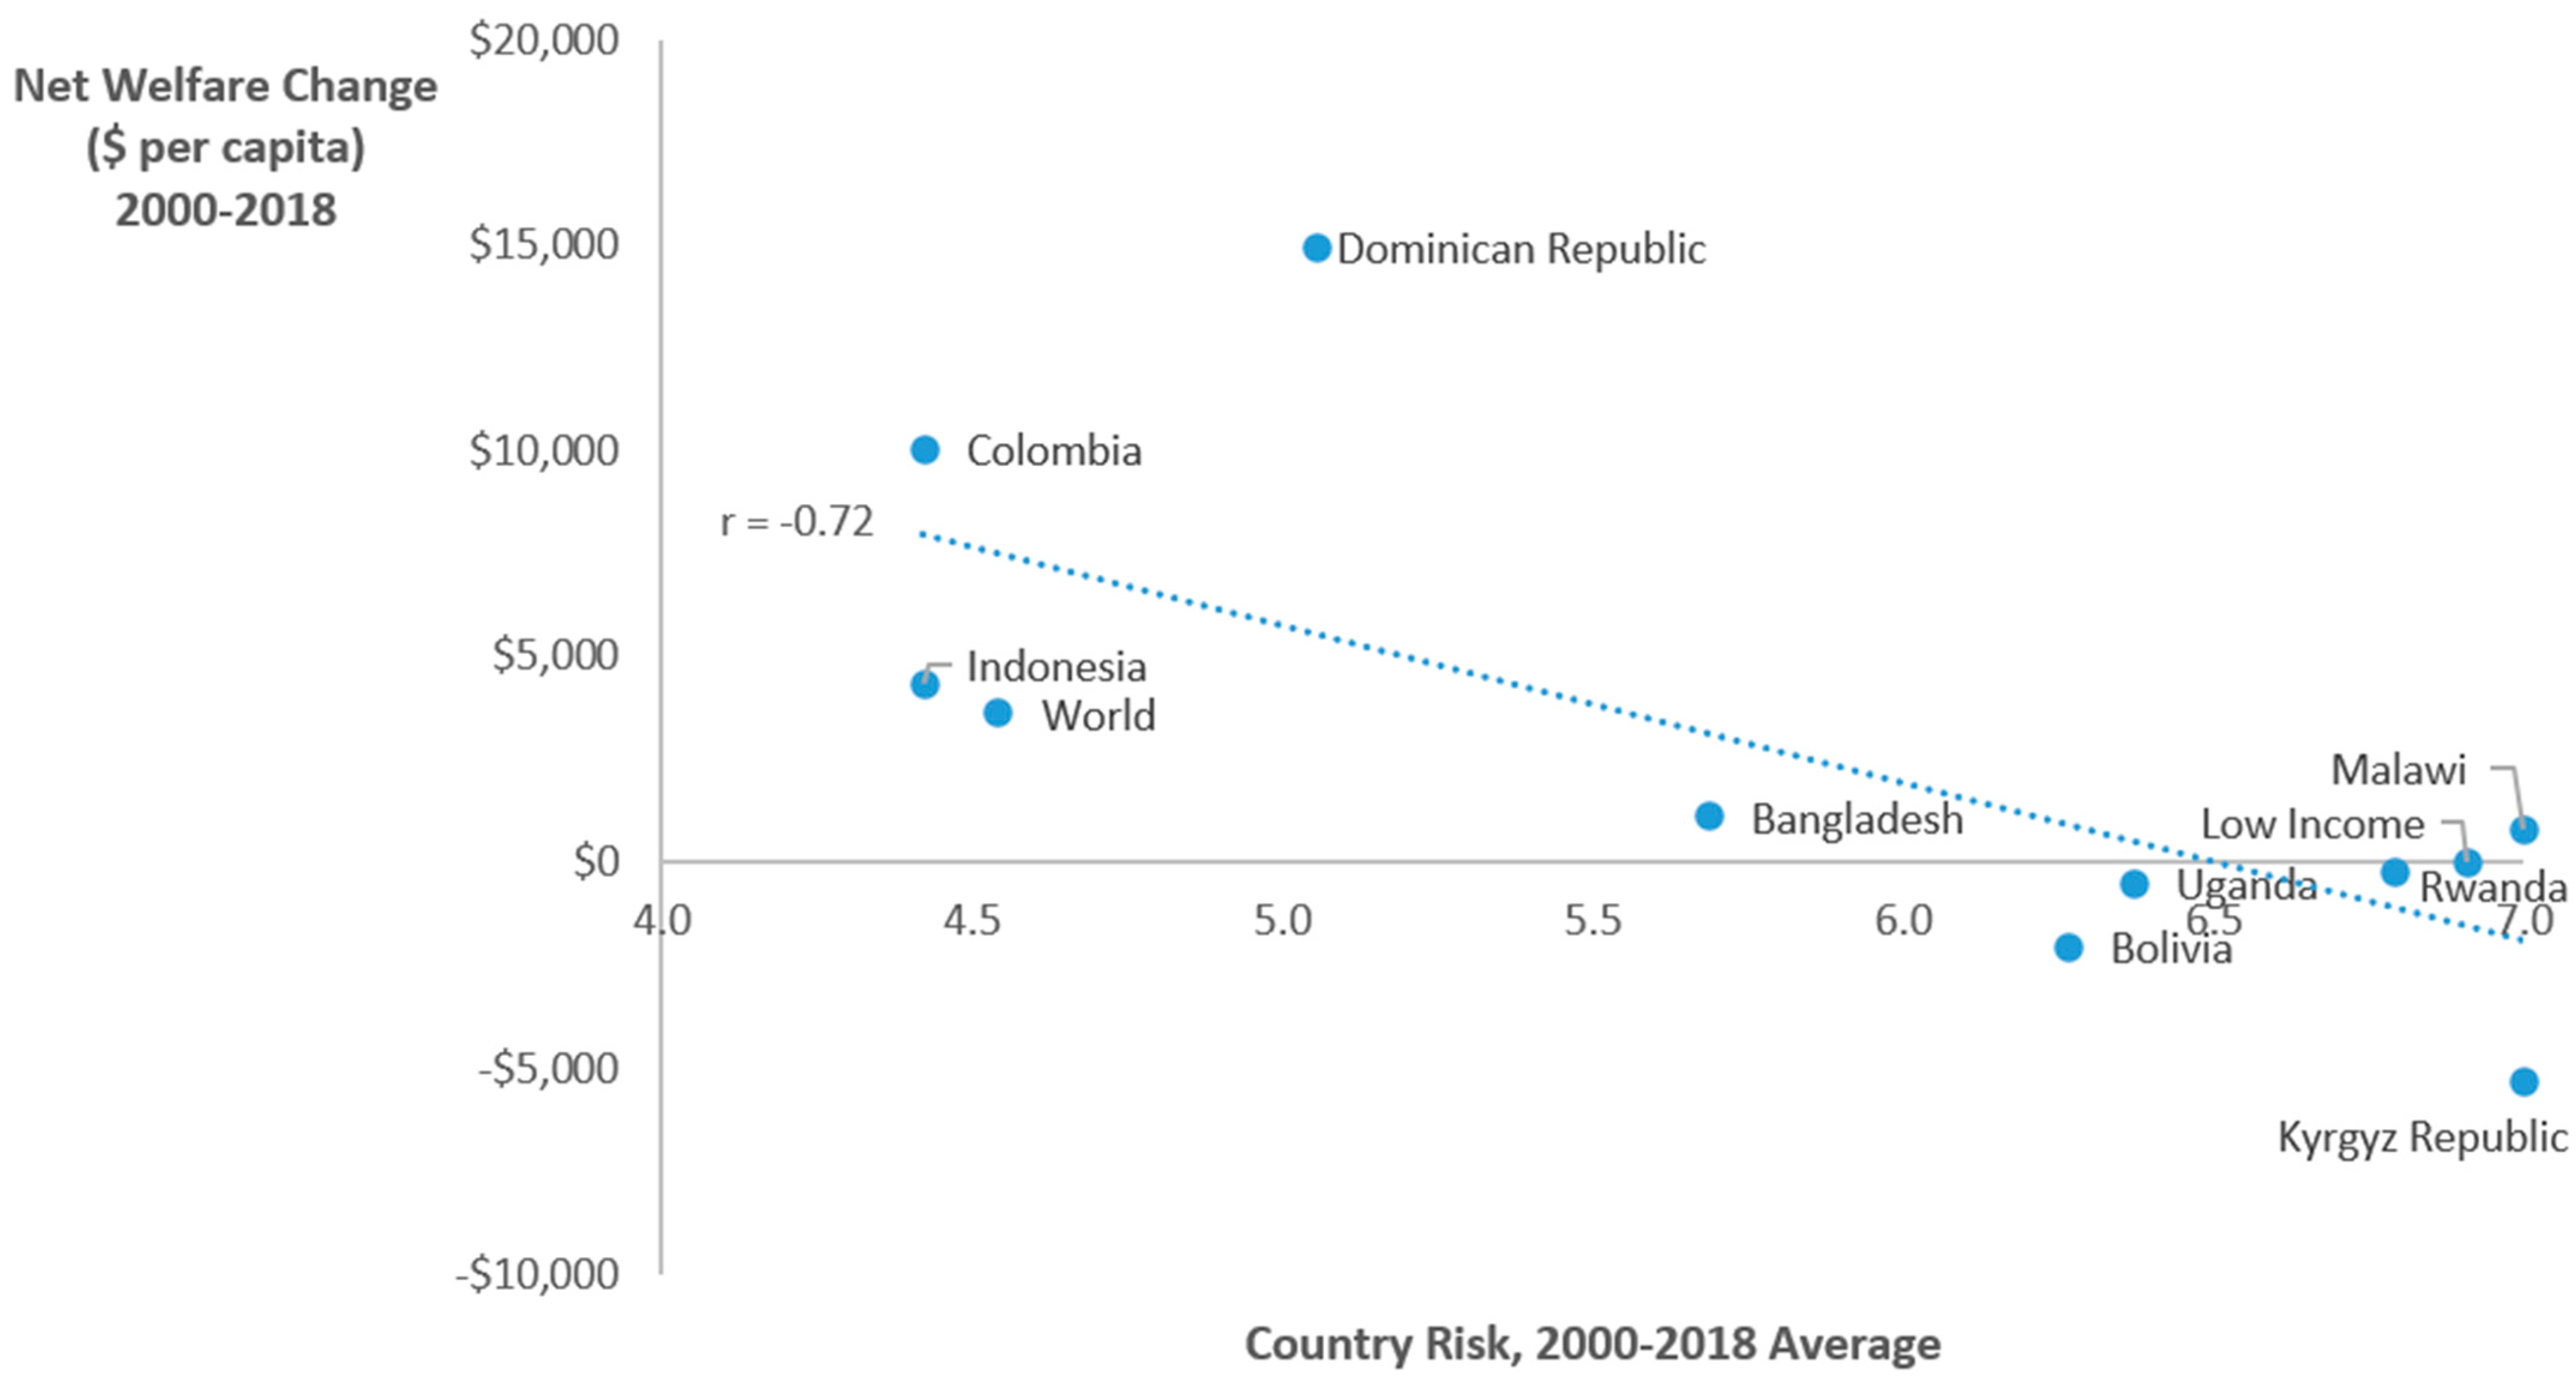
Figure 2 displays the pairwise comparison between net welfare gains or losses from attaining the SDGs over 2000–2018 with average country risk over this period for the world level, for the group of low-income countries and for nine representative developing countries. Across these estimates, country risk displays high negative correlation (−0.72) with net welfare change in achieving the SDGs over 2000–2018.
Figure 2 shows that the association between lower country risk and improvements towards the SDGs over the period from 2000 to 2018 is very strong. Countries with lower risk achieved more progress compared to those with higher risk. Especially striking is the results for Colombia, Dominican Republic and Indonesia (our three upper middle-income countries), which generally have much lower risk and higher net welfare gains compared to less well-off countries and the group of low-income economies. The group of low-income economies tend to have much higher country risk and display only modest gains–and often net losses–in attaining the SDGs over 2000–2018.
The strong association between country risk and sustainability performance may seem surprising, but it fits with other analyses of the relationship between business climate and long-run economic performance and attaining development goals, such as poverty reduction [
13,
17,
22]. It also accords with other analyses that show, as a whole, poorer economies have not been faring well in overall progress towards the SDGs, and especially have performed badly in terms of the environmental goals SDGs 11–15 [
16,
17,
27,
28,
30]. As explained by Jeffrey Sachs and colleagues, ineffective institutions may be a factor: poorer economies not only have lower overall SDG Index scores but also “they tend to lack adequate infrastructure and mechanisms to manage key environmental challenges covered under SDGs 12–15” [
30], p. 25.
These results provide further support to the substantial empirical literature in economics that has established a persuasive link between institutions and long-run economic development [
1,
2,
3,
4,
5,
6,
7,
8,
9,
10,
11,
12,
13,
22]. These results also confirm recent studies that have shown that more effective institutions and governance are essential to reducing extreme poverty and achieving other development goals that are important to low and middle-income economies [
12,
13].
5. Conclusions
This article compares and contrasts estimates of the changes in net welfare from progress towards the 17 SDGs over the period from 2000 to 2018 with measures of institutional quality and country risk over the same period for the world level, for the group of low-income countries and for nine representative developing countries. These comparisons shed some light on whether institutional quality and governance help or hinder progress towards the 17 Sustainable Development Goals (SDGs) of UN Agenda 2030.
Although it is difficult to obtain precise indicators and reliable data on the broad concept of institutional quality and governance, and such indicators have attracted notable criticisms in the past, the WGI and CRC measures of institutional quality and governance are now widely accepted by policy makers and academics [
11]. Overall, we find that SDG welfare gains are somewhat correlated with institutional quality and highly correlated with lower country risk. Countries with better quality institutions and lower risk appear to have made overall gains towards fulfilling the SDGs. These results suggest that good governance and institutional effectiveness are associated with success in achieving long-run sustainable development objectives. Therefore, long-term progress towards the SDGs may hinge on improved institutional quality and reduced country risk.
Unfortunately, ineffective institutions and country risk seems especially associated with lack of SDG progress in poorer economies. The implication is that, for many low-income countries, the lack of progress towards sustainability and improving governance may be a fundamental problem that is undermining their long-term development and welfare. This does not bode well for poorer economies, who generally display poorer institutional quality and much higher country risk. In addition, these economies have struggled to achieve progress towards attaining the 17 Sustainable Development Goals, and especially SDGs 11–15 [
16,
17,
27,
28,
30].
A major concern is that poorer economies are facing even greater development burdens with the ongoing COVID-19 pandemic. They are particularly affected by mounting debt, inequality and poverty. These challenges will further constrain their ability to build strong institutions, improve governance and reduce credit risk.
Due to the pandemic, global debt reached 289 USD by the end of the first quarter of 2021, and accounts for just over 369% of global GDP [
32]. Around 86 trillion USD of this debt is in emerging market economies [
33]. Research has shown that mounting debt can severely exacerbate the duration and intensity of recessions in emerging market economies, in part due to less supportive fiscal policies in these countries during times of crises [
34]. Emergency measures established during the COVID-19 pandemic, including the Debt Service Suspension Initiative that was established by the International Monetary Fund and the World Bank, has provided poorer countries a short-term respite from payments on debt. However, there is not yet any sign of a longer-term comprehensive debt relief program for the world’s poorest countries [
35]. Growing indebtedness in developing countries will further undermine their credit worthiness and make it extremely difficult to ameliorate their high levels of country risk.
Furthermore, inequality has increased during the pandemic as the world’s richest have become wealthier and poverty reduction has been setback substantially [
26,
27,
28]. Worldwide in 2020, there was an increase of 3.9 trillion USD in the wealth of billionaires. In contrast, the total number of people living in poverty may have increased by 200 to 500 million during the pandemic [
36]. As many as 70 to 100 million people across the world could fall into extreme poverty, which is the first rise in extreme poverty over two decades [
37,
38]. Shared prosperity–the relative increase in the incomes of the bottom 40% of the population compared to that of the entire population–is anticipated to decrease sharply in nearly all countries in 2020–2021. This decline in shared prosperity will be even more significant if the pandemic’s economic impacts continue to fall disproportionately on poor people [
38].
The pandemic could be especially devastating for the inclusivity of global development seriously in terms of extreme poverty and shared prosperity. Even before the COVID-19 pandemic, the global community was still a long way from achieving critical sustainability and development objectives for the most vulnerable people and countries. For example, in 2019, as many as 736 million people lived in extreme poverty, 821 million were undernourished, 785 million people lacked basic drinking water services, and 673 million people across the globe were without sanitation [
39]. About 3 billion people did not have access to clean cooking fuels and technology, and on top of this, of the 840 million people without electricity, 87% lived in rural areas. It has been projected that as many as 28 poor countries could fall short of attaining SDGs 1–4, 6 and 7 by 2030 [
18].
As a final observation, our article provides support for the view that long-term progress towards the SDGs may be associated with improved institutional quality and reduced country risk. However, this association does not necessarily imply that “the causality runs from institutions to economic development, ignoring the important possibility that economic development changes institutions” [
2], p. 476. Clearly, further research and more country-level data are required to statistically analyze the relationship between net welfare changes, institutional qualities and country risks to determine conclusively whether improved institutions and governance will necessarily lead to better progress towards sustainability, as reflected in the 17 Sustainable Development Goals. As our article suggests, this is a rich and important area for further research.


