Abstract
A basic assumption of many scientific theories on the topic of decision making is rational behaviour. However, previous authors assume the existence of behavioural biases in freight transport which impede rational decision making. Hardly any research exists on behavioural biases in freight transport. To address this gap, we carry out a systematic literature review on the influencing factors of freight mode choice and provide empirical evidence for the occurrence of behavioural biases in the logistics sector. Fifteen logistics service providers and six shippers are involved in interviews and a focus group to understand their mode choice process and derive information on the existence of behavioural biases. Several biases showed to exist in the practical decision-making process. For example, decision makers tend to avoid complex options (principle of least effort), they stick to already tried and tested options (status quo bias, zero-risk bias) and they tend to make decisions based on immediate and easily accessible information (availability bias). These biases distort the demand for sustainable freight transport. We therefore conclude with several motivational, cognitive and technological debiasing strategies to reduce the negative impact of behavioural biases in freight transport.
1. Introduction
The transport sector is responsible for nearly a quarter of the total greenhouse gas emissions in Europe [1]. Transports not only cause emissions, they additionally result in external costs from accidents, congestion, land consumption or noise [2]. Essentially, the extent of emissions and external costs caused by transport differs between the transport modes. Rail and truck have a higher specific energy consumption than inland waterway vessels and they cause higher well-to-tank emissions (= costs of energy production) [3,4]; this indicates that inland waterway vessels are more environmentally friendly. In 2016, road transport caused the highest share of external costs, followed by maritime transport. Inland waterway caused the fewest external costs. Inland waterway and rail are considered to be environmentally friendly transport modes because they cause lower emissions and external costs compared to road or air [4].
Even though road transport is known to have a high ecological impact and is responsible for most of the external costs, its modal share in inland freight transport remains considerably high. Between 2013 and 2018, the share of road transport has even increased, while the share of inland waterway has decreased. Road is used for approximately three quarters of inland freight transport in the EU-27 [5]. Inland waterway suffers from a low modal share in most European countries, despite its high potential regarding cost and emission reduction and other advantages such as safety (there are only 10 accidents per billion tkm) and free capacities [6,7]. The geographical scope of this paper is limited to Austria.
Due to the low use of environmentally friendly transport modes, mode choice in the logistics industry must be questioned. A basic assumption of many scientific theories on the topic of decision making is rational behaviour (e.g., homo economicus or random utility theory [8]). However, in personal informal conversations with logistics managers, it often becomes clear that arguments such as “we have always done it this way” play a role in freight mode choice. This indicates that behavioural biases exist which impede rational decision making based on measurable criteria (e.g., cost and time) and which hamper the use of inland waterway transport. Therefore, this paper wants to answer the following research question:
RQ1. Which behavioural biases distort rational decision making in freight mode choice?
Previous approaches to promote sustainable freight transport mostly focus on the efficiency principle or the consistency principle. Efficiency measures aim to increase the productive use of resources and energy, this means the focus is on a system’s productivity. One example for an efficiency measure regarding mobility is an energy-saving driving style. Consistency measures concentrate on environmentally friendly technologies, which use the resources of the ecosystem without depleting them. One example for such an environmentally friendly technology is solar-generated hydrogen, which will provide an energy supply without causing damage to the atmosphere. Sufficiency is aimed at a lower consumption of resources through reducing the demand for goods. Eco-sufficiency is about steps, measures, instruments and strategies to save resources by changing people’s behaviour with the intention of using energy and raw materials differently and consuming less of them than before [9]. The sufficiency principle, as the third pillar of sustainability, has so far been disregarded, although it is becoming increasingly clear that efficiency and consistency strategies are not sufficient to achieve sustainability goals [10] and must therefore be supplemented by sufficiency strategies [9,11,12]. Consequently, it is essential to develop measures that positively promote sufficient decision-making behaviour and eliminate behavioural biases. So, the second research question this paper wants to answer is:
RQ2. Which measures can be taken to eliminate behavioural biases in freight mode choice and to promote decision making in terms of sufficiency?
These research questions are answered by considering different aspects of decision making. The remainder of this paper is divided into five sections. Section 2 presents the methodology used to collect data. A systematic literature review and a qualitative approach were chosen as the methodological approach. Interviews and focus groups were conducted in order to collect empirical data. Section 3 outlines the results of a literature review on freight mode choice and therefore provides a theoretical background. Section 4 focuses on behavioural biases in freight mode choice, literature as well as empirical results are presented. Section 5 displays measures to eliminate behavioural biases. Section 6 concludes the paper with insights, implications and further research.
2. Materials and Methods
To be able to answer the research questions of our study, it is important to gain a deep understanding of the mode choice process in logistics. We therefore started with a systematic literature review to analyse the influencing factors of freight mode choice that researchers are aware of. We were especially interested whether existing studies identified behavioural characteristics of the decision makers as a relevant factor influencing freight mode choice. The review was carried out May 2020–September 2020 using the databases Emerald Insight and Scopus. These databases were chosen as they cover a substantial part of literature on the reviewed topic. Scopus accesses contents of other databases with potentially relevant content, e.g., IEEE. Using only two databases instead of several increases the clarity, rigor and replicability of our literature search process [13].
In the database Scopus, the search was limited to metadata, which included the title, abstract and keywords. Furthermore, the search on Scopus was limited to results from 2010 to 2021. The search string (TITLE-ABS-KEY (mode AND choice) AND TITLE-ABS-KEY (freight AND transport)) was used to find relevant publications on freight mode choice.
Literature on the topic of mode choice in freight transport is quite extensive. We reviewed 80 publications on freight mode choice and identified 332 influencing factors which determine the decision for a transport mode (see Appendix A for all 332 influencing factors and corresponding references). Hardly any papers cover the influence of behavioural characteristics of decision makers. A total of 19 out of the 80 papers at least mention one or more behavioural characteristics as influencing factors in the context of mode choice, but most of them did not go into detail regarding these factors. We therefore carried out a second literature review to capture a list of behavioural biases that may occur in freight mode choice. We again used the databases Emerald Insight and Scopus and searched for behavioural biases. Since the literature on behavioural biases in freight transport is scarce, we included insights from other disciplines to identify behavioural biases relevant for freight mode choice. Our search started with behavioural biases in passenger transport due to the close relation of the research areas, passenger transport and freight transport. Several references were found which exhibit biases in passenger transport (e.g., [14,15,16]). Additionally, we used other references from social science, e.g., the comprehensive work of Kahneman and Tversky on the topic of behavioural biases [17,18,19,20,21]. This was to reduce the risk of missing any behavioural biases that might be relevant in the context of freight mode choice. In total, a list of 140 behavioural biases was collected from the literature. A team of five senior researchers with profound knowledge in logistics and transport evaluated the list independently of each other and identified 34 biases that might be relevant in the context of freight mode choice (see Appendix B for a definition of the 34 biases).
To gather empirical evidence for the occurrence of behavioural biases in freight transport, we conducted in-depth interviews as well as a focus group with logistics managers. We included participants from logistics service providers (LSP) as well as shippers to account for different viewpoints from the transport business. In total, we conducted twenty-one interviews (fifteen with LSPs and six with shippers, see Table 1). All respondents are working and living in Austria. In the interviews, we asked the respondents to explain to us, in detail, their mode choice process. The interviews were used to gain thorough insights into the mode choice process of the companies. Interviewees were asked to describe, in detail, how the selection of the transport service takes place in their daily business. They were also asked other questions regarding mode choice, e.g., they were asked to evaluate different transport modes. Three of the interviewees only use one transport mode. They were still included in the sample because, even though they currently use only one transport mode, they may have used several transport modes in the past or plan to do so in the future. Additionally, they can explain why they decided on this transport mode, which is also a mode choice. Furthermore, due to their connection to their customers, they may be able to give valuable insight as to why their customers decided to hire their company or use their transport mode. During the interviews, we avoided talking directly about behavioural biases in order to obtain a genuine view of the decision-making processes. The responses and explanations were carefully evaluated afterwards to detect any references for the occurrence of behavioural biases.

Table 1.
Respondents participating in the study.
Additionally, we invited the interviewed companies to a focus group. In total, 18 participants from 13 companies were part of the focus group. The focus group was then conducted to condense this framework in order to explain the relevance of single behavioural biases and find practical examples of them. The focus groups were used to frankly discuss behavioural biases. Focus groups have the advantage that the interaction within the group and the group dynamic can be part of the observation [22]. Focus groups raise the collective opinion instead of the opinion of individuals. This creates a situation in which participants are encouraged to tell more than usual, which is a useful approach given the sensitive topic of behavioural biases. Participants feel safer in groups than during individual interviews [22]. Biases may be associated with making mistakes by the participants; it might be more comfortable to discuss this topic in a group of likeminded persons. We introduced the participants to the list of biases that we collected and asked them to estimate the occurrence of the biases in the logistics industry and give concrete examples for the occurrence of the biases. Worksheets were filled in by the participants for that purpose and a moderated discussion took place. This allowed us to again collect references for the occurrence of behavioural biases in freight mode choice.
We recorded and transcribed all discussions in the focus group. We were not allowed to record all interviews, but we used detailed protocols in case we did not have any transcripts. To encode and analyse the data we used the software MAXQDA. MAXQDA is a software for qualitative and mixed methods research. It can be used to analyse various kinds of data, e.g., texts, images, focus group discussions, survey responses and more. Functions of MAXQDA include transcription, media analysis, visualisation of data and results [23]. Coding is a method for the analyses of qualitative data. First, a list of codes were defined. Our codes included arguments for and against each bias, decision maker, rational factors and transport modes. We then used the defined codes to encode our data. After the coding, similarities and differences were analysed and mapped. They are discussed in Section 4. Figure 1 summarises the methodological approach of this study.
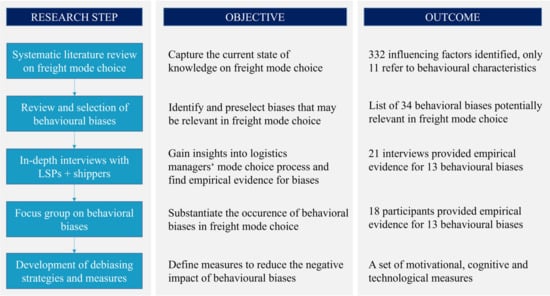
Figure 1.
Methodological approach of the study.
3. Mode Choice in Freight Transport
In total, 80 publications dealing with determinants of freight mode choice were found. Those 80 publications included 332 determinants. The vast number of influencing factors made it necessary to categorise and group them to keep track of them. Previous authors also grouped determinants of mode choice, for example, Derakhshan and Shah [24] differentiate between mode attributes, commodity attributes and other attributes. Zhang and Zhu [25] use the categories cargo, shipper and transportation chain to classify determinants, while Keya et al. [26] use the categories freight characteristics, level of service measures, network and O-D attributes and other characteristics. Elbert and Seikowsky [27] introduced the categories economics, quality, infrastructure, management, policy and sustainability. Based on the classifications suggested in previous studies, we defined 13 categories that suit the 332 influencing factors that we identified in our own study. We collected and compared the classification criteria of existing mode choice studies in a first step. Following, we segregated groups of criteria with similar traits and assigned them into clusters, leading to the final set of 13 categories. The 13 categories and the corresponding influencing factors per category are presented in Table 2.
Table 2.
Influencing factors on freight mode choice.
The first category involves physical characteristics of the network, such as availability and accessibility of infrastructure (e.g., [28]), location of terminals or consolidation centres (e.g., [29]) or distance to the nearest port [30]. The characteristics of the transport network are a relevant category as the presence and accessibility of physical infrastructure mainly influences the possible choices of transport modes.
The second category combines shipment characteristics, i.e., the attributes of the commodities to be transported [31]. The most referenced factor of this group is the factor shipment size (e.g., [32]). The shipment size is a relevant determinant in mode choice as transport modes have varying capacities, e.g., inland vessels work well for large transport volumes but not for small volumes such as single packages. Other shipment characteristics are the value of the cargo (e.g., [33]), weight (e.g., [34]) or perishability (e.g., [35]).
The third category aggregates cost and price factors. Nearly every study under review involves one or more cost factors to explain mode choice. Different types of costs are considered, not only transport cost (e.g., [24,36,37]), but also inventory cost (e.g., [38]), transshipment costs (e.g., [39]) or order handling costs (e.g., [40]).
Flow and spatial distribution of shipment is a category which takes the origin and destination attributes of a shipment into account [26]. This includes, for example, the distance of the shipment (e.g., [41]), shipment frequency (e.g., [25]) or direction (e.g., [42]). All attributes heavily influence mode choice as, for example, inland waterways are usually not chosen for short transport distances.
The fifth category addresses modal characteristics, i.e., the attributes of the transport modes [43]. This category comprises typical key performance indicators in logistics, e.g., reliability of transport (e.g., [44]), frequency of service (e.g., [45]) or safety and security respective to transport risk (e.g., [46]). The mentioned influencing factors strongly determine customer satisfaction and are therefore relevant for mode choice.
Category six summarises influencing factors related to the transport service, for example, service quality (e.g., [47]), damage and loss (e.g., [48]) or minimum notification time for shipping order [49]. The influencing factors of the category service partly overlap with other categories; however, due to their high occurrence in the literature, they justify the constitution of an own group.
The seventh category (distributor features) includes a variety of factors regarding the distributor. Financial stability is the most referenced factor of this group. The stability of the distributor is important as problems will occur if they file for insolvency or bankruptcy. Other determinants refer to carrier performance (e.g., [27]), performance experience (e.g., [50]) and reputation of the distributor (e.g., [51]). These factors indicate that the decision makers also value trust in the distributor when choosing freight transport mode.
Time and urgency represent the eighth category of influencing factors. Besides the cost category, time is the second most referenced attribute influencing freight mode choice—63 publications referred to time and urgency. Samimi et al. [35] showed that rail shipments are sensitive to cost, while truck shipments are rather sensitive to travel time. Neal and Koo [34] identified time sensitivity as one of the two key characteristics for the suitability of cargo airships. Brooks et al. [42] confirmed the existence of trade-offs between costs and perceived benefits of reducing time, improving on-time reliability and the risk of arrival delays. It can be concluded that time-sensitivity considerably influences freight mode choice and that slow transport modes such as rail or inland waterway will not be chosen for time-critical shipments.
Category nine (shipper characteristics) summarises influencing factors about the company shipping the cargo. Depending on the characteristics of the shipping company, the available transport options may differ. Large shippers usually have more options for different reasons, such as higher capital, higher cargo volumes and a broader network of partners. The most referenced shipper characteristics are company size (e.g., [52]), number of employees (e.g., [25]), fleet size (e.g., [26]), demand volatility (e.g., [43]) or yearly sales (e.g., [39]).
Environment and sustainability aspects are covered by category ten. This involves influencing factors regarding sustainability and the impact of freight mode choice on the environment. The factors regarding environment and sustainability include emissions of harmful substances (e.g., [40]), emissions of solid and liquid wastes (e.g., [53]), carbon tax (e.g., [54]) or eco tax (e.g., [55]). Bask and Rajahonka [51] find environmental and sustainability in combination with transport mode selection criteria to be a new and emerging topic in literature.
Category eleven refers to economics and sums up all factors that were found to be related to the general economic situation, such as exchange rates (e.g., [56]), industry characteristics (e.g., [43]) or liberalisation of trade [54].
Category twelve includes supply chain characteristics which may influence mode choice, e.g., the complexity of the supply chain (e.g., [44]), supply chain efficiency (e.g., [43]), lack of qualification opportunities [27], revenue sharing [27] and unresolved risk sharing in the supply chain [27].
Finally, category thirteen is dedicated to the behavioural characteristics of decision makers, i.e., the main topic of interest in our study. The literature on the influence of behavioural characteristics of decision makers on freight mode choice is limited (see Table 3). Most of the references in Table 3 simply mention personal characteristics but do not further investigate them. In total, only 11 out of 332 influencing factors refer to behavioural characteristics, thus indicating that this is a widely neglected and under researched topic compared to the other categories of influencing factors.
Table 3.
Behavioural characteristics influencing freight mode choice.
The most mentioned behavioural characteristics are carrier considerations, market considerations, preferences and perception. Konstantinus et al. [55] stated that decision makers incorporate their own characteristics in their considerations, which automatically influences mode choice. The characteristics of the decision maker as a person may also influence mode choice. For example, Luo and Chen [63] (p. 139) declare that “consignors can be classified according to their ages, educational degree, personality, preferences and individual decision making styles”, which leads to different choices.
Zhang and Zhu [25] acknowledge the heterogeneity of freight mode choice due to differences in shipper preferences. According to Luo and Chen [63], the traditional mode selection process is primarily based on the experience and the subjective judgement of the consignor. Samimi et al. [35] also recognise past experience with transport modes as one of the dominant factors within mode choice. Nonetheless, past experience is not further investigated in their mode choice analysis. Kim et al. [37] recognise the impact of decision makers’ perception within mode choice. They use the perceptual approach to explain mode choice, which assumes that users’ subjective perception of a situation influences the decision process more strongly than objective measurements. Elbert and Seikowsky [27] investigate the impact of behavioural biases on decision makers’ willingness to shift from unimodal road freight transport to intermodal road–rail transport. They conclude that behavioural biases may distort rational arguments for a modal shift. Their findings show that biasing effects, such as loss aversion or diminishing sensitivity, influence decision makers’ perception of barriers and facilitators of intermodal transport and therefore influence the willingness for a modal shift.
Luo and Chen [63] state that the risk tolerance of decision makers has an influence on mode choice and prove that consignors may choose different modes due to different risk preferences. Similarly, La Vega et al. [50] used a joint criteria analysis to investigate the impact of preferences and risk aversion of the decision maker. Their sensitivity analysis shows that the risk aversion of the decision maker determines the final choice.
4. Behavioural Biases in Freight Mode Choice
The detailed set of influencing factors, which resulted from the literature review (Table 2), suggests that mode choice is a process based on well-defined rational and objective decision criteria. However, many studies show that behavioural patterns and personal characteristics of the decision maker, such as gender, age, environmental awareness, perception of certain transport modes and experience, have a fundamental impact on that person’s decision making (e.g., [65,66]). Moreover, in the context of logistics, it has already been shown that freight mode choice is subject to cognitive and behavioural patterns which distort rational decision making [27,39,55]. These patterns are often referred to as behavioural biases. Mattauch et al. [14] define biases as systematically incorrect beliefs. A similar definition is given by Gibbons et al. [67]; they define biases as large, systematic errors in decision making caused by the use of heuristics to simplify mental processing. The main purpose of biases is saving time and energy for the human mind. The existence and usefulness, but also the trade-offs and mental errors caused by behavioural biases, are easier to grasp by keeping in mind the underlying problem that they should solve, e.g., complexity or incomplete information [68].
Literature on behavioural biases in freight mode choice is very limited. Within our comprehensive literature review on mode choice, we only came up with two references dealing with behavioural biases in the context of freight transport: Mommens et al. [39] and Elbert and Seikowsky [27]. Mommens et al. [39] marginally mentioned biases in their literature review on multimodal choice possibilities for different cargo types. Elbert and Seikowsky [27] proved that the perception of facilitators and barriers to modal shift could be distorted by behavioural biases; this implies a bounded rationality in the mode choice of decision makers. Since the literature on behavioural biases in freight transport is scarce, we have to borrow from other disciplines to identify behavioural biases relevant for freight mode choice. Based on references from passenger transport and other social sciences, we identified 34 biases that might be relevant in the context of freight mode choice (see Appendix B for a definition of the 34 biases). It should be noted that some biases are overlapping, e.g., the zero-risk bias and loss aversion both describe the human tendency to avoid threat of damage or harm. For this reason, similar biases were summarised into groups. Previous authors also introduced different categories to summarise biases (e.g., Benson [68]: too much information, not enough meaning, need to act fast, predicament of what should be remembered; Arnott [69]: statistical, memory, adjustment, confidence, situation and presentation biases; Aronson et al. [70]: conceptualisation, selection, conduct and reporting biases). Based on the categories proposed by other authors, we defined the following ten categories to classify the 34 biases of freight mode choice: avoid complexity, avoid change, avoid risk, deny contradiction, group thinking, impact of memory, adjustment failures, illusion of control, error in information processing, presentation of information and impact of individuals (Figure 2).
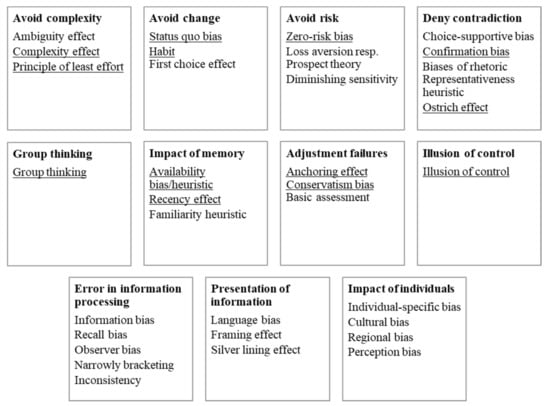
Figure 2.
Categories of behavioural biases.
To gather empirical evidence for the behavioural biases, we conducted 21 interviews and a focus group with LSPs and shippers. The collected data material (transcripts and protocols) provides 170 statements, out of which 131 statements confirm and substantiate biases, whereas 39 statements question and disprove biases (Figure 3). The numbers in Figure 3 are the exact number of statements which we collected, e.g., 29 statements confirming biases avoiding complexity were collected. We did not find evidence for all 34 biases that we previously identified as potentially relevant. Those biases for which we found empirical evidence are underlined in Figure 2. In the following, the biases for which we were able to gather empirical evidence will be presented in detail.
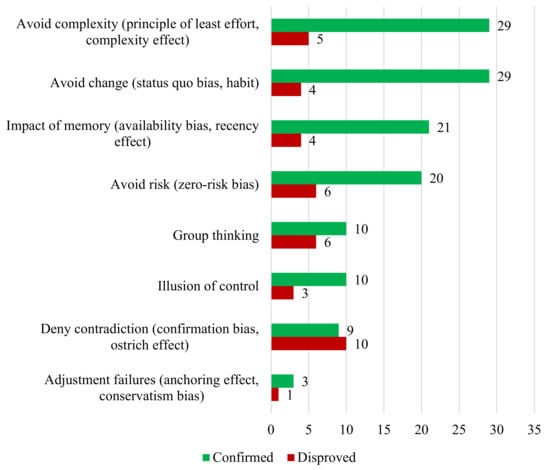
Figure 3.
Number of statements confirming and disproving behavioural biases in freight mode choice.
4.1. Avoid Complexity (Principle of Least Effort, Complexity Effect)
The bias category “avoid complexity” (including the principle of least effort and the complexity effect) is the category for which we found the most support within the interviews and the focus group. The principle of least effort suggests that humans, in general, try to minimise their effort. For example, if decision makers must solve a problem, they will try to solve the immediate problem in a way that the effort for solving the immediate problem and probable future problems will be minimised [71]. The complexity effect implicates that decision makers tend to choose the easy-looking option if they are under pressure. This is because “time pressure, information overload and other environmental factors can increase the perceived complexity of a task” [69] (p. 61). If decision makers are under pressure, they pick the option that is familiar and comfortable to them. Transport and logistics is an industry where time pressure is generally quite high. This could mean that, for example, if a shipment is urgent and therefore time pressure is high, the decision maker will choose the most easy-looking option and not think about it further. This inhibits a modal shift since the organisational complexity of multimodal transport is higher than that of road transport [72]. For operating multimodal transport, it is usually necessary to establish pre- and post-haulage processes which leads to an increased organisational effort and decreased flexibility due to additional transshipments [73]. This is reflected in numerous statements that we collected:
- “No. We are not located along the Danube [which makes inland waterway transport unattractive] and the train is often too inflexible.” (Shipper #3)
- “Of course, the train is more environmentally friendly, no question, but it’s often very inconvenient for us.” (Shipper #3)
- “[…] the train is simply inflexible. This is actually our biggest concern. Using the truck is much more flexible.” (LSP #11)
- “It takes a lot of effort to organise rail transport, therefore we often decide for truck transport.” (LSP #10)
4.2. Avoid Change (Status Quo Bias, Habit)
There are several behavioural biases which refer to the human tendency to avoid change. Among these are the status quo bias and habits. The status quo bias assumes that individuals tend to prefer the status quo to other options, as the disadvantages of leaving the status quo seem larger than the advantages [20]. Regarding freight mode choice, this would mean that the same transport mode would be used again and again since the decision makers are reluctant to leave the status quo. The status quo bias is closely related to decision makers’ habits. Behaviours, which have been repeated and executed satisfactorily, may become habits. The habit bias suggests that “an alternative may be chosen only because it was used before” [69] (p. 61). Habits originate from past experiences and therefore they have some features of automaticity, such as efficiency and lack of awareness [74]. Innocenti et al. [15] explored determinants of travel mode choice. They found that travel mode choices usually become habitual choices; therefore, advantages and disadvantages are no longer weighted against each other.
Respondents confirm the existence of these biases. They state that the status quo is used because it is fast and proven and therefore associated to fewer risks. In addition to that, LSP #10 claims that “change is always work”. The status quo being easy and effortless shows a connection to the principle of least effort and the complexity effect. Furthermore, most human beings innately dread change and the unknown [20]. Routines make them feel safe and therefore they maintain tried and tested decisions. LSP #2 puts it in a nutshell: “If the profit is right, there is no reason to drastically change something that works”.
4.3. Impact of Memory (Availability Bias, Recency Effect)
The literature review indicated that experience is a relevant influencing factor of mode choice [35,63]. If decision makers have previous experiences with a transport mode, this influences freight mode choice. The ease of remembering their past experience influences the assessment of an option [18]. This effect is known as availability bias and is a typical judgmental heuristic. Experiences and incidents which are easily remembered by decision makers (and thus easily available) are expected to be more likely and more frequent. The authors of [18] also explain that recent events are easier remembered than events which are further in the past. This is referred to as recency effect. Regarding freight mode choice, this could mean that if there has been an incident with one of the modes just recently (e.g., rail strikes), this incident will be more present in the mind of the decision maker and will make this mode seem unattractive.
Most participants agreed that experiences are part of their decision making. Their opinions differ when it comes to the kind of influence the experiences may have. Some participants deny that experiences could distort the decisions, because “events and experience cannot distort future decisions if the events and experiences are analysed/questioned or improvements are worked out.” (Shipper #3). They claim that “you make up your own mind about the situation and then weigh what fits better” (LSP #14). Experiences and recent events can have a negative influence on freight mode choice as they might benefit less environmentally friendly transport modes. For example, if strikes of railway staff are reported on the news, decision makers reported to be reluctant to use rail. Of course, this can also happen to the less environmentally friendly transport modes such as air, as stated by LSP #12: “If the customer had a delay in the last shipment with airline A, for example, we are prevented from using airline A again for the next shipment”.
4.4. Avoid Risk (Zero-Risk Bias)
Most decision makers are highly risk-averse and value security highly in decision making [50]. Humans naturally have a loss aversion which makes them perceive losses stronger than corresponding gains [19]. Most of the collected statements regarding risk aversion confirm the existence of this particular bias. The risk of damage was mentioned several times by the respondents, but also punctuality is of uttermost importance to logistics managers. Their statements show that they do not want to risk any late arrivals of their cargo:
- “For safety’s sake, we prefer truck instead of barge to reach the destination on time.” (LSP #14)
- “What if the train doesn’t run? Trucks don’t always run without problems either, but we perceive it less risky to take the road.” (LSP #10)
As indicated by the statements, the environmentally friendly transport modes are unfavourable for decision makers because they are perceived as being riskier. Rail and inland waterway are used rarely compared to road and they are used for shipments with high volumes. If there is a problem regarding safety or punctuality, it appears to be more frequent in rail and inland waterway as the relative share is higher. One mistake in handling 10 transports might feel higher than 100 mistakes in 1000 transports. Furthermore, if one truck shipment is damaged, the amount of damaged goods is smaller than if a shipment on a barge is damaged, thus the risks may appear heavier.
4.5. Group Thinking
Group thinking (sometimes also referred to as herd mentality) means that the opinion of the group is valued higher than the opinion of an individual in the decision-making process [75]. The statements regarding group thinking are inconclusive; six statements were found to disprove it and ten were found to confirm this bias. We therefore cannot draw clear conclusions whether group thinking exists or not in freight mode choice. One rather young logistics manager from LSP #14 admitted that, as a newcomer in this job, he relies upon the group’s opinion. LSP #9 explained that the logistics managers in their department continuously exchange their views on current shipping assignments, which might promote distortion by group thinking. On the other hand, LSP #3 argued that this type of exchange within the group helps to avoid single decision makers distorting mode choice with their individual experiences and opinions. Therefore, group thinking might also be beneficial for freight mode choice. However, if a modal shift is not appealing for the group (which is unfortunately often the case among transport managers [76]), then group thinking will impede the use of environmentally friendly transport modes.
4.6. Illusion of Control
Illusion of control makes decision makers feel as if they could influence or control an outcome by their choice when, in fact, it is proven that they have no influence on certain things [77]. Some participants claimed that they are well aware of the circumstances which they cannot influence, such as the weather, pandemics or traffic. Despite that, we found some examples which show that logistics managers are subject to the illusion of control. LSP #5 is dedicated to promoting inland waterway transport along the Danube. According to LSP #5, many companies complain about “the feeling that they do not have any control over their transport assignment on inland waterways, e.g., when the vessel is being locked”. These companies argue that they have better control by choosing road transport; however, they neglect that road transport also involves the risk of unpredicted circumstances such as congestion or accidents. Logistics managers reported that they take several measures to increase the control over transport and prepare for all eventualities. They prepare contingency plans to prevent delays, e.g., caused by acts of nature beyond control (e.g., LSP #2 and shipper #3). They are convinced to limit the damage, which in some cases they certainly cannot. This is another sign of the illusion of control.
4.7. Deny Contradiction (Confirmation Bias, Ostrich Effect)
The ostrich effect suggests that individuals tend to avoid contradicting information about a decision they made [78]. Decision makers sort of “stick their heads in the sand” and ignore negative data which disproves their choice. The confirmation bias refers to the fact that “often decision-makers seek confirmatory evidence and do not search for disconfirming information” [69] (p. 60). It is classified as a confidence bias by Arnott [69] as it serves to increase a decision maker’s confidence in their competence. The confirmation bias is similar to the ostrich effect (since both relate to the denial of conflicting information), but they slightly differ as the ostrich effect is rather about choices already taken while the confirmation bias can also relate to the decision-making process itself.
We found empirical evidence which confirms the existence of the ostrich effect in the logistics industry: LSP #10 mentioned that they purchased a low-price truck which obviously had some technical disadvantages (higher maintenance costs, for example). The participant explained that the disadvantages were kind of denied within the company and the low acquisition costs were emphasised to justify the decision. Despite this unambiguous example for the ostrich effect, in total, we found more disproving statements than confirming statements for the whole category “deny contradiction”. Most participants in our study negate the existence of the ostrich effect in the logistics industry. They state that “you certainly can’t afford the ostrich effect in the forwarding business” (LSP #15). According to the respondents, logistics managers evaluate all options carefully and make fact-based decisions due to the narrow profit margins in transport and logistics. It was admitted, however, that it is human to focus on the positive aspects of a decision taken and to highlight the positive aspects. However, as one participant made clear, “problems have to be solved anyway” (LSP #14). The participants agreed that, in most cases, problems are not denied but frankly discussed with customers to find viable solutions.
Similar to the ostrich effect, the statements concerning the confirmation bias are inconclusive. The remarks against the confirmation bias were clear and straightforward; the ones confirming the bias were more subtle. One example for a clear statement against the bias is “all decisive factors play a role in our decision making process, there is no cherry-picking” (LSP #9). Naturally, logistics managers justify their mode choice, and claim that it is solely based on rational arguments. Still, it is questionable whether, in reality, this is also the case. An example given by LSP #2, to prove the confirmation bias, is that there is often prejudice about the unreliability of railways. In fact, the Austrian Federal Railways (ÖBB) are quite reliable; statistics from passenger transport show that trains have a punctuality of over 90% [79]. Anyway, if a train does arrive late at some point, then the railway opponents will be confirmed in their belief that the train is generally unreliable.
4.8. Adjustment Failures (Anchoring Effect, Conservatism Bias)
The anchoring effect supposes that people rely too strongly on the first piece of information they receive [80]. An initial value or position (anchor) will be subconsciously taken as a reference point for all decisions [69]. Very similar to the anchoring effect, the conservatism bias also proposes that people rely too strongly on initial information and this has an impact on further evaluations [81]. Both the anchoring effect and the conservatism bias imply that when decision makers need to evaluate an option, they are biased by their initial perceptions and fail to adjust them. Different starting points will lead to different evaluations in this case [18].
Most participants agreed that, of course, the environment influences the decision making and that one cannot deny subconscious behaviour. An interesting statement was “can also be used positively, e.g., putting a thought into a customer’s head, then this influences a decision in the subconscious” (LSP #10). This indicates that anchoring effects create the opportunity to influence the shipper.
5. Measures to Eliminate Behavioural Biases
Based on the behavioural biases that have been identified as relevant in freight mode choice, a set of debiasing strategies and measures were developed to reduce the negative impact of the biases. The set of debiasing strategies and measures is summarised in Table 4. Following the classification of Larrick [82], it can be distinguished between motivational, cognitive and technological measures to combat behavioural biases in freight mode choice.
Table 4.
Debiasing strategies and measures.
The behavioural biases in the category “avoid complexity” suggest that, in order to promote environmentally friendly transport modes, modal shifting must be easy. This is due to the passive nature of decision makers: they often choose the most convenient and “easiest” option. Sustainable options, such as multimodal transport, are currently perceived as complex and cumbersome [73]. The environmentally friendly transport options must become more convenient so that decision makers are encouraged to use them, also under time pressure. There are different technological measures to make a modal shift more convenient. For example, decision making could be facilitated by software tools. Information technology makes the comparison of transport modes easier, as all necessary information is given in one system and decision makers do not have to collect the needed information from different systems. A strong argument for using the truck is that it can be used for the first and last mile and if it is used for the rest of the transport, no transhipment is necessary. Decision makers view transhipment as costly, risky and, in general, causing unnecessary effort. New solutions for the first and the last mile, which especially work with transport modes other than the truck, should promote a modal shift. Moreover, having a railway siding at the company location makes rail transport more comfortable and a lot easier. A railway siding is an expensive investment; therefore, it is crucial that it appears attractive. The attractiveness of railway sidings could be increased by information campaigns or subsidies to make the investment cheaper. At the same time, it has to be taken into account that information campaigns in transport often reach persons which are open to change and not necessarily everyone [83]. Furthermore, companies are often close to each other, e.g., in industrial sites, and they could therefore share a railway siding and split the costs. Infrastructure development is, in general, an important measure to increase the convenience of a modal shift, since availability and accessibility have been proven as important influencing factors for mode choice in the literature review [84].
Monetary and legal incentives constitute appropriate measures to encourage companies to move away from the status quo or overcome their risk aversion. Using these motivational measures combats the human tendency to avoid change and avoid risk. If freight mode choice is supposed to change, the framework conditions for operating transport have to be changed so that it does not work anymore or is no longer cost-efficient. This can be either achieved by monetary regulation (subsidies for sustainable transport, internalisation of external costs of road, etc.) or by legal regulation (night driving bans or inner-city driving bans for trucks, introduction of quotas, etc.). The internalisation of external costs aims to create a level playing field between all transport modes and make external costs part of the decision-making process of shippers [4]. This is, for example, achieved by charging transport emissions by introducing taxes or CO2 certificates [85]. Legal regulations are more restrictive and binding. For example, quotas will force companies to use green transport modes. Once the companies have tried an environmentally friendly transport mode, such as rail or inland waterway, and had a positive experience with it, they are more likely to use it again in the future. It has been found that a combination of push and pull measures is most useful to change behavioural patterns in passenger transport [86]; therefore, this might also be an efficient option for the logistics sector.
The judgement heuristics of decision makers (e.g., their tendency to deny contradiction, failure to adjust their choice and their illusion of control) can be confronted with awareness raising and knowledge building measures. Awareness and education measures will help to convey a realistic impression of the strengths and weaknesses of environmentally friendly transport modes, thus providing full transparency and not leaving any possibility to ignore relevant information. Raising awareness on the harmful impacts of certain transport modes on the environment is essential and a common practice in some parts of the transport domain [87,88]. Decision makers must not only be aware of the negative impacts on the environment, but they must also be aware that there are other options. The curricula in logistics education most often focus on truck transport and neglect lessons about the use of other transport modes. For the upcoming young generation, social media is an efficient channel to create awareness and knowledge. Advocacy organisations influence their members, and this influence can be used promote sufficient decision-making behaviour and the modal shift. Moreover, analyses of external and independent advisors can help to promote informed choices. External analysis can give new perspectives and neutral feedback. Developing and demonstrating concrete solutions with alternative modes proves that environmentally friendly transport options can work and that there are options other than road transport. Awareness raising measures also create the opportunity to set anchors in favour of environmentally friendly transport modes. Thus, the anchoring effect could be exploited to promote sustainable transport.
The influence of the availability bias and the recency effect on freight mode choice make positive reports and positive experiences necessary to enhance the modal shift. This can be achieved, for example, by sharing best practices and positive business cases about successful modal shifts, or other types of information campaigns [89]. These cognitive measures lead to education and consciousness about environmentally friendly transport modes and avoid that decision makers choose based on prejudice resulting from recent experience or denied information. Rail has been criticised intensely in the past, especially regarding its inflexibility and unreliability. Some decision makers stopped using it because of their negative perception. However, the railway has been improving a lot, but the bad experiences and prejudices remain. Proving that the rail has changed and has targeted specific problems should eliminate concerns of the decision makers and improve the attractiveness of railway transport. Prejudices may stop decision makers from implementing environmentally friendly transport modes. Exchanging views with someone who already successfully uses environmentally friendly transport modes can help to overcome these prejudices. Other logistics managers who may have had different experiences, could prove that the negative experience was an exception and that the benefits are worth it to keep trying. Notably, this measure exploits the group thinking bias, as the opinion of experienced logistics managers is used to influence conservative decision makers who stick to their recent perceptions. This shows that behavioural biases can also be used to drive decision makers towards sustainable transport, which means that behavioural biases can also be helpful.
6. Conclusions, Limitations, Implications and Further Research
An abundance of studies exist which analyse the factors of mode choice. The mode choice behaviour of responsible decision makers, i.e., their selection process regarding what transport mode will be used, is therefore a critical factor influencing the environmental footprint of freight transport. Behavioural research in logistics and supply chain management can significantly advance both theory and practice in those two management fields. However, hardly any of the existing studies explicitly focus on personal and behavioural factors influencing mode choice. We contribute to the wide number of mode choice publications by assessing the influence of behavioural biases on freight mode choice. We were able to identify several behavioural biases which influence freight mode choice. These biases reflect decision makers’ characteristics and peculiarities, such as their tendency to avoid complexity, change and risk, or their failure to process available information and adjust their estimations. The occurrence of behavioural biases provides an explanation for the limited use of environmentally friendly transport modes. For decades, policy aimed to promote environmentally friendly transport modes such as inland waterway transport. Many measures and policy action plans were released to induce a modal shift. Despite these political efforts, the modal share of truck transport remained on a critically high level throughout Europe. One of the reasons is that decision makers’ behaviour has previously been neglected in the policy making process. Knowing the behavioural biases that distort freight mode choice allows precise policy measures addressing decision makers’ needs to be set. This could encourage the use of sustainable inland waterway transport.
Our research has several limitations. This article focuses on freight transport; passenger transport is not included in its scope and therefore results, e.g., in the literature review, concerning passenger transport were excluded. Our literature review was conducted using the databases SCOPUS and Emerald Insight; other databases were not included. The search in SCOPUS was limited to publications between 2010 and 2021. Moreover, the interviews and focus groups were held with decision makers working and living in Austria, which limits this article geographically. Furthermore, this article is limited by its sample size and the sample mostly consists of LSP as only a few shippers were included. Additionally, the defined measures were evaluated on a theoretical basis and not tested, which limits the significance of their evaluation.
The research presented in this article has several managerial, political and scientific implications. Managers and decision makers in LSP and shipper companies need to be aware that their decisions are naturally biased. Furthermore, they need to take biases into consideration when setting up decision processes and consider debiasing measures to promote rational and sufficient decision making. Policy makers should consider the impact of biases on decision makers, and therefore on their decisions, in the definition of policies and measures, as the desired changes can be achieved more easily by doing so. Our research extends previous mode choice studies by focusing on the impact of behavioural biases. We therefore add to the limited amount of behavioural research in the field of SCM and logistics.
Literature on factors influencing freight mode choice shows that environmentally friendliness is basically irrelevant to the decision makers. We therefore suggest further research to determine why environmental friendliness is of such low importance and what measures can be undertaken to increase its relevance. Additionally, the digital transformation and automation, which are also affecting forwarding and transportation activities, could change the influencing factors or become influencing factors themselves. The focus of our literature review was factors influencing freight mode choice; however, we noticed a lack of studies on how the operational process of freight mode choice itself works. In addition to research on the freight mode choice process, we also see a need for meta-analysis on the subject to assess the results of existing research.
Further research is suggested to conduct behavioural experiments proving the existence of behavioural biases. Biases are incidents that occur subconsciously and, due to their latent character, they can be easily denied by affected decision makers. We tried to account for that in our interviews and did not directly talk about biases in freight mode choice. This helped us to gain a first estimation as to which biases might be relevant in the context of freight mode choice. As a next step, behavioural experiments are needed to test for these biases and make sense of their impact. Kahnemann and Tversky conducted many behavioural experiments in the field of economics. However, in the field of logistics and SCM, behavioural research is very scarce and behavioural experiments are a heavily underutilised method. In addition to behavioural biases, further research could also include the impact of social preferences on mode choices. This study might provide impetus to further investigate logistics from a behavioural perspective as the discipline would benefit greatly from further behavioural insights.
Author Contributions
Conceptualisation, S.P. and V.M.S.; methodology, S.P. and V.M.S.; writing—original draft preparation, S.P. and V.M.S.; writing—review and editing, K.M., J.Z. and M.P., formal analysis, V.M.S.; investigation, V.M.S., S.P., K.M. and J.Z.; supervision, S.P.; project administration, K.M.; funding acquisition, K.M., M.P. and S.P. All authors have read and agreed to the published version of the manuscript.
Funding
This research is part of the project ModEL which was funded by the Austrian Ministry of Transport (BMK) and FFG within the research program “Mobilität der Zukunft” (grant number 877673).
Institutional Review Board Statement
We considered the ethical risk and only identified minimal ethical risk. Ethical reviews and approval were waived because we have the clear approval of each participant to publish the results and there is full anonymity leaving no possibility to identify the participants.
Informed Consent Statement
Informed consent was obtained from all subjects involved in the study.
Data Availability Statement
Data is not publicly available, though the data may be made available on request from the corresponding author.
Acknowledgments
We thank the numerous respondents from the LSPs and shippers for participating in our study.
Conflicts of Interest
The authors declare no conflict of interest. The funders had no role in the design of the study; in the collection, analyses, or interpretation of data; in the writing of the manuscript; or in the decision to publish the results.
Appendix A
Table A1.
Results of the systematic literature review on freight mode choice. (Source: own composition based on literature).
Table A1.
Results of the systematic literature review on freight mode choice. (Source: own composition based on literature).
| # | Determinant of Mode Choice | Reference(s) |
|---|---|---|
| 1. Physical characteristics of network | ||
| 1.1 | Infrastructure availability, accessibility | [24,26,27,28,31,35,37,39,53,54,55,59,60,62,90,91,92,93,94] |
| 1.2 | Infrastructure capacity | [95] |
| 1.3 | Geographic coverage of transport and access, region | [27,50,96] |
| 1.4 | Highway or railway network, density of the transport network of general use, transport network | [31,92,96,97,98] |
| 1.5 | Dry port service range and quality, dry port | [99,100] |
| 1.6 | Port berth number | [100] |
| 1.7 | Path distance ratio | [100] |
| 1.8 | Location of the station, location of intermodal terminals, location of consolidation centre | [24,27,29,101] |
| 1.9 | Modern equipment and technology for goods deposit | [27,29] |
| 1.10 | Station cleanliness | [29] |
| 1.11 | Area separation between passengers and cargo | [29] |
| 1.12 | Difference developing and developed country | [102] |
| 1.13 | Distance to the nearest airport or seaport | [30] |
| 1.14 | cargo characteristics of terminals of departure, transshipment or transhipment and destination | [103] |
| 1.15 | Characteristics of transport system | [24] |
| 1.16 | Terminal frequency of service | [24] |
| 1.17 | Convenience of location | [58] |
| 2. Shipment characteristics | ||
| 2.1 | Physical attributes, characteristics of goods, shipment characteristics | [24,26,32,36,43,48,55,95,103,104] |
| 2.2 | Commodity type to be transported, size and prize of the commodity, commodity characteristics | [24,26,31,32,33,34,38,39,41,48,53,58,60,90,92,95,105,106,107,108] |
| 2.3 | Cargo type | [39,55] |
| 2.4 | Shipment size | [24,25,26,27,32,38,39,43,44,48,51,52,55,59,62,91,92,94,100,104,109,110,111] |
| 2.5 | Packaging | [24] |
| 2.6 | Shelf-life | [39] |
| 2.7 | Shipment value, value of goods, volatility of prices, commodity value, turnover of tonnes moved | [24,25,26,28,33,35,37,39,43,49,55,57,60,95,112,113] |
| 2.8 | Shipment density, commodity density | [24,26,43] |
| 2.9 | Shipment volume, flow volume, volume of container | [24,53,58,63,98,105] |
| 2.10 | Shipment weight, weight of commodity | [24,25,26,27,34,35,39,48,54,112,114] |
| 2.11 | Value weight ratio, value density | [24,28,38,39,43,90,95,111] |
| 2.12 | Cargo requirements | [25] |
| 2.13 | Commodity group | [26] |
| 2.14 | Product state | [26] |
| 2.15 | Hazardous products | [26] |
| 2.16 | Temperature controlled | [26] |
| 2.17 | Perishability | [24,26,35] |
| 2.18 | Quantity, freight quantity | [26,50,104] |
| 2.19 | Shipment operation type | [26] |
| 2.20 | Relevance of timeliness | [43] |
| 2.21 | Necessary equipment | [39] |
| 2.22 | Incoterms | [55] |
| 2.23 | Transportation characteristics | [55] |
| 2.24 | Suitability for containerisation | [24] |
| 2.25 | Post export benefits | [24] |
| 2.26 | Production and delivery rate | [24] |
| 2.27 | Warehouse required | [24] |
| 2.28 | Status | [24] |
| 2.29 | Ton-mile | [24] |
| 2.30 | Transportation classification | [63] |
| 2.31 | Transportation batch | [63] |
| 2.32 | If the shipment has gone through a consolidation-centre | [35] |
| 2.33 | If the shipment has gone through a warehouse | [35] |
| 2.34 | If the shipment has gone through a distribution-centre | [35] |
| 3. Cost and price | ||
| 3.1 | Costs, price | [24,25,28,29,31,32,33,34,35,37,38,39,40,42,43,44,45,46,48,49,50,51,52,53,55,58,59,60,62,63,64,91,92,93,94,95,99,102,104,105,106,107,110,111,112,113,115,116,117,118,119,120,121] |
| 3.2 | Order handling costs | [26,29,40,100] |
| 3.3 | Transport charges, transport cost | [24,26,28,29,31,33,35,36,37,38,39,40,41,46,49,50,51,55,60,62,63,90,92,96,99,100,104,107,109,114,116,118,121,122] |
| 3.4 | Loss and damage costs | [92] |
| 3.5 | Capital cost during transit, cost of capital | [24,39,43] |
| 3.6 | Opportunity costs of capital tied in stock, logistics opportunity costs, opportunity costs | [39,92] |
| 3.7 | Storage cost at dry port | [100] |
| 3.8 | Cost of safety inventory, inventory cost, capital cost of inventory, inventory and stockout costs | [24,38,50,94] |
| 3.9 | Service charge | [100] |
| 3.10 | Fuel cost | [24,27,35,91,92,123,124] |
| 3.11 | Freight rate | [24,37,42,43,45,56,58,59,102,119,125] |
| 3.12 | Flexible rates for negotiating freight | [50] |
| 3.13 | Congestion cost | [100] |
| 3.14 | Inspection and quarantine cost | [100] |
| 3.15 | Port charge | [100] |
| 3.16 | FAS price | [102,109] |
| 3.17 | Value for money price | [33] |
| 3.18 | Special offer or discounts | [29,33] |
| 3.19 | External and internal cost | [39,44,112,126,127] |
| 3.20 | Social cost | [126] |
| 3.21 | Economies of distance | [101,112] |
| 3.22 | Economies of scale | [101,104,112] |
| 3.23 | Economies of scope | [58] |
| 3.24 | Transhipment cost | [27,39,49] |
| 3.25 | (Total) logistics cost | [24,38,39,43,92,104] |
| 3.26 | Transport mode specific cost structure, structure of cost | [38,96] |
| 3.27 | (Changes in) oil prices | [95] |
| 3.28 | Per vehicle cost | [24] |
| 3.29 | Shipper’s and carrier’s total operating cost | [24] |
| 3.30 | Truck-cost index, rail-cost index | [24,35] |
| 3.31 | Crowd cost | [104] |
| 3.32 | Seasonal fluctuation of tariffs | [40] |
| 3.33 | Costs for documentation processing | [40] |
| 3.34 | Penalties (missing delivery terms) | [40] |
| 3.35 | Possible additional costs during transportation | [40] |
| 3.36 | Additional insurance (insufficient strategy) | [40] |
| 3.37 | Shipping cost | [62] |
| 3.38 | Distance-based link costs | [49] |
| 3.39 | Time-based link costs | [49] |
| 3.40 | Loading and unloading costs | [49] |
| 3.41 | Access and egress costs | [49] |
| 3.42 | On-board transport cost | [49] |
| 3.43 | Door-to-door transport cost | [121] |
| 4. Flow and spatial distribution of shipment | ||
| 4.1 | Origin/destination of shipment, direction, international shipment | [24,26,28,29,30,32,33,41,42,55,56,92,95,105] |
| 4.2 | Shipment frequency, (rate of) commodity flow, transportation demand | [25,26,37,38,39,49,50,52,55,59,60,92,110,111,121] |
| 4.3 | Distance of shipment, length of haul | [24,26,27,29,30,34,35,36,38,39,41,42,43,44,49,52,53,54,55,59,62,92,95,104,105,107,108,112,114,120,128] |
| 4.4 | Ship route number | [100] |
| 4.5 | Optimised route choice, route specific evaluation | [27,33] |
| 4.6 | Congestion | [39,42,104,118] |
| 5. Modal characteristics | ||
| 5.1 | Modal characteristics | [35,43,55,103] |
| 5.2 | Capacity | [26,33,37,38,39,47,50,53,116] |
| 5.3 | Customer service | [37,55,58] |
| 5.4 | Reliability | [24,26,27,29,31,33,34,35,36,37,39,40,41,42,44,45,46,48,49,51,52,55,58,59,63,92,94,95,96,99,100,102,105,107,109,110,112,115,116,117,119] |
| 5.5 | Tolerated losses of cargo | [102] |
| 5.6 | Utility | [38,49,95] |
| 5.7 | Frequency (of service), frequency of maritime services | [24,25,27,29,31,33,34,36,37,39,42,45,46,48,50,51,52,55,58,59,60,62,95,98,100,102,107,116,117,118,120,121,122] |
| 5.8 | Timeliness, punctuality | [29,49,52,58,64,92] |
| 5.9 | Product care | [37] |
| 5.10 | Connectivity | [49,99] |
| 5.11 | Suitability | [37,58] |
| 5.12 | Effectiveness | [58] |
| 5.13 | Responsiveness | [39,58,92,110] |
| 5.14 | Mode-to-mode transfer | [37] |
| 5.15 | Convergence of freight rate | [57] |
| 5.16 | Convenience | [45,49,58,63,64,93,100] |
| 5.17 | Safety, security (risk), transport risk | [31,35,36,37,39,40,45,46,48,49,50,53,58,59,62,63,64,92,94,99,104,116,118,119,122] |
| 5.18 | Availability, availability of freight space, availability of transport units | [24,29,32,35,37,40,45,58,59] |
| 5.19 | Subsidy on each route | [100] |
| 5.20 | Flexibility | [25,27,34,35,36,37,38,39,44,46,50,51,52,53,55,58,59,60,104,107,110,113,116] |
| 5.21 | Advertisement and public announcement through various channels | [29] |
| 5.22 | Sufficient insurance coverage for goods in case of loss or damage, availability of insurance coverage | [29,99] |
| 5.23 | Special handling requirements | [32,37] |
| 5.24 | Presence of insurance | [102] |
| 5.25 | Ease of loading and unloading | [50,119] |
| 5.26 | Prospective gains and losses in relation to a reference point | [27] |
| 5.27 | Lack of standardisation: varying track gauges | [27] |
| 5.28 | Discharge of road and seaport infrastructure | [27] |
| 5.29 | Competitive advantage | [43] |
| 5.30 | Resilience | [46] |
| 5.31 | Previous experience | [39] |
| 5.32 | Road haulage quota | [24] |
| 5.33 | Modal cost | [24] |
| 5.34 | Number of required vehicles | [24] |
| 5.35 | Potential intermodal | [24,35] |
| 5.36 | Ease of intermodal transfer | [37] |
| 5.37 | Product differentiation | [94] |
| 5.38 | Capability | [94] |
| 5.39 | Same decision | [24,35] |
| 5.40 | Dependability | [58] |
| 5.41 | Availability of the mode of transportation | [49,58] |
| 6. Service | ||
| 6.1 | Service quality | [26,32,33,35,37,38,39,47,48,49,50,58,59,60,100,104,110,112,113,119] |
| 6.2 | Minimum notification time for shipping order | [49] |
| 6.3 | Consistent and dependable transit time | [58] |
| 6.4 | Trip time, delivery time reliability, transit time reliability, travel time reliability, transportation time reliability, relative deviation in delivery time, on-time reliability, shipping time reliability | [31,32,33,37,38,43,48,50,53,60,62,104,111,118,121] |
| 6.5 | Timeliness, punctuality | [29,37,45,50,58,59,60,61,63,118,119,121] |
| 6.6 | Controllability and traceability, shipment tracking, monitoring | [26,29,39,50,55,58,59,62,99,119,121] |
| 6.7 | Information provision | [27,29,49,58] |
| 6.8 | Insurance of service provision | [58] |
| 6.9 | Risk of damage and pilferage/loss, damage loss ratio, percentage of loss and damage | [24,27,28,34,37,39,40,48,51,52,53,55,58,60,62,99,119,121] |
| 6.10 | Quality of drivers, quality of transport personnel, operating personnel, quality of carrier personnel | [50,58,59] |
| 6.11 | Billing accuracy, billing services | [50,58] |
| 6.12 | On-time pick-up and delivery, reliable collection service | [33,50,59] |
| 6.13 | On-time arrival resp. delivery rate | [49,122] |
| 6.14 | Shipping documentation | [33,50,58,61] |
| 6.15 | Knowledge/problem solving skills of contact personnel | [58] |
| 6.16 | Action and follow-up on service complaints | [58] |
| 6.17 | Response to problem, quick response to emergencies, emergency deliveries | [33,50,59] |
| 6.18 | Equipment availability | [58,59,119] |
| 6.19 | Service flexibility | [35,37,55,58,118,121] |
| 6.20 | Restitution for loss and damage | [37,58] |
| 6.21 | Port service quality, port efficiency | [100,102] |
| 6.22 | Availability of schedule management agency | [29] |
| 6.23 | Multiple payment channels | [29] |
| 6.24 | Reliability of service | [26,42,49,58,118,122] |
| 6.25 | Transport quality | [39,48,55,117,118] |
| 6.26 | Low delivery error, consistent delivery | [50,58] |
| 6.27 | Scheduling flexibility, flexibility in departure time/schedules | [92,119,120,121] |
| 6.28 | Customer satisfaction | [43] |
| 6.29 | Value-added services | [118] |
| 6.30 | Modal control | [118] |
| 6.31 | Tangibility, assurance, empathy | [39,58] |
| 6.32 | Service level | [49,63] |
| 6.33 | Door-to-door service | [37] |
| 6.34 | Availability of certain desired services | [58] |
| 6.35 | Warehousing | [58] |
| 6.36 | Potential to smoothly handle future increase in trade volumes | [49] |
| 6.37 | Percentage of deliveries delayed more than 2 days | [122] |
| 7. Distributor features | ||
| 7.1 | Trust | [58] |
| 7.2 | Reputation | [51,58] |
| 7.3 | Competitive pricing | [32,58] |
| 7.4 | Percentage of shipment arriving within 3 h of schedule | [42] |
| 7.5 | Percentage of shipment arriving more than 24 h after schedule | [42] |
| 7.6 | Financial stability of firm | [32,58,59] |
| 7.7 | Modal connectivity | [37,49] |
| 7.8 | Features of contract | [47] |
| 7.9 | High general carrier performance, history of performance experience, carrier performance | [27,50,58] |
| 7.10 | Available assets | [32] |
| 7.11 | Carrier characteristics | [24,33] |
| 7.12 | Handle special requirements and urgent deliveries | [33] |
| 7.13 | Staff’s attentive and enthusiastic manners and willingness to serve customer | [29] |
| 7.14 | Carrier’s flexibility | [48] |
| 7.15 | Competence | [48] |
| 7.16 | Cooperation between transport staff and carrier | [50] |
| 7.17 | Cooperation between the carrier and the shipper’s personnel | [51] |
| 7.18 | Longterm relationship (possibility) | [50,58] |
| 7.19 | Frequent communication with carrier, perception of communication | [50,58] |
| 7.20 | Information technology for storage and transport | [50] |
| 7.21 | Compability of strategies and company cultures | [50] |
| 7.22 | Transport resources | [98] |
| 7.23 | Logistics service quality | [39] |
| 7.24 | Claims handling/follow-up, loss/damage/claims processing/tracing | [58] |
| 7.25 | Solid customer relations | [58] |
| 7.26 | Willingness to meet service expectations | [58] |
| 7.27 | Willingness to focus on continuous improvement | [58] |
| 7.28 | Ability to handle special needs and emergencies | [58] |
| 7.29 | Willingness to meet cost goals | [58] |
| 7.30 | Strong technical capability | [58] |
| 7.31 | Established safety programs | [58] |
| 7.32 | Sales service | [58] |
| 7.33 | Low loss and damage record | [58] |
| 7.34 | Courtesy of inquiry | [58] |
| 7.35 | Forwarding services | [58] |
| 7.36 | Knowledge/problem solving skills of contact personnel | [58] |
| 8. Time and urgency | ||
| 8.1 | Time, urgency | [24,25,29,31,35,37,39,40,43,44,49,51,52,55,56,59,60,62,63,64,92,93,98,99,104,106,113,116,119,120,128] |
| 8.2 | Transit time | [24,27,31,33,34,36,37,42,43,44,45,50,51,52,55,58,59,60,100,104,109,110,117,118,120,121] |
| 8.3 | Transport time, travel time | [26,28,29,31,37,38,40,46,48,49,55,60,62,63,90,92,94,98,99,100,102,104,105,107,111,112,114,116,119,120,122] |
| 8.4 | Value of time | [42,49,104,105] |
| 8.5 | Speed | [35,39,42,51,53,58,62,104,115,116] |
| 8.6 | Custom clearance time | [40,100] |
| 8.7 | Waiting time at the port | [100] |
| 8.8 | Lead time | [53,109] |
| 8.9 | Arrival time | [33] |
| 8.10 | Time fluctuation | [25] |
| 8.11 | Container unloading and loading time | [29] |
| 8.12 | Door-to-door service time, door-to-door transit time | [29,121] |
| 8.13 | Season of the year | [26] |
| 8.14 | Time of day | [26] |
| 8.15 | Delay | [24,40,42,52,55,60,102,104,118,121] |
| 8.16 | Service headway | [102] |
| 8.17 | Time windows for delivery | [41] |
| 8.18 | Train schedule | [99] |
| 8.19 | Service time | [95] |
| 8.20 | Delivery time | [35,40,95] |
| 8.21 | Barge transport locks | [39] |
| 8.22 | Transhipment time | [39] |
| 8.23 | Consignment (urgent or with LC) | [24] |
| 8.24 | Time continuity | [104] |
| 8.25 | Time for border crossing | [40] |
| 8.26 | Exchange rate fluctuation time during time of deliver | [40] |
| 8.27 | Haul time | [35] |
| 9. Shipper characteristics | ||
| 9.1 | Organisation resp. company resp. shipper characteristics | [24,94] |
| 9.2 | Large transport purchasing resources (shipper) | [27] |
| 9.3 | Company policy and procedure | [61] |
| 9.4 | Strong shipper pressure | [47] |
| 9.5 | Transport preference of trading partner | [33] |
| 9.6 | Specific logistics needs | [112] |
| 9.7 | Shipper: number of employees, fleet size, surviving year | [25,26,55,60] |
| 9.8 | Demand volatility (shipper), demand variation, positive sales surprises, yearly sales | [39,43,98,118] |
| 9.9 | Company size | [24,26,52,58,94] |
| 9.10 | Economic activities of firms | [26] |
| 9.11 | Nature of business, business industry | [24,52,55] |
| 9.12 | Location of business activities | [52] |
| 9.13 | Loyalty to a mode or carrier | [59,105,110] |
| 9.14 | Knowledge of the shipper’s need | [51] |
| 9.15 | Financial cash flows | [43] |
| 9.16 | Contribution margin ratio | [43] |
| 9.17 | Competition | [43] |
| 9.18 | Foreign ownership | [30] |
| 9.19 | Superior logistics management | [30] |
| 9.20 | Logistics characteristics | [55] |
| 9.21 | Shipper types | [55] |
| 9.22 | Firms structures | [24,94] |
| 9.23 | Firms location | [24] |
| 9.24 | Firms MIS | [24] |
| 9.25 | Company operational styles and patterns | [94] |
| 9.26 | Firm contact | [37,58] |
| 10. Environment and sustainability | ||
| 10.1 | Environment, sustainability | [37,51,52,55,92,116,117,119,121,123] |
| 10.2 | Environmental performance | [46] |
| 10.3 | Pollution | [123] |
| 10.4 | Carbon emission cost | [100] |
| 10.5 | Carbon tax, eco tax, emission tax, introduction of emission allowances, GHG tax | [42,54,55,120,127] |
| 10.6 | CO2 emission and cost | [27,40,100,116,128] |
| 10.7 | (noise and) accident risk, number of road traffic accidents, accidents and disasters from the ecological point of view | [39,40,97,116] |
| 10.8 | Noise hindrance resp. pollution and vibration | [27,40,53,116] |
| 10.9 | GHG and other atmospheric pollutants | [36,53,93,116] |
| 10.10 | Emission, emissions of harmful substances, emissions of solid and liquid wastes, emission of substances harmful to the ozone layer | [40,51,53,93,95,114,116] |
| 10.11 | Environmental demands | [27] |
| 10.12 | Willingness to pay for environmentalism | [27] |
| 10.13 | Environmental constraints | [27] |
| 10.14 | Sulphur limits | [125] |
| 10.15 | Energy efficiency, energy, energy consumption, energy use | [53,93,95] |
| 10.16 | Environmental impact | [40] |
| 10.17 | Death and traumatism of people | [40] |
| 10.18 | Possibility of recycling components after their useful life | [53] |
| 10.19 | Depletion of natural resources | [53] |
| 10.20 | Water consumption | [53] |
| 10.21 | Heat pollution | [53] |
| 10.22 | Consumption of material | [53] |
| 10.23 | Emissions reduction | [120] |
| 11. Economics | ||
| 11.1 | Liberalisation of trade | [54] |
| 11.2 | GDP growth | [54] |
| 11.3 | Shadow toll | [44] |
| 11.4 | Working conditions of truck drivers and driver shortage | [27] |
| 11.5 | Diverging funding guidelines for road or rail transport, infrastructures and technologies | [27] |
| 11.6 | Adjusted transport regulations | [27] |
| 11.7 | Fiscal incentives for intermodal services, equipment or terminals | [27] |
| 11.8 | Operational length of railways for general use | [97] |
| 11.9 | Index of industrial production | [56] |
| 11.10 | Exchange rates, volatility of the exchange rate at the country level | [43,56] |
| 11.11 | Industry characteristics, fixed industry effects | [30,43] |
| 11.12 | Real interest rate | [43] |
| 11.13 | Strength of regional economy | [95] |
| 12. Supply chain characteristics | ||
| 12.1 | Supply chain characteristics, complexity of the chain, supply chain (dictates modal choice), supply chain efficiency, logistics issues within the supply chain, value-added services in the supply chain | [37,39,43,44,110] |
| 12.2 | Lack of qualification opportunities | [27] |
| 12.3 | Complex coordination due to cooperation, revenue sharing and unresolved risk sharing | [27] |
| 12.4 | Working conditions of truck drivers and driver shortage | [27] |
| 12.5 | Freight turnover by types of transport | [97] |
| 12.6 | Transportation of goods by type of transport | [97] |
| 12.7 | Technological aspects | [56] |
| 12.8 | Composite leading indicator | [56] |
| 12.9 | Regional characteristics | [43] |
| 12.10 | External effects | [39] |
| 12.11 | Qualification | [59] |
| 12.12 | Maritime distance on inland mode choice | [24] |
| 12.13 | Structural inelasticies | [108] |
| 12.14 | Number of intermediate agents | [26] |
| 12.15 | Electronic data interchange | [58] |
| 12.16 | Image | [58] |
| 12.17 | Approach, support | [58] |
| 12.18 | Topography and climate of the country | [58] |
| 13. Behavioural characteristics of decision maker | ||
| 13.1 | Relationship to transport operators | [33,50,57] |
| 13.2 | Personalisation | [58] |
| 13.3 | Shipper (market) considerations | [37,39,48,58,59] |
| 13.4 | Carrier considerations | [37,39,48,58,59] |
| 13.5 | Perception | [37,58,60,61] |
| 13.6 | Personal proprieties | [37,62] |
| 13.7 | Experience | [24,35,55,63] |
| 13.8 | Preferences | [25,31,39,50,63,64] |
| 13.9 | Subjective judgement | [63] |
| 13.10 | Behavioural bias | [27,39] |
| 13.11 | Type of decision maker | [35,55,63] |
Appendix B
Table A2.
List of behavioural biases potentially relevant in freight mode choice. (Source: own composition based on literature).
Table A2.
List of behavioural biases potentially relevant in freight mode choice. (Source: own composition based on literature).
| Behavioural Bias | Description | Reference | Empirical Evidence in Freight Mode Choice |
|---|---|---|---|
| Ambiguity effect | The ambiguity effect is caused by the missing probability information. People associate ambiguous probability information with high outcome variance and people avoid options, whose probability information is imprecise or lacking. | Rode et al. [129] | No evidence found |
| Anchoring bias | The anchoring bias makes people rely too strongly on the first piece of information they receive. Anchoring means, e.g., that when people need to estimate something, they are biased by the initial value. Different starting points will lead to different estimates. | Tversky and Kahneman [18], Sapadin [80] | Partial confirmation found |
| Availability bias | People assess the frequency or probability of an event by the ease of remembering instances or occurrences. | Tversky and Kahneman [18] | Confirmation found |
| Basic assessment | Basic assessments are prejudices, which are made based on little information. Certain signals are given particular weight and determine thinking. These basic assessments can be part of planning, if few, but significant criteria determine the planning and it turns out afterwards that a lot was overlooked. | Fürst [130] | No evidence found |
| Biases of rhetoric | This bias occurs when a persuading argument does not appeal to reason or evidence. For example, false claims or reasoning used in an argument can be biases of rhetoric. | Catalogue of Bias Collaboration et al. [131] | No evidence found |
| Choice-supportive bias | People favour the chosen option over the rejected option. The focus on the positive features of the chosen option or on the negative features of the rejected option. | Henkel and Mather [132] | No evidence found |
| Complexity effect | “Time pressure, information overload and other environmental factors can increase the perceived complexity of a task” [69] (p 61) | Arnott [69] | Confirmation found |
| Confirmation bias | “Often decision-makers seek confirmatory evidence and do not search for disconfirming information” [69] (p 60) | Arnott [69] | Partial disconfirmation found |
| Conservatism bias | The conservatism bias occurs when people rely too strongly on initial information and this has an impact on further evaluations. | Tversky and Kahneman [18], Arlinghaus et al. [81] | No evidence found |
| Cultural bias | This bias is caused by structural, socio-political and cultural differences. | Trompet et al. [133] | No evidence found |
| Diminishing sensitivity | Diminishing sensitivity is a characteristic of a value function in which the outcomes of prospects are evaluated. It means that “the marginal value of both gains and losses decreases with their size.” [19]. | Tversky and Kahneman [19] | No evidence found |
| Familiarity heuristic | The familiarity heuristic means that, when people draw conclusions, they use the familiarity of objects. | Honda [134] | No evidence found |
| First choice effect | Individuals tend to confirm their first choice. | Innocenti et al. [15] | No evidence found |
| Framing effect | “Events framed as either losses or gains may be evaluated differently” [69] (p 61) | Arnott [69] | No evidence found |
| Group thinking | Group thinking means that the opinion of the group is valued higher than the opinion of an individual in the decision-making process. | Hall [75] | Partial confirmation found |
| Habit | Behaviours, which have been repeated and executed satisfactorily, may become habits. Habits originate from past experiences; therefore, they have some features of automaticity such as efficiency and lack of awareness. “An alternative may be chosen only because it was used before” [69] (p 61). | Verplanken and Aarts [74] | Confirmation found |
| Illusion of control | Illusion of control makes one feel as though one can influence the outcome by personal involvement, when in fact one cannot. A bad decision may cause a good outcome; this could lead to a wrong feeling of control over the situation. | Arnott [69], Chira et al. [77] | Partial confirmation found |
| Inconsistency | “Often a consistent judgement strategy is not applied to an identical repetitive set of cases” [69] (p 61) | Arnott [69] | No evidence found |
| Individual-specific bias | This bias is caused by individual factors such as sex, age, lifestyle, educational level, etc., of the decision maker and the evaluation of characteristics of the modes by the decision maker. | Bhat [135], Haas et al. [136] | No evidence found |
| Information bias | This bias occurs from systematic differences in collecting, recalling, recording or handling of information. | Catalogue of Bias Collaboration et al. [137] | No evidence found |
| Language bias | Publications in languages other than English might be considered as less important. Reading and using only English research could cause a biased assessment of the subject and therefore cause biased results in reviews. | Catalogue of Bias Collaboration et al. [138] | No evidence found |
| Loss aversion resp. prospect theory | Loss aversion comparable to diminishing sensitivity is another characteristic of a value function in which the outcomes of prospects are evaluated. The value function is less steep in the positive than it is in the negative. Loss aversion means that losses seem larger than corresponding gains. | Tversky and Kahneman [19] | No evidence found |
| Narrowly bracketing | Narrowly bracketing resp. narrow framing means that people consider decisions separately and therefore take a sequence of decisions instead of one comprehensive decision. | Kahneman [21] | No evidence found |
| Observer bias | Observed and recorded information can include systematic differences from the actual truth. | Catalogue of Bias Collaboration et al. [139] | No evidence found |
| Ostrich effect | People tend to avoid negative information about a decision they made. | Brown and Kagel [78] | Partial disconfirmation found |
| Perception bias | People tend to be subjective about events and people; this may cause the collection of biased information or a biased interpretation of the results. | Catalogue of Bias Collaboration et al. [140] | No evidence found |
| Principle of least effort | The principle of least effort means that people try to minimise their effort. For example, if one must solve a problem, one will try to solve the immediate problem in a way that the effort for solving the immediate problem and probable future problems will be minimised. | Zipf [71] | Confirmation found |
| Recall bias | “An event or class may appear more numerous or frequent if its instances are more easily recalled than other equally probable events” [69] (p 60) | Arnott [69] | No evidence found |
| Recency effect | Recent events are easier remembered than events which are further in the past. | Tversky and Kahneman [18] | Partial confirmation found |
| Regional bias | Regional bias can occur, for example, when comparing regional monopolies with each other in ratings based on averages. Some regions give higher ratings and other regions give lower ratings. These regional differences disadvantage monopolies in regions that tend to give lower ratings. | Brint and Fry [141] | No evidence found |
| Representativeness heuristics | Due to the representativeness heuristics, people base their predictions on similarity and ignore other factors such as prior probability, which also have an impact on the likelihood of an outcome. Background information, specific evidence regarding the individual case and the expected accuracy of the prediction are the information relevant for statistical predictions. People predicting by representativeness will order outcomes by their similarity to the specific evidence and ignore background information | Kahneman and Tversky [17] | No evidence found |
| Silver lining effect | This bias means that an option will seem more attractive if the losses and relatively smaller gains are shown in segregation than in aggregation. The small gains are a “silver lining” to the losses. | Jarnebrant et al. [142] | No evidence found |
| Status quo bias | The status quo bias means that individuals tend to prefer the status quo to other options as the disadvantages of leaving the status quo seem larger than the advantages. | Kahneman et al. [20] | Confirmation found |
| Zero-risk bias | People prefer an option with no risk over an option with an uncertain but better outcome. The option with zero risk may not be the best option, but its outcome is certain. The zero-risk bias is much the same as the certainty effect. The zero-risk bias occurs when a zero-risk option is compared with a risky option. | Raue and Schneider [143] | Confirmation found |
References
- European Environment Agency. Greenhouse Gas Emissions from Transport in Europe. Available online: https://www.eea.europa.eu/data-and-maps/indicators/transport-emissions-of-greenhouse-gases/transport-emissions-of-greenhouse-gases-12 (accessed on 7 August 2020).
- Button, K. Transport Economics, 3rd ed.; Edward Elgar Publishing Incorporated: Cheltenham, UK, 2010; ISBN 978-1-84064-189-9. [Google Scholar]
- PLANCO Consulting GmbH, Bundesanstalt für Gewässerkunde. Verkehrswirtschaftlicher und Ökologischer Vergleich der Verkehrsträger Straße, Schiene und Wasserstraße; Wasser-und Schifffahrtsdirektion Ost: Magdeburg, Germany, 2007. [Google Scholar]
- van Essen, H.; van Wijngaarden, L.; Schroten, A.; Sutter, D.; Bieler, C.; Maffii, S.; Brambilla, M.; Fiorello, D.; Fermi, F.; Parolin, R.; et al. Handbook on the External Costs of Transport; Version 2019; Publications Office of the European Union: Luxembourg, 2019; ISBN 978-92-79-96917-1. [Google Scholar]
- Eurostat. Freight Transport Statistics—Modal Split. Available online: https://ec.europa.eu/eurostat/statistics-explained/index.php/Freight_transport_statistics_-_modal_split#Modal_split_in_the_EU (accessed on 12 November 2020).
- Wannenwetsch, H. (Ed.) Nationale und Internationale Verkehrsträgerlogistik. In Integrierte Materialwirtschaft, Logistik und Beschaffung; Springer: Berlin/Heidelberg, Germany, 2014; pp. 653–683. ISBN 978-3-642-45022-8. [Google Scholar]
- Via Donau. Handbuch der Donauschifffahrt, 4th ed.; Via Donau: Wien, Austria, 2019. [Google Scholar]
- Manski, C.F. The structure of random utility models. Theory Decis. 1977, 8, 229–254. [Google Scholar] [CrossRef]
- Linz, M. Weder Mangel noch Übermaß: Über Suffizienz und Suffizienzforschung. Available online: https://epub.wupperinst.org/frontdoor/deliver/index/docId/1915/file/WP145.pdf (accessed on 7 August 2020).
- Kanatschnig, D.; Mandl, S. Smart Rebound: Steigerung der Energie- und Ressourceneffizienz durch Rebound-Prävention bei Smart Cities; Berichte aus Energie und Umweltforschung: Wien, Austria, 2015; Available online: https://nachhaltigwirtschaften.at/resources/nw_pdf/1535_smart_rebound.pdf?m=1469659241& (accessed on 7 August 2020).
- Santarius, T. Der Rebound-Effekt: Über die Unerwünschten Folgen der Erwünschten Energieffizienz. Available online: https://wupperinst.org/a/wi/a/s/ad/1668 (accessed on 7 August 2020).
- Stengel, O. Suffizienz: Die Konsumgesellschaft in der Ökologischen Krise. Doctoral Thesis, Wuppertal Institut für Klima, Umwelt, Energie, Wuppertal, Germany, 2010. [Google Scholar]
- Paré, G.; Trudel, M.-C.; Jaana, M.; Kitsiou, S. Synthesizing information systems knowledge: A typology of literature reviews. Inf. Manag. 2015, 52, 183–199. [Google Scholar] [CrossRef]
- Mattauch, L.; Ridgway, M.; Creutzig, F. Happy or liberal? Making sense of behavior in transport policy design. Transp. Res. Part D Transp. Environ. 2016, 45, 64–83. [Google Scholar] [CrossRef]
- Innocenti, A.; Lattarulo, P.; Pazienza, M.G. Car stickiness: Heuristics and biases in travel choice. Transp. Policy 2013, 25, 158–168. [Google Scholar] [CrossRef]
- Comerford, D.A. Attenuating focalism in affective forecasts of the commuting experience: Implications for economic decisions and policy making. J. Econ. Psychol. 2011, 32, 691–699. [Google Scholar] [CrossRef]
- Kahneman, D.; Tversky, A. On the psychology of prediction. Psychol. Rev. 1973, 80, 237–251. [Google Scholar] [CrossRef]
- Tversky, A.; Kahneman, D. Judgment under uncertainty: Heuristics and biases. Science 1974, 185, 1124–1131. [Google Scholar] [CrossRef]
- Tversky, A.; Kahneman, D. Loss aversion in riskless choice: A reference-dependent model. Q. J. Econ. 1991, 106, 1039–1061. [Google Scholar] [CrossRef]
- Kahneman, D.; Knetsch, J.L.; Thaler, R.H. Anomalies: The endowment effect, loss aversion, and status quo bias. J. Econ. Perspect. 1991, 5, 193–206. [Google Scholar] [CrossRef]
- Kahneman, D. Thinking, Fast and Slow; Penguin Books: London, UK, 2012; ISBN 978-0-141-03357-0. [Google Scholar]
- Stake, R.E. Qualitative Research: Studying How Things Work; Guilford Press: New York, NY, USA, 2010. [Google Scholar]
- MAXQDA. What Is MAXQDA? Collect—Transcribe—Organize—Analyze—Visualize—Publish. Available online: https://www.maxqda.com/what-is-maxqda (accessed on 20 September 2021).
- Derakhshan, A.; Shah, M.Z. Analysis of inland mode choice decision for imported waterborne cargo from New York & New Jersey Ports. Eur. Transp. 2013, 55, 1–19. [Google Scholar]
- Zhang, R.; Zhu, L. Threshold incorporating freight choice modeling for hinterland leg transportation chain of export containers. Transp. Res. Part A Policy Pract. 2019, 130, 858–872. [Google Scholar] [CrossRef]
- Keya, N.; Anowar, S.; Eluru, N. Joint model of freight mode choice and shipment size: A copula-based random regret minimization framework. Transp. Res. Part E Logist. Transp. Rev. 2019, 125, 97–115. [Google Scholar] [CrossRef]
- Elbert, R.; Seikowsky, L. The influences of behavioral biases, barriers and facilitators on the willingness of forwarders’ decision makers to modal shift from unimodal road freight transport to intermodal road–rail freight transport. J. Bus. Econ. 2017, 87, 1083–1123. [Google Scholar] [CrossRef]
- Abate, M.; Vierth, I.; Karlsson, R.; de Jong, G.; Baak, J. A disaggregate stochastic freight transport model for Sweden. Transportation 2019, 46, 671–696. [Google Scholar] [CrossRef]
- Siridhara, S.; Paonoi, W.; Meeyai, S.; Ratanavaraha, V. Container transport mode choice analysis with a binary logit model case study: Northeastern Thailand. Eng. Appl. Sci. Res. 2019, 46, 256–266. [Google Scholar] [CrossRef]
- Hayakawa, K.; Tanaka, K.; Ueki, Y. Transport modal choice by multinational firms: Firm-level evidence from Southeast Asia. Int. Econ. J. 2013, 27, 609–623. [Google Scholar] [CrossRef]
- Zhang, Y.Z.; Wang, J.Q.; Hu, Z.A. Optimization model of transportation product selection for railway express freight. J. Eng. Sci. Technol. Rev. 2016, 9, 104–110. [Google Scholar] [CrossRef]
- Stank, T.P.; Goldsby, T.J. A framework for transportation decision making in an integrated supply chain. Supply Chain Manag. Int. J. 2000, 5, 71–78. [Google Scholar] [CrossRef]
- Zhang, X.; Schramm, H.-J. Assessing the market niche of Eurasian rail freight in the belt and road era. Int. J. Logist. Manag. 2020, 31, 729–751, ahead-of-print. [Google Scholar] [CrossRef]
- Neal, C.; Koo, T.T.R. Demand for cargo airships: An analysis of mode choice decision making in the freight transport industry. J. Air Transp. Manag. 2020, 83, 101741. [Google Scholar] [CrossRef]
- Samimi, A.; Kawamura, K.; Mohammadian, A. A behavioral analysis of freight mode choice decisions. Transp. Plan. Technol. 2011, 34, 857–869. [Google Scholar] [CrossRef]
- Nugroho, M.T.; Whiteing, A.; de Jong, G. Port and inland mode choice from the exporters’ and forwarders’ perspectives: Case study—Java, Indonesia. Res. Transp. Bus. Manag. 2016, 19, 73–82. [Google Scholar] [CrossRef]
- Kim, H.-C.; Nicholson, A.; Kusumastuti, D. Analysing freight shippers’ mode choice preference heterogeneity using latent class modelling. Transp. Res. Procedia 2017, 25, 1109–1125. [Google Scholar] [CrossRef]
- Lloret-Batlle, R.; Combes, F. Estimation of an inventory theoretical model of mode choice in freight transport. Transp. Res. Rec. J. Transp. Res. Board 2013, 2378, 13–21. [Google Scholar] [CrossRef]
- Mommens, K.; van Lier, T.; Macharis, C. Multimodal choice possibilities for different cargo types: Application to Belgium. Res. Transp. Bus. Manag. 2020, 37, 100528. [Google Scholar] [CrossRef]
- Kopytov, E.; Abramov, D. Multiple-criteria analysis and choice of transportation alternatives in multimodal freight transport system. Transp. Telecommun. J. 2012, 13, 148–158. [Google Scholar] [CrossRef]
- Irannezhad, E.; Hickman, M. Behavioural urban freight modelling: Exploring effetcs of policies on an urban freight distribution system. In Proceedings of the Australasian Transport Research Forum, Melbourne, VIC, Australia, 16–18 November 2016. [Google Scholar]
- Brooks, M.R.; Puckett, S.M.; Hensher, D.A.; Sammons, A. Understanding mode choice decisions: A study of Australian freight shippers. Marit. Econ. Logist. 2012, 14, 274–299. [Google Scholar] [CrossRef]
- Ke, J.-Y.F.; Windle, R.J.; Han, C.; Britto, R. Aligning supply chain transportation strategy with industry characteristics: Evidence from the US-Asia supply chain. Int. J. Phys. Distrib. Logist. Manag. 2015, 45, 837–860. [Google Scholar] [CrossRef]
- Morales-Fusco, P.; Grau, M.; Saurí, S. Effects of RoPax shipping line strategies on freight price and transporter’s choice. Policy implications for promoting MoS. Transp. Policy 2018, 67, 67–76. [Google Scholar] [CrossRef]
- Wu, S.; Sun, Y.; Yang, Z. Analyzing the trade transportation and its demand on multimodal transportation system between China and Koreas. Marit. Bus. Rev. 2020, 5, 84–98. [Google Scholar] [CrossRef]
- Panagakos, G.P.; Stamatopoulou, E.V.; Psaraftis, H.N. The possible designation of the Mediterranean Sea as a SECA: A case study. Transp. Res. Part D Transp. Environ. 2014, 28, 74–90. [Google Scholar] [CrossRef]
- Eng-Larsson, F.; Norrman, A. Modal shift for greener logistics − exploring the role of the contract. Int. J. Phys. Distrib. Logist. Manag. 2014, 44, 721–743. [Google Scholar] [CrossRef]
- Zeybek, H. Analysis of freight mode choice decisions of shippers and forwarders: Pre-liberalisation survey. World Rev. Intermodal Transp. Res. 2019, 8, 209–221. [Google Scholar] [CrossRef]
- Shin, S.; Roh, H.-S.; Hur, S. Characteristics analysis of freight mode choice model according to the introduction of a new freight transport system. Sustainability 2019, 11, 1209. [Google Scholar] [CrossRef]
- De La Vega, D.S.; Vieira, J.G.V.; Toso, E.A.V.; de Faria, R.N. A decision on the truckload and less-than-truckload problem: An approach based on MCDA. Int. J. Prod. Econ. 2018, 195, 132–145. [Google Scholar] [CrossRef]
- Bask, A.; Rajahonka, M. The role of environmental sustainability in the freight transport mode choice: A systematic literature review with focus on the EU. Int. J. Phys. Distrib. Logist. Manag. 2017, 47, 560–602. [Google Scholar] [CrossRef]
- Konstantinus, A.; Zuidgeest, M. An investigation into the factors influencing inter-urban freight mode choice decisions in the Southern African development community region. J. Transp. Supply Chain Manag. 2019, 13. [Google Scholar] [CrossRef]
- Leal, I.C., Jr.; D’Agosto, M.d.A. Modal choice for transportation of hazardous materials: The case of land modes of transport of bio-ethanol in Brazil. J. Clean. Prod. 2011, 19, 229–240. [Google Scholar] [CrossRef]
- Avetisyan, M. Impacts of global carbon pricing on international trade, modal choice and emissions from international transport. Energy Econ. 2018, 76, 532–548. [Google Scholar] [CrossRef]
- Konstantinus, A.; Zuidgeest, M.; Hess, S.; de Jong, G. Assessing inter-urban freight mode choice preference for short-sea shipping in the Southern African development community region. J. Transp. Geogr. 2020, 88, 102816. [Google Scholar] [CrossRef]
- Kawasaki, T.; Matsuda, T. Containerization of bulk trades: A case study of US-Asia wood pulp transport. Marit. Econ. Logist. 2015, 17, 179–197. [Google Scholar] [CrossRef]
- Gray, R. Modal choice for urgent consignments between Britain and Western Europe. Int. J. Phys. Distrib. Mater. Manag. 1981, 11, 52–63. [Google Scholar] [CrossRef]
- Meixell, M.J.; Norbis, M. A review of the transportation mode choice and carrier selection literature. Int. J. Logist. Manag. 2008, 19, 183–211. [Google Scholar] [CrossRef]
- Reis, V. Analysis of mode choice variables in short-distance intermodal freight transport using an agent-based model. Transp. Res. Part A Policy Pract. 2014, 61, 100–120. [Google Scholar] [CrossRef]
- Bergantino, A.S.; Bierlaire, M.; Catalano, M.; Migliore, M.; Amoroso, S. Taste heterogeneity and latent preferences in the choice behaviour of freight transport operators. Transp. Policy 2013, 30, 77–91. [Google Scholar] [CrossRef]
- Jozef, E.; Kumar, K.M.; Iranmanesh, M.; Foroughi, B. The effect of green shipping practices on multinational companies’ loyalty in Malaysia. Int. J. Logist. Manag. 2019, 30, 974–993. [Google Scholar] [CrossRef]
- Gursoy, M. A decision supportive method for multimodal freight transport mode choice: An example from Turkey. Iran. J. Sci. Technol. Trans. B Eng. 2010, 34, 461–470. [Google Scholar]
- Luo, J.; Chen, Y. Research on mode selection of freight transport based on risk preference theory. Int. J. Adv. Comput. Technol. 2012, 4, 138–146. [Google Scholar] [CrossRef]
- Zhao, L. Study on the behavior analysis choice mode of cargo transportation. Wirel. Pers. Commun. 2018, 102, 1149–1158. [Google Scholar] [CrossRef]
- Sanz de Acedo Lizárraga, M.L.; Sanz de Acedo Baquedano, M.T.; Cardelle-Elawar, M. Factors that affect decision making: Gender and age differences. Int. J. Psychol. Psychol. Ther. 2007, 7, 381–391. [Google Scholar]
- Delaney, R.; Strough, J.; Parker, A.M.; Bruine de Bruin, W. Variations in decision-making profiles by age and gender: A cluster-analytic approach. Personal. Individ. Differ. 2015, 85, 19–24. [Google Scholar] [CrossRef]
- Gibbons, W.; Jonsson, J.; Abelman, S.; Bass, R. Observed heuristics and biases in air traffic management decision making using convective weather uncertainty. In Proceedings of the 6th AIAA Atmospheric and Space Environments Conference, Atlanta, GA, USA, 16–20 June 2014; American Institute of Aeronautics and Astronautics: Reston, VA, USA, 2014. ISBN 978-1-62410-291-2. [Google Scholar]
- Benson, B. Cognitive Bias Cheat Sheet: Because Thinking Is Hard. Available online: https://medium.com/better-humans/cognitive-bias-cheat-sheet-55a472476b18#.c74x1wf87 (accessed on 23 January 2021).
- Arnott, D. Cognitive biases and decision support systems development: A design science approach. Inf. Syst. J. 2006, 16, 55–78. [Google Scholar] [CrossRef]
- Aronson, J.; Badenoch, D.; Brassey, J.; Chalmers, I.; Friedemann Smith, C.; Nunan, D. A Taxonomy of Biases: Progress Report. Available online: https://catalogofbias.org/2020/02/11/a-taxonomy-of-biases-progress-report (accessed on 23 January 2021).
- Zipf, G.K. Human Behavior and the Principle of Least Effort: An Introduction to Human Ecology. 2016. Available online: https://books.google.pl/books?hl=pl&lr=&id=m-XDCwAAQBAJ&oi=fnd&pg=PT4&dq=Human+Behavior+and+the+Principle+of+Least+Effort:+An+Introduction+to+Human+Ecology&ots=Dn-2mp5Z6u&sig=vYAz0UikWCUAB1yMgpg2rd8v_c8&redir_esc=y#v=onepage&q=Human%20Behavior%20and%20the%20Principle%20of%20Least%20Effort%3A%20An%20Introduction%20to%20Human%20Ecology&f=false (accessed on 23 January 2021).
- Frémont, A.; Franc, P. Hinterland transportation in Europe: Combined transport versus road transport. J. Transp. Geogr. 2010, 18, 548–556. [Google Scholar] [CrossRef]
- Islam, D.M.Z.; Ricci, S.; Nelldal, B.-L. How to make modal shift from road to rail possible in the European transport market, as aspired to in the EU Transport White Paper 2011. Eur. Transp. Res. Rev. 2016, 8, 18. [Google Scholar] [CrossRef]
- Verplanken, B.; Aarts, H. Habit, attitude, and planned behaviour: Is habit an empty construct or an interesting case of goal-directed automaticity? Eur. Rev. Soc. Psychol. 1999, 10, 101–134. [Google Scholar] [CrossRef]
- Hall, K. Looking beneath the surface. Manag. Law 2007, 49, 93–105. [Google Scholar] [CrossRef]
- Cavallaro, F.; Sommacal, G.; Božičnik, S.; Klemenčič, M. Combined transport in the Alps: Reasons behind a difficult acceptance and possible solutions. Res. Transp. Bus. Manag. 2020, 35, 100461. [Google Scholar] [CrossRef]
- Chira, I.; Adams, M.; Thornton, B. Behavioral bias within the decision making process. J. Bus. Econ. Res. 2011, 6, 11–20. [Google Scholar] [CrossRef]
- Brown, A.L.; Kagel, J.H. Behavior in a simplified stock market: The status quo bias, the disposition effect and the ostrich effect. Ann. Financ. 2009, 5, 1–14. [Google Scholar] [CrossRef]
- ÖBB. Pünktlichkeitsstatistik: Aktuelle Informationen zur Pünktlichkeit der Nah- und Fernverkehrszüge. Available online: https://www.oebb.at/de/rechtliches/puenktlichkeit (accessed on 8 March 2021).
- Sapadin, L. The Anchoring Effect: How It Impacts Your Everyday Life. Available online: https://psychcentral.com/blog/the-anchoring-effect-how-it-impacts-your-everyday-life#1 (accessed on 6 February 2021).
- Arlinghaus, J.C.; Zimmermann, M.; Zahner, M. The influence of cognitive biases on supply chain risk management in the context of digitalization projects. In Dynamics in Logistics; Freitag, M., Haasis, H.-D., Kotzab, H., Pannek, J., Eds.; Springer International Publishing: Cham, Switzerland, 2020; pp. 137–147. ISBN 978-3-030-44782-3. [Google Scholar]
- Larrick, R.P. Debiasing. In Blackwell Handbook of Judgment and Decision Making, 1st ed.; Koehler, D.J., Ed.; Blackwell Publ.: Malden, MA, USA, 2004; pp. 316–337. ISBN 978-1-4051-0746-4. [Google Scholar]
- Markvica, K.; Millonig, A.; Haufe, N.; Leodolter, M. Promoting active mobility behavior by addressing information target groups: The case of Austria. J. Transp. Geogr. 2020, 83, 102664. [Google Scholar] [CrossRef]
- Hong, J. Transport and the location of foreign logistics firms: The Chinese experience. Transp. Res. Part A Policy Pract. 2007, 41, 597–609. [Google Scholar] [CrossRef]
- Eden, A.; Unger, C.; Acworth, W.; Wilkening, K.; Haug, C. Benefits of Emissions Trading: Taking Stock of the Impacts of Emissions Trading Systems Worldwide; International Carbon Action Partnership (ICAP): Berlin, Germany, 2018. [Google Scholar]
- Opel, O.; Schomerus, T. Nachhaltige Mobilität: Eine Autofreie Zukunft Ist Machbar; Leuphana Universität Lüneburg: Lüneburg, Germany, 2014. [Google Scholar]
- Forsyth, A.; Krizek, K.J. Promoting walking and bicycling: Assessing the evidence to assist planners. Built Environ. 2010, 36, 429–446. [Google Scholar] [CrossRef]
- Bird, E.L.; Baker, G.; Mutrie, N.; Ogilvie, D.; Sahlqvist, S.; Powell, J. Behavior change techniques used to promote walking and cycling: A systematic review. Health Psychol. 2013, 32, 829–838. [Google Scholar] [CrossRef]
- Fernández Vázquez-Noguerol, M.; González-Boubeta, I.; Domínguez-Caamaño, P.; Prado-Prado, J.C. Best practices in road transport: An exploratory study. J. Ind. Eng. Manag. 2018, 11, 250–261. [Google Scholar] [CrossRef]
- Jensen, A.F.; Thorhauge, M.; de Jong, G.; Rich, J.; Dekker, T.; Johnson, D.; Cabral, M.O.; Bates, J.; Nielsen, O.A. A disaggregate freight transport chain choice model for Europe. Transp. Res. Part E Logist. Transp. Rev. 2019, 121, 43–62. [Google Scholar] [CrossRef]
- Piendl, R.; Liedtke, G.; Matteis, T. A logit model for shipment size choice with latent classes—Empirical findings for Germany. Transp. Res. Part A Policy Pract. 2017, 102, 188–201. [Google Scholar] [CrossRef][Green Version]
- Olkhova, M.; Davidich, Y.; Roslavtsev, D.; Davidich, N. The efficiency of transportating perishable goods by road and rail. Transp. Probl. 2018, 12, 37–50. [Google Scholar] [CrossRef][Green Version]
- Nealer, R.; Matthews, H.S.; Hendrickson, C. Assessing the energy and greenhouse gas emissions mitigation effectiveness of potential US modal freight policies. Transp. Res. Part A Policy Pract. 2012, 46, 588–601. [Google Scholar] [CrossRef]
- Holguín-Veras, J.; Xu, N.; de Jong, G.; Maurer, H. An experimental economics investigation of shipper-carrier interactions in the choice of mode and shipment size in freight transport. Netw. Spat. Econ. 2011, 11, 509–532. [Google Scholar] [CrossRef]
- Hwang, T.; Ouyang, Y. Freight shipment modal split and its environmental impacts: An exploratory study. J. Air Waste Manag. Assoc. 2014, 64, 2–12. [Google Scholar] [CrossRef] [PubMed]
- Drewello, H.; Huschebeck, M.; Schick, N. Bottlenecks and regional economic impact: Simulations with the CODE24 transport model. In Integrated Spatial and Transport Infrastructure Development; Drewello, H., Scholl, B., Eds.; Springer International Publishing: Cham, Switzerland, 2016; pp. 117–131. ISBN 978-3-319-15707-8. [Google Scholar]
- Alekseychik, T.; Bogachev, T.; Bogachev, V.; Bruhanova, N. The choice of transport for freight and passenger traffic in the region, using econometric and fuzzy modeling. Procedia Comput. Sci. 2017, 120, 830–834. [Google Scholar] [CrossRef]
- Behrends, S. The modal shift potential of intermodal line-trains from a haulier’s perspective: Drivers and barriers in the mode choice process. World Rev. Intermodal Transp. Res. 2015, 5, 369–386. [Google Scholar] [CrossRef]
- Regmi, M.B.; Hanaoka, S. Assessment of modal shift and emissions along a freight transport corridor between Laos and Thailand. Int. J. Sustain. Transp. 2015, 9, 192–202. [Google Scholar] [CrossRef]
- Jiang, X.; Fan, H.; Luo, M.; Xu, Z. Strategic port competition in multimodal network development considering shippers’ choice. Transp. Policy 2020, 90, 68–89. [Google Scholar] [CrossRef]
- Teye, C.; Bell, M.G.H.; Bliemer, M.C.J. Locating urban and regional container terminals in a competitive environment: An entropy maximising approach. Transp. Res. Part B Methodol. 2018, 117, 971–985. [Google Scholar] [CrossRef]
- Tapia, R.J.; dos Santos Senna, L.A.; Larranaga, A.M.; Cybis, H.B.B. Joint mode and port choice for soy production in Buenos Aires province, Argentina. Transp. Res. Part E Logist. Transp. Rev. 2019, 121, 100–118. [Google Scholar] [CrossRef]
- Zubkov, V.; Sirina, N. Optimization model of the transport and production cycle in international cargo transportation. In International Scientific Conference Energy Management of Municipal Facilities and Sustainable Energy Technologies EMMFT 2019; Murgul, V., Pukhkal, V., Eds.; Springer International Publishing: Cham, Switzerland, 2021; pp. 219–228. ISBN 978-3-030-57449-9. [Google Scholar]
- Liu, D.; Zhao, S.; Liu, J. The impact of value of time on mode choice of freight intermodal transport. In Proceedings of the IEEE International Conference on Management of Innovation and Technology (ICMIT), Bali, Indonesia, 11–13 June 2012; IEEE: Piscataway, NJ, USA, 2012; pp. 179–184, ISBN 978-1-4673-0110-7. [Google Scholar]
- Šimeček, M.; Dufek, J. A freight modal shift model for Slovakia. Transp. Res. Procedia 2016, 14, 2814–2819. [Google Scholar] [CrossRef]
- Crespo-Pereira, D.; Rios-Prado, R.; de Gregorio-Vicente, O. Mode choice modelling for the assessment of an international railway corridor. In Proceedings of the International Conference on Harbor Maritime and Multimodal Logistics M&S, Bordeaux, France, 10–12 September 2014; Bruzzone, A.G., Merkuryev, Y., Eds.; DIME Universita: Genova, Italy, 2014; pp. 188–193. [Google Scholar]
- Truschkin, E.; Elbert, R. Horizontal transshipment technologies as enablers of combined transport: Impact of transport policies on the modal split. Transp. Res. Part A Policy Pract. 2013, 49, 91–109. [Google Scholar] [CrossRef]
- Rich, J.; Kveiborg, O.; Hansen, C.O. On structural inelasticity of modal substitution in freight transport. J. Transp. Geogr. 2011, 19, 134–146. [Google Scholar] [CrossRef]
- Tapia, R.J.; de Jong, G.; Larranaga, A.M.; Bettella Cybis, H.B. Application of MDCEV to infrastructure planning in regional freight transport. Transp. Res. Part A Policy Pract. 2020, 133, 255–271. [Google Scholar] [CrossRef]
- Harrod, S.S. Introduction to the technology, applications, and modal choice of land transport. In Sustainable Transportation and Smart Logistics; Elsevier: Amsterdam, The Netherlands, 2019; pp. 25–64. ISBN 9780128142424. [Google Scholar]
- Combes, F.; Tavasszy, L.A. Inventory theory, mode choice and network structure in freight transport. Eur. J. Transp. Infrastruct. Res. 2016, 16, 38–52. [Google Scholar]
- Zgonc, B.; Tekavčič, M.; Jakšič, M. The impact of distance on mode choice in freight transport. Eur. Transp. Res. Rev. 2019, 11, 10. [Google Scholar] [CrossRef]
- Arunotayanun, K.; Polak, J.W. Taste heterogeneity and market segmentation in freight shippers’ mode choice behaviour. Transp. Res. Part E Logist. Transp. Rev. 2011, 47, 138–148. [Google Scholar] [CrossRef]
- Gohari, A.; Matori, A.N.; Yusof, K.W.; Toloue, I.; Myint, K.C.; Sholagberu, A.T. Route selection and trade-offs evaluation of the intermodal freight transportation. J. Eng. Sci. Technol. 2018, 13, 1451–1466. [Google Scholar]
- Herron, D.P. The use of computers in physical distribution management. Int. J. Phys. Distrib. Mater. Manag. 1980, 10, 479–506. [Google Scholar] [CrossRef]
- Van Fan, Y.; Perry, S.; Klemeš, J.J.; Lee, C.T. A review on air emissions assessment: Transportation. J. Clean. Prod. 2018, 194, 673–684. [Google Scholar] [CrossRef]
- López-Navarro, M. Environmental factors and intermodal freight transportation: Analysis of the decision bases in the case of Spanish Motorways of the Sea. Sustainability 2014, 6, 1544–1566. [Google Scholar] [CrossRef]
- Khakdaman, M.; Rezaei, J.; Tavasszy, L.A. Shippers’ willingness to delegate modal control in freight transportation. Transp. Res. Part E Logist. Transp. Rev. 2020, 141, 102027. [Google Scholar] [CrossRef]
- Li, Z.; Hensher, D. Accommodating risk attitudes in freight transport behaviour research. Transp. Rev. 2012, 32, 221–239. [Google Scholar] [CrossRef]
- Puckett, S.M.; Hensher, D.A.; Brooks, M.R.; Trifts, V. Preferences for alternative short sea shipping opportunities. Transp. Res. Part E Logist. Transp. Rev. 2011, 47, 182–189. [Google Scholar] [CrossRef]
- Arencibia, A.I.; Feo-Valero, M.; García-Menéndez, L.; Román, C. Modelling mode choice for freight transport using advanced choice experiments. Transp. Res. Part A Policy Pract. 2015, 75, 252–267. [Google Scholar] [CrossRef]
- Larranaga, A.M.; Arellana, J.; Senna, L.A. Encouraging intermodality: A stated preference analysis of freight mode choice in Rio Grande do Sul. Transp. Res. Part A Policy Pract. 2017, 102, 202–211. [Google Scholar] [CrossRef]
- Stock, J.R. The energy/ecology impacts on distribution. Int. J. Phys. Distrib. Mater. Manag. 1978, 8, 247–283. [Google Scholar] [CrossRef]
- Gohari, A.; Matori, N.; Wan Yusof, K.; Toloue, I.; Cho Myint, K. Effects of the fuel price increase on the operating cost of freight transport vehicles. E3S Web Conf. 2018, 34, 1022. [Google Scholar] [CrossRef]
- Zis, T.; Psaraftis, H.N. The implications of the new sulphur limits on the European Ro-Ro sector. Transp. Res. Part D Transp. Environ. 2017, 52, 185–201. [Google Scholar] [CrossRef]
- Vierth, I.; Sowa, V.; Cullinane, K. Evaluating the external costs of a modal shift from rail to sea. Eur. J. Transp. Infrastruct. Res. 2019, 19, 60–76. [Google Scholar] [CrossRef]
- Jugovic, T.P.; Vukic, L.; Jugovic, A. Current carbon tax role in the choice of ecologically more acceptable transport mode. Eur. Transp. Trasp. Eur. 2018, 67, 6. [Google Scholar]
- Gohari, A.; Nasir Matori, A.; Yusof, K.W.; Toloue, I.; Myint, K.C.; Sholagberu, A.T. Route/Modal choice analysis and tradeoffs evaluation of the intermodal transport network of Peninsular Malaysia. Cogent Eng. 2018, 5, 1436948. [Google Scholar] [CrossRef]
- Rode, C.; Cosmides, L.; Hell, W.; Tooby, J. When and why do people avoid unknown probabilities in decisions under uncertainty? Testing some predictions from optimal foraging theory. Cognition 1999, 72, 269–304. [Google Scholar] [CrossRef]
- Fürst, D. Denkfallen bei Planerischen Abwägungs- und Bewertungsverfahren—Erkenntnisse aus den Kognitionswissenschaften. In Jahrbuch StadtRegion 2015/2016. Schwerpunkt: Planbarkeiten; Othengrafen, F., Schmidt-Lauber, B., Hannemann, C., Pohlan, J., Roost, F., Eds.; Verlag Barbara Budrich: Leverkusen, Germany, 2016; pp. 43–59. ISBN 9783847407867. [Google Scholar]
- Catalogue of Bias Collaboration; Heneghan, C.; Spencer, E.A. Biases of Rhetoric. Available online: https://catalogofbias.org/biases/biases-of-rhetoric (accessed on 10 February 2021).
- Henkel, L.; Mather, M. Memory attributions for choices: How beliefs shape our memories. J. Mem. Lang. 2007, 57, 163–176. [Google Scholar] [CrossRef][Green Version]
- Trompet, M.; Parasram, R.; Anderson, R.J. Benchmarking disaggregate customer satisfaction scores of bus operators in different cities and countries. Transp. Res. Rec. 2013, 2351, 14–22. [Google Scholar] [CrossRef]
- Honda, H. How memory constraints boost the rational use of the familiarity heuristic. Philosophy 2020, 144, 119–142. [Google Scholar]
- Bhat, C.R. Accommodating variations in responsiveness to level-of-service measures in travel mode choice modeling. Transp. Res. Part A Policy Pract. 1998, 32, 495–507. [Google Scholar] [CrossRef]
- De Haas, M.C.; Hoogendoorn, R.G.; Scheepers, C.E.; Hoogendoorn-Lanser, S. Travel mode choice modeling from cross-sectional survey and panel data: The inclusion of initial nonresponse. Transp. Res. Procedia 2018, 32, 268–278. [Google Scholar] [CrossRef]
- Catalogue of Bias Collaboration; Bankhead, C.R.; Spencer, E.A.; Nunan, D. Information Bias. Available online: https://catalogofbias.org/biases/information-bias (accessed on 14 February 2021).
- Catalogue of Bias Collaboration; Brassey, J.; Spencer, E.A.; Heneghan, C. Language Bias. Available online: https://catalogofbias.org/biases/language-bias (accessed on 14 February 2021).
- Catalogue of Bias Collaboration; Mahtani, K.; Spencer, E.A.; Brassey, J. Observer Bias. Available online: https://catalogofbias.org/biases/observer-bias (accessed on 14 February 2021).
- Catalogue of Bias Collaboration; Spencer, E.A.; Brassey, J. Perception Bias. Available online: https://catalogofbias.org/biases/perception-bias (accessed on 14 February 2021).
- Brint, A.; Fry, J. Regional bias when benchmarking services using customer satisfaction scores. Total Qual. Manag. Bus. Excell. 2021, 32, 344–358. [Google Scholar] [CrossRef]
- Jarnebrant, P.; Toubia, O.; Johnson, E. The silver lining effect: Formal analysis and experiments. Manag. Sci. 2009, 55, 1832–1841. [Google Scholar] [CrossRef][Green Version]
- Raue, M.; Schneider, E. Psychological perspectives on perceived safety: Zero-risk bias, feelings and learned carelessness. In Perceived Safety; Raue, M., Streicher, B., Lermer, E., Eds.; Springer International Publishing: Cham, Switzerland, 2019; pp. 61–81. ISBN 978-3-030-11454-1. [Google Scholar]


Publisher’s Note: MDPI stays neutral with regard to jurisdictional claims in published maps and institutional affiliations. |
© 2021 by the authors. Licensee MDPI, Basel, Switzerland. This article is an open access article distributed under the terms and conditions of the Creative Commons Attribution (CC BY) license (https://creativecommons.org/licenses/by/4.0/).