Article

Lockdowns Save People from Air Pollution: Evidence from Daily Global Tropospheric NO2 Satellite Data

Urban Institute, Kyushu University, Fukuoka 819-0395, Japan
*
Author to whom correspondence should be addressed.
Sustainability 2021, 13(21), 11777; https://doi.org/10.3390/su132111777
Submission received: 21 September 2021 / Revised: 12 October 2021 / Accepted: 15 October 2021 / Published: 25 October 2021
(This article belongs to the Special Issue Sustainable Urban Design: Urban Externalities and Land Use Planning)

Abstract

:
Motivated by the global fear of the Coronavirus-19 (COVID-19) pandemic, we investigated whether lockdowns save people from air pollution, notably from Nitrogen Dioxide (NO2). Using daily satellite data from the National Aeronautics and Space Administration (NASA), we first found that the global NO2 tropospheric vertical column density (TVCD) decreased by 16.5% after the Coronavirus-19 (COVID-19) outbreak. Then, we calculated the global health benefits, as the monetized value of life, using the value of a statistical life (VSL). The total global health benefits were approximately 8.73 trillion USD, accounting for 10% of the global GDP; such benefits would be the largest in China, followed by the United States, Japan and Germany. Our results suggest that lockdowns may bring benefits to countries that policy interventions cannot easily bring, thus highlighting the importance of social distancing.

1. Introduction

With the fear of the Coronavirus-19 (COVID-19) pandemic, which has resulted in a tremendous number of deaths and infections around the world, countries have implemented lockdowns, including social distancing, school closures, and self-quarantine, which have halted economic activities. While substantial economic losses have resulted from these lockdowns, there has also been a significant level of air quality improvement, including the reduction of Nitrogen Oxides (NOx = NO + NO2). Nitrogen Oxides are formed during combustion processes (e.g., automobiles, power stations, and factories), and Nitrogen Dioxide (NO2) is the main precursor to tropospheric ozone and nitrate aerosols, a component of PM2.5. Here, NO2 meets the criterion for pollutants by the U.S. Environmental Protection Agency (EPA) because of its negative impact on human health and the environment. Reduced NO2 pollution would decrease the number of people suffering from air-pollution-related diseases, including cardiovascular diseases, stroke, asthma, and respiratory diseases.
First, we descriptively examine whether NO2 tropospheric vertical column density (TVCD) has been decreased during COVID-19. Previous works show that either NOx, or NO2 pollution (either TVCD or emissions) has decreased due to lockdowns in the time of COVID-19 [1] mention that the NOx emissions declined by 30% after the COVID-19 outbreak [2] also state that the NO2 TVCD decreased in China after the outbreak occurred [3] argue that there was a 48% decline in tropospheric NO2 around the 2020 Lunar New Year in China.
Following previous works, reducing NO2 pollutions would decrease the deaths from air-pollution-related diseases. For example, reduced NO2 pollution would decrease the mortality associated with respiratory diseases such as virus-induced asthma [4] or cardiovascular diseases [5]. These works motivate our study to compute ‘global health benefits’, which is the monetized value of small changes in the mortality rate. This value is aggregated to express the value related to one death in a population [6]. Hence, we acknowledge that health benefits are linked to surface concentrations of pollutants, whereas the satellite measures a column amount up to about a 10 km altitude. However, in the literature there are indications that surface and column observations show the same kind of COVID-19 related trends as specified in [2,3]. Therefore, in this study, we use a satellite observation.
We compute the global health benefit in the context of air pollution reduction during the COVID-19 pandemic. We begin by investigating the relationship between NO2 TVCD and mortality data on air-pollution-related diseases. We focus on whether mortality as a result of air-pollution-related diseases has dropped during COVID-19. Then, we calculate the global health benefits of countries and aggregate to the world-scale. The monetized value of life is a crucial parameter for policy evaluation in the global context. While there are many studies of the relationship between NO2 and COVID-19, and of NO2 with air-pollution-related diseases, few studies look at whether reduced NO2 as a result of COVID-19 has saved people from air-pollution-related diseases. [7] report that NO2 emissions have decreased and that health benefits have increased in China. In that sense, our study is closely related to that of [7], as we also investigate the health benefits of reduced NO2. Hence, we further expand this research, as we are considering the global scale given that COVID-19 is a worldwide pandemic.
To be specific, we calculate the global health benefits by investigating the relationship between NO2 and mortality data on air-pollution-related diseases, including cardiovascular disease, cancer, diabetes, and chronic respiratory diseases, provided by the World Health Organization. We use statistical analysis to compute the coefficients. Then, using the estimated coefficients, we compute the changed mortality rate of air-pollution diseases based on age group, and we adjust for the age distribution of each country by referring to World Bank data. We then compute the global health benefit using age-varying and country-specific estimates of the value of a statistical life (VSL), referring to [8]. We calculate the global health benefit of January 2020, April 2020, and July 2020. The aim is to determine the impacts of lockdowns of diverse countries, which vary over time. China, the country where the pandemic originated, was the first country to enforce the quarantine and lockdown of cities and later of whole provinces, starting at the end of January in Hubei. Following China, most countries implemented a lockdown starting around March, including the US (15 March 2020) and India (25 March 2020). Then, some countries initiated lockdowns around July; for example, Australia began its lockdown on 8 July 2020 (Melbourne), and Ireland’s lockdown started on 7 August 2020.
On the other hand, some countries have not implemented a lockdown; South Korea, Japan and Taiwan are countries without lockdowns that rely instead on mobile phone record tracking. Even though Japan’s government advocates lockdowns, they were not required. The government of Sweden, following the idea of herd immunity, has allowed restaurants, primary schools, and kindergartens to be open, while keeping universities and high schools closed. On average, such lockdowns lasts 1–2 months. Subsequently, countries turn to low-containment lockdowns that do not require universities, high schools, and restaurants to close completely. Thus, the health benefit of NO2 reduction due to lockdowns varies depending on the country, timing, and stringency of the lockdown.
This study contributes by focusing on the financial benefits of lockdowns in times of pandemic, particularly looking into NO2, which represents the emissions from transportation and factories. Thus, our result contributes by determining the financial benefits of lockdowns of cities. Previous works were mainly focused on the mortality benefits of social distancing, which includes social distancing, home quarantine, school closures, and case isolation. Numerous works have determined that social distancing can save many people, as herd immunity, a form of ‘non-intervention’, would increase infections [9] noted that lockdowns significantly reduce transmission by 80%. Some works look at the health benefits social distancing brings by using the value of statistical life (VSL) [10] mention that social distancing alone accounts for more than 50% of the global health benefits, which exceeds 40.76 trillion USD globally [11] analyze the impact of lockdown on the world economy. Other works show the effects of social distancing on economic activities [12] show that social distancing may provide an economic benefit. These laws reduce the low-risk population’s economic activity; thus, they can protect those with the most significant mortality risk from also bearing a tremendous burden through reduced spending. In contrast, ref. [13] argue that the expected cost of COVID-19 in the US is substantial, as it ranges from $12,700 in the laissez-faire equilibrium and $8100 per person. Hence, our essential contribution is that we offer quantitative computing estimates of social distancing effects, which is an additional benefit of social distancing.
This study is structured as follows. Section 2 covers materials and methods. Section 3 presents results, and Section 4 discusses our findings and concludes our paper.

2. Materials and Methods

We employed satellite data of daily NO2 TVCD trends from NASA TROPOMI data, retrieved from 1 January 2015 to 30 July 2020. We acquired data from NASA’s Earth Observing System Aura OMI science team at Goddard Space Flight Center, which estimates NO2 column densities from multiple satellite instruments. TROPOMI is a UV-VIS-near infrared (IR) short-wave system on board a 2017 launched European Copernicus Sentinel-5 Precursor satellite, and this data show the Earth radiance and spectra of solar irradiance with approximately 0.5 nm of spectral resolution. The ratio of radiance to wavelengths between 400 and 496 nm is used for the recovery of NO2 TVCD. The ground footprint size for TROPOMI is 3.5 km by 5.5 km (3.5 km by 7 km before August 2019). TROPOMI data are measured daily or twice daily. For TROPOMI, we used only observations with quality assurance values > 0.9.
The units of TVCD are molecules per square centimeter or molec./cm2. Because these numbers are large, they may be divided by 1015. Units may also be given as moles per unit area. NASA retrieves NO2 TVCD from backscattered solar radiation. According to the dataset, the NO2 TVCD has decreased by approximately 16.5% relative to the global average. Figure 1 shows the global trends of NO2 TVCD globally, and we selected China and the US, with the highest GDP, for reference. The upper column of Figure 1 shows the average monthly NO2 TVCD (molec./cm2) from the years 2015 to 2019 and from January to July. The lower column of Figure 1 shows the average monthly NO2 TVCD (molec./cm2) from January to July of 2020.
First, we note that both columns’ decreasing trend, from January to July, is likely due to the seasonal cycle (See Appendix A Figure A1 and Figure A2 for detail). It is important to realize that the NO2 TVCD has a strong seasonal cycle, with a peak in winter and the lowest values in summer, as in [14]. This cycle is related mainly to more active chemistry in the summer atmosphere, leading to shorter residence times of NO2 and lower concentrations. Therefore, focusing on December 2019 (when the outbreak started) to July 2020 would reflect this seasonal effect; that is, the decreasing trend would mostly have derived from the seasonal variations. The COVID-19–related effects are subtler and are most prominent in the substantial dip in China’s curve in February and subtler curvatures in the curves for the other countries in March–April. In this sense, we find a large decline in Chinese NO2 TVCD from December 2019 to February 2020, when the lockdown in the city of Hubei started, and then the level decreased gradually. Other countries, including the US, experienced a gradual reduction in NO2, as is shown in Figure 1; the reduced amount is smaller than 2015–2019. The worldwide figures, however, did not show a significant decrease in NO2 TVCD, as it increased in some countries, such as Argentina (increased by 45.92% in July 2020 compared to December 2019), Bolivia (increased by 56.39%), and Brazil (increased by 36.83%).
For the mortality of air-pollution-related diseases, we use data from the World Health Organization on “Probability of dying between age 30 and exact age 70 from any cardiovascular disease, cancer, diabetes, or chronic respiratory disease”. In this dataset, the probability of death between the exact age of 30 and the exact age of 70 was calculated using cause-specific mortality rates in each 5-year age group and standard life table methods; the data are the latest, published in 2016. These estimates represent the best WHO estimates, computed using standard categories, definitions, and methods to ensure cross-country comparability, and may not be the same as official national estimates. Finally, for the macroeconomic variables, including GDP, we refer to the World Bank dataset. Table 1 shows the summary statistics for our data.
We begin by investigating the relationship between NO2 TVCD and air-pollution-related disease mortality rates of country i at time t:
Mortality it = α 1 N O 2 i t + α 2 X i t + ξ t + ϵ i t
where mortality is the mortality rate of air-pollution-related diseases, N O 2 i t is NO2 TVCD, and X i t is a vector of controls including country-specific variables such as GDP, average life expectancy, population and GINI index, which shows wealth distribution across the countries. ξ t refers to the time-fixed effects, including seasonal variations of month and year. Note that the time trends and seasonality affect the NO2 TVCD trends. In this sense, even though simple, our model in Equation (1) would resolve the problems (i.e., misleading results and implications) coming from such seasonality. The estimation results are displayed in Table 2. Note that the dependent variable is a mortality rate due to air-pollution-related diseases. Model (1) excludes macroeconomic variables (GDP per capita, population (million), life expectancy and GNI index) as controls, while Model (2) includes them. Finally, Model (3) shows the result when controlling for the time trends and seasonality of year and month. As including macroeconomic variables would control for differences by country, we focus on Model (3). According to Model (3), a 1% increase in NO2 would increase mortality by 0.006%.

3. Results

Our findings are simple and worth highlighting; mostly, earlier and stronger lockdowns increase global health benefits, as we confirmed that global health benefits generally increased from January to April, and April to July. Our results show that the global health benefit would be 4.14 trillion USD in January, 5.34 trillion USD in April, and 8.73 trillion USD in July. Countries with greater growth in benefits were the same as those ranked as having benefitted the most, thus reaffirming the importance of early lockdowns. Given that world GDP in 2019 was 87.70 trillion USD (World Bank), our estimated benefit for July would account for approximately 10% of the global GDP.
Figure 2 shows the global health benefit expressed in a world map for July 2020. With respect to individual countries, China shows the highest benefit of 2.69 trillion USD in July, followed by the United States (2.52 trillion USD), India (0.84 trillion USD), Japan (0.46 trillion USD) and Germany (0.41 trillion USD). On the other hand, some countries have ‘global health loss’, which is a negative value of global health benefits; these are mostly countries who did not have long-term lockdowns or countries that implemented lockdowns later than other countries. For example, Brazil (−0.5 trillion USD), South Africa (−0.3 trillion USD) and Australia (−0.26 trillion USD) show negative global health benefits.
Figure covers the period from January 2020 instead of from December 2019, as the COVID-19 outbreak generally started around January 2020.

4. Discussion and Conclusions

We estimated the global health benefits using daily NO2 TVCD trends. We found evidence indicating that (i) NO2 TVCD declined during the COVID-19 pandemic by 16.5%; (ii) lower NO2 TVCD decreased air-pollution-related mortality rates; (iii) the global health benefit was 8.73 trillion USD, which is approximately 10% of the world GDP; and (iv) benefits were greater in countries with earlier and stronger lockdowns.
Such vast benefits cannot be easily derived from policy interventions, which implies that lockdowns have substantial economic benefits. Contrary to the effects of COVID-19, which primarily affects disadvantaged populations [15], the global health benefit of lockdowns is not disproportionately distributed according to country, region and ethnic group. The global health benefits estimated from our results are evenly distributed and depend only on whether the country had a strict lockdown that started early. Therefore, NO2 reductions mostly come from behavioral changes, as mentioned by [16]; namely, behavioral changes among the public in response to the epidemic and containment policies became effective despite the initial increase in confirmed cases.
Our findings therefore provide a guideline for global health policy. Keeping the public, particularly disadvantaged people, informed about the importance of the behavioral changes necessary for lockdowns, social distancing and handwashing with soap would further increase global health benefits, as it can also prevent cholera, diarrhea, dysentery, typhoid and soil-transmitted helminth infections along with COVID-19 (see [17]). In this sense, our estimation is likely to be a lower bound, as lockdowns can prevent COVID-19 cases and reduce air pollution and mortality.
Our study provides paths for future research. First, due to the lack of data on the number of cases of infection related to air pollution, we examined the mortality rate while focusing less on the number of patients suffering from air-pollution-related diseases. Reduced NO2 TVCD would decrease the number of infected patients, which would further reduce mortality. Second, our data cover mortality data for the age group between 30 and 70 years. As mentioned by [4], NO2 affects children more severely, and a reduction would result in greater global health benefits. Third, future research can consider the geographical characteristics of countries that might affect NO2 TVCD. For example, without any lockdown, Japan and Sweden showed a positive yet small reduction, while, overall, Latin American and African countries exhibited negative health benefits, with some countries (i.e., Brazil) starting lockdowns at the city level. These examples imply that, with lockdowns, geographical characteristics might still affect NO2 TVCD. The increase of NO2 can be also due to vehicle [18] and airplane [19] usage; therefore, considering these elements is important for future research.
As this study focuses on NO2, we employed a simple model using NO2, because COVID-19 measures led to reductions in specific sectors, such as traffic, aviation and industry, affecting NO2 more than other substances. Hence, ozone has been reported to increase in periods/countries (China, February), while NO2 decreased. NO2 is used as an indicator of the entire cocktail of pollutants. Therefore, including other pollutants such as aerosols (PM10, PM2.5 at the surface), ozone and organic compounds would provide more fruitful implications. Along the same line, updating the NO2 dataset would also to its study.
Our result does not indicate causality between lockdowns, air pollution and mortality effects. The main reason for our inability to demonstrate causality is that we cannot determine whether lockdown and air pollution prevented death during the pandemic. Future research should focus on individual patient data to address causality where available.
Our study has some limitations. First, because the NO2 TVCD and NOx emission relationships are not strictly linear, the NO2 TVCD analysis provides a qualitative description of NOx emission changes. Accurate quantification of changes in NOx emissions is left for future research. Second, we note that predicting mortality a few months after the outbreak of COVID-19 does involve uncertainty. Plus, due to the data limitation, we were not able to include the impact of NO2 on children and the elderly. Including them would increase our global health benefits, as children and the elderly are more vulnerable to NO2 pollution. Third, also due to data unavailability, we focused on NO2 though there are other pollutants that also affect health, such as O3, SO2, climatic conditions and the epidemic itself. However, as NO2 can represent traffic emissions, it thus represents the degree of urban blockade of cities. Therefore, we believe that this research will provide researchers and policymakers with policy guidance and insight. Obtaining more robust estimates with more data and over an extended period in future studies would improve the numerical precision of this research.

Author Contributions

S.Y. conducted the analysis and wrote the manuscript. S.M. conceived of the study and edited the manuscript. All authors have read and agreed to the published version of the manuscript.

Funding

This research is supported by a grant-in-aid from the Ministry of Education, Culture, Sports, Science and Technology (MEXT) in Japan (20H00648), a grant from the Ministry of the Environment, Japan (JPMEERF20201001), and the 4th Environmental Economics Research Fund of the Ministry of the Environment, Japan.

Institutional Review Board Statement

Not applicable.

Informed Consent Statement

Not applicable.

Conflicts of Interest

The authors declare that they have no known competing financial interests or personal relationships that could have appeared to influence the work reported in this paper.

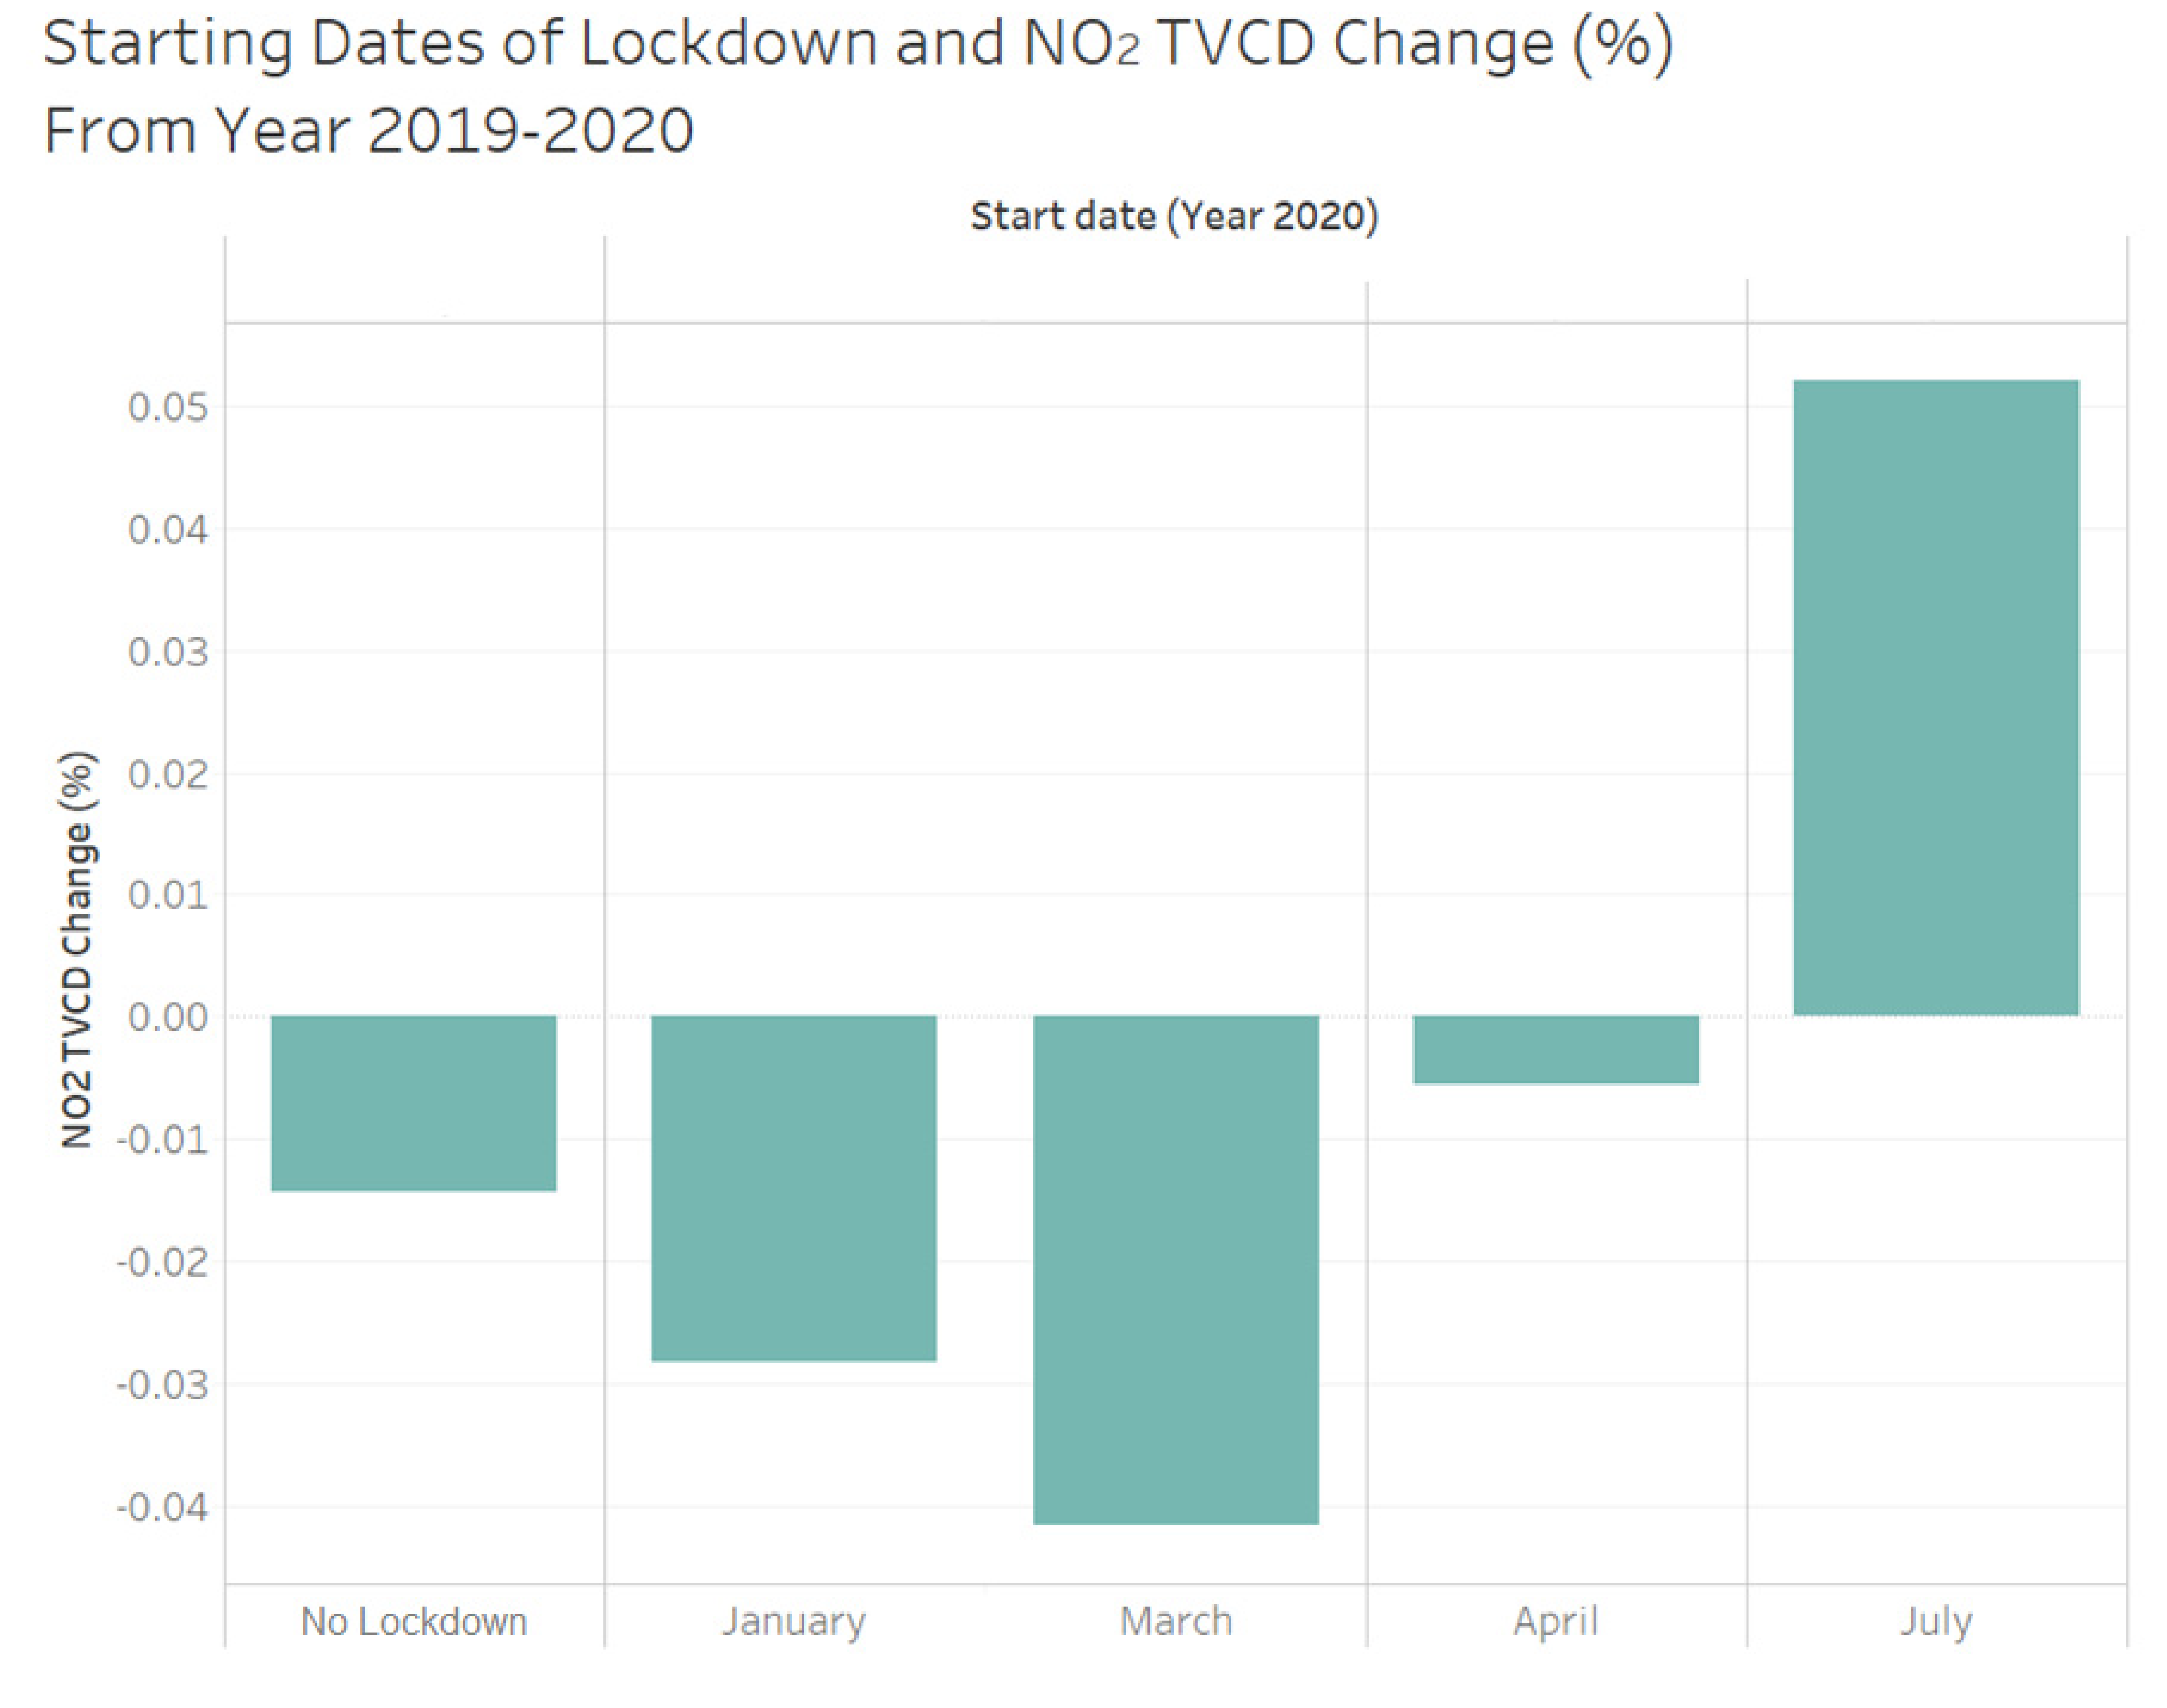
Appendix A. Reduction of NO2 TVCD and Timing of Lockdowns
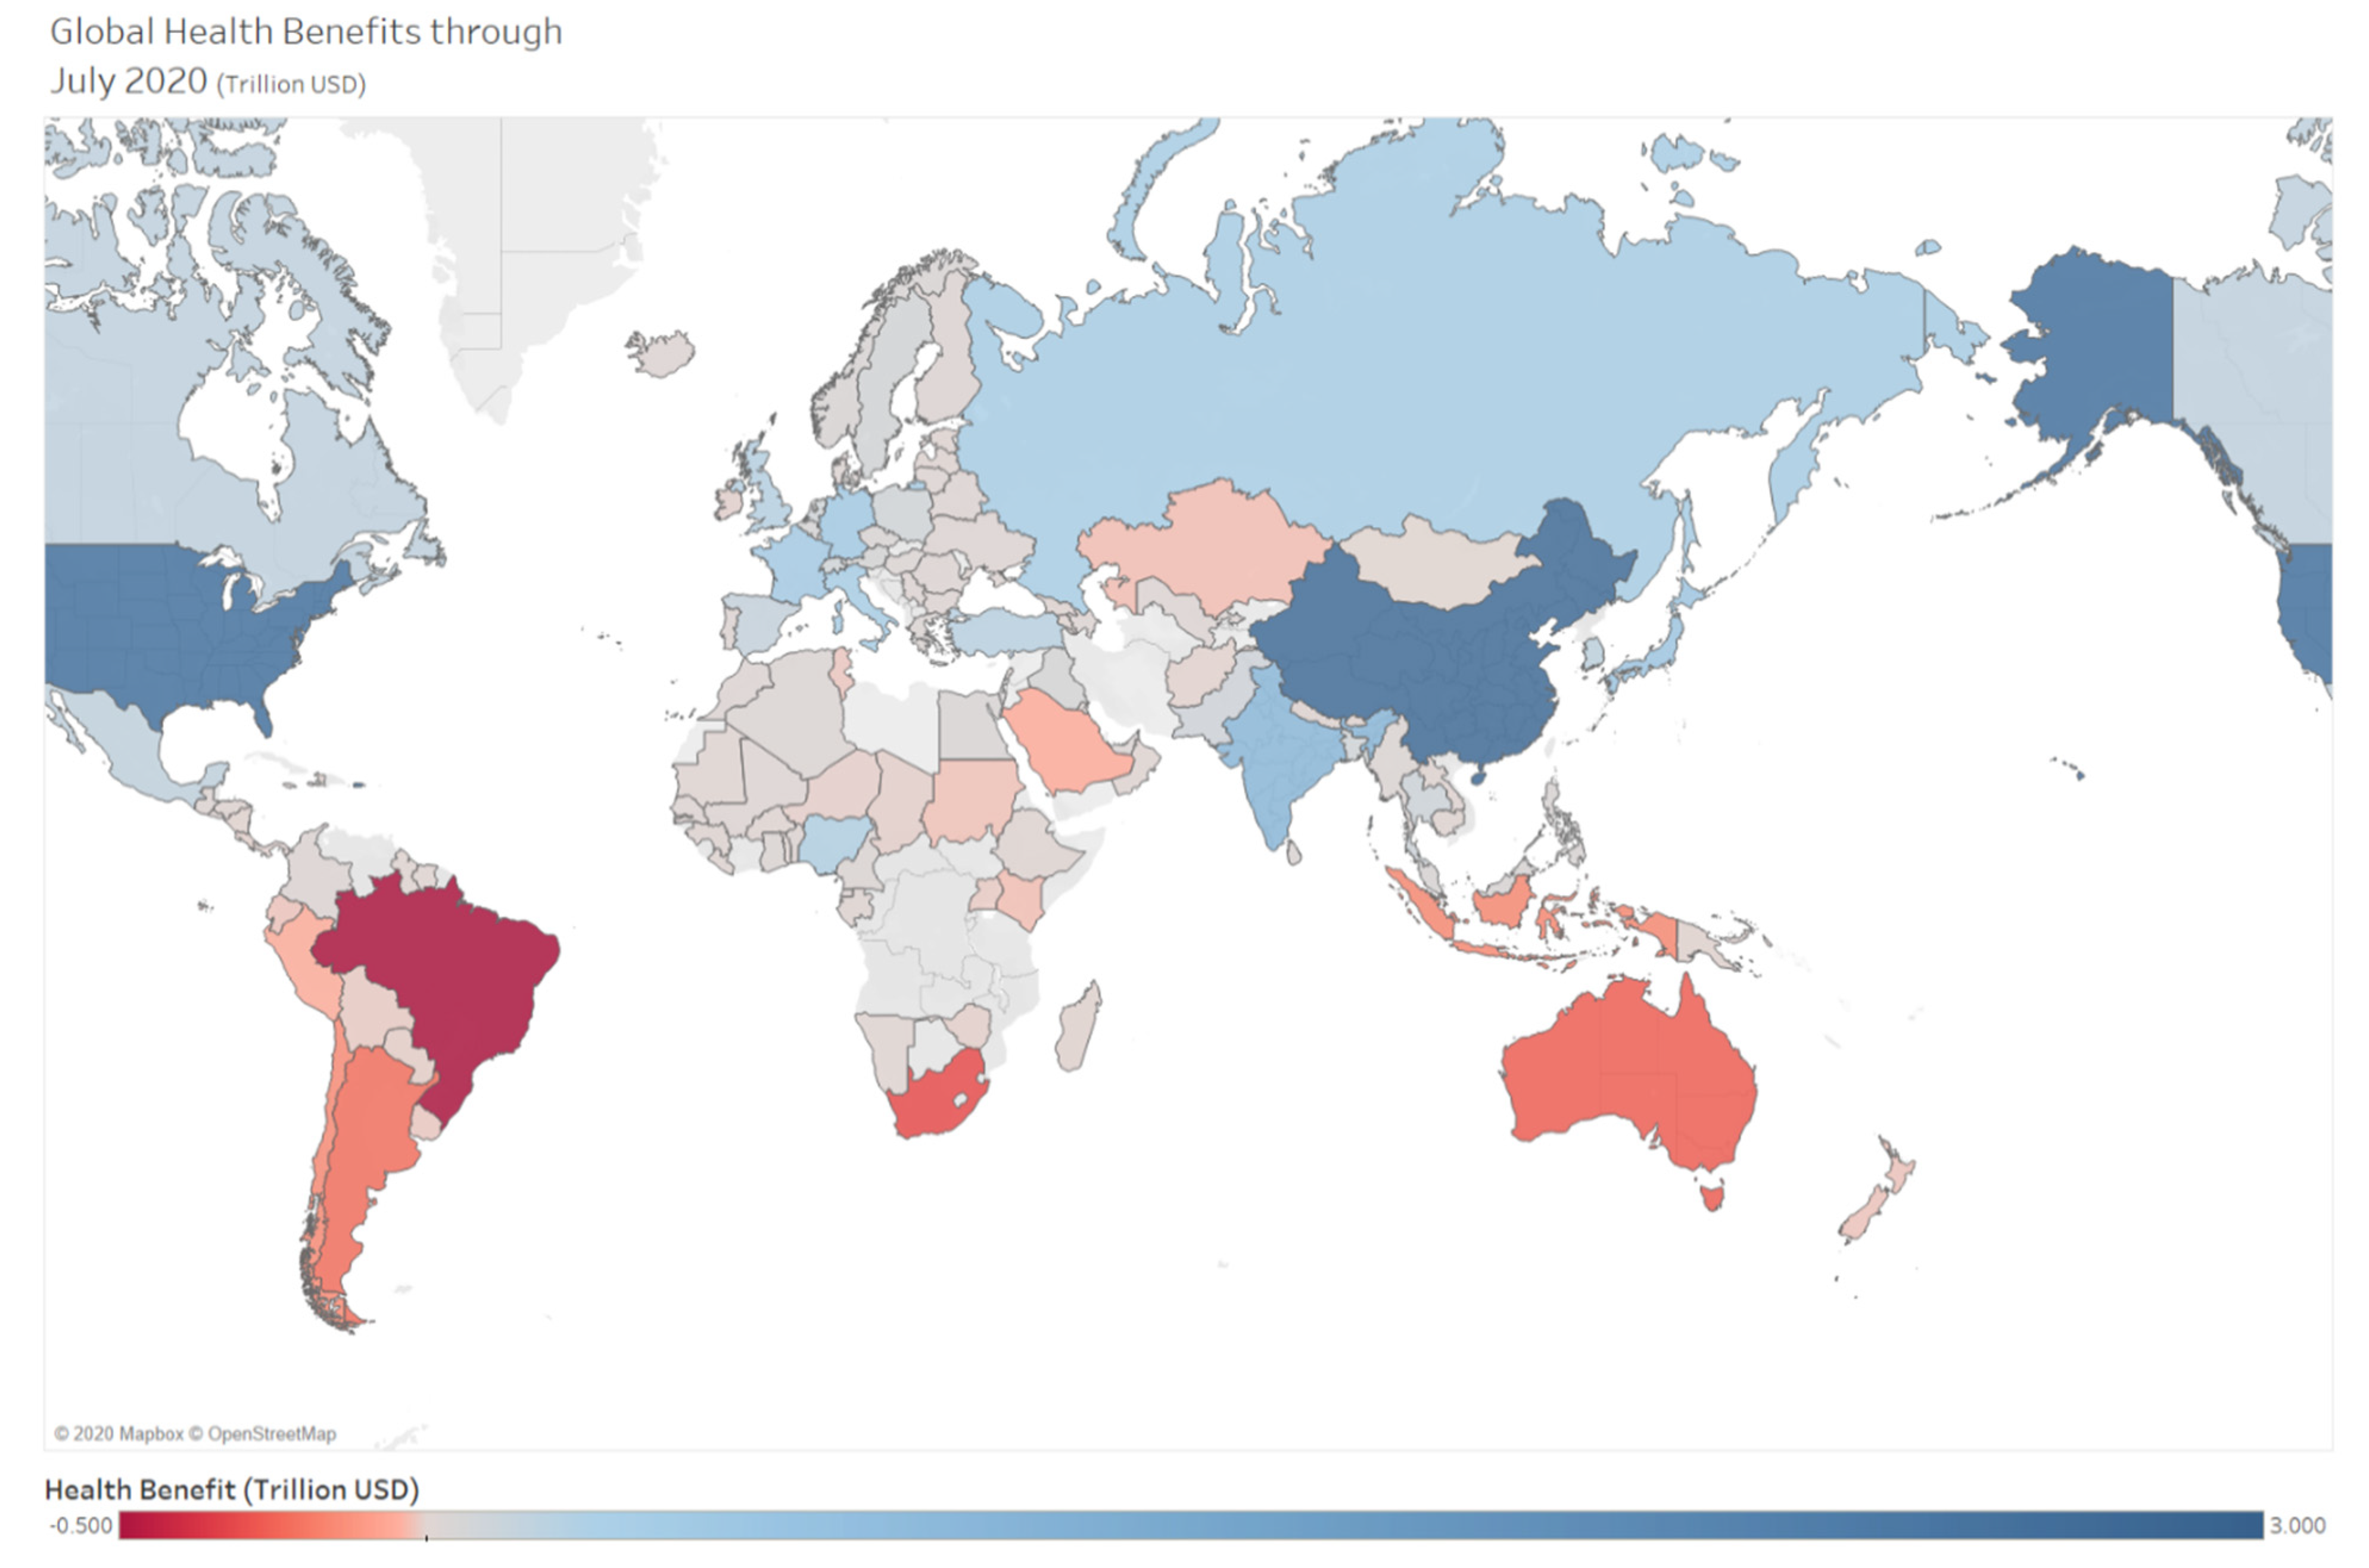
Figure A1 shows the starting dates of lockdowns (by month) of countries with/without lockdowns and corresponding changes in NO2 TVCD. We confirm that earlier lockdowns would result in greater reductions in NO2 TVCD. Figure A2 shows the changes in NO2 TVCD trends for (the rest of) the world from December 2019 to July 2020 for the 10 countries with the highest GDP. A higher (blue) value indicates that NO2 TVCD increased during this period, while a lower (red) value implies that NO2 TVCD decreased.
Figure A1. Comparison of NO2 TVCD changes according to the timing of lockdowns.
Sustainability 13 11777 g0a1
Figure A2. Changes in NO2 TVCD trends for (the rest of) the world from December 2019 to July 2020 for the 10 countries with the highest GDP.
Sustainability 13 11777 g0a2
Table A1. Global health benefits (trillion USD) and changes in mortality (%) in January, April and July 2020 for all countries.
January 2020April 2020July 2020
BenefitChange in MortalityBenefitChange in MortalityBenefitChange in Mortality
Country(Trillion USD)(%)(Trillion USD)(%)(Trillion USD)(%)
Afghanistan−0.001−0.109%−0.002−0.045%−0.003−0.065%
Algeria0.0100.878%0.0140.066%0.0210.095%
Argentina−0.103−9.379%−0.143−0.244%−0.216−0.358%
Armenia0.000−0.011%0.000−0.019%0.000−0.027%
Australia−0.127−11.917%−0.165−0.139%−0.258−0.203%
Austria0.0262.434%0.0340.132%0.0540.191%
Azerbaijan0.0070.688%0.0110.188%0.0150.254%
Bangladesh0.0342.845%0.0480.193%0.0760.309%
Belarus0.0060.539%0.0080.211%0.0120.300%
Belgium0.0242.226%0.0310.086%0.0490.125%
Benin0.0030.253%0.0040.269%0.0060.389%
Bhutan0.0000.010%0.0000.077%0.0000.110%
Bolivia−0.006−0.504%−0.008−0.180%−0.012−0.265%
Brazil−0.243−21.763%−0.331−0.161%−0.507−0.243%
Bulgaria0.0030.250%0.0040.113%0.0060.167%
Burkina Faso0.0010.073%0.0010.056%0.0020.083%
Cambodia0.0020.138%0.0020.105%0.0040.160%
Cameroon0.0121.066%0.0160.313%0.0250.463%
Canada0.0817.507%0.1060.088%0.1670.131%
Chad−0.003−0.312%−0.005−0.212%−0.007−0.300%
Chile−0.068−6.084%−0.094−0.409%−0.145−0.611%
China1.242105.830%1.6340.183%2.6930.306%
Colombia0.0080.729%0.0110.030%0.0170.044%
Costa Rica−0.002−0.177%−0.003−0.058%−0.004−0.084%
Czech Republic0.0131.126%0.0170.135%0.0270.204%
Denmark0.0050.436%0.0060.024%0.0090.034%
Ecuador−0.009−0.784%−0.013−0.103%−0.019−0.150%
Egypt0.0171.570%0.0250.062%0.0360.089%
El Salvador0.0000.013%0.0000.007%0.0000.010%
Equatorial Guinea0.0030.309%0.0040.211%0.0060.282%
Estonia0.0010.138%0.0020.129%0.0030.183%
Ethiopia0.0010.051%0.0010.008%0.0010.013%
Finland0.0090.870%0.0120.069%0.0190.098%
France0.17716.070%0.2300.107%0.3680.163%
Gabon0.0020.231%0.0030.141%0.0050.191%
Gambia0.0000.016%0.0000.159%0.0000.235%
Georgia0.0010.069%0.0010.090%0.0020.129%
Germany0.20118.285%0.2550.108%0.4130.166%
Ghana0.0100.905%0.0140.223%0.0220.344%
Greece0.0110.997%0.0150.103%0.0230.148%
Guatemala0.0040.363%0.0060.065%0.0090.097%
Guinea0.0020.138%0.0020.231%0.0040.358%
Guyana0.000−0.007%0.000−0.028%0.000−0.040%
Haiti0.000−0.040%−0.001−0.052%−0.001−0.076%
Honduras0.0000.031%0.0010.017%0.0010.025%
Hungary0.0100.902%0.0140.163%0.0210.243%
Iceland0.0040.422%0.0060.425%0.0090.595%
India0.38732.992%0.5320.191%0.8440.310%
Indonesia−0.069−6.074%−0.095−0.088%−0.148−0.138%
Iraq0.0312.768%0.0420.130%0.0640.191%
Ireland−0.002−0.195%−0.003−0.012%−0.005−0.019%
Israel0.0151.370%0.0200.060%0.0310.089%
Italy0.14412.957%0.1890.152%0.3020.233%
Jamaica0.0000.005%0.0000.005%0.0000.007%
Japan0.21819.552%0.2830.097%0.4570.152%
Kazakhstan−0.013−1.214%−0.018−0.090%−0.027−0.128%
Kenya−0.012−1.039%−0.017−0.150%−0.026−0.229%
Kuwait0.0070.684%0.0090.068%0.0140.092%
Laos0.0010.111%0.0020.107%0.0030.160%
Latvia0.0020.213%0.0030.171%0.0050.242%
Lebanon0.0050.462%0.0070.125%0.0110.180%
Liberia0.0000.027%0.0000.160%0.0010.243%
Lithuania0.0030.288%0.0040.178%0.0070.258%
Madagascar−0.001−0.068%−0.001−0.066%−0.002−0.099%
Malaysia0.0151.356%0.0210.059%0.0320.088%
Mali0.0020.217%0.0030.140%0.0050.207%
Mauritania0.0000.046%0.0010.083%0.0010.115%
Mexico0.0756.720%0.1030.072%0.1600.109%
Mongolia−0.001−0.049%−0.001−0.062%−0.001−0.087%
Morocco0.0080.687%0.0110.093%0.0170.138%
Myanmar0.0110.966%0.0160.202%0.0240.303%
Namibia0.000−0.037%−0.001−0.032%−0.001−0.045%
Nepal0.0010.102%0.0020.058%0.0030.090%
Netherlands0.0444.054%0.0570.092%0.0900.137%
New Zealand−0.009−0.893%−0.013−0.080%−0.020−0.113%
Nicaragua−0.001−0.059%−0.001−0.063%−0.001−0.090%
Niger−0.003−0.305%−0.005−0.342%−0.007−0.499%
Nigeria0.12211.240%0.1640.190%0.2420.275%
Norway0.0201.983%0.0260.072%0.0390.097%
Oman0.0010.085%0.0010.023%0.0020.032%
Pakistan0.0443.886%0.0620.143%0.0940.218%
Panama−0.001−0.097%−0.001−0.027%−0.002−0.040%
Papua
New Guinea
−0.001−0.089%−0.001−0.051%−0.002−0.074%
Paraguay−0.004−0.312%−0.005−0.138%−0.008−0.207%
Peru−0.023−2.064%−0.033−0.159%−0.050−0.239%
Philippines0.0131.167%0.0180.036%0.0270.053%
Poland0.0413.619%0.0550.166%0.0870.253%
Portugal0.0050.487%0.0070.054%0.0110.079%
Romania0.0080.708%0.0110.082%0.0170.125%
Russia0.15013.510%0.1990.171%0.3100.261%
Saudi Arabia−0.027−2.456%−0.035−0.048%−0.054−0.071%
Senegal0.0030.220%0.0040.148%0.0060.227%
Serbia0.0030.297%0.0050.162%0.0070.241%
Singapore0.0080.729%0.0100.064%0.0160.094%
South Africa−0.148−13.450%−0.197−0.477%−0.302−0.712%
South Korea0.0857.549%0.1120.128%0.1800.200%
Spain0.0645.800%0.0860.096%0.1360.147%
Sri Lanka0.0110.953%0.0160.176%0.0230.260%
Sudan−0.012−1.092%−0.017−0.137%−0.024−0.185%
Suriname0.000−0.022%0.000−0.055%0.000−0.068%
Sweden0.0373.499%0.0490.116%0.0740.164%
Switzerland0.0434.125%0.0550.127%0.0860.180%
Thailand0.0453.926%0.0620.189%0.0980.296%
Togo0.0010.109%0.0020.264%0.0030.387%
Tunisia−0.008−0.711%−0.012−0.271%−0.017−0.380%
Turkey0.0968.610%0.1320.148%0.2010.221%
U.A.E.0.0121.171%0.0160.072%0.0250.102%
Uganda−0.006−0.514%−0.008−0.163%−0.012−0.237%
Ukraine0.0050.409%0.0070.082%0.0100.124%
United Kingdom0.1019.274%0.1310.061%0.2080.093%
United States1.230110.515%1.4880.096%2.5150.156%
Uruguay−0.007−0.672%−0.010−0.209%−0.015−0.295%
Uzbekistan0.0090.819%0.0130.170%0.0190.237%
Zimbabwe−0.003−0.239%−0.004−0.188%−0.006−0.306%
Average0.0363.21%0.0470.047%0.0770.07%
Total4.144 5.340 8.733

References

  1. Forster, P.M.; Forster, H.I.; Evans, M.J.; Gidden, M.J.; Jones, C.D.; Keller, C.A.; LambolliD, R.D.; Le Quéré, C.; Rogelj, J.; Rosen, D.; et al. Current and future global climate impacts resulting from COVID-19. Nat. Clim. Chang. 2020, 10, 913–919. [Google Scholar] [CrossRef]
  2. Le, T.; Wang, Y.; Liu, L.; Yang, J.; Yung, Y.L.; Li, G.; Seinfeld, J.H. Unexpected air pollution with marked emission reductions during the COVID-19 outbreak in China. Science 2020, 369, 702–706. [Google Scholar] [CrossRef] [PubMed]
  3. Liu, F.; Page, A.; Strode, S.A.; Yoshida, Y.; Choi, S.; Zheng, B.; Lamsal, L.N.; Li, C.; Krotkov, N.A.; Eskes, H.; et al. Abrupt decline in tropospheric nitrogen dioxide over China after the outbreak of COVID-19. Sci. Adv. 2020, 6, eabc2992. [Google Scholar] [CrossRef] [PubMed]
  4. Chauhan, A.J.; Inskip, H.M.; Linaker, C.H.; Smith, S.; Schreiber, J.; Johnston, S.L.; Holgate, S.T. Personal exposure to nitrogen dioxide (NO2) and the severity of virus-induced asthma in children. Lancet 2003, 361, 1939–1944. [Google Scholar] [CrossRef]
  5. Duan, Y.; Liu, X.; Li, H.; Yan, S.; Yan, M.; Mang, Y.; Yin, P. Season and temperature modify the short-term effect of nitrogen dioxide on cardiovascular mortality: A time-series study. Lancet 2019, 394, S57. [Google Scholar] [CrossRef]
  6. Viscusi, W.K.; Masterman, C. Income Elasticity and the Global Value of a Statistical Life. J. Benefit-Cost Anal. 2007, 8, 226–250. [Google Scholar] [CrossRef] [Green Version]
  7. Chen, K.; Wang, M.; Huang, C.; Kinney, P.L.; Anastas, P.T. Air pollution reduction and mortality benefit during the COVID-19outbreak in China. Lancet Planet. Health 2020, 4, e210–e212. [Google Scholar]
  8. Murphy, K.; Topel, R. The Value of Health and Longevity. Value Health Longev. 2005, 114, 871. [Google Scholar]
  9. Flaxman, S.; Mishra, S.; Gandy, A.; Unwin, H.J.T.; Mellan, T.A.; Coupland, H.; Whittaker, C.; Zhu, H.; Berah, T.; Eaton, J.W.; et al. Estimating the effects of non-pharmaceutical interventions on COVID-19 in Europe. Nature 2020, 584, 257–261. [Google Scholar] [CrossRef] [PubMed]
  10. Yoo†, S.; Managi†, S. Global mortality benefits of COVID-19 action. Technol. Forecast. Soc. Chang. 2020, 160, 120231. [Google Scholar] [CrossRef] [PubMed]
  11. Mandel, A.; Veetil, V. The Economic Cost of COVID Lockdowns: An Out-of-Equilibrium Analysis. Econ. Disasters Clim. Chang. 2020, 4, 431–451. [Google Scholar] [CrossRef] [PubMed]
  12. Sheridan, A.; Andersen, A.L.; Hansen, E.T.; Johannesen, N. Social distancing laws cause only small losses of economic ac-tivity during the COVID-19 pandemic in Scandinavia. Proc. Natl. Acad. Sci. USA 2020, 117, 20468–20473. [Google Scholar] [CrossRef]
  13. Farboodi, M.; Jarosch, G.; Shimer, R. Internal and external effects of social distancing in a pandemic. J. Econ. Theory 2021, 196, 105293. [Google Scholar] [CrossRef]
  14. Van Der A, R.R.; Peters, D.H.M.U.; Eskes, H.; Boersma, K.; Van Roozendael, M.; De Smedt, I.; Kelder, H.H. Detection of the trend and seasonal variation in tropospheric NO2over China. J. Geophys. Res. Space Phys. 2006, 111. [Google Scholar] [CrossRef] [Green Version]
  15. The Lancet Respiratory Medicine. COVID-19 casts light on respiratory health inequalities. Lancet Respir Med 2020, 8, 743. [Google Scholar] [CrossRef]
  16. Maier, B.F.; Brockmann, D. Effective containment explains subexponential growth in recent confirmed COVID-19 cases in China. Science 2020, 368, 742–746. [Google Scholar] [CrossRef] [PubMed] [Green Version]
  17. Amegah, K. Improving handwashing habits and household air quality in Africa after COVID-19. Lancet Glob. Health 2020, 8, e1110–e1111. [Google Scholar] [CrossRef]
  18. Yoo, S.; Koh, K.W.; Yoshida, Y. Are consumers abandoning diesel automobiles because of contrasting diesel policies? Evidence from the Korean automobile market. Energy Econ. 2020, 92, 104969. [Google Scholar] [CrossRef]
  19. Lin, J.-T.; McElroy, M.B. Detection from space of a reduction in anthropogenic emissions of nitrogen oxides during the Chinese economic downturn. Atmospheric Chem. Phys. Discuss. 2011, 11, 8171–8188. [Google Scholar] [CrossRef] [Green Version]
Figure 1. Changes in NO2 TVCD (molec./cm2) trends for China, US and the world with respect to GDP.
Sustainability 13 11777 g001
Figure 2. Global distribution of global health benefits (trillion USD) in July 2020. A higher number (blue color) indicates a greater level of benefits. Lower values (green colors) suggest that the estimated mortality benefit is lower.
Sustainability 13 11777 g002
Table 1. Descriptive statistics.
VariablesObsMeanStd. Dev.MinMax
NO2 TVCD625,0572.923.08−2.6626.78
(%) Mortality from
Air-Pollution-Related
Diseases
584,8960.190.060.080.39
GDP per Capita (1000 USD)560,5955.037.590.0085.91
Population (Million)560,491262.92430.850.101392.73
Life Expectancy540,208756.745384
GINI Index540,20923.0022.640.3393.74
Table 2. Estimation results.
Model (1)Model (2)Model (3)
(log) NO2 TVCD−0.013 ***0.005 ***0.006 ***
(0.0001)(0.0001)(0.0001)
Constant0.197 ***0.426 ***0.422 ***
(0.0001)(0.010)(0.010)
Macroeconomic ControlsXOO
Time Controls (Year, Month)XXO
N526,068484,087484,087
R-sq0.0460.5720.573
Standard errors in parentheses. *** p < 0.01.
Publisher’s Note: MDPI stays neutral with regard to jurisdictional claims in published maps and institutional affiliations.

