Abstract
By combatting erosion and increasing habitat, mangrove living shorelines are an effective alternative to hard-armoring in tropical and subtropical areas. An experimental red mangrove living shoreline was deployed within Mosquito Lagoon, Florida, using a factorial design to test the impact of mangrove age, breakwater presence, and mangrove placement on mangrove survival within the first year of deployment. Mixed mangrove age treatments were included to identify if seedling (11-month-old) survival could be enhanced by the presence of transitional (23-month-old) and adult (35 to 47-month-old) mangroves. Environmental factors were monitored to detect possible causes of mangrove mortalities. Approximately half (50.6%) of mangroves died, and of those, 90.7% occurred within the annual high-water season, and 88.9% showed signs of flooding stress. Planting seedlings haphazardly among older mangroves did not attenuate enough wave energy to significantly increase seedling survival. Breakwaters alleviated stress through a reduction in water velocity and wave height, increasing the odds of survival by 197% and 437% when mangroves were planted in the landward and seaward rows, respectively. Compared to seedlings, deployment of adult mangroves increased survival odds by 1087%. Collectively, our results indicate that sites with a high-water season should utilize a breakwater structure and mangroves with a woody stem.
1. Introduction
Historical efforts to stabilize shorelines have focused on the hard-armoring of extensive portions of coastlines with artificial structures such as seawalls, jetties, and breakwaters [1,2,3]. As a result, 14% of shorelines in the United States are hard-armored, with 64% of that total occurring in estuaries and lagoons [2]. Seawalls reduce the ability of plant communities to migrate landward as sea levels increase, resulting in further habitat loss over time [4,5,6].
Another option for shoreline stabilization is the “living shoreline” method, which uses natural materials (e.g., vegetation, oyster reef, sand, rock) to reduce erosion while also providing habitat [7]. This study focuses on vegetation living shorelines, which allow for habitat migration over time, wildlife movement between terrestrial and marine habitats, and increased wave attenuation as the vegetation grows larger [8]. Vegetation living shorelines within estuaries are deployed along the intertidal zone, exposing the plants to hydrodynamic influences [7]. Depending on the location’s water level and wave energy, the living shoreline can experience flooding stress, physical damage, and root removal [9,10,11].
A breakwater is a barrier that is placed seaward of a shoreline to attenuate hydrodynamic force by lowering wave height and reducing incoming velocity [12,13]. For areas with high wave energy, a breakwater is often constructed to aid the survival of vegetation living shorelines [8,14,15]. The extent of wave attenuation depends on many aspects of the breakwater structure, including breakwater height and length, gap width, distance from the shoreline, and type of material utilized [16,17,18]. Breakwater height needs to be greater than or equal to the mean water level to efficiently protect the shoreline from hydrodynamic forces [19,20]. Commonly reported materials used for breakwater construction include rubble, rock, and permeable textiles filled with material [21,22,23,24]. Within the Indian River Lagoon, breakwaters have been assembled by stacking plastic mesh bags filled with empty oyster shells [13]. An oyster shell bag breakwater decreases near-bed velocity by 62% and reduces wave height by 42% when the water level is 5 cm above the structure [13]. The oyster shells within the permeable bags contain biochemical cues which attract oyster larvae to the structure. A “living” breakwater is therefore created over time as more oysters settle and grow on the bags [25,26,27,28].
In tropical and subtropical areas, mangroves are frequently used in living shoreline stabilization efforts, are considered foundational taxa, and provide shelter, foraging, and nesting space for over 1300 animal species [29,30,31]. Therefore, increasing areas of mangrove habitat has the potential to increase local biodiversity and provide multiple ecosystem services, including fisheries production, carbon sequestration, and ecotourism [32,33,34,35,36]. Many mangrove species have complex, above-ground root structures that slow water movement, capture suspended sediments, and provide microhabitats for invertebrates and fish [32,33,35,37]. Underground mangrove roots lead to shoreline stabilization by increasing soil strength [38]. The shear strength of the sediment inhabited by mangroves spans from 2.5 to 46 kPa [38]. Within a Florida estuary, 14 small-scale mangrove living shoreline deployments, ranging from 104 to 327 m in length and 2–7 years in age, were able to reverse system-wide erosion patterns and result in a net shoreline gain of 347.62 m2 year−1 [39].
Rhizophora mangle (red mangrove) is frequently used in living shoreline and mangrove restoration efforts in the southeastern United States, Caribbean, and Central America [40,41,42,43,44]. Traditionally, successful planting of R. mangle on Florida’s east coast has a northern limit of approximately 40 km south of Fort George Inlet, where the natural expansion of R. mangle populations is restricted by the frequency of freeze events that drop below −4 °C [45,46,47]. Compared to the other mangrove species native to Florida (Avicennia germinans (black mangrove), Laguncularia racemosa (white mangrove)), R. mangle is able to settle and survive amid greater magnitudes of flooding due to larger propagules and interspecific differences in root aeration [48,49,50]. Rhizophora mangle occupy elevations ranging from +0.06 to +0.49 m, where the base of the mangroves are flooded on average 30% of each day [51]. To imitate the observed hydrology of naturally recruited fringe mangrove stands, R. mangle used for living shorelines are planted in the middle to high intertidal zone [44,52,53]. Frequent inundation alleviates high pore-water salinity and increases phosphorus abundance, but extended periods of submersion can deplete a mangrove’s stored oxygen, negatively impacting survival and growth through the accumulation of ethanol [54,55,56,57]. Rhizophora mangle can withstand a greater range of flooded conditions as they age, due to larger stems and the growth of prop roots above the sediment surface, both of which have lenticels and aerenchyma for the intake and storage of oxygen [58,59]. Rhizophora mangle, ranging from the propagule stage to three-year-old saplings, have been used for restoration purposes [44,60,61], but utilizing seedlings (≤1 year old) is common practice within the state of Florida [62].
Wind wave energy is based on wind speed and direction, bathymetry, and fetch; it can be enhanced by nearby boating activity, with resulting boat wakes contacting the shorelines [63,64,65]. Wave energy contacting the portion of a mangrove submerged in water is a primary source of seedling mortality. Individuals can be lost through dislodgement or failure at the stem [9,66]. The probability of dislodgement of seedling R. mangle by wave energy is inversely related to grain size; for example, R. mangle anchors 3.5 times better in coral rubble than sand [66]. Areas that are solely made up of small grains can vary in soil strength based on cohesiveness, and this impacts plant anchorage [67].
Sediment accretion and erosion, influenced by the amount of wave energy at a site, can impact young mangrove survival. Required force for removal of R. mangle seedlings increases by 0.20 N for every gram increase in root biomass [68]. Sediment erosion, which reduces buried root biomass, therefore also reduces the required removal force [69]. Sediment accretion can lead to hypoxic conditions that result in mangrove mortality [21,70,71]. Survival of six-month-old planted Avicennia marina (grey mangrove) seedlings is significantly impacted by sediment accretion once burial reaches 14 cm above the original sediment level at time of planting [21]. Seedlings of Rhizophora apiculata (tall-stilt mangrove) experience a 3% increase in mortality rate for every cm of sediment added, and 0% survival with 32 cm of additional sediment treatment at 321 days [71].
Coexisting with other vegetation has proven to have both negative (competition) and positive (facilitation) impacts on mangrove survival [72,73,74,75]. Surrounding vegetation can influence young mangroves negatively by reducing light availability [73]. Rhizophora mangle are able to establish as propagules and grow to the seedling stage under shaded conditions, but they require at least 20% light availability to proceed from seedlings to juveniles [76,77]. Seedling mangroves can benefit from establishing near A. germinans and R. mangle secondary roots, as they increase soil redox potential, lower sulfide concentrations, and attenuate wave energy [72,78]. The presence of other vegetation such as Batis maritima (saltwort) and Salicornia ambigua (perennial glasswort) can also have a positive impact on young R. mangle health by reducing interstitial salinity and increasing nutrients such as carbon, nitrogen, and phosphorus [75]. Decaying organic matter (wrack) is another source of nutrients for young mangroves, barring that the abundance is not great enough to smother the plant [79,80].
Mangrove survival is crucial for reversing patterns of shoreline erosion and providing natural habitat [33,39], but many mangrove living shoreline projects report low levels of survival even with a breakwater present [10,22,52,81,82,83,84]. For example, a living shoreline in Malaysia that utilized a breakwater and planted 1030 A. marina and R. apiculata seedling mangroves (height: ~20 cm) cost USD 175,000 per 0.01 km2, yet reports a survivability index of 5% [10]. A separate living shoreline in Malaysia, costing a total of USD 85,000, deployed a breakwater and planted A. marina saplings (~40 cm) in coir logs; the restoration had 30% survival after eight months [82]. A review paper reveals that out of 67 mangrove plantings in Sri Lanka, 97% of which were Rhizophora spp., 37 of the deployments resulted in 100% mortality [11]. The reported reasons for these mortalities include drought, flooding, smothering by wrack, browsing and trampling by vertebrates, and infestation by insects and barnacles [11].
As demonstrated above, living shorelines can be expensive to deploy, and few studies start with pilot experiments to test different living shoreline designs at each deployment site and monitor them closely enough to identify the reason(s) for failures [85,86]. To fill this gap and explore mangrove success when used in living shoreline stabilization in a shallow, subtropical estuary, we asked: (1) How does initial mangrove age, breakwater presence, and mangrove placement impact mangrove survival? (2) Is seedling survival enhanced by being planted with older mangroves? (3) Which structural characteristics of mangroves were most influential for survival? (4) What was the source of observed mangrove mortalities?
2. Materials and Methods
2.1. Study Site
Mosquito Lagoon is located on the east coast of central Florida and comprises the northernmost portion of the Indian River Lagoon (IRL) system. The IRL is classified as one of the most biodiverse estuaries in the continental United States, which supports over 4000 species of plants and animals [87]. Dominant vegetation growing along Mosquito Lagoon shorelines include R. mangle, A. germinans, Myrica cerifera (wax myrtle), and Borrichia frutescens (sea oxeye) [88]. This area experiences an annual high-water season each fall, and water movement is primarily wind-driven [89,90,91]. Mean water depth in Mosquito Lagoon is 1.5 m with a tidal range of 0.7 m at Ponce de Leon Inlet [88]. Historical water gauge data, collected from Haulover Canal by USGS between the years of 2008 and 2020, show the mean water level within the intertidal zone was 23.7 cm, ranging from 18.6 cm (2008) to 30.4 cm (2020). During the monitoring period of this experiment (July 2019 to June 2020), the mean water level at the Haulover Canal station was 31.5 cm.
An experimental red mangrove living shoreline was deployed in Mosquito Lagoon within the boundaries of Canaveral National Seashore (CANA). Tidal range within CANA, 15 km south of Ponce de Leon Inlet to 0.5 km south of the experimental site, ranged from 50 cm to 2 cm and decreased from north to south [92]. Tidal range recorded closest to our study site (0.5 km) was 2 cm [92]. Maximum water depth within the previously specified CANA range was 2.5 m with the majority of recordings < 0.5 m, and mean salinity ranged between 30.7 and 31.3 ppt [92]. The mean wave height (cm) adjacent to our study site was 5.37 ± 0.14 [93].
The experimental living shoreline was planted along a shell-dominated shoreline once occupied by the Timucuan people (800 to 1400 CE) [94]. Tribes harvested large amounts of oysters (Crassostrea virginica) and clams (Mercenaria mercenaria), discarding the empty shells in large piles (middens) along shorelines in Mosquito Lagoon [44]. These shell middens contain culturally significant items, including broken pottery and animal bones [94]. The US National Park Service is dedicated to protecting these historic sites with as little disturbance as possible, and stabilizing this area using living shoreline techniques directly supports this goal. Due to the shelly substrate, it is difficult for mangroves to naturally recruit to the shoreline; at the start of this project, only four mature R. mangle were observed along the 650 m of shoreline [44]. Adjacent shorelines, consisting of sandy sediment, had mature R. mangle and A. germinans at elevations comparable to those of the shell midden marked for restoration.
Grain size, boating activity, and historical erosion rate are important site characteristics for comparing living shoreline restoration results that are not currently provided by the literature for our experimental site. To find the mean grain size, 100 fossil oyster or clam shells were sampled, from the intertidal portion of the shoreline at the elevation where the mangroves were deployed, using the Wolman pebble count method [95]. Shell midden shorelines, such as this one, have 100% cover of recent and historic oyster and clam shell. Calipers were used to measure the B-axis (width) of each shell. This process was repeated three times for a total of 300 shells sampled. The substrate at the restoration site was 32.3% oyster shell and 67.7% clam shell. Grain size (cm) ranged from 0.7 to 9.1 with a mean (±SE) of 4.4 ± 0.1.
To identify boating pressure that could increase the local wave energy, a Bushnell Trophy Cam HD was placed at the center of the restoration site, facing the main channel. The camera had the capability of capturing boats that passed within 60 m of the restoration shoreline; it took a ten-second video when activated by motion 24 h a day, for five days each month, from July 2019 to June 2020. The impact of boating wakes on wave activity interacting with the study site shoreline was minimal, with only 12 boats captured by the wildlife cameras (boats day−1 = 0.2). All boats had motors, but only two produced wakes. The ~150 m channel adjacent (west) to the restoration site is bordered on the other side by an island. The channel becomes progressively deeper as it approaches the island across from the restoration site. Therefore, the only boats that were observed on plane were far enough away that the waves dissipated before reaching the mangroves. The remaining ten boats that did not produce a wake were either actively fishing or trolling, with fishing rods visible in the boats. The indication of the footage, i.e., that few boats came to the area and boats were planing on the other side of the channel, was consistent with observations made in the field while monitoring [96].
To determine historical land mass erosion or accretion rates of the restoration site, aerial imagery from the years 2007 and 2017 was analyzed using ArcMap 10.6 software [39]. The vegetation line from the two time periods was compared to identify if land mass had receded or accumulated over the ten-year period. This change along the shoreline was calculated in m year−1. This analysis served two purposes: (1) to establish if stabilization of the sediment was needed and (2) to ascertain how the elevation at which the four adult R. mangle were rooted may have changed since time of recruitment. Between 2007 and 2017, the mean (± SD) change in shoreline (m year−1) was −0.50 ± 0.34, ranging from −1.45 m to 0.57. The majority of the shoreline was dominated by patterns of erosion, and areas denoting land acquisition corresponded to the location of mature A. germinans (Figure 1).
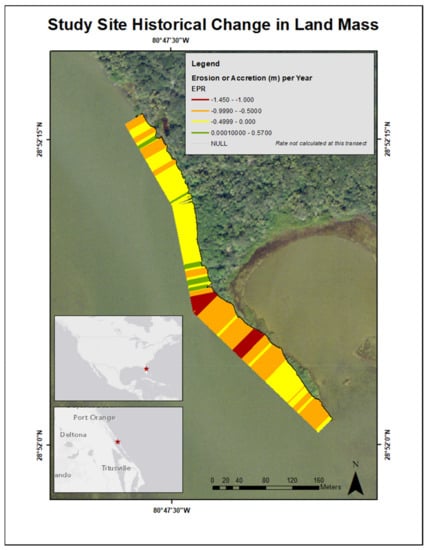
Figure 1.
Map illustrating the change in the study site land mass from an aerial view from 2007 to 2017. EPR represents the statistic used [39], which transformed the total change in land mass into change per year. Receding shoreline (erosion) is represented by red, orange, and yellow colors. Shoreline accretion is represented by green.
2.2. Experimental Design
To test the efficacy of different living shoreline designs, an experimental living shoreline was deployed between 14 and 21 June 2019. In total, 1050 oyster shell bags were deployed as breakwaters and 640 mangroves planted with the help of 51 volunteers (324 volunteer hours). Oyster shell bags were constructed from DelStar Technologies Naltex nylon mesh filled ~3/4 full with recycled oyster shells (18.9 L) collected from restaurants and quarantined outdoors at Marine Discovery Center in New Smyrna Beach, FL for a minimum of six months. Individual bags were 1 m long, 0.4 m wide, weighed approximately 18 kg, and were hand-knotted at each end. The breakwater consisted of 25 units based on Florida Department of Environmental Protection permitting requirements, with each unit no more than 6.6 m in length and a minimum of 6.6 m stretches between each unit to enable wildlife movement. Breakwaters were never placed closer than one meter to any existing seagrass (Halodule wrightii) or emergent wetland plants. When breakwaters were deployed, the crest of the structures exceeded the water level. Each breakwater unit consisted of two stacked rows of 21 oyster shell bags (total shells bags/unit = 42), attached together with cable ties (304 mm × 7 mm). Mangroves used for the experimental living shoreline were collected as propagules from over 100 trees within the boundaries of CANA and grown at the University of Central Florida greenhouse in Orlando. Propagules were planted in 3.7 L pots with Timberline topsoil for approximately one year, then transferred to 11.3 L pots with additional topsoil. These pots were kept in shallow, plastic pools filled approximately to 14 cm with freshwater. Mangroves were separated into three developmental stages based on known plant ages and observations of the mangrove stems at the time of deployment. They were either seedlings at 11 months-old (0% woody tissue), transitional plants at 23 months-old (hereafter referred to as “transitionals”) with 25 to 75% woody tissue, or adults that ranged in age from 35 to 47 months-old (100% woody tissue).
A factorial design was used to test all combinations of mangrove developmental stages with the presence or absence of a wave break for a total of ten treatments along the experimental living shoreline (Figure 2, Supplementary Table S1): seedlings only, seedlings with a breakwater, transitionals only, transitionals with a breakwater, adults only, adults with a breakwater, mixture of the developmental stages, mixture of the developmental stages with a breakwater, no mangroves (control), and no mangroves (control) with a breakwater. Each treatment was replicated five times along the shoreline. The placement of each treatment along the shoreline was randomly determined prior to restoration using a random number generator (random.org) (accessed 30 May 2019) (Figure 2, Supplementary Table S1).
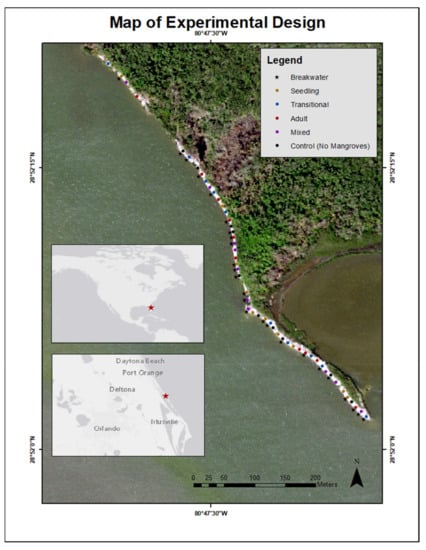
Figure 2.
Map of restoration site illustrating where each mangrove and breakwater treatment was deployed.
For treatments with a breakwater, shell bags were placed one meter seaward of the planted mangroves. Treatments with mangroves included 16 plants total, separated into two staggered rows of eight, at an elevation inhabited by the closest naturally occurring mature R. mangle. Within the treatments, mangroves were centered with approximately 0.7 m distance to adjacent mangroves (Supplementary Figure S1). Each treatment with a mixture of developmental stages had between five and seven seedlings, three and seven transitionals, and three and seven adults (totaling 16 mangroves in two rows of eight) (Supplementary Table S1); however, the exact ratio of seedlings to transitionals to adults and the placement of each developmental stage within the treatment replicate was haphazard. This planting scheme for mixed treatments was intended to imitate a restoration strategy that uses a haphazardly deployed mixture of developmental stages with the goal of increasing seedling survival. Prior to the restoration, colored flagging tape was attached to the mangroves to identify their treatment type. Within that specified treatment, the row in which each of the 16 mangroves were placed was haphazardly decided on the restoration days. Each mangrove was tagged for continued identification (Supplementary Information S1).
Mangroves were removed from their pots prior to planting. To eliminate planting damage, if mangrove roots were growing out of the container, volunteers were instructed not to pull the mangrove out forcibly, but to cut the pot away around the roots. Additionally, one week after the deployment, all mangroves were checked to ensure the root balls and topsoil from the pots were completely buried by sediment. Three mangroves (0.4% of total), one adult and two transitionals, did not meet this standard and were replaced.
2.3. Monitoring
Survival was monitored a total of 14 times, monthly from 28 June 2019 through 28 June 2020, plus on 19 September 2019, one week after Hurricane Dorian (Category 2, wind speeds 56–96 kmh−1), to isolate any impacts of the storm [97]. The eye of the storm was approximately 160 km east of the living shoreline [98]. Survival categories included: (1) “alive” if the mangrove remained in place and had foliage, (2) “standing dead” if the mangrove remained in place with no foliage, (3) “dead” if the stem was bent or partially snapped at the base to the point that the entire mangrove was lying flush on the sediment and had no foliage, and (4) “missing” if the mangrove was no longer in the planted location. A category was not created for mangroves that were bent or partially snapped to the point where the entire mangrove was lying flush on the sediment but still had foliage due to lack of occurrence. “Missing” included loss from uprooting or stem breakage. Stem breakage encompassed individuals in which the root and a small stub of the mangrove stem remained in the sediment. Mangroves that were “missing” due to stem breakage, “dead”, or “standing dead” were monitored throughout the year to account for the possibility of regrowth and new leaf production [99,100,101,102]. Regrowth was only observed for “standing dead” mangroves (n = 9), in which case the classification was changed to “alive.” New growth was either in the form of leaves growing from the top of the stem or from a branch with leaves growing from the side of the stem.
Initial metrics for each plant were recorded one-week post-deployment on 28 June 2019. These measurements included maximum plant height, stem diameter, and the number of branches, leaves, free-hanging prop roots, and anchored prop roots. Mangrove height was recorded to the nearest cm from the base of the stem to the highest point with a meter stick. Diameter was measured with calipers to the nearest mm at the thickest portion of the stem. Branches were classified as an extension at least two cm long with a minimum of one attached leaf. Leaves were not counted if they were brown and shriveled. Free-hanging prop roots were defined as secondary roots originating from the stem and at least two cm long, but not touching the sediment. Anchored prop roots originated from the stem and contacted the surface of the sediment.
2.4. Environmental Factors
Environmental factors that potentially varied along the shoreline at the start of the trial and could have impacted survival results included slope, distance to other established vegetation, and fetch (Table 1). The slope was calculated one week after the living shoreline was implemented [103]. A level and laser were used to find the change in elevation between the shoreline one meter seaward of the shell bags and the shoreline three meters landward of the planted mangroves. The distance to adjacent shoreline vegetation left (northward) and right (southward) of the planted mangroves was determined using a transect tape, with the maximum distance being the start of another replicate, not including controls. Shoreline vegetation included naturally recruited, mature R. mangle, A. germinans, and Conocarpus erectus (buttonwood). Distance to shoreline vegetation behind (eastward) the mangrove treatments was also documented with a transect tape. None of the planted mangroves were placed directly beneath a canopy created by other plants at the start of the experimental trial. By the end of the 12-month period, four mangroves had an A. germinans canopy growing above them. Polyline shapefiles and intersect tools within ArcMap 10.6 were used on 2017 aerial imagery to find distance to the nearest landmass (fetch) for each treatment replicate from the S, SW, W, and NW directions [104]. Other directions were excluded as they all had a fetch of zero.

Table 1.
List of variables investigated to answer the following study questions: (1) How does initial mangrove age, breakwater presence, and mangrove placement impact mangrove survival? (2) Is seedling survival enhanced by being planted with older mangroves? (3) Which structural characteristics of mangroves were most influential for survival? (4) What was the source of observed mangrove mortalities? Additionally, a list of how each variable was measured, how often it was measured, and the scientific basis for why it was being measured.
Factors that could vary along the shoreline throughout the monitoring period included erosion or accretion and wrack abundance (Table 1). To measure local erosion or accretion for each treatment replicate, a polyvinyl chloride (PVC) pipe (length: 0.6 m, diameter: 12.7 mm) was placed in the center of the intertidal zone where plants were deployed or the comparable area for control treatments [105]. Each piece of PVC pipe was secured until 50% of the PVC pipe was belowground. The height of each PVC pipe above the sediment was measured in mm with a meter stick at the beginning of the experiment and every three months thereafter for 12 months. Wrack quantification took place in September 2019, December 2019, March 2020, and June 2020. To determine wrack cover and wrack thickness in a nondestructive manner, five quadrats (0.25 m2) were haphazardly placed within each replicate of each treatment at the elevation of the planted mangroves, landward of the breakwater, if present. Wrack cover was identified based on percent cover calculated from the point-intercept method [80]. Wrack thickness (mm) was the calculated mean of wrack depth taken at five haphazard points within the quadrat [65].
Temporal factors that could collectively impact the deployed mangroves included water level, salinity, wind speed, precipitation, minimum temperature, and insect predation (Table 1). To determine the mean water level experienced by the plants, five PVC pipes (length: 0.6 m, diameter: 12.7 mm) with colored zip-ties attached two cm apart were secured into the sediment at the same elevation as the planted mangroves. The spacing between zip-ties was re-calibrated each month. These PVC pipes were evenly spaced along the restoration site to capture any variation that was present along the entire restoration site. One Bushnell Trophy Cam HD wildlife camera was faced towards each PVC pipe and programmed to capture a ten-second video every 30 min from 7:30 a.m. to 7:30 p.m., five days each month from July 2019 to June 2020. Water level was quantified by identifying where the water’s surface was in relation to the color-coded zip-ties. If waves were present, the mean wave crest value was recorded as the water level. This timing sequence allowed the mean water height recorded for each month to account for daily semidiurnal tides. Salinity was measured with an optical refractometer twice each month during monitoring. Minimum temperature, wind speed, and precipitation data was accessed from weatherunderground.com (station: 29.03, −80.93). Individual mangroves were checked every three months for one year for insect presence and insect bite marks.
2.5. Statistical Analyses
A logistic regression was used to determine the impact mangrove treatment, breakwater presence, and mangrove placement had on mangrove survival at 12 months. Survival indicated the mangrove was classified as “alive” at the end of the monitoring period. Mangrove placement was a binary covariate used to separate mangroves planted in the row closest to the water (seaward row) from those planted in the row furthest from the water (landward row). A likelihood-ratio test was used to identify the overall impact of developmental stage on survival. To account for any variation along the shoreline that may have influenced individual mangrove survival, slope, distance to other vegetation (left, right, and behind treatment), fetch (S, SW, W, and NW), wrack thickness, wrack cover, and total erosion or accretion at 12 months were considered as possible predictors of mangrove survival. Scatter plots of the possible influential covariates were analyzed to create multiple plausible models. To remove predictive variables that were highly correlated to one another (multicollinearity), within each model, covariates with a variable inflation factor exceeding ten were removed [106]. The best model was identified using weighted Akaike information criterion (AIC), data visualization, and covariate p-values. To relate the impact mangrove developmental stage had on survival to initial plant size, starting height, diameter, branch count, leaf count, anchored prop root count, and free-hanging prop root count for each developmental stage were compared to one another using ANOVA tests. All statistical analyses were conducted using R, version 3.5.1 [107].
A logistic regression was used to identify the impact of temporal environmental factors on overall mangrove survival. Each mangrove was marked as a “1” for the month in which they changed from “alive” to “standing dead”, “dead”, or “missing”, and as a “0” if there was no change. This time of death marker was used as the binary response variable. Plots were analyzed comparing mean salinity, wind speed, minimum temperature, precipitation, and water level to time of death to identify the most plausible model.
3. Results
3.1. How Does Initial Mangrove Age, Breakwater Presence, and Mangrove Placement Impact Mangrove Survival?
At the end of the 12-month monitoring period, 49.4% of mangroves survived. The best model to predict mangrove survival after 12 months included breakwater, mangrove treatment, and row with an interaction between breakwater and row (Table 2). The overall influence of mangrove treatment was substantial (p < 0.001), with increases in mangrove survival associated with increases in mangrove age. Compared to planting seedlings, survival odds increased by 186.4% when transitional mangroves were used and 1086.9% when adult mangroves were used (Figure 3, Table 3). Total survival for each developmental stage was 28.2% for seedlings, 45.5% for transitionals, and 75.6% for adults.
Table 2.
AIC output for the logistic regressions explaining mangrove survival after 12 months (dependent variable). Best model is indicated by the lowest AICc score and the highest weight.
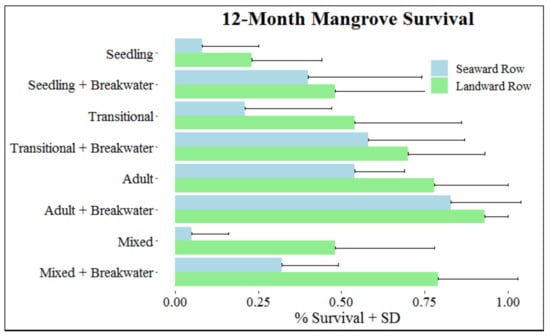
Figure 3.
Survival (+SD) at month 12 based on mangrove, breakwater, and row treatments.
Table 3.
Logistic regression output for the best model explaining mangrove survival after 12 months (Survival~Mangrove + Row*Breakwater).
Increased survival was also associated with presence of a breakwater and being planted in the landward row (Figure 3, Table 3). Total survival for mangroves with and without a breakwater was 62.5% and 36.2%, respectively; mangrove survival was 61.4% for those in the landward row and 37.3% for those in the seaward row. Increased survival as a result of breakwater presence was greater for mangroves in the seaward row compared to those in the landward row (Figure 3, Table 3). For mangroves in the seaward and landward row, respectively, survival odds increased 436.8% and 197.5% when a breakwater was present. Observations within mixed treatments were consistent with trends of survival observed for mangroves in single developmental stage treatments, with increased survival for older mangroves, presence of a breakwater, and mangroves planted in the landward row.
After the 12-month monitoring period, accretion or erosion measurements varied among the treatments. Accretion (cm) ranged from 0.4 to 26.2 with an average of 8.3, and erosion (cm) ranged from −11.7 to −0.5 with an average of −4.2. A total of 65% of the treatments experienced accretion, 46.2% of which did not have a breakwater present. Erosion or accretion at each treatment replicate did not significantly impact the 12-month survival model.
Is Seedling Survival Enhanced by Being Planted with Older Mangroves?
Percent survival for seedlings did not vary between mixed and seedling-only treatments; seedlings planted with other age groups (mixed) had 25.0% survival, and seedlings planted only with other seedlings had 29.4% survival. This same pattern was observed regardless of breakwater presence (Figure 4).
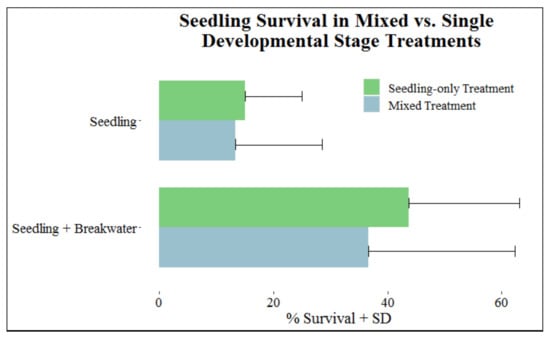
Figure 4.
Survival (+SD) of seedlings in mixed vs. single developmental stage treatments separated into categories with and without breakwaters.
3.2. Which Structural Characteristics of Mangroves Were Most Influential for Survival?
All mangrove initial size measurements were significantly different (ANOVA: p < 0.05) from one another among developmental stages with exception of free-hanging prop roots; it was therefore removed from consideration as a main driver of increased survival with increased mangrove age (Supplementary Table S2). Height, stem diameter, and anchored prop roots had the greatest variation between mangroves that survived and those that did not after 12 months. Larger initial measurements for these categories all had a positive impact on survival (Figure 5). Odds of survival increased by 11.0% for every mm of stem diameter, 3.5% for every cm of height, and 26.3% for every anchored prop root.
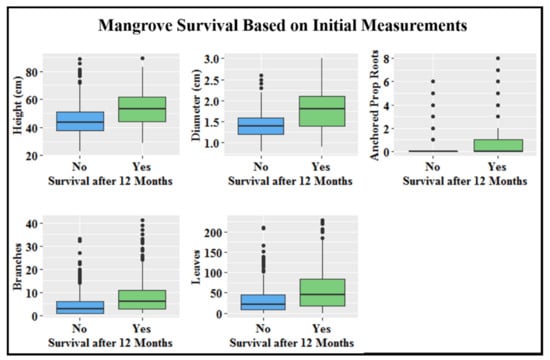
Figure 5.
Initial size measurements, represented by boxplots, for mangroves that survived versus mangroves that did not survive by the end of the 12-month monitoring period. Bottom line of box represents the 25th percentile, middle line the median, and top line the 75th percentile. Vertical lines illustrate the minimum and maximum values, and dots are outliers.
The required starting height and stem diameter for survival was lowered when a breakwater was present (Figure 6). For mangroves without a breakwater, a linear increase in mangrove survival was observed as height and stem diameter increased (Figure 6). The same pattern was observed for mangroves with a breakwater until stem diameter reached 2.0 cm. After this point, height had a smaller overall influence on survival (Figure 6).
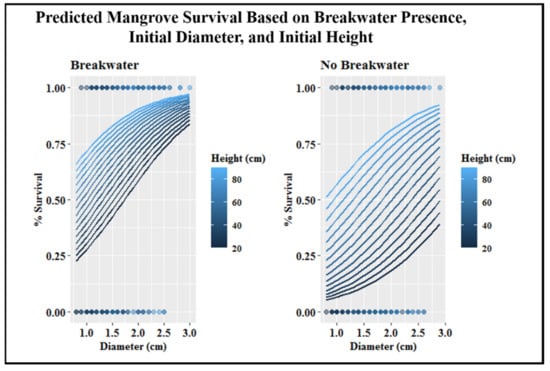
Figure 6.
Survival probability for mangroves with or without a breakwater, depending on initial plant height and stem diameter. Dots on the graph illustrate the collected data from the experiment that are informing this model. Chance of survival for a mangrove (y-axis) can be predicted by choosing a starting height (color) and starting diameter (x-axis). This prediction changes when the mangrove either has a breakwater (left graph) or does not (right graph).
3.3. What Was the Source of Observed Mangrove Mortalities?
Water level (p < 0.001) best predicted mangrove mortality (Figure 7). The majority of the 324 mangrove mortalities occurred in month four post-restoration, which occurred approximately two months after the onset of the annual high-water season. More specifically, the majority of mortalities occurred in October (62.0%), November (16.0%), September (8.0%), and December (4.6%) when the mean water levels (cm) (±SE) above the sediment surface ranged from 14.2 ± 0.8 to 20.5 ± 0.2 (Figure 7). Total percent mortality for the remaining months ranged from 0% to 2.2% when mean water level was between 0.0 and 5.6 cm above the sediment. During post-hurricane Dorian monitoring, only three (11.5%) of the 26 mortalities from the month of September had occurred, which equates to less than 1.0% of total mortalities (Figure 7).
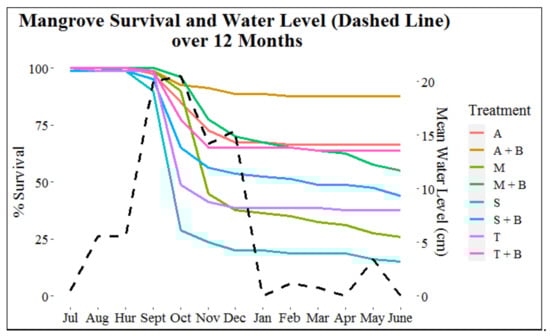
Figure 7.
Survival (% “alive” mangroves) (left y-axis) of each treatment per month and mean water level (cm) (right y-axis) per month at the base of the mangroves. Hurricane Dorian is represented on the x-axis by “Hur.” Within the legend, “A” = Adults, “A + B” = Adults + Breakwater, “M” = Mixed, “M + B” = Mixed + Breakwater, “S” = Seedling, “S + B” = Seedling + Breakwater, “T” = Transitional, and “T + B” = Transitional + Breakwater.
During September and October survival monitoring, when water level was ~20 cm (Figure 7), three seedlings were completely submerged at low tide, and 41 mangroves had only the top portion of their highest leaves exposed (21 seedlings, 19 transitionals, and 1 adult). Of these 44 mangroves that experienced extended submersion, 81.8% died in October and 88.6% were dead by the end of the 12-month monitoring period. For the five-day period that water level was monitored at the end of each month, video footage revealed that mangroves were completely exposed (water level = 0.0 cm) for a portion of the captured footage every month except September and October. For the remainder of months, none of the mangroves experienced complete submersion.
In the month of October, when the majority of mangrove mortalities first occurred (Figure 7), 86.8% of them were classified as standing dead, 0.05% dead, and 13.5% missing. At the end of the 12-month monitoring period, of the total 324 mangrove mortalities, 54.0% were classified as standing dead, 42.3% missing, and 3.7% dead. Two adult, one transitional, and six seedling mangroves from this study recovered from being classified as standing dead and were declared alive at the end of the 12 months. Between one and eight months elapsed before new growth was observed (mean (±SD): 4.88 ± 0.67 months). Out of the 137 mangroves classified as missing at the end the of monitoring period, 26.3% went straight from alive to missing, and 73.7% were classified as standing dead or dead before progressing to missing. Mangroves remained in the standing dead or dead state between 1 and 8 months (mean (±SD): 4.74 ± 0.21 months) before progressing to the missing category. Twenty-nine of the missing mangroves had the base of the stem still visible, suggesting stem breakage and the retention of roots. Of the 21 displaced mangroves found along the shoreline, 100% did not have a root system attached. Greater percentages of missing mangroves were associated with younger developmental stages, absence of a breakwater, and being in the seaward row for mangroves in both mixed and single developmental stage treatments (Figure 8). Compared to adults, the number of mangroves classified as missing increased by 255.6% for transitionals and 966.7% for seedlings. The total number of mangroves classified as missing at the end of the monitoring period increased by 134.1% for mangroves without a breakwater compared to those with a breakwater, and by 32.2% for mangroves in the seaward row compared to mangroves in the landward row.
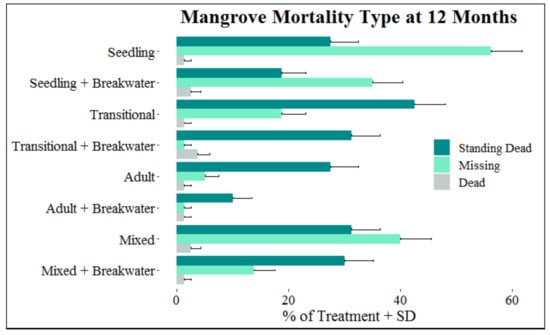
Figure 8.
Percentage of standing dead, dead, and missing mangroves (+SD) within each treatment at the end of the experimental period.
Temperatures were never below freezing (0 °C) during the 12-month monitoring period. The lowest temperature reached was 1.6 °C for six hours in January; during this month, total mortality for the month was 1.5%. Although small changes in precipitation and wind speed were not correlated with overall mangrove mortality, maximum monthly precipitation (8.3 mm) and wind speed (16.3 km h−1) values occurred in October and September, respectively (Supplementary Table S3).
Evidence of herbivory was present on four deployed mangroves, which were not all present in the same area but located in four different treatment units. One mangrove had a Phocides pigmalion (mangrove skipper) and insect bite marks present. Three additional mangroves had insect bite marks.
4. Discussion
4.1. Mangrove Age
Deploying 35 to 47-month-old mature mangroves with a breakwater was an effective strategy for living shoreline stabilization to increase mangrove survival (Figure 3). Increased survival in older plants was supported by larger initial stem diameter, height, and number of anchored prop roots at the time of planting (Figure 5). Mature mangroves were less likely to experience complete submersion and had larger structures to allow for increased access and storage of oxygen needed for cellular respiration during flooding events [108]. Choosing mangroves for a shoreline stabilization project based on development of a woody stem is a simple guideline that removes the need for extensive measurements. This method was an easy way to identify age and guarantee a plant with larger dimensions. Terms such as “seedling” and “sapling” are commonly used to describe young mangroves, but the exact definition can be based on age or various size measurements depending on the author and type of research being conducted. For example, saplings have been classified as greater than one-year-old, greater than one meter tall but less than four cm diameter, or as having one to two aerial roots and between one and three growing shoot tips [73,109,110]. Whether a restoration manager decides to grow their own mangroves or purchase them from a nursery, tracking age for a large number of mangroves can be difficult. Furthermore, mangroves that are the same age have been observed to grow at different rates and allocate growth to different areas based on environmental factors such as shading and soil nutrients [73,111]. Classifying mangroves based on the progression from a soft, herbaceous stem to a fully woody stem is an easy method for choosing mangroves. Moreover, for potential living shoreline restorations that parallel the conditions of our site, choosing mangroves with a completely woody stem is a powerful method for increasing R. mangle survival.
4.2. Flooding Pressure
The timing of mangrove mortalities throughout the 12-month period indicated flooding stress during seasonal changes in water level was an important factor influencing success of the living shoreline (Figure 7). The annual high-water season as the main driver of mangrove mortalities was supported by the magnitude of standing dead mangroves, which is consistent with flooding stress as opposed to forceful removal of the plant by wave energy [112,113]. During high-water season, mortality can be caused by the combination of physiological stress from submersion as well as increased exposure to waves causing physical removal of mangrove leaves. Seedlings were most susceptible to mortality during the high-water season, and planting seedlings with older mangroves (mixed treatments) did not increase seedling survival in Mosquito Lagoon (Figure 4). Previous studies have found positive effects of deploying mixed age plant communities in restoration [114,115,116,117], while others have not seen these facilitative effects [118,119,120,121]. Our seedling failure within mixed treatments was most likely two-fold. During flooding pressure in the fall, seedlings at a mean height of 42.7 cm were continuously partially submerged for approximately two months with maximum wave heights up to 34 cm. Secondly, any wave energy attenuation provided by the presence of older mangroves was not sufficient to significantly increase survival. As initial size metrics were crucial for withstanding flooded conditions (Figure 5), deployment after the commencement of high-water season and at the beginning of the growing season presents an effective strategy to allow maximum growth before flooding stress. For deploying a mangrove living shoreline in the IRL or other areas with similar conditions, the beginning of summer offers optimal conditions [122]. Seasonal changes in water level are not restricted to the coasts of Florida, but are also observed in tropical areas of Asia, Australia, West Africa, and the Americas that experience a monsoon season [41]. The negative impacts of monsoonal flooding on the survival of both planted and naturally recruited mangroves have been reported in Malaysia, Sri Lanka, and South Vietnam [10,82,84].
4.3. Mangrove Placement
The results of this study highlight the importance of understanding year-long hydrology for choosing the proper planting elevation. Florida restoration recommendations state mangroves should be placed in the middle to upper intertidal region where they are flooded on average 30% per day [51,52]. While mangroves placed at lower elevations are exposed to greater flooding [123,124,125], mangroves placed at higher elevations risk desiccation, increased salinity stress, slower growth, competition with other plants, and increased predation [51,55,101,113,123,124,126,127]. Florida is also faced with the difficulty of defining the high-water mark due to its seasonal variation [128]. In this study, there was significant variation in survival between the landward and seaward rows (Figure 3), with the mangroves in the seaward row experiencing increased flooding stress and wave energy during the high-water season due to small differences in elevations (~8.7 cm). At the time of the deployment in mid-June, planted mangroves were placed at the elevation observed by the closest mature, naturally recruited R. mangle, where they were slightly flooded (1–2 cm) in that month during high tide. This seemingly appropriate placement was not suitable for the survival of younger mangroves. The discrepancy could be explained by the results of the GIS analysis that revealed the restoration site underwent erosion from the years 2007 to 2017 (Figure 1), suggesting that when the mature R. mangle trees first recruited, the elevation was higher than it was at the time of the restoration. Additionally, the center of the adult red mangrove prop root mass (~1.5 m wide) was referenced for planting the young mangroves. Based on the extensive flooding the deployed mangroves experienced, placing the seaward row at the elevation where the adult prop roots originated could be a more effective future planting strategy for areas with seasonal flooding. Even with historical data readily available, predicting seasonal flooding magnitude and duration can be very challenging [41]. Fortunately, this study shows that using adult (35 to 47 month-old) mangroves and a breakwater was a successful strategy for areas with variations in flooded conditions (87.5% survival).
4.4. Breakwater Presence
Breakwaters may have reduced the negative effects of flooding stress by reducing wave energy when water levels were high. In this study, a greater percentage of the treatments experienced accretion, regardless of breakwater presence. Therefore, mangroves without a breakwater were not being washed away due to erosion, but rather experienced more wave energy stress which compounded the effects of flooding [129]. The mean starting height required for overall mangrove survival was lowered by 5.1 cm when a breakwater was present, suggesting breakwater presence increased mangrove survival through the lowering of wave height in addition to the attenuation of wave energy [13,130]. Negative instances of breakwater use have been reported; a study showed that breakwater presence can lead to accretion extreme enough to smother planted A. marina seedlings [21]. The effectiveness of a breakwater depends on many factors including breakwater design, sediment supply, land use, distance of the structure from the coast, tide level, sediment type, slope, and wave energy [23,131,132,133].
4.5. Erosion and Accretion
At our study site, the majority of mortalities were driven by flooding stress, which was then enhanced by wave energy. Erosion at the base of the mangroves was not great enough to result in mangrove root displacement; however, this mortality mechanism should remain a consideration for sites with higher levels of wave energy and smaller grain sizes along their shoreline [10,66,67,134]. Breakwater and mangrove treatments did not influence the erosion or accretion measurements taken at the center of the treatments with a PVC pipe after 12 months of monitoring (Figure 9). It is most probable that mangroves had not grown large enough to significantly influence the wave energy acting on the sediment at the one point within each treatment where the PVC pipe was placed. Sediment build-up was observed landward of the oyster shell bag breakwaters, but the accumulation had not reached the point where erosion or accretion was being measured. Over time, as the mangroves grow larger, the vegetation line along the shoreline will accumulate, wave energy attenuation will increase, and sediment trapping will occur [39,135]. To reach this point of influencing shoreline-wide sediment patterns, mangroves must first survive their first year of deployment when they are most susceptible to environmental stressors, which is more likely if older mangroves are planted and a breakwater utilized.
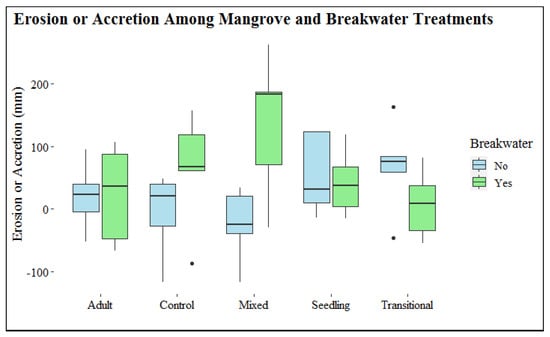
Figure 9.
Erosion or accretion values, represented by boxplots, for each treatment. Vertical lines represent minimum and maximum values, and dots represent outliers. Horizontal lines indicate the 25th percentile, the median, and the 75th percentile from bottom to top of the boxplot, respectively.
4.6. Wrack and Predation
Wrack and predation are commonly reported mechanisms for mangrove mortalities [11], however, they did not play a large role in this experiment. CANA experiences greatest wrack abundances during fall when seagrass leaves are shed and gather along the shoreline [80]. This process coincided with high water season, which effectively prevented the wrack from excessive accumulation around and on the mangroves. The main wrack line was observed landward of the mangroves along the highest high water level.
In addition to observing minimal insect presence, a study conducted simultaneously to ours suggests that leaf loss as a result of vertebrate predation was not a problem during the experimental period [136]. Wildlife cameras that were placed along our site captured 1419 observations of mammals (56% North American raccoons, 37% feral hogs, and 4% white-tailed deer) [136]. Of those observations, only 15 captured mammals contacting the deployed mangroves, and no dislodgement or consumption occurred. It is unclear why the animals did not forage on or disturb the deployed materials, but a possible reason could be the abundance of other vegetation species and prey options nearby [136].
5. Management Recommendations
5.1. Establish a Need for Restoration
To establish that a shoreline needs stabilization, look for: (1) minimal natural mangrove recruitment, and (2) signs of erosion. Signs of erosion include the presence of scarps and a receding vegetation line, visualized through field visits and aerial imagery.
5.2. Premonitor
Analyze the hydrology of the restoration site prior to deployment to choose the proper restoration materials and planting location. High wave energy can be natural, and driven by large fetches and high wind speeds, or it can be the byproduct of boating activity. If feasible, monitor the water level and wave energy of the site for a minimum of one year prior to restoration either directly or by accessing a nearby monitoring station with historical data.
5.3. Choose Restoration Materials
If the site has high wave energy or a seasonal high-water season, utilize a breakwater structure and select mangroves with a woody stem and anchored prop roots. If flooding and wave energy conditions are similar to our experimental restoration site, planting younger mangroves haphazardly among 23 to 47-month-old mangroves is not an effective method for increasing seedling survival.
5.4. Choose Planting Location and Timing
Place the mangroves where they will be inundated ~30% of the year. To reach this optimal goal, reference nearby naturally recruited mangroves of the same species. If R. mangle, plant the young mangroves where the adult red mangrove first recruited (landward side of the prop root mass). If GIS analysis of the restoration site indicates a quickly receding vegetation line, young mangroves may need to be placed further landward of the reference adult mangroves. Boundaries on the landward side, where mangroves should not be planted, include the dominant wrack line, above the highest high-water line, and areas where transitional or upland vegetation are present. In estuaries with seasonal changes in tide heights, deploy the mangroves after the commencement of high-water season and at the beginning of growing season.
Supplementary Materials
The following are available online at https://www.mdpi.com/article/10.3390/su132111704/s1, within supplementary materials, Supplementary Table S1: Location, developmental stage, and breakwater status of each treatment replicate. Supplementary Table S2: Mean initial metrics (±SE) for each mangrove developmental stage. Supplementary Table S3: Mean values (±SD) for water level, minimum temperature, salinity, precipitation, and wind speed over the 12-month monitoring period. Supplementary Figure S1: Visual representation of a mangrove treatment replicate that had an oyster shell bag breakwater present. Supplementary Information S1: Extra information on the tagging of the mangroves.
Author Contributions
Conceptualization, R.M.F., L.J.W. and M.J.D.; methodology, R.M.F., L.J.W., M.J.D., J.W.L. and J.L.R.; formal analysis, R.M.F.; investigation, R.M.F., J.W.L. and J.L.R.; resources, L.J.W. and M.J.D.; data curation, R.M.F.; writing—original draft preparation, R.M.F.; writing—review and editing, L.J.W., M.J.D., J.W.L. and J.L.R.; visualization, R.M.F.; supervision, L.J.W. and M.J.D.; project administration, L.J.W.; funding acquisition, L.J.W. and M.J.D. All authors have read and agreed to the published version of the manuscript.
Funding
This research was funded by the National Science Foundation, grant number 1617374; The National Park Service, and the Indian River Lagoon National Estuary Program.
Institutional Review Board Statement
Not applicable.
Informed Consent Statement
Not applicable.
Data Availability Statement
The data presented in this study can be found on the UCF STARS data repository available at: https://stars.library.ucf.edu/ceelab-researchdata/. The UCF STARS heading is “CEELAB Research Data”, and the file title is “Rebecca Fillyaw MS Thesis Data for Publication in the Journal Sustainability”.
Acknowledgments
We thank all the volunteers and all of our project partners for participating in this living shoreline stabilization project. These include J. Wayles (Marine Discovery Center), A. Roddenberry (FL Fish & Wildlife Conservation Commission), D. Kolody (IRL National Estuary Program), G. Harrison and R. Carroll (FL Coastal Conservation Association), and P. Sacks (UCF).
Conflicts of Interest
The authors declare no conflict of interest.
References
- Dugan, J.; Airoldi, L.; Chapman, M.; Walker, S.; Schlacher, T. Estuarine and coastal structures: Environmental effects, a focus on shore and nearshore structures. Treatise Estuar. Coast. Sci. 2011, 8, 17–41. [Google Scholar] [CrossRef]
- Gittman, R.K.; Scyphers, S.B.; Smith, C.S.; Neylan, I.P.; Grabowski, J.H. Ecological consequences of shoreline hardening: A meta-analysis. BioScience 2016, 66, 763–773. [Google Scholar] [CrossRef] [PubMed]
- Peterson, N.E.; Landry, C.E.; Alexander, C.R.; Samples, K.; Bledsoe, B.P. Socioeconomic and environmental predictors of estuarine shoreline hard armoring. Sci. Rep. 2019, 9, 1–10. [Google Scholar] [CrossRef]
- Doody, J.P. Coastal squeeze-an historic perspective. J. Coast. Conserv. 2004, 10, 129–138. [Google Scholar] [CrossRef]
- Pontee, N. Defining coastal squeeze: A discussion. Ocean Coast. Manag. 2013, 84, 204–207. [Google Scholar] [CrossRef]
- Phan, L.K.; van Thiel de Vries, J.S.; Stive, M.J. Coastal mangrove squeeze in the Mekong Delta. J. Coast. Res. 2015, 31, 233–243. [Google Scholar] [CrossRef]
- Currin, C.A. Living Shorelines for Coastal Resilience. Coast. Wetl. 2019, 30, 1023–1053. [Google Scholar] [CrossRef]
- Bilkovic, D.M.; Mitchell, M.; Mason, P.; Duhring, K. The role of living shorelines as estuarine habitat conservation strategies. Coast. Manag. 2016, 44, 161–174. [Google Scholar] [CrossRef]
- Balke, T.; Bouma, T.; Horstman, E.; Webb, E.; Erftemeijer, P.; Herman, P. Windows of opportunity: Thresholds to mangrove seedling establishment on tidal flats. Mar. Ecol. Prog. Ser. 2011, 440, 1–9. [Google Scholar] [CrossRef]
- Motamedi, S.; Hashim, R.; Zakaria, R.; Song, K.; Sofawi, B. Long-term assessment of an innovative mangrove rehabilitation project: Case study on Carey Island, Malaysia. Sci. World J. 2014, 2014, 1–12. [Google Scholar] [CrossRef]
- Kodikara, K.A.; Mukherjee, N.; Jayatissa, L.P.; Dahdouh-Guebas, F.; Koedam, N. Have mangrove restoration projects worked? An in-depth study in Sri Lanka. Restor. Ecol. 2017, 25, 705–716. [Google Scholar] [CrossRef]
- Losada, I.J.; Lara, J.L.; Christensen, E.D.; Garcia, N. Modelling of velocity and turbulence fields around and within low-crested rubble-mound breakwaters. Coast. Eng. 2005, 52, 887–913. [Google Scholar] [CrossRef]
- Spiering, D.; Kibler, K.M.; Kitsikoudis, V. Hydrodynamic change following living shoreline restoration based on a before-after-control-impact experiment. World Environ. Water Resour. Cong. 2018, 54–64. [Google Scholar] [CrossRef]
- Moosavi, S. Ecological coastal protection: Pathways to living shorelines. Procedia Eng. 2017, 196, 930–938. [Google Scholar] [CrossRef]
- Hardy, T.; Wu, W. Impact of different restoration methods on coastal wetland loss in Louisiana: Bayesian analysis. Environ. Monit. Assess. 2020, 193, 1–15. [Google Scholar] [CrossRef]
- Chasten, M.; Rosati, J.; McCormick, J.; Randall, R. Engineering design guidance for detached breakwaters as shoreline stabilization structures. US Army Corps Eng. 1993. Available online: http://hdl.handle.net/1969.3/29278 (accessed on 28 September 2021).
- Birben, A.; Ozolcer, I.; Karasu, S.; Komurcu, M. Investigation of the effects of offshore breakwater parameters on sediment accumulation. Ocean Eng. 2007, 34, 284–302. [Google Scholar] [CrossRef]
- Morris, R.; Bilkovic, D.; Boswell, M.; Bushek, D.; Cebrian, J.; Goff, J.; Kibler, K.; La Peyre, M.; McClenachan, G.; Moody, J.; et al. The application of oyster reefs in shoreline protection: Are we over-engineering for an ecosystem engineer? J. Appl. Ecol. 2019, 56, 1703–1711. [Google Scholar] [CrossRef]
- Allen, R.; Webb, B. Determination of wave transmission coefficients for oyster shell bag breakwaters. Coast Eng. Pract. 2011, 684–697. [Google Scholar] [CrossRef]
- Webb, B.; Allen, R. Wave transmission through artificial reef breakwaters. In Proceedings of the Coastal Structures and Solutions to Coastal Disasters Joint Conference 2015, Boston, MA, USA, 9–11 September 2015; pp. 432–441. [Google Scholar] [CrossRef]
- Kamali, B.; Hashim, R. Mangrove restoration without planting. Ecol. Eng. 2011, 37, 387–391. [Google Scholar] [CrossRef]
- Tamin, N.M.; Zakaria, R.; Hashim, R.; Yin, Y. Establishment of Avicennia marina mangroves on accreting coastline at Sungai Haji Dorani, Selangor, Malaysia. Estuar. Coast. Shelf Sci. 2011, 94, 334–342. [Google Scholar] [CrossRef]
- Akbar, A.A.; Sartohadi, J.; Djohan, T.S.; Ritohardoyo, S. The role of breakwaters on the rehabilitation of coastal and mangrove forests in west Kalimantan, Indonesia. Ocean Coast. Manag. 2017, 138, 50–59. [Google Scholar] [CrossRef]
- Simanjuntak, P. Performance evaluation on low-crest breakwater at north coast of Java Island. J. Civil. Eng. Forum 2018, 4, 139–150. [Google Scholar] [CrossRef][Green Version]
- Piazza, B.P.; Banks, P.D.; La Peyre, M.K. The potential for created oyster shell reefs as a sustainable shoreline protection strategy in Louisiana. Restor. Ecol. 2005, 13, 499–506. [Google Scholar] [CrossRef]
- Scyphers, S.B.; Powers, S.P.; Heck, K.L., Jr.; Byron, D. Oyster reefs as natural breakwaters mitigate shoreline loss and facilitate fisheries. PLoS ONE 2011, 6, e22396. [Google Scholar] [CrossRef]
- Morris, R.L.; La Peyre, M.K.; Webb, B.M.; Marshall, D.A.; Bilkovic, D.M.; Cebrian, J.; McClenachan, G.; Kibler, K.; Walters, L.; Bushek, D.; et al. Large-scale variation in wave attenuation of oyster reef living shorelines and the influence of inundation duration. Ecol. Appl. 2021, 31, e2382. [Google Scholar] [CrossRef]
- Spiering, D.W.; Kibler, K.M.; Kitsikoudis, V.; Donnelly, M.J.; Walters, L.J. Detecting hydrodynamic changes after living shoreline restoration and through an extreme event using a before-after-control-impact experiment. Ecol. Eng. 2021, 169, 106306. [Google Scholar] [CrossRef]
- Baran, E.; Hambrey, J. Mangrove conservation and coastal management in southeast Asia. Mar. Pollut. Bull. 1999, 37, 431–440. [Google Scholar] [CrossRef]
- Ellison, A.M.; Bank, M.S.; Clinton, B.D.; Colburn, E.A.; Elliott, K.; Ford, C.R.; Foster, D.R.; Kloeppel, B.D.; Knoepp, J.D.; Lovett, G.M.; et al. Loss of foundation species: Consequences for the structure and dynamics of forested ecosystems. Front. Ecol. Environ. 2005, 3, 479–486. [Google Scholar] [CrossRef]
- Fatoyinbo, T.E.; Simard, M.; Washington-Allen, R.A.; Shugart, H.H. Landscape-scale extent, height, biomass, and carbon estimation of Mozambique’s mangrove forests with landsat ETM+ and shuttle radar topography mission elevation data. J. Geophys. Res. Biogeosci. 2008, 113, G02S06. [Google Scholar] [CrossRef]
- Carlton, J.M. Land-building and stabilization by mangroves. Environ. Conserv. 1974, 1, 285–294. [Google Scholar] [CrossRef]
- Faunce, C.; Serafy, J. Mangroves as fish habitat: 50 years of field studies. Mar. Ecol. Prog. Ser. 2006, 318, 1–18. [Google Scholar] [CrossRef]
- Estrada, G.C.; Soares, M.L.; Fernadez, V.; Almeida, P.M. The economic evaluation of carbon storage and sequestration as ecosystem services of mangroves: A case study from southeastern Brazil. Int. J. Biodivers. Sci. Ecosyst. Serv. Manag. 2014, 11, 29–35. [Google Scholar] [CrossRef]
- Gorman, D.; Turra, A. The role of mangrove revegetation as a means of restoring macrofaunal communities along degraded coasts. Sci. Total Environ. 2016, 566, 223–229. [Google Scholar] [CrossRef] [PubMed]
- Spalding, M.; Parrett, C.L. Global patterns in mangrove recreation and tourism. Mar. Policy 2019, 110, 103540. [Google Scholar] [CrossRef]
- Zhang, Y.; Ding, Y.; Wang, W.; Li, Y.; Wang, M. Distribution of fish among Avicennia and Sonneratia microhabitats in a tropical mangrove ecosystem in south China. Ecosphere 2019, 10, e02759. [Google Scholar] [CrossRef]
- Cahoon, D.R.; Hensel, P.; Rybczyk, J.; Mckee, K.L.; Proffitt, C.E.; Perez, B.C. Mass tree mortality leads to mangrove peat collapse at Bay Islands, Honduras after Hurricane Mitch. J. Ecol. 2003, 91, 1093–1105. [Google Scholar] [CrossRef]
- McClenachan, G.M.; Donnelly, M.J.; Shaffer, M.N.; Sacks, P.E.; Walters, L.J. Does size matter? Quantifying the cumulative impact of small-scale living shoreline and oyster reef restoration projects on shoreline erosion. Restor. Ecol. 2020, 28, 1365–1371. [Google Scholar] [CrossRef]
- Teas, H.J. Ecology and restoration of mangrove shorelines in Florida. Environ. Conserv. 1977, 4, 51–58. [Google Scholar] [CrossRef]
- Winterwerp, J.C.; Erftemeijer, P.L.; Suryadiputra, N.; Eijk, P.V.; Zhang, L. Defining eco-morphodynamic requirements for rehabilitating eroding mangrove-mud coasts. Wetlands 2013, 33, 515–526. [Google Scholar] [CrossRef]
- Peters, J.R.; Yeager, L.A.; Layman, C.A. Comparison of fish assemblages in restored and natural mangrove habitats along an urban shoreline. Bull. Mar. Sci. 2015, 91, 125–139. [Google Scholar] [CrossRef]
- Bayraktarov, E.; Saunders, M.I.; Abdullah, S.; Mills, M.; Beher, J.; Possingham, H.P.; Mumby, P.J.; Lovelock, C.E. The cost and feasibility of marine coastal restoration. Ecol. Appl. 2016, 26, 1055–1074. [Google Scholar] [CrossRef] [PubMed]
- Donnelly, M.; Shaffer, M.; Connor, S.; Sacks, P.; Walters, L. Using mangroves to stabilize coastal historic sites: Deployment success versus natural recruitment. Ecology 2017, 72, 1076–1088. [Google Scholar] [CrossRef]
- Kangas, P.; Lugo, A. The distribution of mangroves and saltmarsh in Florida. Trop. Ecol. 1990, 31, 32–39. [Google Scholar]
- Cavanaugh, K.C.; Kellner, J.R.; Forde, A.J.; Gruner, D.S.; Parker, J.D.; Rodriguez, W.; Feller, I.C. Poleward expansion of mangroves is a threshold response to decreased frequency of extreme cold events. Proc. Natl. Acad. Sci. USA 2014, 111, 723–727. [Google Scholar] [CrossRef] [PubMed]
- Cavanaugh, K.C.; Dangremond, E.M.; Doughty, C.L.; Williams, A.P.; Parker, J.D.; Hayes, M.A.; Rodriguez, W.; Feller, I.C. Climate-driven regime shifts in a mangrove–salt marsh ecotone over the past 250 years. Proc. Natl. Acad. Sci. USA 2019, 116, 21602–21608. [Google Scholar] [CrossRef] [PubMed]
- McKee, K.L. Soil physicochemical patterns and mangrove species distribution—Reciprocal effects? J. Ecol. 1993, 81, 477. [Google Scholar] [CrossRef]
- McKee, K.L. Growth and physiological responses of neotropical mangrove seedlings to root zone hypoxia. Tree Physiol. 1996, 16, 883–889. [Google Scholar] [CrossRef] [PubMed]
- Elster, C. Reasons for reforestation success and failure with three mangrove species in Colombia. For. Ecol. Manag. 2000, 131, 201–214. [Google Scholar] [CrossRef]
- Lewis, R.R. Ecological engineering for successful management and restoration of mangrove forests. Ecol. Eng. 2005, 24, 403–418. [Google Scholar] [CrossRef]
- Primavera, J.H.; Esteban, J.M. A review of mangrove rehabilitation in the Philippines: Successes, failures and future prospects. Wetl. Ecol. Manag. 2008, 16, 345–358. [Google Scholar] [CrossRef]
- Samson, M.S.; Rollon, R.N. Growth performance of planted mangroves in the Philippines: Revisiting forest management strategies. J. Hum. Environ. 2008, 37, 234–240. [Google Scholar] [CrossRef]
- Ball, M.C. Ecophysiology of mangroves. Trees 1988, 2, 129–142. [Google Scholar] [CrossRef]
- Ball, M.C. Mangrove conservation and coastal management in southeast Asia: What impact on fishery resources? Glob. Ecol. Biogeogr. Lett. 1998, 7, 73–82. [Google Scholar] [CrossRef]
- Krauss, K.W.; Doyle, T.W.; Twilley, R.R.; Rivera-Monroy, V.H.; Sullivan, J.K. Evaluating the relative contributions of hydroperiod and soil fertility on growth of south Florida mangroves. Hydrobiologia 2006, 569, 311–324. [Google Scholar] [CrossRef]
- Lara, R.J.; Cohen, M.C. Sediment porewater salinity, inundation frequency and mangrove vegetation height in Bragança, North Brazil: An ecohydrology-based empirical model. Wetl. Ecol. Manag. 2006, 14, 349–358. [Google Scholar] [CrossRef]
- Evans, L.S.; Okawa, Y.; Searcy, D.G. Anatomy and morphology of red mangrove (Rhizophora mangle) plants in relation to internal airflow. J. Torrey Bot. Soc. 2005, 132, 537–550. [Google Scholar] [CrossRef]
- Kathiresan, K.; Bingham, B.L. Biology of mangroves and mangrove ecosystems. Adv. Mar. Biol. 2001, 40, 81–251. [Google Scholar] [CrossRef]
- Lewis, R.R.; Haines, K.C. Large scale mangrove restoration on St. Croix, US Virgin Islands. In Proceedings of the Sixth Annual Conference on Restoration and Creation of Wetlands, Tampa, FL, USA, 19 May 1979; pp. 231–242. [Google Scholar]
- Goforth, H.W., Jr.; Thomas, J.R. Plantings of Red Mangroves (Rhizophora mangle L.) for Stabilization of Marl Shorelines in the Florida Keys; Naval Ocean Systems Center: San Diego, CA, USA, 1980. [Google Scholar]
- St Johns River Water Management District. 2021. Available online: https://permitting.sjrwmd.com/ep/#/ep (accessed on 22 October 2018).
- Gorman, R.M.; Neilson, C.G. Modelling shallow water wave generation and transformation in an intertidal estuary. Coast. Eng. 1999, 36, 197–217. [Google Scholar] [CrossRef]
- Bilkovic, D.; Mitchell, M.; Davis, J.; Andrews, E.; King, A.; Mason, P.; Herman, J.; Tahvildari, N.; Davis, J. Review of Boat Wake Wave Impacts on Shoreline Erosion and Potential Solutions for the Chesapeake Bay. 2017 STAC Publication Number 17-002, Edgewater, MD. p. 68. Available online: https://scholarworks.wm.edu/cgi/viewcontent.cgi?article=2270&context=reports (accessed on 17 August 2019).
- Walters, L.J.; Sacks, P.; Campbell, D. Boating impacts and boat-wake resilient restoration of the eastern oyster Crassostrea virginica in Mosquito Lagoon, Florida, USA. In Proceedings of the Indian River Lagoon Symposium 2020, Fort Pierce, FL, USA, 13–14 February 2020. [Google Scholar]
- Boizard, S.D.; Mitchell, S.J. Resistance of red mangrove (Rhizophora mangle L.) seedlings to deflection and extraction. Trees 2010, 25, 371–381. [Google Scholar] [CrossRef]
- Schutten, J.; Dainty, J.; Davy, A.J. Root anchorage and its significance for submerged plants in shallow lakes. J. Ecol. 2005, 93, 556–571. [Google Scholar] [CrossRef]
- Pilato, C. Hydrodynamic Limitations and the Effects of Living Shoreline Stabilization on Mangrove Recruitment along Florida Coastlines. Master’s Thesis, University of Central Florida, Orlando, FL, USA, 2019. UCF Stars. Available online: https://stars.library.ucf.edu/cgi/viewcontent.cgi?article=7687&context=etd (accessed on 23 March 2019).
- Bywater-Reyes, S.; Wilcox, A.C.; Stella, J.C.; Lightbody, A.F. Flow and scour constraints on uprooting of pioneer woody seedlings. Water Resour. Res. 2015, 51, 9190–9206. [Google Scholar] [CrossRef]
- Craighead, F.C.; Gilbert, V.C. The effects of Hurricane Donna on the vegetation of southern Florida. Q. J. Fla. Acad. Sci. 1962, 25, 1–28. Available online: https://www.jstor.org/stable/24315186 (accessed on 21 March 2019).
- Terrados, J.; Thampanya, U.; Srichai, N.; Kheowvongsri, P.; Geertz-Hansen, O.; Boromthanarath, S.; Panapitukkul, N.; Duarte, C. The effect of increased sediment accretion on the survival and growth of Rhizophora apiculata seedlings. Estuar. Coast. Shelf Sci. 1997, 45, 697–701. [Google Scholar] [CrossRef]
- McKee, K.L.; Mendelssohn, I.A.; Hester, M.W. Reexamination of pore water sulfide concentrations and redox potentials near the aerial roots of Rhizophora mangle and Avicennia germinans. Am. J. Bot. 1988, 75, 1352–1359. [Google Scholar] [CrossRef]
- Farnsworth, E.J.; Ellison, A.M. Sun-shade adaptability of the red mangrove, Rhizophora mangle (Rhizophoraceae): Changes through ontogeny at several levels of biological organization. Am. J. Bot. 1996, 83, 1131–1143. [Google Scholar] [CrossRef]
- Donnelly, M.; Walters, L. Trapping of Rhizophora mangle propagules by coexisting early successional species. Estuar. Coast. 2014, 37, 1562–1571. [Google Scholar] [CrossRef]
- Teutli-Hernández, C.; Herrera-Silveira, J.A.; Comín, F.A.; López, M.M. Nurse species could facilitate the recruitment of mangrove seedlings after hydrological rehabilitation. Ecol. Eng. 2019, 130, 263–270. [Google Scholar] [CrossRef]
- Sousa, W.P.; Quek, S.P.; Mitchell, B.J. Regeneration of Rhizophora mangle in a Caribbean mangrove forest: Interacting effects of canopy disturbance and a stem-boring beetle. Oecologia 2003, 137, 436–445. [Google Scholar] [CrossRef]
- López-Hoffman, L.; Ackerly, D.D.; Anten, N.P.; Denoyer, J.L.; Martinez-Ramos, M. Gap-dependence in mangrove life-history strategies: A consideration of the entire life cycle and patch dynamics. J. Ecol. 2007, 95, 1222–1233. [Google Scholar] [CrossRef]
- Sánchez-Núñez, D.A.; Pineda, J.E.M.; Osorio, A.F. From local-to global-scale control factors of wave attenuation in mangrove environments and the role of indirect mangrove wave attenuation. Estuar. Coast. Shelf Sci. 2020, 245, 106926. [Google Scholar] [CrossRef]
- Chapman, M.G.; Roberts, D.E. Use of seagrass wrack in restoring disturbed Australian saltmarshes. Ecol. Manag. Restor. 2004, 5, 183–190. [Google Scholar] [CrossRef]
- Breithaupt, J.L.; Duga, E.; Witt, M.; Fillyaw, R.; Friedland, N.; Donnelly, M.J.; Walters, L.J.; Chambers, L.G. Carbon and nutrient fluxes from seagrass and mangrove wrack are mediated by soil interactions. Estuar. Coast. Shelf Sci. 2019, 229, 106409. [Google Scholar] [CrossRef]
- Riley, R.; Kent, C. Riley encased methodology: Principles and processes of mangrove habitat creation and restoration. Mangroves Salt Marshes 1999, 2, 207–213. [Google Scholar] [CrossRef]
- Hashim, R.; Kamali, B.; Tamin, N.M.; Zakaria, R. An integrated approach to coastal rehabiliation: Mangrove restoration in Sungai Haji Dorani, Malaysia. Estuar. Coast. Shelf Sci. 2010, 86, 118–124. [Google Scholar] [CrossRef]
- Van Cuong, C.; Brown, S.; To, H.H.; Hockings, M. Using Melaleuca fences as soft coastal engineering for mangrove restoration in Kien Giang, Vietnam. Ecol. Eng. 2015, 81, 256–265. [Google Scholar] [CrossRef]
- Jayarathne, K.; Rajapaksha, R.; Suraweera, P.; Wickramasinghe, W. Establishing of mangroves in Malala Lagoon, Bundala, Sri Lanka: Successes, failures, and future prospects. Wildlanka 2020, 8, 120–127. [Google Scholar]
- Myszewski, M.; Alber, M. Living shorelines in the southeast: Research and data gaps. In Report prepared for the Governor’s South Atlantic Alliance by the Georgia Coastal Research Council; University of Georgia: Athens, Greece, 2016; Available online: http://southatlanticalliance.org/wp-content/uploads/2016/09/Living-Shorelines-in-the-Southeast.pdf (accessed on 29 August 2021).
- Morris, R.L.; Konlechner, T.M.; Ghisalberti, M.; Swearer, S. From grey to green: Efficacy of eco-engineering solutions for nature-based coastal defense. Glob. Chang. Biol. 2018, 24, 1827–1842. [Google Scholar] [CrossRef]
- Dybas, C.L. Florida’s Indian River Lagoon: An estuary in transition. BioScience 2002, 52, 555. [Google Scholar] [CrossRef]
- Provancha, J.A. Mosquito Lagoon Environmental Resources Inventory; National Aeronautics and Space Administration: Merritt Island, FL, USA, 1992; p. 107548. [Google Scholar]
- Smith, N.P. An introduction to the tides of Florida’s Indian River Lagoon. I. water levels. Fla. Sci. 1987, 50, 49–61. Available online: https://www.jstor.org/stable/24319868 (accessed on 8 March 2021).
- Smith, N.P. Tidal and nontidal flushing of Florida’s Indian River Lagoon. Estuaries 1993, 16, 739. [Google Scholar] [CrossRef]
- Brockmeyer, R.E.; Rey, J.R.; Virnstein, R.W.; Gilmore, R.G.; Earnest, L. Rehabilitation of impounded estuarine wetlands by hydrologic reconnection to the Indian River Lagoon, Florida (USA). Wetl. Ecol. Manag. 1996, 4, 93–109. [Google Scholar] [CrossRef]
- Grizzle, R.E. Distribution and abundance of Crassostrea virginica (Gmelin, 1791)(eastern oyster) and Mercenaria spp.(quahogs) in a coastal lagoon. J. Shellfish Res. 1990, 9, 347–358. [Google Scholar]
- Kibler, K.M.; Donnelly, M.; Cannon, D.; Phagan, J.; Walters, L.; McClenachan, G.; Roddenberry, A. Developing a shoreline restoration suitability model for North Indian River and Mosquito Lagoon, Phase II. 2020, Indian River Lagoon National Estuaries Program Report IRL2018-017. Available online: https://stars.library.ucf.edu/shorelines/ (accessed on 15 May 2021).
- National Park Service. Timucuan Ways of Life. 2020, Retrieved 6 January 2021. Available online: https://www.nps.gov/timu/learn/timuwaysoflife.htm (accessed on 7 January 2021).
- Wolman, M.G. A method of sampling coarse river-bed material. Trans. Am. Geophys. Union 1954, 35, 951. [Google Scholar] [CrossRef]
- Fillyaw, R.M. Personal Observation, 2019–2020; University of Central Florida: Orlando, FL, USA, 2020. [Google Scholar]
- Cappucci, M. Stunning Portraits of Hurricane Dorian’s Fury. 2019. Available online: https://www.washingtonpost.com/weather/2019/09/07/stunning-portraits-hurricane-dorians-fury/ (accessed on 5 January 2021).
- Butler, A. Spared: Hurricane Dorian: Tropical Storm. 2019. Available online: https://daytonatimes.com/2019/09/07/spared/ (accessed on 10 March 2021).
- Anderson, C.; Lee, S.Y. Defoliation of the mangrove Avicennia marina in Hong Kong: Cause and consequences. Biotropica 1995, 27, 218–226. [Google Scholar] [CrossRef]
- Feller, I.C. Effects of nutrient enrichment on growth and herbivory of dwarf red mangrove (Rhizophora mangle). Ecol. Monogr. 1995, 65, 477–505. [Google Scholar] [CrossRef]
- Imbert, D.; Rousteau, A.; Scherrer, P. Ecology of mangrove growth and recovery in the Lesser Antilles: State of knowledge and basis for restoration projects. Restor. Ecol. 2000, 8, 230–236. [Google Scholar] [CrossRef]
- Duke, N.C. Sustained high levels of foliar herbivory of the mangrove Rhizophora stylosa by a moth larva Doratifera stenosa (Limacodidae) in north-eastern Australia. Wetl. Ecol. Manag. 2002, 10, 403–419. [Google Scholar] [CrossRef]
- Cannon, D.; Kibler, K.; Donnelly, M.; McClenachan, G.; Walters, L.; Roddenberry, A.; Phagan, J. Hydrodynamic habitat thresholds for mangrove vegetation on the shorelines of a microtidal estuarine lagoon. Ecol. Eng. 2020, 158, 106070. [Google Scholar] [CrossRef]
- ESRI. ArcGIS Desktop: 10.6; Environmental Systems Research Institute: Redlands, CA, USA, 2018. [Google Scholar]
- Rick, T.C.; Erlandson, J.M.; Vellanoweth, R.L. Taphonomy and site formation on California’s Channel Islands. Geoarchaeology 2006, 21, 567–589. [Google Scholar] [CrossRef]
- Hair, J.R.; Anderson, R.E.; Tatham, R.L.; Black, W.C. Multivariate Data Analysis with Readings; Prentice Hall: Englewood, NJ, USA, 1995. [Google Scholar]
- R Core Team. R: A Language and Environment for Statistical Computing; R Foundation for Statistical Computing: Vienna, Austria, 2018; Available online: https://www.R-project.org/ (accessed on 22 September 2021).
- Chen, L.Z.; Lin, P.; Wang, W.Q. Mechanisms of mangroves waterlogging resistance. Acta Ecol. Sin. 2006, 26, 586–593. [Google Scholar]
- Tamai, S.; Iampa, P. Establishment and growth of mangrove seedling in mangrove forests of southern Thailand. Ecol. Res. 1988, 3, 227–238. [Google Scholar] [CrossRef]
- Ashton, E.C.; Macintosh, D.J. Preliminary assessment of the plant diversity and community ecology of the sematan mangrove forest, Sarawak, Malaysia. For. Ecol. Manag. 2002, 166, 111–129. [Google Scholar] [CrossRef]
- Feller, I.C.; Whigham, D.F.; McKee, K.L.; Lovelock, C.E. Nitrogen limitation of growth and nutrient dynamics in a disturbed mangrove Forest, Indian River Lagoon, Florida. Oecologia 2003, 134, 405–414. [Google Scholar] [CrossRef]
- Bouchon, C.; Bouchon-Navaro, Y.; Louis, M. Changes in the coastal fish communities following Hurricane Hugo in Guadelope Island (French West Indies). Atoll Res. Bull. 1994, 422, 1–13. [Google Scholar] [CrossRef]
- Hoppe-Speer, S.C.; Adams, J.B.; Rajkaran, A.; Bailey, D. The response of the red mangrove Rhizophora mucronata Lam. to salinity and inundation in South Africa. Aquat. Bot. 2011, 95, 71–76. [Google Scholar] [CrossRef]
- Cody, M.L. Do cholla cacti (Opuntia spp., subgenus Cylindropuntia) use or need nurse plants in the Mojave Desert? Arid Environ. 1993, 24, 139–154. [Google Scholar] [CrossRef]
- Ashton, P.M.; Gamage, S.; Gunatilleke, I.A.; Gunatilleke, C.V. Restoration of a Sri lankan rainforest: Using Caribbean pine Pinus Caribaea as a nurse for establishing late-successional tree species. Appl. Ecol. 1997, 34, 915. [Google Scholar] [CrossRef]
- Dulohery, C.; Kolka, R.; McKevlin, M. Effects of a willow overstory on planted seedlings in a bottomland restoration. Ecol. Eng. 2000, 15, S57–S66. [Google Scholar] [CrossRef]
- Valenzuela, P.; Arellano, E.C.; Burger, J.A.; Becerra, P. Using facilitation microsites as a restoration tool for conversion of degraded grasslands to nothofagus forests in Souther Patagonia. Ecol. Eng. 2016, 95, 580–587. [Google Scholar] [CrossRef]
- De Steven, D. Experiments on mechanisms of tree establishment in old-field succession: Seedling survival and growth. Ecology 1991, 37, 1562–1571. [Google Scholar] [CrossRef]
- Callaway, R.M.; Walker, L.R. Competition and facilitation: A synthetic approach to interactions in plant communities. Ecology 1997, 78, 1958–1965. [Google Scholar] [CrossRef]
- Coomes, D.A.; Allen, R.B. Effects of size, competition and altitude on tree growth. J. Ecol. 2007, 95, 1084–1097. [Google Scholar] [CrossRef]
- Gómez-Aparicio, L. The role of plant interactions in the restoration of degraded ecosystems: A meta-analysis across life-forms and ecosystems. J. Ecol. 2009, 97, 1202–1214. [Google Scholar] [CrossRef]
- Gill, A.M.; Tomlinson, P.B. Studies on the growth of red mangrove (Rhizophora mangle L.) 3. Phenology of the shoot. Biotropica 1971, 3, 109. [Google Scholar] [CrossRef]
- Ball, M.C. Patterns of secondary succession in a mangrove forest of Southern Florida. Oecologia 1980, 44, 226–235. [Google Scholar] [CrossRef]
- Ellison, A.M.; Farnsworth, E.J. Simulated sea level change alters anatomy, physiology, growth, and reproduction of red mangrove (Rhizophora mangle L.). Oecologia 1997, 112, 435–446. [Google Scholar] [CrossRef]
- Pezeshki, S.; Delaune, R.; Meeder, J. Carbon assimilation and biomass partitioning in Avicennia germinans and Rhizophora mangle seedlings in response to soil redox conditions. Environ. Exp. Bot. 1997, 37, 161–171. [Google Scholar] [CrossRef]
- Pool, D.J.; Snedaker, S.C.; Lugo, A.E. Structure of mangrove forests in Florida, Puerto Rico, Mexico, and Costa Rica. Biotropica 1977, 9, 195. [Google Scholar] [CrossRef]
- Lovelock, C.E.; Feller, I.C.; Reef, R.; Hickey, S.; Ball, M.C. Mangrove dieback during fluctuating sea levels. Sci. Rep. 2017, 52, 887–913. [Google Scholar] [CrossRef]
- Provost, M.W. Mean high water mark and use of tidelands in Florida. Fla. Sci. 1973, 36, 50–66. Available online: https://www.jstor.org/stable/24319677 (accessed on 15 February 2020).
- Balke, T.; Webb, E.L.; Den Elzen, E.; Galli, D.; Herman, P.M.; Bouma, T.J. Seedling establishment in a dynamic sedimentary environment: A conceptual framework using mangroves. J. Appl. Ecol. 2013, 50, 740–747. [Google Scholar] [CrossRef]
- Achab, M.; Ferreira, O.; Dias, J.A. Evaluation of sedimentological and morphological changes induced by the rehabilitation of sandy beaches from the Ria Formosa Barrier Island system (South Portugal). Thalassas 2014, 30, 21–31. [Google Scholar]
- Palinkas, C.M.; Sanford, L.P.; Koch, E.W. Influence of shoreline stabilization structures on the nearshore sedimentary environment in mesohaline Chesapeake Bay. Estuar. Coast. 2017, 41, 952–965. [Google Scholar] [CrossRef]
- Fitri, A.; Hashim, R.; Abolfathi, S.; Abdul Maulud, K.N. Dynamics of sediment transport and erosion-deposition patterns in the locality of a detached low-crested breakwater on a cohesive coast. Water 2019, 11, 1721. [Google Scholar] [CrossRef]
- Vona, I.; Gray, M.; Nardin, W. The impact of submerged breakwaters on sediment distribution along marsh boundaries. Water 2020, 12, 1016. [Google Scholar] [CrossRef]
- Peterson, C.H.; Bishop, M.J.; D’Anna, L.M.; Johnson, G.A. Multi-year persistence of beach habitat degradation from nourishment using coarse shelly sediments. Sci. Total Environ. 2014, 487, 481–492. [Google Scholar] [CrossRef] [PubMed]
- Horstman, E.M.; Dohmen-Janssen, C.M.; Narra, P.M.F.; Van den Berg, N.J.F.; Siemerink, M.; Hulscher, S.J. Wave attenuation in mangroves: A quantitative approach to field observations. Coast. Eng. 2014, 94, 47–62. [Google Scholar] [CrossRef]
- Rifenberg, J.; Litwak, J.; Fillyaw, R.M. Vertebrate impact on a newly deployed shoreline stabilization project by wildlife camera analysis. Pegasus Rev. UCF Undergrad. Res. J. 2021, 13, 25–36. Available online: https://stars.library.ucf.edu/urj/vol13/iss2/3 (accessed on 8 April 2021).


Publisher’s Note: MDPI stays neutral with regard to jurisdictional claims in published maps and institutional affiliations. |
© 2021 by the authors. Licensee MDPI, Basel, Switzerland. This article is an open access article distributed under the terms and conditions of the Creative Commons Attribution (CC BY) license (https://creativecommons.org/licenses/by/4.0/).