Article

Influence of Plant Leaf Moisture Content on Retention of Electrostatic-Induced Droplets

1
Key Laboratory of Plant Protection Engineering, Ministry of Agriculture and Rural Affairs, Zhenjiang 212013, China
2
Department of Agricultural Engineering, Bahauddin Zakariya University, Multan 60800, Pakistan
*
Author to whom correspondence should be addressed.
Sustainability 2021, 13(21), 11685; https://doi.org/10.3390/su132111685
Submission received: 2 September 2021 / Revised: 18 October 2021 / Accepted: 20 October 2021 / Published: 22 October 2021
(This article belongs to the Topic Insects in Sustainable Agroecosystems)

Abstract

:
Agricultural electrostatic spraying can help to reduce the threat of pesticides to human health and the environment. However, the influence of the law of leaf water content on electrostatic spraying has not been studied. In this study, we used leaf water content as an evaluation index of electrostatic spraying technology and verified the correlation between leaf water content and leaf capacitance value by statistical methods in order to achieve in vivo measurements of leaf water content in relation to tomato, pepper, and wheat crop leaves. Using these in vivo measurements of leaf water content and retention, we demonstrate that the retention of electrostatic droplets on the leaves of all three crops increases with increasing water content; the retention per unit area of leaves increased by 6.1 mg / cm 2 , an increase of 7.29%. Increasing the electrostatic spray voltage (10~30 kV) enhances the retention of droplets on the leaves of the crops, with a maximum increase of 6.1. The retention of non-electrostatic droplets decreases with increasing water content; retention at the lowest water content was 1.103~1.131 times greater than at the highest water content. This study has implications for research related to improving the retention of electrostatic droplets in leaves.

1. Introduction

Agricultural electrostatic spraying technology is superior to non-electrostatic spraying technology [1,2]. Electrostatic droplets have better “adhesion, penetration, and encircling ability” in crops [3,4,5]. Electrostatic spraying technology is used to charge droplets to induce an electric field on the surface of the crop leaves, thus adsorbing electrostatic droplets and achieving directional movement of the charged droplets. The attraction of the electric field on the crop surface to the charged droplets can be divided into two cases. The first is the group of charged droplets attracted to the plant surface, which facilitates the target movement of the droplets toward the crop. In the second case, when the droplets are close enough to the crop, the attractive forces are sufficient to overcome the gravitational, inertial and drag forces on the droplets, changing their trajectory and inducing them to move towards the target plant and adhere to its surface, thus increasing the adsorption force.
Currently, electrostatic spraying systems and parameter optimization, charged droplet–environment interactions, and target parameters are the three main aspects of research on plant protection electrostatic spraying technology [6,7]. Research on electrostatic spraying systems and parameter optimization has focused on electrostatic nozzle development [8,9], charging effect [10], atomization mechanism, and operational parameters [2,11]. For droplet charging there are mainly three approaches: corona charging, inductive charging, and contact charging. Among these, contact charging has a good charging effect and is widely used in backpack electrostatic sprayers, whose operating voltage is generally 10~30 kV.
The interaction between charged droplets and the environment is mainly focused on relative temperature and humidity, airflow rate [12], electrostatic force [13,14], and fluid simulation [15]. The study of target crop parameters at the whole-plant scale has focused on the effects of canopy shape [16], size and leaf area index [17], and electrostatic spraying; at the leaf scale, the effects of leaf material and leaf inclination have also been investigated. Using a 0.5 mm-thick aluminum plate as the simulated crop leaf material, spray deposition was used as an evaluation index to study the electrostatic droplet deposition at different leaf inclination angles (relative to the horizontal plane) on the spray droplet deposition effect; it was found that deposition increased with the increase in leaf inclination [2]. The deposition of droplets on different materials was also investigated and it was found that deposition decreases in the order of metals, real leaves and plastic materials [18]. Therefore, leaf material is important for the establishment of the electric field, droplet adsorption, and current conduction-induced electric field on the leaf; this is understood to be caused by differences in the leaf dielectric parameters.
Several studies have reported a positive correlation between leaf dielectric constant and leaf water content [19,20,21]. The dielectric constant is a function of various factors including plant type and age, soil nutrient level, leaf solute concentration, and leaf water content. Usually, leaf dielectric constants are attributed to resistance and capacitance [19]. During agricultural electrostatic spraying, the electric field created by charged droplets moves ions in the plant tissue and collects charges of opposite polarity to the charged droplets on the leaves, thus increasing the capacitive effect of the leaves [22]. Therefore, the effect of leaf capacitance on electrostatic spraying is very important. Leaf capacitance values are often used to measure the water content of plant leaves and are considered to be a function of the water content within the leaf and the measurement frequency [23,24,25]. A capacitive sensor with a parallel capacitance plate was used to measure the water content of leaf slices. A positive correlation between sensor capacitance and leaf water content was observed at different measurement frequencies (100 kHz and 1 MHz) [21]. Changing the leaf water content to achieve a change in the control of the leaf dielectric constant (capacitance value) was applied in this study. Additionally, the capacitance sensor has the advantages of high measurement accuracy and non-invasiveness. Using the capacitive method to measure the dielectric constant of the leaf, the leaf is not damaged and continuous measurement of the leaf-holding capacity and water content can be ensured [26,27]. Therefore, in this study, we investigate the law of the effect of this change on electrostatic spraying technology by changing the leaf water content, causing a change in leaf capacitance.
The agricultural spraying process is divided into deposition, retention, absorption, and transfer [28,29], of which retention is a key indicator of the effectiveness of agricultural spraying technology. A variety of factors can affect the retention of electrostatic droplets on the crop surface. The studied factors are mainly focused on plant characteristics and droplet properties. Droplet retention is also strongly dependent on the type of leaf surface and microstructure [30]. A large number of plant species, including weeds and crops as well as fruits and leaves, have been investigated in order to predict spray droplet retention [31]. In this paper, the effects of multiple leaf surface properties and variations in leaf capacitance on electrostatic spray deposition efficiency are considered.
We investigated the effects of leaf capacitance and water content variations on electrostatic spraying technology by varying the water content of in vivo crop leaves, and thus the leaf capacitance, using leaf retention as a spraying effect evaluation index with reference to three crops as research objects.

2. Materials and Methods

2.1. Crop Materials

Three widely grown crops were studied: pepper (Capsicum annuum L.), tomato (Lycopersicon esculentum), and winter wheat (Triticum aestivum L.). The seedlings of pepper and tomato plants were cultured separately in round platform-type pots with a diameter of 20 cm at the bottom, 35 cm at the top, and 25 cm in height. The culture substrate was perlite, which has good water retention, root fixation, and water, vapor, and fertilizer exchange, and was irrigated once a day with 200 mL of nutrient solution formulated in Yamazaki, Japan [32]. Winter wheat plants were cultured at Jingdong Farm in Zhenjiang New District, China ( 32.143 °   N ,   119.773 °   E ), 30 days in advance, and winter wheat plants were transplanted and cultured in pots in the laboratory. The greenhouse temperature was 25 °C during the day and 20 °C at night, relative humidity was 70%, and light conditions were long daylight hours—16 h of light and 8 h of darkness—with leafy vegetable supplemental light (WEN-2, Shandong Guixiang Photoelectric Co., Ltd., Weifang, China) used for supplemental light when daylight conditions were insufficient. Mature and healthy crop leaves were selected for the experiment. One day before the start of the experiment, 15 plants of each crop were randomly selected and moved into a separate greenhouse environment, where the daylight hours were adjusted to 12 h of light and 12 h of darkness, and the temperature was set to 25 °C during the day and 20 °C at night, with adequate watering. The test sample plants were not watered for the next 7 days as a way to produce changes in water content.
The surface morphology of the leaves of the three crops (Figure 1) showed that the leaves of tomato plants were 10~25 cm in length, oddly pinnate, with 5~9 leaflets on the petiole; each leaflet was 8 cm in length with serrated margins, and all leaves had sparse glandular hairs. The length of pepper leaves was 10~13 cm. The leaves of pepper had a waxy surface, no burrs, and wrinkled leaf margins. Winter wheat leaves were 25 cm in length, with smooth, hairless, and shiny surfaces, short and hairy auricles, and narrow lance-shaped leaves. For the three crops, mature and healthy leaves were selected for the experiment.

2.2. Experimental Setup

Study of the effect of changes in water content of living leaves on the retention of electrostatic droplets in crop leaves required the measurement of water content and leaf retention in the active state of the leaves. To characterize the relationship between crop leaf capacitance and water content and their relationship with electrostatic spraying, an electrostatic spraying system, a retention measurement device, and an LCR meter were used in this paper.

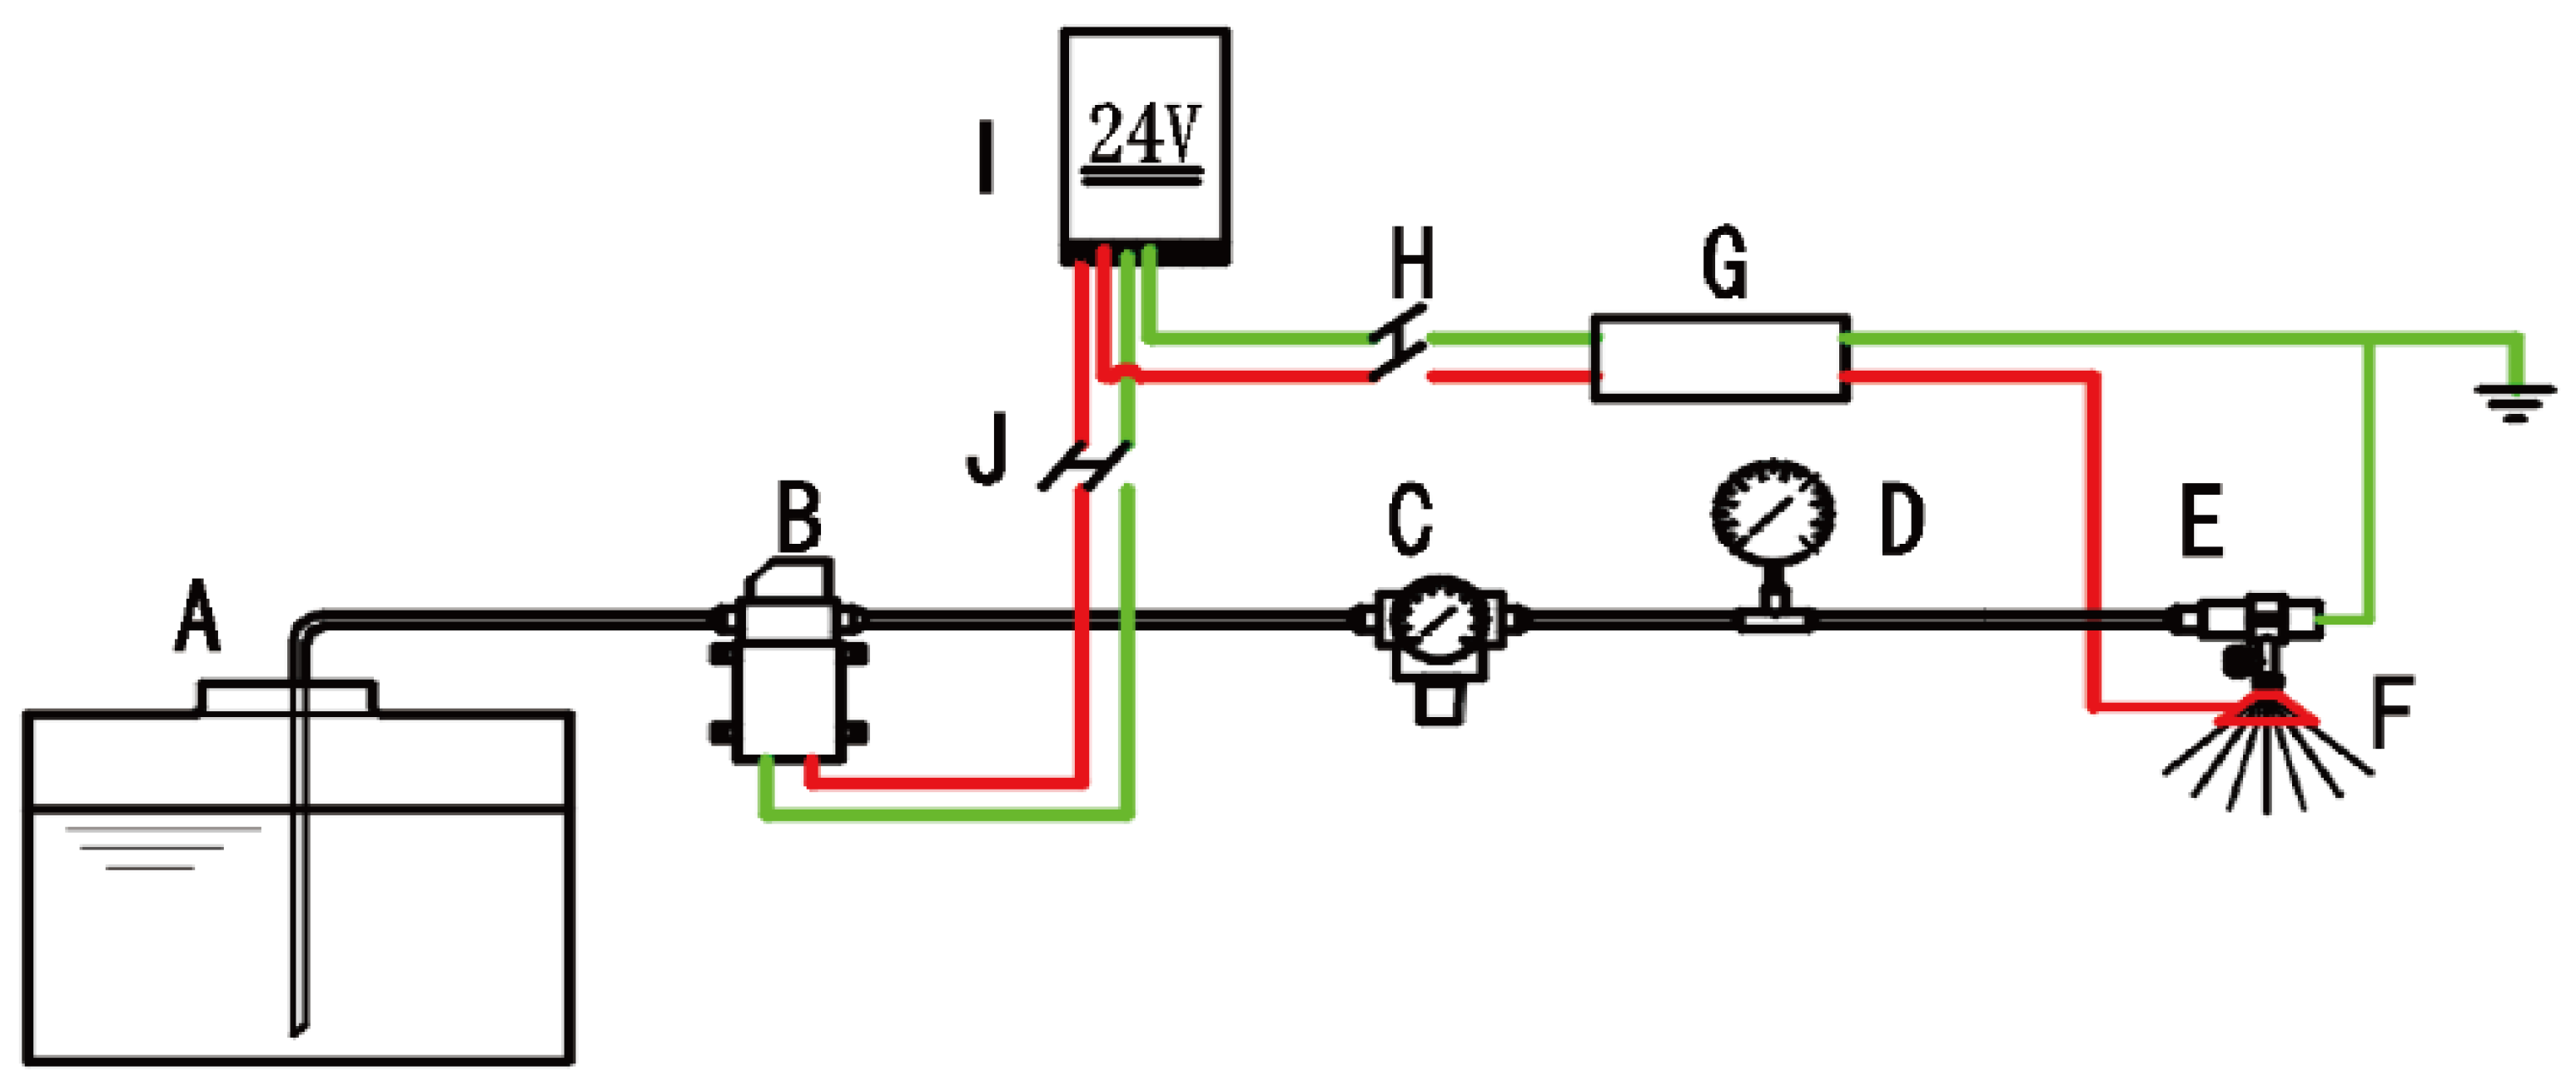
2.2.1. Electrostatic Spraying System

Figure 2 shows the electrostatic spray system used in this study, which was composed of two parts: a spray device and a charging device. Table 1 shows the parameter values of the main equipment of the spraying system. The spray device was mainly composed of a medicine tank, a diaphragm pump, a diaphragm pump power switch, a pressure regulating valve, a throttle valve, a pressure gauge, and a sector nozzle. The medicine tank was used to store the liquid; the diaphragm pump was used to provide pipeline pressure; the pressure regulating valve and the pressure gauge were used to regulate and observe the spray pressure; and the liquid was atomized by the sector nozzle ST110-02 (LECHLER Co., Stuttgart, Germany). The spray system was connected by a PVC (Polyvinyl Chloride) hose and a pneumatic quick connector. The charged device consisted of an electrostatic generating power source, a cone electrode, and an electrostatic switch. The electrostatic generator was used to generate the charging voltage; the cone electrode of the electrostatic nozzle was connected to the negative electrode of the electrostatic generator, and the droplets were induced as positively charged droplets according to the charging principle. Because the crops are rooted in earth, they were induced with negative charges. The charging device was connected by a wire. Because the pipeline pressure adjustable range of the spray system was 0.2 to 0.5 MPa, the sector nozzle was located directly above the target leaf at a height of 500 mm. The spray device and the charging device were both powered by a 12 V DC switching power source. To avoid the effect of the drug on the physiological state of the leaf, the source of error was reduced, and tap water was used as a spray medium. The sector nozzle space was placed with the fan surface of the nozzle perpendicular to the laser beam of the laser particle meter, located in the middle of the laser emitter and receiver, with the laser beam at a vertical height of 500 mm.

2.2.2. Droplet Retention Measuring Device

The droplet retention measurement device was used to obtain droplet population retention by measuring the gravity of the droplet population deposited on the target leaf. Figure 3 shows the composition of the droplet retention device, which mainly consisted of an electronic balance, rod support, force transmission rod, leaf-carrying glass flakes, droplet shield, laptop computer, and data cable. The electronic balance (YP15K-1, Shanghai Liangping Instrument Co., Ltd., Shanghai, China, Precision, 0.01 g) was preloaded with a dynamic weighing application to determine the dynamic mass of droplet populations in the spray state. The electronic balance was connected to a laptop computer via USB to an RS232 (DB9) serial cable. The laptop computer could control the measurement start and stop times and save the droplet population dynamic mass data in real-time through the application. A leaf-carrier glass sheet (5 mm × 10 mm × 1 mm) was used to hold the crop leaf in place, and double-sided tape was used to smoothly adhere the back of the target leaf to the surface of the leaf-carrier glass sheet, which was angled at 30° horizontally (clockwise). The transfer linkage was made of hard aluminum alloy (LY12CZ) in order to ensure better dynamic mass transfer, and its surface sprayed with superhydrophobic solution so that no droplets could be deposited on the surface of the transfer linkage, in order to reduce the measurement error caused by droplet adhesion on the transfer linkage. During the spraying process, the mass of the droplet group held on the leaf surface was transferred to the electronic balance by the dynamic force signal through the force transfer linkage and the linkage support. The linkage support was fixed to the geometric center of the electronic balance tray. In order to prevent droplets from being deposited on the tray of the electronic balance, a shield was used to avoid the influence of the remaining droplets on the measurements. The shield housing was made of metal, and used to wrap the electronic balance in order to shield the measurement system from excess droplets; it was connected via wire to the negative terminal of the high-voltage electrostatic power supply.

2.3. Leaf Characterization

2.3.1. Capacitance

A positive correlation between leaf water content and leaf capacitance has been demonstrated. Studies have shown that tea leaf water content is related to crop species, photosynthetic intensity, leaf solute concentration, leaf thickness, and detection frequency [19]. Therefore, in this study, we established a relationship between leaf water content and leaf capacitance in pepper, tomato, and wheat plants under culture conditions to estimate leaf water content more accurately.
In vivo leaf capacitance measurements were carried out on moderately mature leaves of each crop, and the measurement area was chosen so as to avoid the midvein and secondary vein of the leaf. An LCR meter (HIOKI 3532-50, HIOKI Electric Co., Ltd. Nagano Prefecture, Japan) was used to measure leaf capacitance, and the measured leaf water content data were automatically saved to the hard disk of a laptop via RS-232 to USB data cable. The instrument was operated by the operating software that came with it. The measurement frequency ranged from 42 Hz to 5 MHz, with an accuracy of ±0.08%. The LCR meter was used for the measurements, with the test voltage set to 1 V and the clamping preload set to 0.5 N. A previous study showed that an LCR meter measurement frequency set to 100 kHz gave better correlation with the capacitance data than 1 MHz [20]; thus, the measurement frequency in this study was set to 100 kHz. It has also been shown that using multiple electrodes can eliminate electrode impedance [33]; therefore, a four-terminal Kelvin test probe was used, with one end used to clamp the leaf and the other end connected to an LCR meter. The LCR meter was used for signal processing, including amplification, filtering, and sampling. The data were recorded and displayed using a laptop computer.

2.3.2. Moisture Content

After the leaf capacitance test was completed, leaf water content was measured using the dry weight loss method. Specifically, the fresh weight W f of the leaves before drying and the dry weight W d after drying were measured in order to calculate the water content of the crop leaves [34]. An analytical electronic balance BT125D (Sartorius GmbH, Göttingen, Germany) was used to determine the weight of crop leaves to obtain accurate values of leaf weight, with an analytical electronic balance accuracy of 0.01 mg and a maximum range of 120 g. The leaf drying equipment was a vacuum-drying chamber, DHG-9023A (Shanghai Jinghong Experimental Instruments Co., Ltd., Shanghai, China), which accelerated the evaporation of water from the crop leaves by providing a specific temperature and humidity environment to dry the leaves.
When sampling crop leaves, the cutting site was the node where the leaf attaches to the petiole; the freshly picked crop leaves were immediately placed onto an analytical electronic balance which had completed preheating for weighing in order to obtain the fresh weight of the leaves, W f . To improve the accuracy of the measurements, vibration and windy environments were avoided. The measurement was repeated three times for each leaf sample in order to provide statistical data on leaf weight measurement and to ensure leaf weighing accuracy. The whole fresh weight measurement process took less than 5 min. Subsequently, the measured fresh weight crop leaves were placed in a vacuum-drying oven for the drying process, where the leaves were evenly arranged on the sample trays of the drying oven and fixed with clamps; the drying oven environmental parameters were then set for a drying time of 80~120 min at 80 °C. The dry weight of the leaves was then calculated as W d . The fresh weight moisture content of the crop leaves was calculated using Equation (1):
M c = W f W d W f × 100 %
where M c represents the fresh weight water content of the leaves, W f represents the fresh weight of the crop leaves, and W d represents the dry weight of the crop leaves.

2.4. Spray Retention on per Unit Leaf Area

2.4.1. Spray Retention Acquisition

Droplet holding capacity is the maximum amount of droplet deposition that can be carried on crop leaves during dynamic spraying [35]. Charged droplets were generated by an electrostatic spray system with a spray pressure of 0.3 MPa and electrostatic voltage set to three gradients of 10, 20 and 30 kV. The fan nozzle was located directly above the target crop leaves at a height of 500   mm . The droplet particle size D50 (medium value of particle size distribution) was 97.502   μ m , 94.3   μ m ,   and   90.531   μ m at 10 ,   20 ,   and   30   kV charging voltages, respectively. Experimental crops were cultured under fully watered conditions until the day before the experiment, when watering was stopped. A retention test was conducted for 7 days with two measurements per day, for a total of 14 measurements. Considering that the surface properties of the leaves would change after the leaves were wetted by droplets and that the leaves needed to be dried naturally, the daily measurement interval was set to 12   h , with the first measurement time at 8:00 a.m. and the second measurement time at 8:00 p.m. Three leaves with similar maturity and leaf morphology were selected for replication of the dynamic droplet retention test. During the test, the leaves were fixed on the leaf-carrying glass sheet and, after waiting for the electronic balance value to stabilize, the electronic balance was zeroed and connected to a laptop computer to record the data. Then, the electrostatic spray system was activated.

2.4.2. Leaf Area

In order to obtain the holding capacity per unit area of crop leaves, leaf area measurements were performed. Leaf area of the samples was obtained non-destructively using a portable leaf area meter (AM-350, ADC BioScientific Ltd., Hoddesdon, UK). The scanning speed was up to 20 mm/s, the maximum measurement width was 103 mm, and the maximum measurement length was 2 m, meeting the needs of the three crop leaf types. Data were saved to a laptop via Mini-B USB and RS232.

3. Results

3.1. Calibration between Moisture Content and Capacitance Value

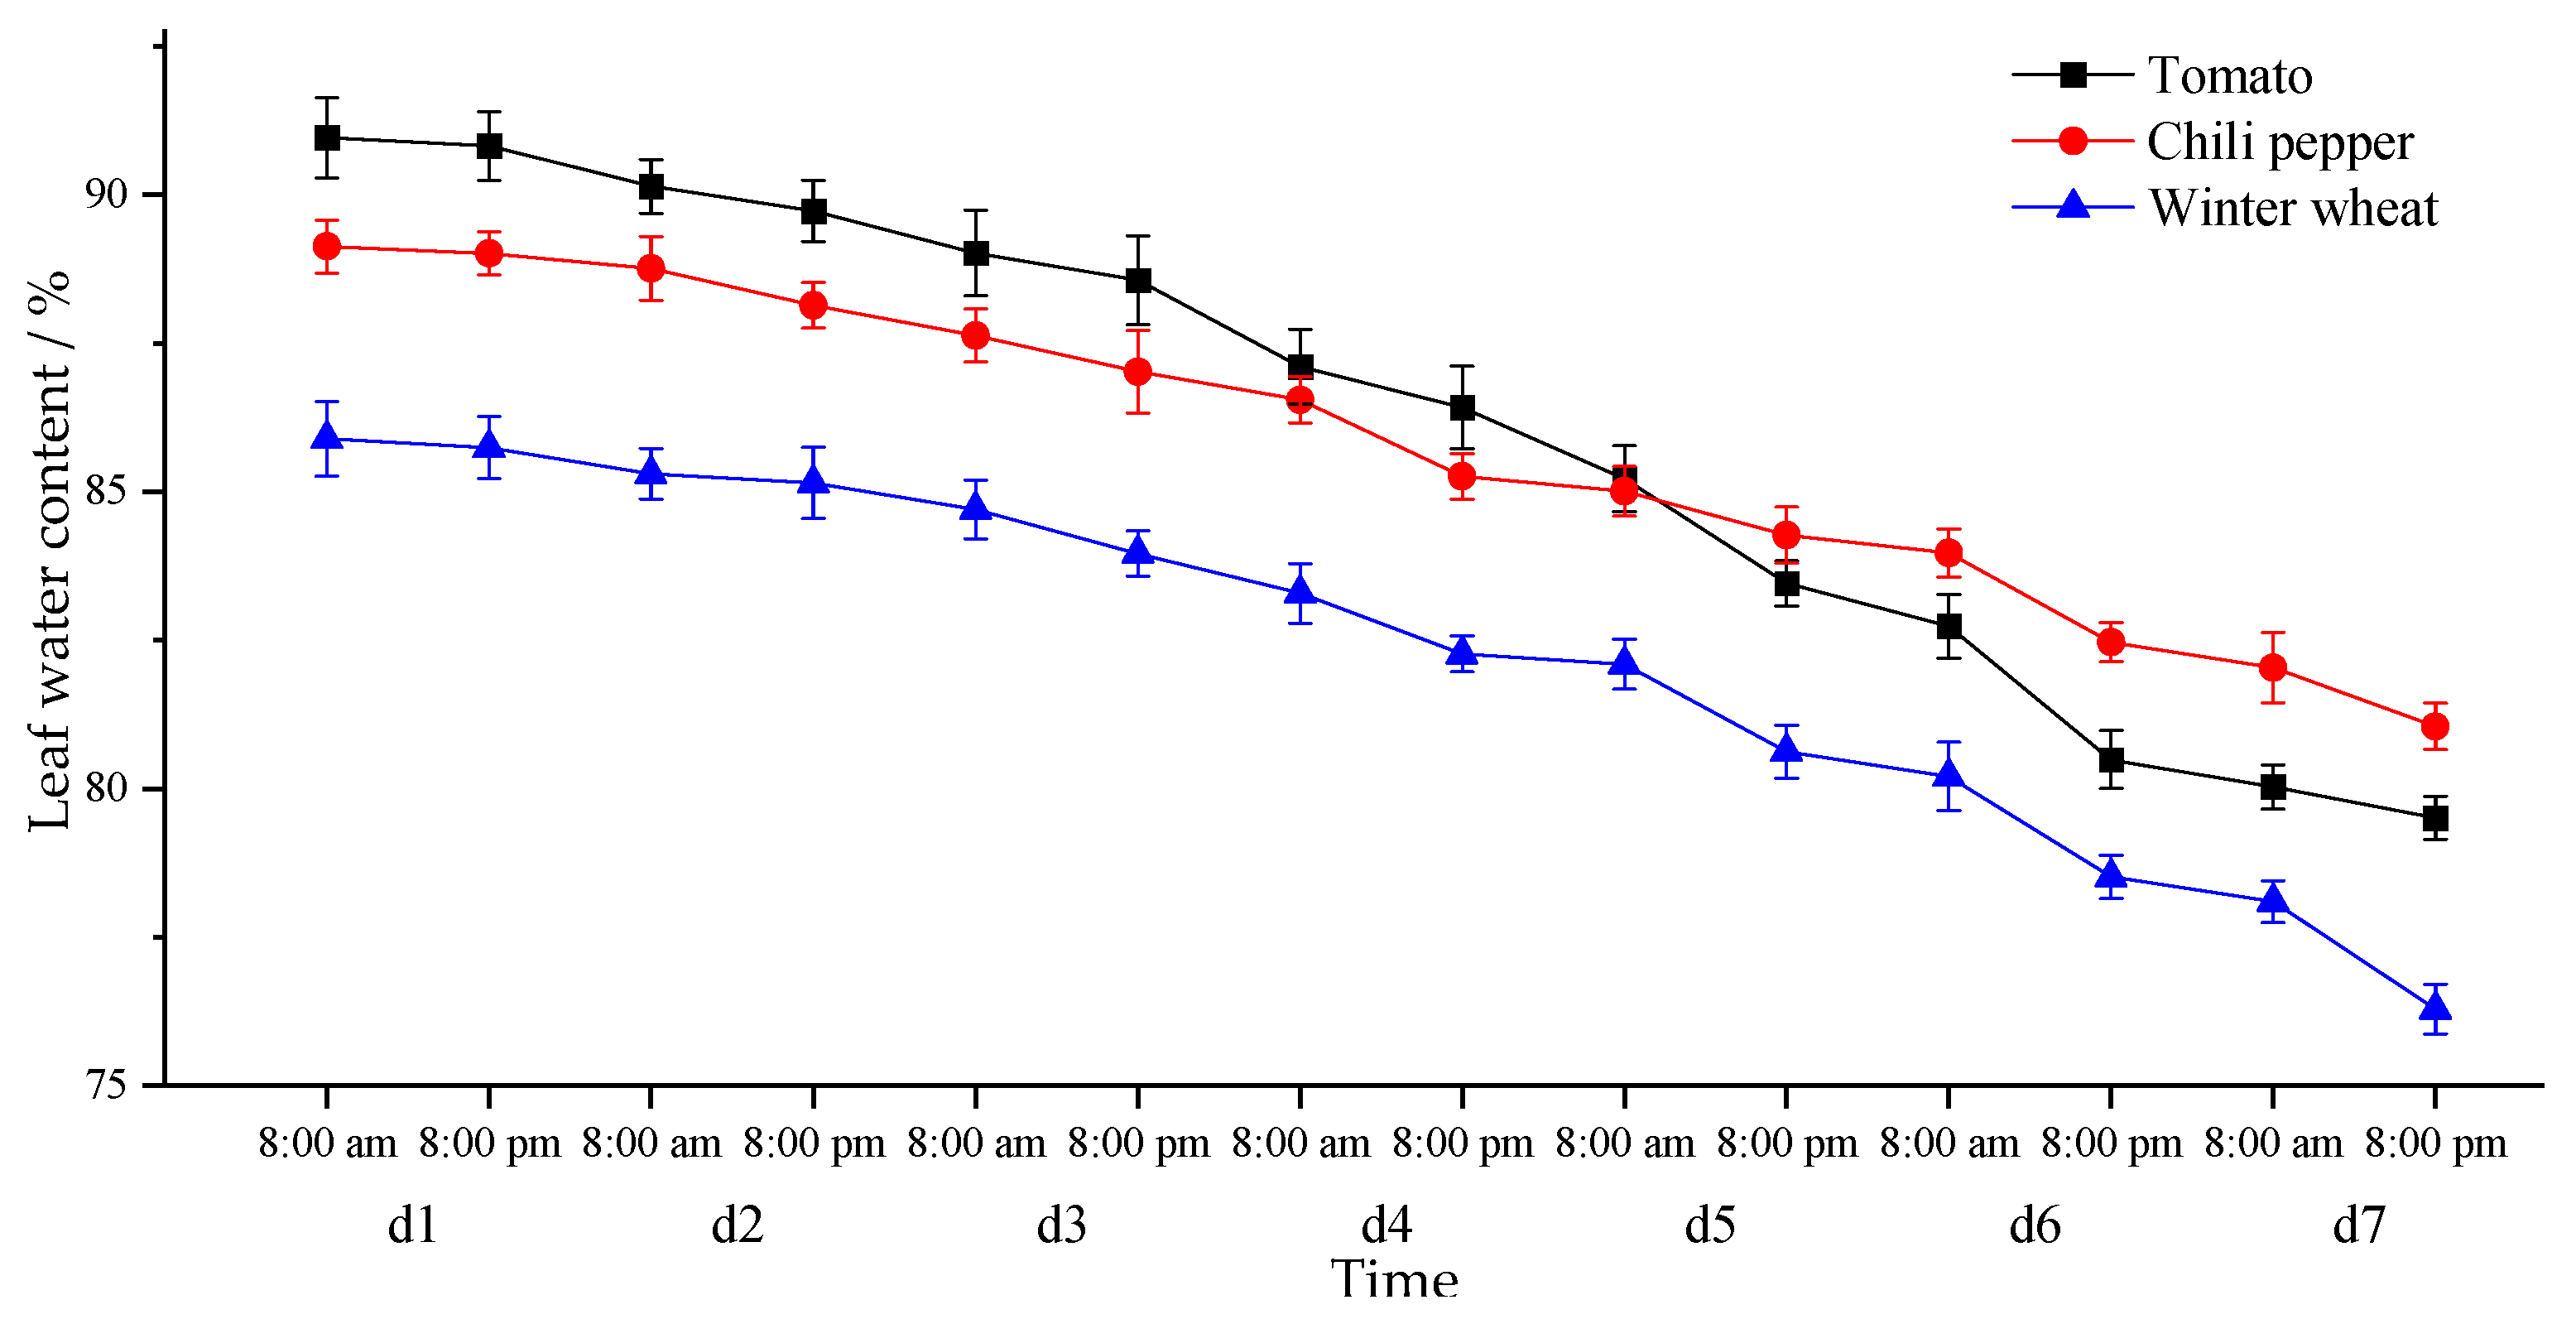
3.1.1. Variation in Water Content

The water content of the leaves of the three crops—tomato, pepper, and winter wheat—gradually decreased with increasing time. Figure 4 shows the changes in leaf sample water content of tomato, pepper, and winter wheat plants under a no-watering environment for eight consecutive days. It can be seen from the figure that after sufficient watering the water content of the leaves of the three crops gradually decreased with increasing time. The water content of tomato decreased from 90.96% to 79.51%; the water content loss was slow to fast and then leveled off, and the fastest water content loss occurred from 96 to 120 h with a loss of 0.123% per hour. The water content of pepper decreased slowly from 89.13% to 81.05%, and the water content loss was stable, with an average loss of 0.051% per hour. The water content of winter wheat decreased from 85.89% to 76.29%, and the water loss increased rapidly after 144 h, with a maximum loss of 0.151% per hour. Due to photosynthesis and transpiration of the crop, the stomata of the plant leaves were in an open state and the water content of the plant leaves constantly decreasing in the absence of watering. The three crops have different rates of leaf water content loss, which can be obtained from their different respective sensitivities to water loss.
The decreasing trend in leaf water content in the crops was flatter at night than during the day. Comparing the water content data in the daytime (8:00 a.m.) with that in the evening (8:00 p.m.), the reason for this phenomenon is due to the lower ambient temperature and absence of light in the evening. When plants do not photosynthesize, stomata are closed and transpiration consumes less water; atmospheric humidity is also higher at night. During the day, sunlight intensity is high, ambient temperature is higher, the photosynthesis and transpiration rates of plants are higher, and atmospheric humidity is lower; therefore, the water content of leaves during the day is much less than at night.
The rate of change in water content varied from leaf to leaf. With the effect of plant photosynthesis and transpiration, plant leaves lost water continuously; without timely water replenishment, the water content of plant leaves showed a decreasing trend during the time period tested. Tomato leaves showed the greatest rate of decrease in water content because of the absence of wax on the leaf surface; therefore, tomato had a poorer water retention capacity compared to pepper and wheat.

3.1.2. Capacitance Values

The leaf capacitance values of the three crops tended to decrease as time increased. The variation in the capacitance value of the leaf samples under the condition of no watering for seven consecutive days is shown in Figure 5. The capacitance of winter wheat plants decreased from 90.37   pF to 63.46   pF , and the rate of capacitance reduction was from slow to fast to slow, with a ‘U’ shaped curve, a flat rate of −0.07 pF / h and a maximum rate of −0.27 pF / h . The capacitance of tomato plants decreased from 66.93 pF and the capacitance of pepper plant leaves decreased from 63.13 pF to 40.50 pF; the capacitance value of pepper decreased slowly in the first three days at a rate of −0.03 pF / h . In the following days, the capacitance value decreased dramatically, to 40.50pf at a rate of −0.03 pF / h . The capacitance value decreased drastically to 40.50 pF.
Figure 5 illustrates the trend in leaf capacitance values at different periods. It can be seen that the overall trend in leaf capacitance values of the three crops after uniform watering was the same as the leaf water content, with an overall decreasing trend. Additionally, the order of this change was winter wheat > tomato > pepper. This is because water is the main cause of the changes in the electrical parameters of the plants. The reduction in water in the plant led to a decrease in the relative dielectric constant of the leaves, reducing their capacitance values.

3.1.3. Regression Analysis of Capacitance and Water Content

The two variables obtained, leaf capacitance and water content, were subjected to correlation and regression analyses using SPSS (version 24) software. Leaf water content was strongly correlated with leaf capacitance. The Pearson correlation between leaf water content and the capacitance value of tomato plants was 0.989 and significant (two-tailed 0.01); the Pearson correlation between leaf water content and the capacitance value of pepper plants was 0.993 and significant (two-tailed 0.01); the Pearson correlation between leaf water content and the capacitance value of winter wheat plants was 0.968 and significant.
Based on the large correlation between leaf water content and capacitance value, regression analysis was performed using the SPSS software. From the regression analysis results, the adjusted R2 of tomato, pepper, and winter wheat was 0.977, 0.985, and 0.932, respectively, indicating that the linear fit results were acceptable; the significance of analysis of variance (ANOVA) was 0.00 < 0.05 for all three crops, indicating that there was a significant linear relationship between leaf water content and leaf capacitance value in the three crops; from the coefficient table of the regression analysis, the significance level of t-test was 0.00 < 0.05, indicating that the coefficients of the regression equation between leaf water content and capacitance of the three crops were significant and statistically significant. The regression equation was
T c = 156.152 + 2.477 T m
C c = 196.617 + 2.923 C m
W c = 173.357 + 3.039 W m
where T m is the tomato leaf water content, T c is the tomato leaf capacitance, C m is the pepper leaf water content, C c is the pepper leaf capacitance, W m is the winter wheat leaf water content, and W c is the winter wheat leaf capacitance.
Crop leaf water content can be obtained without loss by measuring leaf capacitance brought into the above three regression equations.

3.2. Leaf Area of Crops

The leaf area statistics of the samples of the three crops are shown in Figure 6. The mean leaf area of pepper leaf samples was 24.29 cm 2 , the maximum leaf area was 26.35 cm 2 , and the minimum leaf area was 22.35 cm 2 ; the mean leaf area of winter wheat leaf samples was 20.90 cm 2 , the maximum leaf area was 25.62 cm 2 , and the minimum leaf area was 18.05 cm 2 ; the mean leaf area of tomato plant leaf samples was 14.19 cm 2 , the maximum leaf area was 15.04 cm 2 , and the minimum leaf area was 13.26 cm 2 .

3.3. Effect of Water Content on Droplet Retention

3.3.1. Effect of Water Content on Droplet Retention in Electrostatic and Non-Electrostatic Sprays

Figure 7 shows the measurements of different leaf water contents with the corresponding leaf retention per unit area for all three crops—tomato, pepper, and winter wheat—under electrostatic and non-electrostatic spray conditions. For all three crops, the retention of leaves increased with increasing leaf water content under electrostatic spraying and decreased with increasing water content under non-electrostatic spraying conditions. For tomato plant leaves, the retention capacity per unit area was 200.1 mg / cm 2 at 90.063% water content and 194.4 mg / cm 2 at 79.492% water content under electrostatic spray conditions; the retention capacity per unit area was 143.9 mg / cm 2 at 90.06 % water content and 194.4 mg / cm 2 at 79.492% water content under non-electrostatic conditions. Under non-electrostatic conditions, the retention capacity per unit area was 143.9 mg / cm 2 at 90.06% water content and 158.7 mg / cm 2 at 79.492% water content. For pepper plant leaves, the retention capacity per unit area was 104.8 mg / cm 2 at 88.864% water content and 98.7 mg / cm 2 at 81.1216% water content; under non-electrostatic conditions, the retention capacity was 77.1 mg / cm 2 at 88.864%, and 98.7 mg / cm 2 at 81.122%. For the leaves of winter wheat plants, the retention capacity per unit area of the leaf was 155.7 mg / cm 2 at 86.781% under electrostatic spraying conditions, and the retention capacity per unit area of the leaf was 155.7 mg / cm 2 at 77.926%; under non-electrostatic conditions, the retention capacity was 117.3 mg / cm 2 at 86.781% water content, which increased to 127.2 mg / cm 2 at 77.926% water content.
In summary, under non-electrostatic conditions, the retention capacity of the leaves of the three types of crops increased with decreasing water content, and the retention capacity at the lowest water content was 1.103~1.131 times more than that at the highest water content. Under electrostatic spraying conditions, retention was greater than under non-electrostatic conditions, and was positively correlated with water content. The minimum values of electrostatic droplet retention on the leaves of the three crops were higher than the maximum values of non-electrostatic droplet retention by a factor of 1.334~1.369 for the application of electrostatic spraying technology. During the movement of charged droplets, the droplets have the same polar charge and are subject to the principle of mutual repulsion, which results in a more uniform distribution. At the same time, due to the presence of an electric field, more fine droplets are fully deposited on the surface of crop leaves, which greatly improves the droplet adhesion rate. To further study the effect of water content on electrostatic spraying technology, we investigated the effect of leaf water content on the retention of electrostatic droplets at various electrostatic voltages.

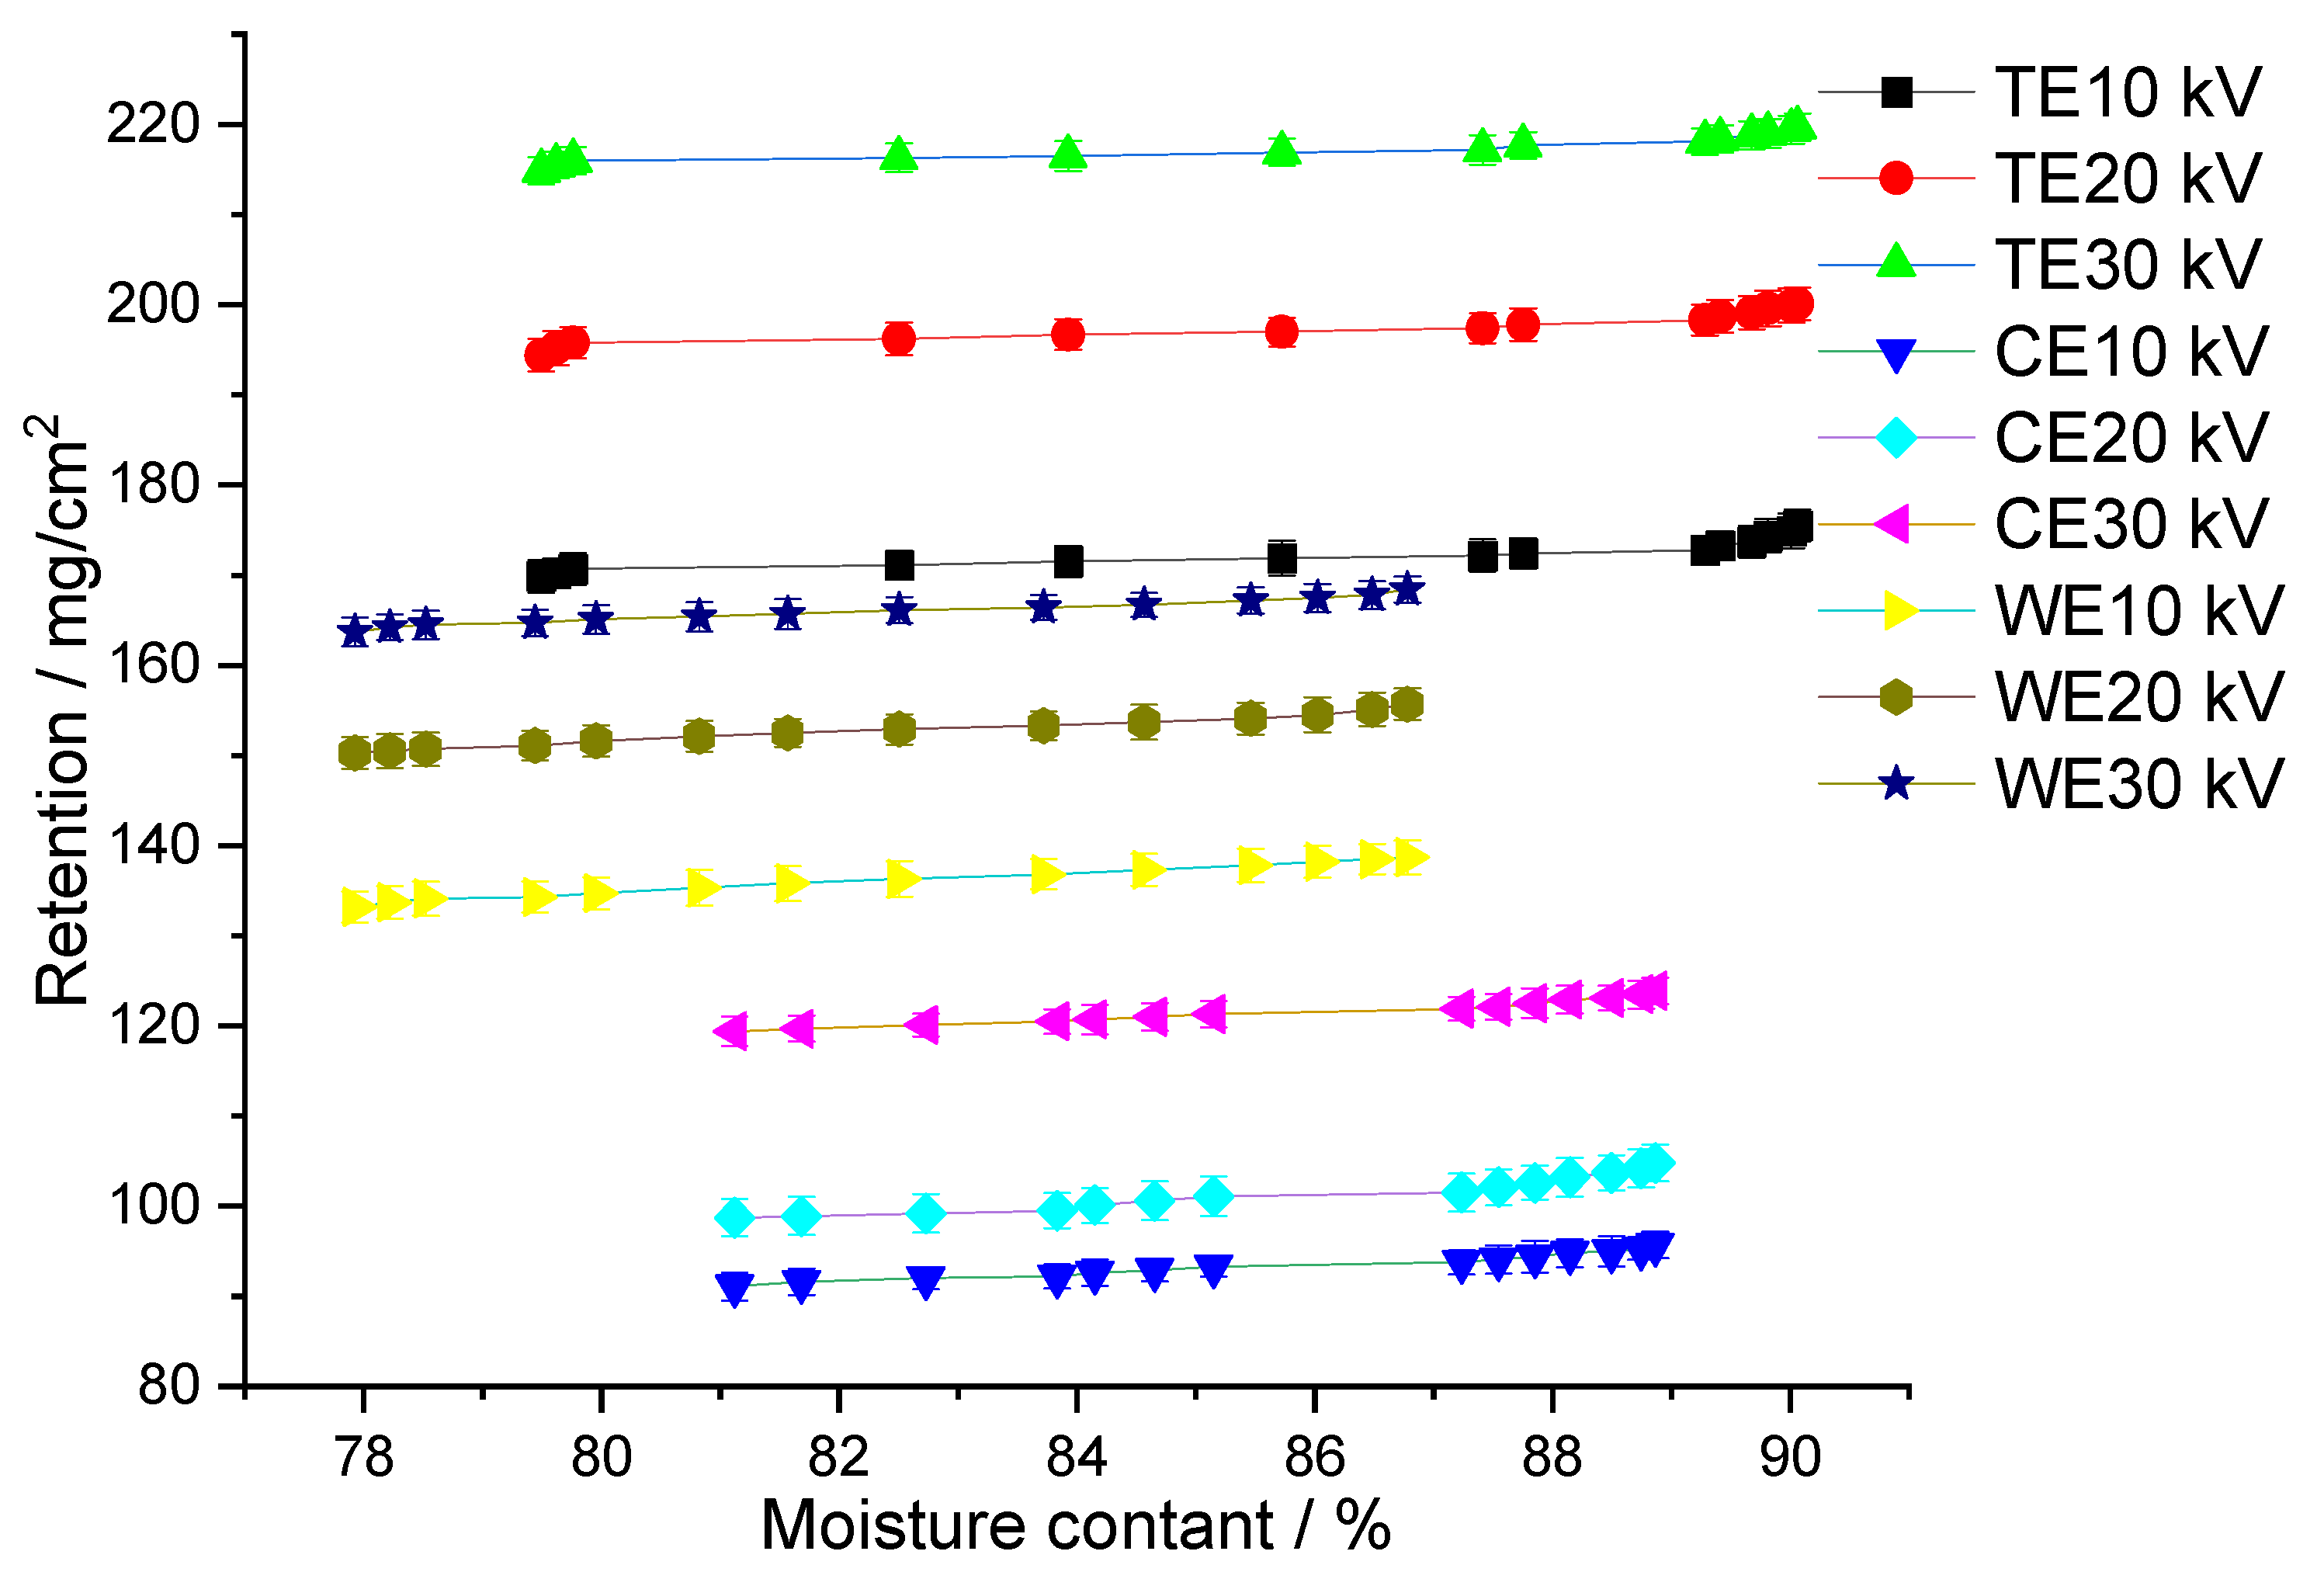
3.3.2. Effect of Water Content on Droplet Retention at Different Electrostatic Spray Voltages

The retention of electrostatic droplets on the leaf surface decreased with decreasing water content. As shown in Figure 8, the effect of different electrostatic voltages on droplet retention was measured on the leaves of three crops set at electrostatic spray system electrostatic voltages of 10 kV, 20 kV, and 30 kV. For tomato leaves, the water content was reduced from 90.06% to 79.49%, and the droplet retention was reduced by 5.6 mg / cm 2 at 10 kV, 5.7 mg / cm 2 at 20 kV, 1.8 mg / cm 2 at 30 kV, and 1.8 mg / cm 2 at 30 kV. It can be seen that the effect of leaf water content on droplet retention decreases with increasing electrostatic voltage. For pepper leaves, the water content decreased from 90.06% to 79.49%, and the electrostatic droplet retention decreased by 4.6 mg / cm 2 at an electrostatic voltage of 10 kV; 6.1 mg / cm 2 at an electrostatic voltage of 20 kV; 4.5 mg / cm 2 at an electrostatic voltage of 30 kV; and 4.5 mg / cm 2 at an electrostatic voltage of 30 kV. For winter wheat leaves, the water content was reduced from 86.78% to 77.92%, and the leaf electrostatic droplet retention was reduced by 5.5 mg / cm 2 at an electrostatic spray system voltage of 10 kV; 5.4 mg / cm 2 at an electrostatic spray system voltage of 20 kV; and 30 kV at an electrostatic spray system voltage. The retention of electrostatic droplets on leaves was reduced by 4.7 mg / cm 2 at an electrostatic voltage of 30 kV; at three different electrostatic voltages of 10 kV, 20 kV, and 30 kV, a higher water content was consistently shown to be more favorable in the retention of electrostatic droplets on the three different leaves. The pattern exhibited that the retention of droplets on the leaves of the three crops decreased slowly with decreasing water content.

4. Discussion

In the process of agricultural spraying, the application of electrostatic spraying technology can improve retention on a variety of crops. This paper investigated the positive correlation between crop leaf water content and electrostatic droplet retention, i.e., that the retention of electrostatic droplets on the leaves of a variety of crops gradually decreases with a decrease in leaf water content.

4.1. Leaf Water Content and Leaf Capacitance

The plant leaf crop is a dielectric whose conductive properties are between those of a conductor and an insulator. Upon attachment of charged droplets to the leaf surface, an electric field is formed outside the leaf and, under the action of the electric field, the internal solution of the leaf corresponds to a capacitive medium and exhibits a specific capacitance value [36]. Water is usually present in plant cells in the form of bound and free water. The free water content limits the metabolic intensity of the plant, while bound water is not involved in metabolism [37]. Therefore, changes in leaf water content inevitably cause changes in the dielectric constant, which in turn are reflected by the leaf capacitance values [38]. Therefore, plant leaves are often used as an effective site for testing characteristic electrical parameters [39]. In this paper, crop leaves were set up as dielectric plates placed between two plates of a parallel plate capacitor.
The magnitude of capacitance can be expressed by the ratio of the amount of charge, Q , between the two plates to the potential difference, U , given as
C = Q / U
However, when the dielectric slab (crop leaf in the current paper) is installed between the capacitor, dielectrics are polarized due to the potential difference between the two plates of the capacitor, and a dipole moment is induced in the interior. A negative polarization charge is induced on the surface of the dielectric on the positive side of the plate; conversely, a positive charge is induced on the negative side of the plate, and the opposite electric field is produced in the dielectric interior, which weakens the potential difference between the charged electrode plates and increases the capacitance of the capacitor. For the dielectric slab, capacitance can be calculated by the following formula:
C x = ϵ r ϵ 0 A / 4 k π δ = ϵ r C 0
where C 0 is the capacitance of the capacitor when there is vacuum between the plates; C x is the capacitance with dielectric slab added between the capacitor plates and the plate distance is the same as when C 0 is measured; k is the electrostatic force constant; A is the effective covering area of the dielectric slab; δ is the distance between the parallel plates of the capacitor; ϵ r is the relative dielectric constant; and ϵ 0 is the dielectric constant of the capacitor when there is vacuum between the plates.
Tomato, pepper, and winter wheat leaves were studied and leaf capacitance was measured using an LCR tester followed by leaf water content measurement using the drying method. In this paper, a linear relationship between leaf water content and leaf capacitance was calculated by statistical correlation and regression methods for the three crops. However, the linear relationship between leaf capacitance and leaf water content is highly dependent on the growing environment of the crop, such as light conditions, the type of nutrient solution, and culture substrate. Light stimulates the opening of leaf stomata, which in turn increases photosynthesis in leaves, leading to changes in solute content in leaves that have various effects on the dielectric constant in solution [26]. Usually, increasing the concentration of solute in leaves decreases the dielectric constant in solution [25], which is consistent with the conclusion obtained in this paper, namely that after sufficient watering of the crop and as environmental water decreases, the crop’s own water also gradually decreases, leading to an increase in the concentration of solutes in the leaves and resulting in a decrease in leaf capacitance. However, whether the relationship between the reduction in leaf water content and the change in leaf capacitance is linear or exponential needs to be measured and calibrated to the various culture environments of the crop.

4.2. Electrostatic Droplet Holding Capacity

This paper shows that water content has a significant and important effect on the retention of electrostatic droplets on crop leaves. Maximum retention occurs at the highest water content of the leaves and decreases as the water content of the leaves decreases, which means that the retention capacity of the leaves decreases. This phenomenon shows the same pattern in different plant types. For tomato leaves, in the highest water content state (leaf water content of 90.06%) the retention amount per unit area of the leaf increased by 5.7 mg / cm 2 ; considering the area of tomato leaves, the retention amount can be increased by 75.582~85.728 mg, and the retention amount on a single leaf is about 2577 mg. In other words, when agricultural electrostatic spraying is carried while out considering the state of water content, the spraying effect of a single leaf can be increased by 2.93%.
For pepper leaves, in the highest water content state (leaf water content of 88.86%), the retention amount per unit area of the leaf increased by 6.1 mg / cm 2 ; considering the pepper leaf area, the retention amount can be increased by 136.335~160.735 mg and the retention amount on a single pepper leaf is about 2206 mg. As such, the spraying effect of a single leaf can be increased by 7.29% when considering the state of water content when conducting agricultural electrostatic spraying.
For winter wheat leaves, in the highest water content state (leaf water content of 86.78%), the retention amount per unit area of leaves increased by 5.4 mg / cm 2 ; considering the area of the leaves, the retention amount can be increased by 71.604~81.216 mg and the retention amount on a single leaf is about 1992 mg. In other words, the spraying effect on a single leaf could be increased by 3.59~4.07% when considering the state of water content when conducting agricultural electrostatic spraying.
The effects of leaf and electrostatic voltage on the droplet retention of different crops were also verified in this paper. When comparing different crops, the retention capacity of tomato leaves was the highest, the droplet retention capacity of pepper leaves was the lowest, and winter wheat was in between these values. Additionally, increasing the electrostatic spraying voltage significantly improved droplet retention on the leaf surface of different crops. Tomato leaves have sparse, glandular hairs, and droplets falling into these glandular structures spread rapidly on the leaf surface, increasing droplet adhesion [29]. However, as the electrostatic voltage increases, the maximum retention on the crop leaves increases. The trend in increasing retention on tomato leaves was evident; however, retention on the other two crops increased slowly. At 10   kV , the maximum retention on pepper leaves was approximately equal to that on winter wheat, but lower than that on tomato. When the electrostatic voltage increased to 20 kV , the maximum retention on winter wheat leaves exceeded that on pepper; at 30 kV , the maximum retention on winter wheat leaves increased to 1.2 times that on pepper. This was due to the waxy and border folds on the pepper leaves; however, the winter wheat leaves had short and hairy auricles, narrow, lance-shaped leaves, and depressed main veins, which collected droplets.

5. Conclusions

In this study, the effects of water content on leaf retention and the trend in leaf retention at different electrostatic voltages were investigated. The main findings were as follows:
(1)
A linear function between water content and leaf capacitance was established for three crops—tomato, pepper, and winter wheat—and the water content of crop leaves were obtained without loss.
(2)
From the perspective of crop leaf surface retention, electrostatic spraying technology proved itself to be superior to non-electrostatic spraying technology. The retention capacity of electrostatic spraying increased with an increase in leaf water content, and the retention capacity of non-electrostatic spraying conditions decreased with an increase in water content.
(3)
Increasing the electrostatic spraying voltage had a significant effect on the retention capacity of leaves. Within a certain voltage range (0~30 kV), increasing the electrostatic spraying voltage improved the retention of droplets on the leaves of the different crops.
This paper can suggest methods for improving electrostatic spraying technology and improving droplet retention on crop leaves; however, in our experiments, the leaves were fixed at 30° and were artificially fixed on a rigid body. Furthermore, the microscopic pores in the crop leaves and the deformation of the crop leaves during the spraying process could have an effect on spray retention; these factors will be addressed in our next research paper.

Supplementary Materials

The following are available online at https://www.mdpi.com/article/10.3390/su132111685/s1.

Author Contributions

Conceptualization, J.M., C.C. and B.Q.; methodology, J.M. and B.Q.; software, F.A.; validation, F.A. and B.Q.; formal analysis, J.M., and C.C.; investigation, C.C.; resources, K.L., B.Q.; data curation, J.M.; writing—original draft preparation, J.M.; writing—review and editing, B.Q.; visualization, B.Q.; supervision, B.Q.; project administration, B.Q.; funding acquisition, B.Q. All authors have read and agreed to the published version of the manuscript.

Funding

This research was funded by National Natural Science Foundation of China (Grant No. 31971790), Primary Research & Development Plan of Jiangsu Province (Grant No. BE2020328), Graduate Research and Innovation Program of Jiangsu Province (Grant No. KYLX16_0908).

Institutional Review Board Statement

Not applicable.

Informed Consent Statement

Not applicable.

Data Availability Statement

Data available in Supplementary File.

Acknowledgments

Thanks to the Key Laboratory of Plant Protection Engineering, Ministry of Agriculture and Rural Affairs for providing the measurement equipment and helping the authors to complete the experiment.

Conflicts of Interest

The authors declare no conflict of interest.

References

  1. Inculet, I.I.; Castle, G.S.P.; Menzies, D.R.; Frank, R. Deposition studies with a novel form of electrostatic crop sprayer. J. Electrost. 1981, 10, 65–72. [Google Scholar] [CrossRef]
  2. Maski, D.; Durairaj, D. Effects of charging voltage, application speed, target height, and orientation upon charged spray deposition on leaf abaxial and adaxial surfaces. Crop. Prot. 2010, 29, 134–141. [Google Scholar] [CrossRef]
  3. Law, S.E.; Steven, C.C. Depositional Characteristics of Charged and Uncharged Droplets Applied by an Orchard Air Carrier Sprayer. Trans. ASAE 1988, 31, 984–989. [Google Scholar]
  4. Latheef, M.A.; Carlton, J.B. Aerial electrostatic-charged sprays for deposition and efficacy against sweet potato whitefly (Bemisia tabaci) on cotton. Pest Manag. Sci. 2009, 65, 744–752. [Google Scholar] [CrossRef] [PubMed]
  5. Jones, C.D.; Hopkinson, P.R. Electrical theory and measurements on an experimental charged crop-spraying system. Pestic. Sci. 1979, 10, 91–103. [Google Scholar] [CrossRef]
  6. Zhou, L. Research progress and application status of electrostatic pesticide spray technology. Trans. Chin. Soc. Agric. Eng. 2018, 34, 1–11. [Google Scholar]
  7. Law, S.E. Agricultural electrostatic spray application: A review of significant research and development during the 20th century. J. Electrost. 2001, 51–52, 25–42. [Google Scholar] [CrossRef]
  8. Patel, M.K.; Sharma, T.; Nayak, M.K.; Ghanshyam, C. Computational modeling and experimental evaluation of the effects of electrode geometry and deposition target on electrostatic spraying processes. Int. J. Comput. Appl. 2015, 124, 10–15. [Google Scholar]
  9. Patel, M.K.; Praveen, B.; Sahoo, H.K.; Patel, B.; Kumar, A.; Singh, M.; Nayak, M.; Rajan, P. An advance air-induced air-assisted electrostatic nozzle with enhanced performance. Comput. Electron. Agric. 2017, 135, 280–288. [Google Scholar] [CrossRef]
  10. Patel, M.K.; Ghanshyam, C.; Kapur, P. Characterization of electrode material for electrostatic spray charging: Theoretical and engineering practices. J. Electrost. 2013, 71, 55–60. [Google Scholar] [CrossRef]
  11. Pascuzzi, S.; Cerruto, E.; Manetto, G. Foliar spray deposition in a “tendone” vineyard as affected by airflow rate, volume rate and vegetative development. Crop. Prot. 2017, 91, 34–48. [Google Scholar] [CrossRef]
  12. Appah, S.; Jia, W.; Ou, M.; Wang, P.; Gong, C. Investigation of Optimum Applied Voltage, Liquid Flow Pressure, and Spraying Height for Pesticide Application by Induction Charging. Appl. Eng. Agric. 2019, 35, 795–804. [Google Scholar] [CrossRef]
  13. Gen, M.; Ikawa, S.; Sagawa, S.; Lenggoro, W. Simultaneous Deposition of Submicron Aerosols onto Both Surfaces of a Plate Substrate by Electrostatic Forces. e-J. Surf. Sci. Nanotechnol. 2014, 12, 238–241. [Google Scholar] [CrossRef] [Green Version]
  14. Guo, J.; Tailor, M.; Bamber, T.; Chamberlain, M.; Justham, L.; Jackson, M. Investigation of relationship between interfacial electro adhesive force and surface texture. J. Phys. D Appl. Phys. 2015, 49, 035303. [Google Scholar] [CrossRef] [Green Version]
  15. Zhao, S.; Castle, G.; Adamiak, K. Factors affecting deposition in electrostatic pesticide spraying. J. Electrost. 2008, 66, 594–601. [Google Scholar] [CrossRef]
  16. Pan, Z.; Lie, D.; Qiang, L.; Shaolan, H.; Shilai, Y.; Yande, L.; Yu, Y.; Pan, H. Effects of citrus tree-shape and spraying height of small unmanned aerial vehicle on droplet distribution. Int. J. Agric. Biol. Eng. 2016, 9, 45–52. [Google Scholar]
  17. Maghsoudi, H.; Minaei, S. A review of applicable methodologies for variable-rate spraying of orchards based on canopy characteristics. J. Crop. Prot. 2014, 3, 531–542. [Google Scholar]
  18. Li, X.; He, X. Effect of different spray factors on charged droplet deposit using response surface methodology. High Volt. Eng. 2007, 33, 32–36. [Google Scholar]
  19. Mizukami, Y.; Sawai, Y.; Yamaguchi, Y. Moisture Content Measurement of Tea Leaves by Electrical Impedance and Capacitance. Biosyst. Eng. 2006, 93, 293–299. [Google Scholar] [CrossRef]
  20. Afzal, A.M.I.N.; Mousavi, S.F. Estimation of moisture in maize leaf by measuring leaf dielectric constant. Int. J. Agricul. Biol. 2008, 10, 66–68. [Google Scholar]
  21. Afzal, A.M.I.N.; Mousavi, S.F. Estimation of leaf moisture content by measuring the capacitance. J. Agric. Sci. Technol. 2010, 12, 339–346. [Google Scholar]
  22. Grimnes, S.; Martinsen, O.G. Bioimpedance and Bioelectricity Basics; Academic Press: London, UK, 2011. [Google Scholar]
  23. Chuah, H.T.; Kam, S.W.; Chye, Y.H. Microwave dielectric properties of rubber and oil palm leaf samples: Measurement and modelling. Int. J. Remote Sens. 1997, 18, 2623–2639. [Google Scholar] [CrossRef]
  24. Kocakusak, A.; Colak, B.; Helhel, S. Frequency dependent complex dielectric permittivity of rubber and magnolia leaves and leaf water content relation. J. Microw. Power Electromagn. Energy 2016, 50, 294–307. [Google Scholar] [CrossRef]
  25. Blackman, C.J.; Brodribb, T.J.; Brodribb, T. Two measures of leaf capacitance: Insights into the water transport pathway and hydraulic conductance in leaves. Funct. Plant Biol. 2011, 38, 118–126. [Google Scholar] [CrossRef] [PubMed] [Green Version]
  26. Afzal, A.; Duiker, S.W.; Watson, J.E.; Luthe, D. Leaf Thickness and Electrical Capacitance as Measures of Plant Water Status. Trans. ASABE 2017, 60, 1063–1074. [Google Scholar] [CrossRef]
  27. Rascio, A.; Rinaldi, M.; De Santis, G.; Pecchioni, N.; Palazzo, G.; Palazzo, N. Measurement of leaf lamina moisture with a low-cost electrical humidity sensor: Case study on a wheat water-mutant. BMC Plant. Biol. 2019, 19, 1–8. [Google Scholar] [CrossRef] [PubMed] [Green Version]
  28. Massinon, M.; Lebeau, F. Experimental method for the assessment of agricultural spray retention based on high-speed imaging of drop impact on a synthetic superhydrophobic surface. Biosyst. Eng. 2012, 112, 56–64. [Google Scholar] [CrossRef]
  29. Allagui, A.; Bahrouni, H.; M’Sadak, Y. Deposition of Pesticide to the Soil and Plant Retention During Crop Spraying: The Art State. J. Agric. Sci. 2018, 10, 104. [Google Scholar] [CrossRef]
  30. De Oliveira, R.B.; Precipito LM, B.; Gandolfo, M.A.; de Oliveira, J.V.; Lucio, F.R. Effect of droplet size and leaf surface on retention of 2,4-D formulations. Crop. Prot. 2019, 119, 97–101. [Google Scholar] [CrossRef]
  31. Gaskin, R.; Steele, K.; Forster, W. Characterising plant surfaces for spray adhesion and retention. N. Z. Plant. Prot. 2005, 58, 179–183. [Google Scholar] [CrossRef]
  32. Yamazaki, K. Nutrient Solution Culture; Pak-kyo Co.: Tokyo, Japan, 1982; p. 41. [Google Scholar]
  33. Zhang, M.I.N.; Willison, J.H.M. Electrical Impedance Analysis in Plant Tissues: Impedance Measurement in Leaves. J. Exp. Bot. 1993, 44, 1369–1375. [Google Scholar] [CrossRef]
  34. Wei, Y.; Wu, F.; Xu, J.; Sha, J.; Zhao, Z.; He, Y.; Li, X. Visual detection of the moisture content of tea leaves with hyperspectral imaging technology. J. Food Eng. 2019, 248, 89–96. [Google Scholar] [CrossRef]
  35. Dorr, G.J.; Forster, W.A.; Mayo, L.C.; McCue, S.W.; Kempthorne, D.M.; Hanan, J.; Turner, I.; Belward, J.A.; Young, J.; Zabkiewicz, J.A. Spray retention on whole plants: Modelling, simulations and experiments. Crop. Prot. 2016, 88, 118–130. [Google Scholar] [CrossRef] [Green Version]
  36. Guo, W.C.; Wu, L.; Wei, Y.S. Influence of water loss on physiological and electrical properties of plants. J. Northwest A & F Univ. (Nat. Sci. Ed.) 2007, 35, 185–191. [Google Scholar]
  37. Ruichi, P. Plant Physiology; Higher Education Press (HEP): Beijing, China, 2008. [Google Scholar]
  38. Luan, Z.; Liu, X. Relationship between Wheat Leaf Capacitance and Water Content under Water Stress. Acta Bot. Boreal.-Occident. Sin. 2007, 27, 2323–2327. [Google Scholar]
  39. Liao, J.; Guo, H.; Shao, Y. Modeling of microwave dielectric properties of rice growth stages in Zhaoqing test site of southern China. Int. Geosci. Remote Sens. Symp. 2002, 5, 2620–2622. [Google Scholar]
Figure 1. Leaves of the three types of crop: (a) Tomato leaves; (b) Chili pepper leaves; (c) Winter wheat leaves.
Sustainability 13 11685 g001
Figure 2. Schematic diagram of electrostatic spraying system: (A) tank; (B) diaphragm pump; (C) pressure gauge; (D) pressure regulator; (E) electrode; (F) fan nozzles; (G) electrostatic generator; (H) switch of electrostatic generator; (I) DC power supply; (J) switch of diaphragm pump.
Sustainability 13 11685 g002
Figure 3. Droplet retention measurement device: (A) spray nozzle; (B) droplet clouds; (C) object stage; (D) connecting rod; (E) insulating shell; (F) electronic balance; (G) computer; (H) balance readings; (I) plants.
Sustainability 13 11685 g003
Figure 4. The variation tendency of the leaf water content of the three crops at different periods.
Sustainability 13 11685 g004
Figure 5. The variation tendency in leaf capacitance in the three crops at different periods.
Sustainability 13 11685 g005
Figure 6. Leaf area distribution of three crops.
Sustainability 13 11685 g006
Figure 7. Retention of three crops under electrostatic and non-electrostatic conditions. TNE and TE denote the retention of tomato leaves under non-electrostatic and electrostatic conditions, respectively; CNE and CE denote the retention of pepper leaves under non-electrostatic and electrostatic conditions, respectively; and WNE and WE denote the retention of winter wheat leaves under non-electrostatic and electrostatic conditions, respectively.
Sustainability 13 11685 g007
Figure 8. Retention at different water contents of three crops. TE denotes the retention of tomato leaves under electrostatic conditions, CE the retention of pepper leaves under electrostatic conditions, and WE the retention of winter wheat leaves under electrostatic conditions; 10, 20, and 30 kV represent electrostatic voltages.
Sustainability 13 11685 g008
Table 1. Spraying system main equipment parameters.
DeviceTypeParametersValue
High voltage electrostatic generatorKEF00-JD10060Voltage (kV)10, 20, 30
Pesticide tankVolume (L)40
Diaphragm pumpPLD-1205Rated pressure (MPa)0.3
Flow (L/min)1.4
Pressure gaugeY-100Measuring range (MPa)0~0.6
Pressure regulatorCCM5NJRegulations range10~100%
Fan nozzleLechler ST110-02Spray angle (°)110
Pressure (MPa)0.2~1.5
Flow rate (L/min)0.78
Publisher’s Note: MDPI stays neutral with regard to jurisdictional claims in published maps and institutional affiliations.

