Abstract
Achieving the ambitious targets set by Europe in its 2050 roadmap, moving away from fossil fuels towards renewable energy sources, while reducing carbon emissions, will require a radical change in Europe’s energy system. Much of the action that will enable this energy transition to be realised in a democratic way is at the local level. It is at this level that many of the decisions regarding the energy transition desired by European citizens will have to be taken. The methodology used in this study is based on data collection, literature review, data validation and analysis. A part of this analysis will also be taken by the mPower project as a diagnostic baseline. The first finding of this research work is that energy transition data availability at the local level is quite low. Second, the local authorities are experiencing difficulties in decarbonising their energy consumption. Finally, the factor with highest positive relationships with other energy transition variables is the number of people employed in the field of energy transition. The results suggest that in order to lead a participatory energy transition, the workforce specifically dedicated to energy transition is a key factor, clearly differentiating it from staff working on the general energy field.
1. Introduction
The Intergovernmental Panel on Climate Change (IPCC) shows the necessity to reduce the excessive use of fossil fuels if the rise in global temperature is to be stopped at less than 2 degrees Celsius [1]. The promised European renewable integration targets for 2030 and 2050 are at risk [2], since Europe is currently fed 12.55% by renewable energies [3]. A drastic change is needed in the energy system, and this is a reality well accepted by European citizens, policy makers and scientists, so much so that the EU has established the goal of achieving climate neutrality after adopting the 2050 strategy [4], and among its main objectives is the transition to a climate-neutral society in the coming decades. In addition, there are also voices suggesting that the coming transition will not be a mere techno-transition into renewable energy systems [5], but will require a change in our approach to citizen participation, economic models and social habits [6].
Approaches to global energy governance and energy transition are varied, and differ in their applicability to addressing the conundrums of global energy problems [7]. Several voices point to the need for a locally based, more grounded energy transition, as the local scale is related to more participatory, inclusive and socially accepted policies and actions. Schoor et al. argue that local communities must lead a bottom-up transition [8], challenging the current governance of the energy system. Local communities are in a better position to understand the basic needs of citizens, and can create more efficient financing-mechanisms for decentralised energy systems. Other authors agree that the gender perspective and the feminist vision [9,10,11] must also be taken into account in this transition, and could be easier to include in places with a more horizontal model of democracy, such as local communities. Other studies argue that the new energy system can be financed directly by citizens, who are the main actors in this energy transition, thanks to decentralised renewable energy cooperatives [12,13,14].
Beyond the perspective of the individual consumer, socially based initiatives have a prominent role to play in this area. After analysing the link between individual motivation and collective action in the context of sustainable consumption, Grabs et al. concluded that individuals—working on a more sustainable consumption horizon—can be agents of social change when they organise themselves into groups [15]. In these communities, the role of identity and identity formation is important, as social practices in grassroots innovations often change [16]. Some authors [17,18,19] attribute the progress of energy transitions to the presence of territory-based grassroots initiatives. Blanchet [20] points out in the same direction that grassroots initiatives are of vital importance in local energy systems, not only because of their influence on the way local energy policy is made, but moreover because they offer a specific vision of the energy transition at the local level.
Openness to alternative discourses and shared knowledge provides favourable conditions for the emergence of such initiatives [17]. On the other hand, it is clear that the influence they exert on energy systems is very weak, in the case of systems with strong vested interests, and that the support of governments and institutions is a must for these initiatives to achieve change.
According to IEA’s reports [21], cities are consuming 64% of total primary energy and are responsible for 70% of global CO2 emissions. Therefore, this article focuses more specifically on local authorities (related to municipalities and county-level authorities), since they have been recognised by the United Nations in the 2030 Agenda [22,23] and the European Union as playing a key role in the energy transition and the climate emergency [24]. If the ambitious targets set by the European Green Deal [25] (no net emissions of greenhouse gases by 2050, economic growth decoupled from resource use and no person and no place left behind) are to be achieved, there is now a widespread acceptance that action at the local and municipal level will be essential and possibly decisive (municipal ownership [26], bottom-up energy transitions [18,19]). It has been recognised that barriers and constraints to innovation can be both technological and social, but also that the local scale is important for innovation and social action [27,28]. Other authors like Comodi et al. [29] have a different point of view, and emphasise that despite the relevant role of local authorities, the results obtained from their actions are partial if we talk about a multi-scale energy transition; local action has its necessary participation, but for an energy transition to take place, more changes are needed. In the European context, it is also true that the extent of the energy transition is not equally distributed, due in part to differences in municipal capacity, political context and existing energy infrastructures in each country [30]. It should be noted that national scale energy policies remain central in achieving decarbonisation goals [31].
Local authorities and cities are already facing a number of sustainability challenges such as improving health systems, education and safety, clean air and providing basic infrastructure services such as water, mobility, housing, and of course energy. All of these and many others compete for the scarce financial, human and technical resources available to local authorities and cities. At the same time, however, many of them also have a direct bearing on a city’s carbon emissions. The contribution of cities to global CO2 emissions is high, with direct emissions and those from electricity generation estimated at 71–76% [32].
Given that more than half of the world’s population lives in cities, understanding how these are governed is crucial. In relation to climate change and the energy transition, this means understanding when and how mitigation and adaptation strategies shape the development of cities, how urban governance changes and how these changes manifest themselves in decision-making [33]. Moreover, some authors [34] highlight the importance of the need for research into the current energy situation in order to reduce total energy consumption, reuse energy (i.e., reuse flows, heat transfer, etc.) and produce renewable energy.
Some major EU countries have even opted for strategies that include phasing out nuclear power [35]. However, this change does not seem to be sufficient to reach the targets set. According to IEA [3] in Europe (EU-28), the consumption of non-renewable energy (coal, oil, gas and nuclear energy) constitutes 85.6% of the total primary energy supply. The remaining 14.44% is consumed from renewable energies such as hydro-, wind or solar power, but also from biofuels and the revalorisation of waste. This means that at least 32.85 MWh of non-renewable energy is consumed per capita per year (MWh·cap−1·yr−1) out of the total 38.37 MWh·cap−1·yr−1. In addition to the primary energy supply consumed within European boundaries, the outsourcing of services and production makes European countries responsible for an average Hidden Energy Flow of 14.35% [36], which results in an even higher total primary footprint of 43.92 MWh·cap−1·yr−1. This points out that it is crucial to reduce the energy consumed in the EU-28, especially non-renewable energy.
In terms of economic costs, Tagliapietra et al. [37] assess that the cost of a complete energy transition in the EU is similar to that of preserving the current non-renewable energy system. The adoption of appropriate policies to mitigate the adverse effects that such a transformation may produce could also make this expense much more acceptable in social terms. However, the profound changes in favour of decarbonisation will imply very significant social and energy metabolism transformations, the democratic aspects of which will need to be controlled [38].
Energy democracy is an open pathway for research in this regard, and shows the benefits of redistributing energy through a renewable transformation of current systems [39]. Alternative approaches towards more democratic energy practices are also being studied from a global point of view [40]. The goals of the multi-coalition global energy democracy movements [41] intend to resist the current energy agenda, seeking to reclaim and restructure the energy sector [42] with desired outcomes such as: shifting public resources away from fossil fuels [43], leaving fossil fuels on the ground and stopping extractivist infrastructures [44], ensuring public or social control over the energy sector [39] and not prioritising only the monetary benefit of the energy system, but also issues such as energy poverty [45,46].
The mPower project aims to assist in the energy transition of European cities by replicating innovative best practices in municipal energy; developing shared energy transition plans between local authorities. To this end, it has offered two learning programs, in which almost 100 local authorities participate (namely, the mPower Exchange peer-to-peer learning program and the mPower Digital e-learning program).
This publication deals with the second part of the project, and uses both the bespoke learning process (mPower Exchange), in which 27 cities were involved [47] and the online learning process (mPower Digital), involving a further 76 cities (six of which took part in both). The Covenant of Mayors [48] and Energy Cities [49] platforms were used to share the possibility of participating in the project across all European cities. Furthermore, the institutions leading the mPower project [50] (see Acknowledgements) offered hundreds of municipalities the possibility of applying to take part in the learning processes. A comprehensive list of local authorities taken into account is available in Appendix A (Table A1), while geographical locations are depicted in Figure 1.
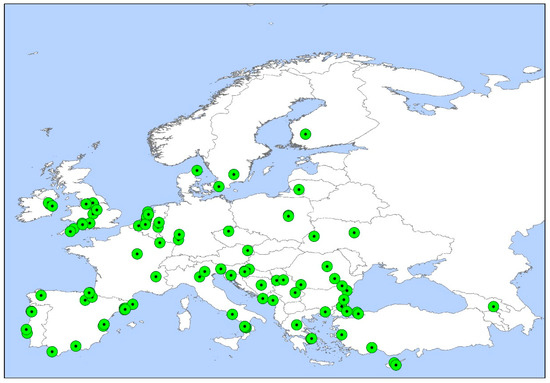
Figure 1.
Geographical location of local authorities considered in this paper.
The mPower Exchange program is based on city visits for the purpose of sharing knowledge, and enables technicians and policy-makers to invest face-to-face time researching, understanding and contrasting existing and new energy infrastructures and projects, with the aim of promoting participation and enhancing the exchange of practical knowledge and expertise. mPower Digital expands the number of local authorities benefiting from peer-learning opportunities and the sharing of best practices, by delivering peer-to-peer learning online. A participatory online learning platform on municipal energy, citizen participation and energy transition has been created to engage in three different online courses a total of more than 75 public authorities. The courses bring together municipal officials with experts to explore solutions to the most immediate challenges facing public energy authorities, as well as share best practices and blockages identified during the project.
The central question of this paper is: What are the main variables affecting the energy transition of the 97 European local authorities that were selected for the mPower learning programs? In addition, two sub-questions are defined, and will be answered further within this document:
- What are the relationships, if any, between renewable energy production, local energy transition resources and GHG emissions and total energy consumption?
- Is there a link between the geopolitical and/or climate situation and GHG emissions or total energy consumption?
The analysis used to answer these questions is based on the statistical evaluation of various climatic, social and political indicators and has been carried out using both the data provided by the local authorities from an online survey (Appendix B) and indirectly from systematic research on internet.
The results obtained in the 97 local authorities are then presented and discussed, followed by a summary of the conclusions drawn. A list of abbreviations is included in Table 1.

Table 1.
Abbreviation list.
2. Methodology
The methodology used in the research is based on data collection, literature review, data validation and analysis.
2.1. Data Collection
The results of the data collection considers 97 different local authorities all over Europe, together belonging to 27 countries. 81 are municipalities (referred in Table A1 as “M”), whereas 16 represent counties or extended areas around cities (referred to in Table A1 as “D”), which is the case of Coventry, Mendip, North Somerset, Wiltshire, Sheffield City Region, Wakefield, West Lothian and Devon in the UK; the region of Palma Campania, San Giuseppe Vesuviano and Striano in Italy; Meath County in Ireland; the regions of Barcelona (Diputació), Girona (Consell Comarcal) and Navarra (Foral Community) in Spain; and even climate action regional organisations (like Atlantic Seaboard North and Southeast in Ireland). Among all the entities, 76 participated in the online mPower Digital course, while 21 only attended the mPower Exchange face-to-face course. For ease of reading, the document refers to municipalities, local authorities and cities interchangeably for both groups.
In order to determine the initial situation of the local authorities participating in mPower, a baseline survey was conducted, consisting of several energy transition items.
The online survey was filled in by technical or political officers (appointed by the local authority to participate in the mPower project), and the survey covered both qualitative and quantitative aspects related to the local energy transition. In addition, the data collection has been carried out in line with the mPower project rhythms. Due to the difference in dates on which the learning processes were carried out, the data relating to the local authorities participating in mPower Exchange were obtained mainly during 2019, and those related to mPower Digital during 2020. The mPower Exchange survey was conducted during 2019, whereas the mPower Digital survey was conducted from April 2020 to April 2021. The baseline questionnaires were sent in digital format to all local authorities participating in the mPower learning programs (Appendix B). The list of collected variables is shown in Table A3 in Appendix C, while a list of derived variables and acronyms used can be found in Table A4.
2.2. Survey Data Validation Methodology
First of all and following the methodology used by Villamor et al. [47], the obtained data was converted into per capita ratios in order to identify extreme or incoherent values and make them comparable. For the standardisation of the sample data and in order to avoid deviations due to erroneous information on the forms, some checking measures were taken, so as not to use implausible or incorrect data that could lead to false conclusions in later steps.
As mPower project’s main impact is related to reducing GHG emissions, this parameter was contrasted twice: firstly, the GHG emissions declared for each participant authority was converted into a per capita ratio (GHG per capita, rGHG); this permits the direct comparison of emissions between authorities of all population sizes. The validation criterion in this case was that the ratio should belong to the range between 1 and 20 t-eqCO2·yr−1·cap−1. Data outside this gap were discarded for further analysis, which was the case of Miercurea Ciuc (76.36 t-eqCO2·yr−1·cap−1), San Lucido (0.09 t-eqCO2·yr−1·cap−1), Auxerre (0.49 t-eqCO2·yr−1·cap−1) and West Lothian County (0.2 t-eqCO2·yr−1·cap−1). In the cases of West Lothian and Auxerre, the data provided was previously indicated as not taking all emissions into account. The second validation criterion was to check if obtained per capita GHG emission rates were within the interval of ±80% with respect to the corresponding national GHG ratios. Data identified outside the interval was also rejected, as was the case of: Devon (+95.18%) and Horst (+87.6%).
In the case of total energy consumption (TC) per local authority, analogue criteria were used. Per capita ratios were made out (total energy consumption per capita, rTC) and values outside the range of 5 to 50 MWh·yr−1·cap−1 were discarded. This was the case of Canet (1796 MWh·yr−1·cap−1), Coventry (679 MWh·yr−1·cap−1), Miercurea Ciuc (313 MWh·yr−1·cap−1), Rochdale (162 MWh·yr−1·cap−1), Lugo (4.22 MWh·yr−1·cap−1), Diputació Barcelona (2.1 MWh·yr−1·cap−1), Falconara (1.57 MWh·yr−1·cap−1), Podgorica (0.81 MWh·yr−1·cap−1), Istanbul (0.63 MWh·yr−1·cap−1), West Lothian (0.63 MWh·yr−1·cap−1), San Lucido (0.52 MWh·yr−1·cap−1) and Palecznica (0.14 MWh·yr−1·cap−1). For authorities reporting rates below the accepted interval, the most plausible explanation is that a significant amount of energy consumption is not mapped within the monitoring system. For data over the maximum accepted value, there might be an interpretation or unit conversion error. The second validation criteria in this case was also to check if the per capita ratios are within a range of ±80%, with respect to the corresponding national ratios. Such was the case of all data except for Almada (+84.31%), which was rejected for further analysis.
Moreover, a cross-verification was carried out in order to determine whether the ratio (GHG/TC) presented any odd results (values under 0.1 or over 1 t-eqCO2·MWh-1), which was not the case, and odd numbers were confirmed for previously rejected data.
The research team selected a different approach for the validation of renewable energy generation data. The reality of each local authority can present utterly diverse situations, and no relevant national ratio can be compared to local level ratios. As previously done and described [47], and as in most cases, both installed power and generated energy data were provided, capacity factors (CF) were calculated for both thermal and electric energy generation from renewable sources [51,52]. Values under 1% and over 90% were considered not valid, as they would mean that the utilities were seldom used, or on full-power non-stop, respectively. According to this test, incoherent values between installed power and generated energy were identified, and the value for installed power for such cases was rejected. For thermal energy installations, this was the case of Zenica, Falconara, Errenteria, Coventry, Rubí, San Lucido, Alphen and Vienna. For electrical energy installations, it was the case of Falconara, Errenteria, Coventry, Valencia, Rubí, San Lucido, Rochdale and Devon. Besides the capacity factor test, zero energy generation values were discarded for authorities declaring installed power: Palecznica and North Somerset.
In the case of staff working in the local authorities in the field of energy transition, data showing over 1 employee per 100 inhabitants were discarded as implausible (Vila Nova de Gaia).
2.3. Statistical Analysis Methodology
As a first step, linear correlations (Pearson) were sought among the selected variables. As uniform samples were used and in order to maximise the number of observations for some variable pairs, correlations were searched for in several sub-groups, as explained in the results.
With the correlations obtained in the first step, for the most interesting correlations identified, the next step was to analyse the linear regression expressions that would be useful to obtain quantitative answers to the questions posed.
Finally, average differences observed according to several location grouping criteria (in the main dependent variables such as GHG, total energy consumption per capita, EmR, rRES) were checked for statistical significance. Although different groping criteria were initially proposed, after the uneven distribution of localities in the study, four extensive geopolitical groups were defined as described in Table 2.
Table 2.
Grouping of countries in NW, NE, SW and SE.
3. Results
The aim of this section is to show, on the one hand, the difficulties that have arisen throughout the data collection process, as well as to highlight the most interesting relationships found between the variables chosen, thus giving the scientific community an insight into possible ways forward for future research on energy transitions focusing on local authorities, as well as providing relevant tools and information to technicians and politicians of local authorities responsible for energy transitions, mainly in Europe.
3.1. Energy Transition Data Accessibility
The data gathering process described above has drawn a group of results related to the initial questions posed by this study about the energy transition’s data availability at municipal or local authority level. Percentages of answers obtained for each topic are depicted in Table 3.
Table 3.
Percentage of gathered data for each field group. Some results are presented as ranges, when different variables belonging to the same group had different amounts of answers.
As can be observed, the highest data harvesting ratio is for GHG emissions, where only one-third of data was provided by local authorities and the data collected seems to be quite out of date (six years old on average). In contrast, while budget and staff data were the least accessible (16–43%), they were perfectly up to date and provided by local authorities in all cases. Data related to renewable energy generation were partially accessible outside local authorities, and were not significantly obsolete, but only available for less than half of the participating authorities.
3.2. Energy Consumption Rates, GHG Emission Rates, Renewable Generation and Climatic Factors
In order to make comparisons between municipalities of different sizes, the data gathered was converted to per capita ratios: rGHG (per capita GHG emissions), rTC (per capita total energy consumption), rRES (per capita renewable energy generation), rBudget (per capita energy transition budget), rStaff (employees in energy transition issues per capita) and EmR (annual emission rates). This way, the calculation and the comparisons made are not so greatly influenced by the surface area or the number of inhabitants of the local authority. This approach to per capita consumption and emissions also has its drawbacks, as it does not consider the social and energy metabolisms that can turn large cities into energy sinks, but it does provide an approximation, which we believe is valid for comparison between municipalities of different sizes. For climatic factors, Heating-Degree Days (HDD) and Cooling Degree-Days (CDD) were used.
The per capita GHG emission rates (rGHG) and total energy consumption rates (rTC) obtained after collection and validation process are depicted in Table A2 (Appendix A).
A graphic summary of statistically significant correlations found is depicted in the diagram following the iconography of correlations [53] (Figure 2).

Figure 2.
Diagram for correlations among per capita GHG emissions, per capita total energy consumption, per capita renewable energy consumption, annual emission rates, population density, HDD and CDD (Sample size n = 23).
3.2.1. Energy Consumption vs. GHG Emissions
The correlation analysis performed confirmed that higher per capita energy consumption rates correlates with higher per capita GHG emissions. The linear regression curve between both variables can be observed in Figure 3 (regression and scatter plots, for legibility reasons, only some municipality names have been labelled).
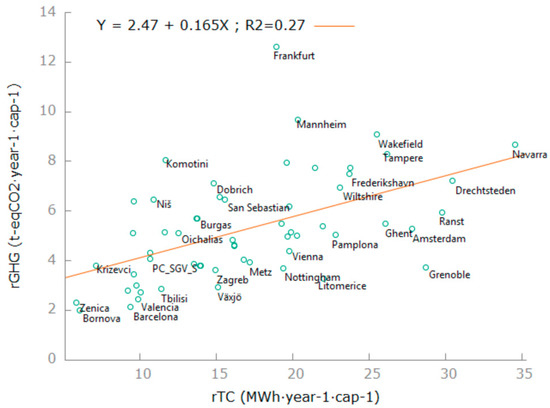
Figure 3.
Regression between per capita Total Energy Consumption (rTC) and per capita GHG emissions (rGHG) (Sample size n = 58).
In the same figure, locations at the bottom-left of the chart present low consumption and emissions per capita. These locations could be taken as reference models, since the low per capita energy consumption in these cities does not entail a lower living standard; examples of this group include Bornova, Zenica, Mizil, Barcelona, Rubí, Valencia and Tbilisi. Another interesting area in the chart is the bottom-right, where local authorities achieve low per capita GHG emissions even while presenting high per capita energy consumption (Grenoble, Amsterdam, Ranst, Pamplona, Litomerice, Nottingham and Vienna).
Finally, the municipalities on the upper part of the chart present high per capita emissions (Frankfurt, Mannheim, Wakefield, Komotini, Tampere and Dublin).
3.2.2. Renewable Generation vs. Population Density, Energy Consumption and GHG Emissions
From the point of view of per capita renewable generation (rRES), these ratios are extremely low for most of the participants, and no statistically significant correlation was found either with per capita energy consumption (rTC), nor with per capita GHG emissions (rGHG) (Figure 4 and Figure 5). Nor are these low renewable generation ratios linked, as could be assumed, to low renewable resource availability, since no statistically significant correlation was found between the amount of generated renewable energy and local solar irradiation (W/m2) or local wind potential (W/m2) (Figure 6).
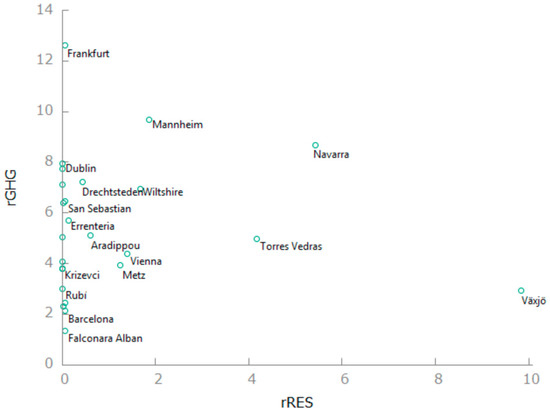
Figure 4.
Scatter plot for per capita renewable energy generation (rRES) and per capita GHG emissions (rGHG).

Figure 5.
Correlation matrix among the inhabitants, per capita GHG emissions (rGHG), per capita total energy consumption (rTC), per capita renewable energy generation (rRES) and population density. (Sample size, n = 23).

Figure 6.
Correlation matrix among climatic factors and per capita renewable energy generation (rRES) (n = 21).
Moreover, according to the data analysed, the neither the population density nor the population have statistically significant correlation with per capita energy consumption (rTC), nor with per capita GHG emissions (rGHG) (Figure 5).
3.2.3. Climatic Factors vs. Energy Consumption and GHG Emissions
On the other hand, climatic factors such as the need for heat (measured in Heating Degree Days, HDD) and the need for cold (measured in Cooling Degree Days, CDD) present the following correlations: (a) The correlation between CDD and HDD is negative and strong (as expected); (b) the higher the CDD, the lower the per capita total energy consumption, which was expected after the correlation in (a); (c) however, there was no correlation between HDD and per capita energy consumption, which was not expected; and d) finally, no correlations were found between climatic factors and per capita GHG emissions. The results show that the need for cold is inversely related to energy demand.
3.2.4. Annual GHG Emission Rates in Local Authorities
Annual emission rates (EmR) give the ratio of GHG emissions per consumed energy unit (in our case expressed in CO2-eq tonnes·MWh−1). According to data gathered from the local authorities participating in mPower, there is a positive significant correlation between per capita GHG emissions (rGHG) and the emission rate (EmR). The linear regression between the two is presented in Figure 7.
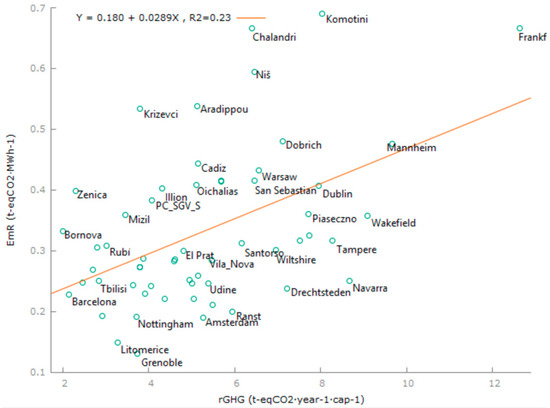
Figure 7.
Regression between per capita GHG emissions and annual emission rates.
For the causal analysis of these diverse emission rates, energy mix patterns can be useful. After the initial literature review, the type and percentage of energy used by several cities in Europe was identified [54] as depicted in Figure 8. As can be observed, most cities belonging to the same country present similar energy mix patterns. Regarding the high rGHG found for Frankfurt, Mannheim, Wakefield, Komotini, Tampere and Dublin (Section 3.2.1), in Figure 8, it can be observed that, in fact, Germany, UK, Greece and Finland use a significant percentage of coal and/or gas in their energy mix.
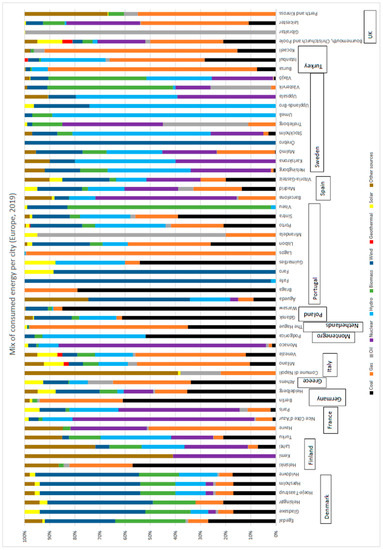
Figure 8.
Energy mix in some European cities in 2019. Source: Own elaboration based on data from CDP Open Data Portal [54].
Additionally, for some of the local authorities participating in the mPower programs, energy mix patterns were collected, and are shown in Figure 9.
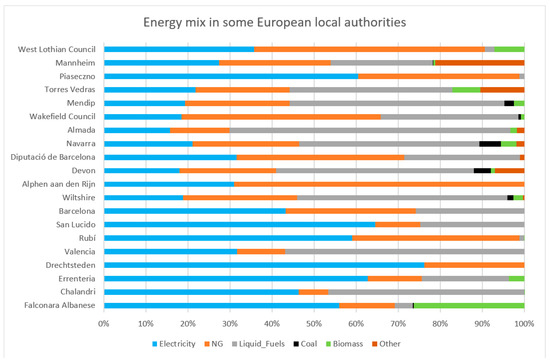
Figure 9.
Energy mix in some local authorities according to the baseline survey in mPower Digital.
While data in Figure 8 only account for primary energy sources, the data collected in the mPower survey (Figure 9) was also considered electricity consumption, which is the main difference between the two charts. Furthermore, the source for Figure 8 only took cities into account, while local authorities participating in mPower Digital were either municipalities, counties or extended areas around cities.
According to both last figures, the presence of fossil fuels (coal, natural gas and liquid fuels) is dominant for most of the local authorities (exceptions being: Falconara Albanese, Errenteria, Drechtsteden and Piaseczno from Figure 9 and cities from Denmark, Iceland, Norway, Sweden and Switzerland from Figure 8). Besides, some cities present noteworthy options for renewable sources like Kemi and Lahti in Finland and Agueda, Fafe, Faro and Viseu in Portugal (Figure 8). With the combination of different low-emission energy sources, cities like Nice and Paris in France and Barcelona, Madrid and Vitoria-Gasteiz in Spain could be underlined as combating global warming and air pollution.
3.3. Impact of Energy Transition Policies at Local Authority Level
One of the research questions in this study is to identify the relationship between the policies and resources available at the local authority level and the impact they can have on the energy transition. For this purpose and with the available data, a correlation analysis of the following variables was performed: transition staff, annual transition budget, citizen-led transition campaigns, municipality-led transition campaigns, annual renewable energy generation (RES), projected new renewable installations, inhabitants, per capita GHG emissions (rGHG) and per capita total energy consumption (rTC). It should be noted that, as indicated in Table 3, answers for these parameters were the most difficult to obtain and hence further analysis should be done to back the results presented in this section.
Correlations were sought among the parameters in absolute values. The statistically significant correlations found were abundant and are expressed in a diagram following the iconography of correlations (Figure 10).
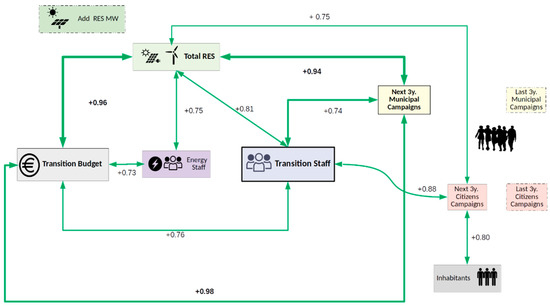
Figure 10.
Correlations among local authority policy parameters (Sample size, n = 8).
As can be observed, the budgets for transition show a strong linear correlation (0.96) with renewable energy generation (MWh·yr−1·cap−1) and with staff involved in the energy transition (0.76). The transition staff presents a correlation with higher renewable energy generation (0.81) and citizen- or cooperative-led transition campaigns (0.88 for campaigns during the last three years and 0.74 for municipality-led campaigns for the next three years). At the same time, the number of citizen- or cooperative-led campaigns in the future showed a positive and strong correlation value (0.80) with the number of inhabitants. Those citizen- or cooperative-led campaigns also correlated with the amount of locally generated renewable energy (0.75 for the next three years). Municipality-led transition campaigns also present correlations with transition budgets (0.98), transition staff (as mentioned before) and the amount of renewable energy generated locally (0.94). Furthermore, staff dedicated to energy strongly correlates with the transition budget (0.73) and total renewable energy generated (0.75).
Following analysis, it was found that the factors with the highest positive relationships with the rest were the number of staff working on energy transition in the municipality and total renewable energy generated locally, as shown in Figure 10.
Not surprisingly, and assuming the most probable cause-effect relation, the higher budget available for energy transition, the more people are working in this field. Additionally, not only transition staff, the budget dedicated to energy transition is also related to the amount of the current renewable energy generation, and to the campaigns that are to be carried out by the municipality.
Finally, it is also necessary to note that the number of inhabitants in a municipality or city has almost no relationship to any of the variables analysed. It has been seen that the only relationship existing is that between the number of inhabitants, and the number of campaigns that are going to be conducted by citizens or cooperatives in the next three years. This may be due to the fact that the larger a municipality is, the higher the expenses and complications related to the energy area (street lighting, municipal buildings, sports centres, etc.), although this point would require further investigation.
This also reveals that regardless of whether a municipality has many or few inhabitants, this has no great bearing on its energy transition initiatives and budget, use of renewable energy or campaigns.
3.4. Regrouped Locations, Averages and Effects
As shown in Table 2, the groups into which the local authorities are arranged (by country) gave significantly different averages (p < 0.05) for the variables per capita GHG emissions and per capita total energy consumption. Moreover, averages of these values fit the linear regression almost perfectly (R2 = 0.994), as can be observed in Figure 11. The main result from this analysis is that municipalities belonging to the SW and NE present similar averages (around 5 CO2-eq-t·cap−1·yr−1 and 16 MWh·cap−1·yr−1), whereas local authorities in the NW group present 25% higher per capita GHG emissions and 48% higher per capita energy consumption. On the other hand, local authorities in the group SE emit 23% less than the average and consume 31% less energy per capita.
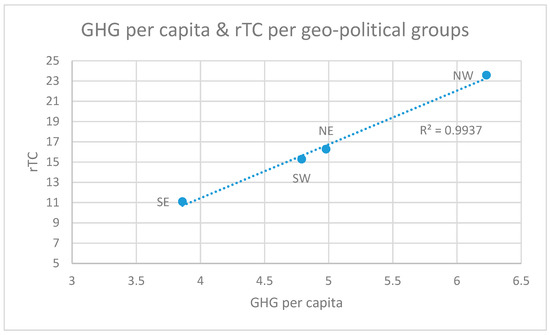
Figure 11.
Regression between average GHG per capita and total energy consumption per capita variables for country groups.
However, and against all intuition, emission ratio averages (EmR) do not present significant differences (around 0.33 CO2eq-t·MWh−1) among the country groups, so according to the available data, the decarbonisation of energy does not seem to be determined by geopolitical parameters.
4. Discussion of Results
In this section a thorough discussion of gathered results is presented in terms of obtained findings and the answers given for the initial research questions.
4.1. Research Findigs
From the results obtained and described in previous section, the following findings are extracted:
Finding #1 (Section 3.1): Energy transitions’ data at municipal or local authority level is low, data gathering percentages are between 16% and 80% (and not always up to date), and a significant part of it was obtained indirectly. This is not novel, and has been previously described in other research publications [26,47,55,56]. This scenario makes decision-making processes complicated.
Finding #2 (Section 3.2.1): Higher per capita energy consumption rates correlate with higher per capita GHG emission rates. In this case, the causality can be determined as the energy consumption generates emissions, whilst, and as far as carbon storage technologies are yet not applied in large scale, the presence of high GHG does not increase energy consumption. So, the higher the rTC, the higher the rGHG. This reinforces the idea that despite the increase in energy efficiency in recent decades, we still have a significant rebound effect in the energy consumption [57,58], and Jevons’ paradox is still valid [59,60,61]. Despite the efforts made so far in energy efficiency and the implementation of renewable energies, energy consumption cannot be decoupled from GHG emissions.
Finding #3 (Section 3.2.1): Cities with low consumption and low emissions might be considered sustanibility models (Bornova, Zenica, Mizil, Barcelona, Rubí, Valencia and Tbilisi). All of them present rTC values under 12 MWh·cap−1·yr−1 and 3 tCO2eq·yr−1·cap−1, which is in line with previously estimated sustainable planetary boundaries [62,63].
Finding #4 (Section 3.2.1): Some cities have been identified presenting low rGHG despite high rTC: Grenoble, Amsterdam, Ranst, Pamplona, Litomerice, Nottingham and Vienna. These cities can show the way forward in decoupling energy consumption from emissions and their energy transition strategies and policies should be carefully studied, in order to find clues that can help other local authorities to follow this path in the future.
For the last two findings (#3 and #4), however, it is true that the data of each of these municipalities need to be carefully contrasted on-site.
Finding #5 (Section 3.2.2): Per capita renewable generation ratios are extremely low, and do not present any correlations with the following variables: rTC, rGHG, local renewable resource availability. The latter, together with the low rRES values obtained, are a clear indicator that the renewable generation is far from achieving the local potentials, indicating a great improvement opportunity.
Finding #6 (Section 3.2.2): Population density and demographic size of municipalities do not significantly affect the rGHG or rTC.
Finding #7 (Section 3.2.3): HDD and CDD correlate negatively, as in the European climatic area, few places present both a large amount of heating and cooling needs. It is more frequent to have one of these two parameters high and the other one low (e.g., hard winters but smooth summers). At the same time, CDD is inversely correlated with the energy consumption rate (rTC). This could be due to the correlation shown in (a), but it could also be that the cooling technologies are not so dependent on energy consumption. For example, Mediterranean buildings consume 100 times less energy in cooling than in heating [55]. Paradoxically, there was no significant correlation between HDD and rTC, neither between rGHG and climatic factors.
Finding #8 (Section 3.2.4): There is a positive correlation between EmR and rGHG. The cause of this could be related to consumed energy mixes where fossil fuels dominate (Figure 8 and Figure 9). Cities in Finland and Portugal bet their energy strategy on renewables, while Nice, Paris, Barcelona, Madrid and Vitoria-Gasteiz present low emissions combining non-fossil technology.
Finding #9 (Section 3.3): Correlations among energy policy variables (in terms of budget, staff, campaigns and renewable installation) were found, even if the sample size of valuable data related to energy policy was scarce, and hence, further studies should be made to back them. Anyway, the findings were as follows:
- #9.1: Transition budget, transition staff, energy staff, total renewable energy generated, municipality-led campaigns for the last three years and citizen- or cooperative-led campaigns present strong positive correlations. However, they are not correlated with new renewable generation power projects, nor with campaigns in the past.
- #9.2: Attending to the amount of correlations they present, transition budget and transition staff are identified as key factors.
Finding #10 (Section 3.3): regardless of whether a municipality has many or few inhabitants, this has no great bearing on its energy transition initiatives and budget, use of renewable energy or campaigns.
Finding #11 (Section 3.4): The main result from this analysis is that municipalities belonging to the groups SW and NE present similar averages (around 5 CO2-eq-t·cap−1·yr−1 and 16 MWh·cap−1·yr−1), whereas local authorities in the NW group present 25% higher per capita GHG emissions and 48% higher per capita energy consumption.
Finding #12 (Section 3.4): emission ratio averages (EmR) do not present significant differences among NW/NE,/SE/SW groups, so the decarbonisation of energy does not seem to be determined by geopolitical parameters.
4.2. Answers to Research Questions
Regarding initially posed research questions, our results and findings give us the following answers:
4.2.1. Main Variables Affecting the Energy Transition
Among the variables tested for relations with municipal energy transition, many (such as demographic size of local authority, population density, local renewable resource availability and HDD) were identified as not having any impact on energy transition (Findings #5, #6, #7 and #10). Nevertheless, total energy consumption (Finding #2) and annual emission rates (Finding #8) correlate positively with GHG emissions. Hence, reducing rTC and EmR should be sought. Moreover, the geopolitical culture in which municipalities are present significative differences in rGHG and rTC. Alternatively, and considering findings #4, #8 and #12, it might be established that the improvement of annual GHG emission rates (EmR) does not relate only with geopolitical cultural areas, but more with local strategies.
4.2.2. Relationships between Renewable Energy Production, Local Energy Transition Resources, GHG Emissions and Total Energy Consumption
After Findings #9 and #10 renewable energy production values in municipalities are strongly and positively related with local energy transition resources (budget, staff and campaigns). This means that local energy transition resources are considered as key factors.
In contrast (Finding #5) no relationships were found between renewable energy production and GHG emissions, or total energy consumed.
4.2.3. Link between the Geopolitical and/or Climate Situation and GHG Emissions or Total Energy Consumption
From Finding #11, it can be stated that geopolitical cultures imply a decisive role in the energy transition in terms of per capita emission rates and per capita total energy consumption. However, from Finding #12, it cannot be claimed that geopolitical cultures imply an effect on annual emission rates (EmR).
From Finding #2, higher per capita energy consumption implies higher per capita GHG emissions.
From Finding #7, only a negative correlation was found between climatic factors (CDD) and total energy consumption rates (rTC). None was found with the per capita GHG emission rates (rGHG).
5. Conclusions
The followed research methodology provides answers to the initial questions that can be summarised along four main axes:
First, although it was not initially among our research questions, the reality of data scarcity in energy transition parameters at the local level has come to light. Consequently, it is difficult to make a clear diagnosis of the situation, and therefore to elaborate well-tailored action plans. Moreover, efforts to monitor the plans and their impacts may be inadequate. In the same vein, we might point out the difference in data availability among GHG emission data and the rest of parameters and research the causes for that. In fact, referred data gaps, especially in local energy policy data, limit the extrapolability of some of the results in this paper, so further research should be done for validation.
As a second conclusion, and even if correlations do not imply cause and effect, it has been confirmed that at the local level, higher energy consumption rates coincide with higher GHG emissions. Hence, in order to achieve emission reduction targets, it is utterly necessary to drastically reduce the use of energy, especially in local authorities considered to belong to group NW (Table 2) (since decarbonisation of the energy sector is not happening fast enough, and so energy demand must decrease).
Another conclusion to be taken into account is the importance for municipalities to have a budget for energy transition and staff working in the field of energy transitions. As shown in Figure 10, the correlations between transition staff and many of the variables are highly positive. As mentioned before, sustainability challenges (clean environment, care of biodiversity, health and education systems), as well as providing basic infrastructure services (water, mobility, housing, energy) compete at municipal level for scarce financial, human and technical resources. Based on our data, however, the more staff and budget a local authority dedicates to energy transition, the greater its impact on local renewable energy generation. Although our results also show that higher renewable energy generation does not imply lower GHG emissions, from our understanding it is because of very low renewable generation rates, according to local renewable resource availability (finding #5).
It has been shown that the annual rate of emissions (EmR) has no obvious relationship with the size of the city, nor with climate (HDD and CDD) (Figure 2). However, after grouping the cities from a geopolitical point of view (Table 2), it was found that the geopolitical location of the cities presents a linear relationship to both the average of per capita GHG emission rates and the average of per capita total energy consumption. In countries where economic development may be lower, such as cities in southeast Europe, the average per capita emissions are lower, as is per capita energy consumption. Countries in southwest and northeast Europe show very similar ratios, although a precise relationship cannot be drawn between these ratios and climate. The areas studied have very different climatic and geographical characteristics, with very high variability in CDD and HDD values. The relationship shows more indications related to politics and economics, with cities in the northwest section of Europe, which have the highest economic ratios, having a higher per capita emissions ratio average than the rest, even though their energy efficiency policies and support for renewables are the most advanced. This interesting conclusion is only an initial superficial approximation that needs to be further investigated in the future, but it may show that the geopolitical location of the local authorities, as well as their energy consumption, can strongly influence their greenhouse gas emissions ratios. However, evidence has also been found about some cities belonging to a certain geopolitical group (findings #3 and #4) and presenting significatively different emission and consumption ratios, and this should also be further analysed (by further checking used data and adopted strategies on-site). This sheds light to the possibility of municipalities to design and follow (up to some but significant extent) their own energy transition paths, which brings them empowerment and motivation.
Finally, although it was not an initial research objective, the global COVID-19 pandemic has been a major disruption to the mPower project, as priorities in the local authorities have changed abruptly. In particular, within this data gathering and monitoring task, it resulted in fewer authorities participating in courses and less data availability compared with the previous year for those attending.
Author Contributions
Conceptualisation: O.A.-Z., I.B.-H., I.B.-P. and A.C.-C.; Data curation: O.A.-Z.; Formal analysis: O.A.-Z.; Investigation: O.A.-G., O.A.-Z., I.B.-H., I.B.-P., A.C.-C., E.V., U.V.-C. and E.Z.; Methodology: O.A.-Z. and I.B.-P.; Writing—original draft: O.A.-Z. and I.B.-P.; and Writing—review & editing: O.A.-G., O.A.-Z., I.B.-P. and E.V. All authors have read and agreed to the published version of the manuscript.
Funding
This research was funded by the European Union’s H2020 Research and Innovation programme under grant agreement 785171—mPOWER project. The research has been supported by ‘Ekopol: Iraunkortasunerako Bideak’ research group, recognised by the Basque Government (IT-1365-19) and the University of the Basque Country (GIC-18/22).
Institutional Review Board Statement
Not applicable.
Informed Consent Statement
Not applicable.
Data Availability Statement
This research has mostly been developed with the energy data gathered by the authors using a specific online questionnaire (Appendix B) directed to 97 local authorities (cities, counties and communities). When necessary authors have gathered CO2 emissions data from Covenant of Mayors [64] and Global Covenant of Mayors [65]. Additionally, national data obtained from the International Energy Agency [3]; wind potential data obtained from the Global Wind Atlas [66]; HDD and CDD data from DegreeDays.net [67]. Energy mix data for cities in 2019 was gathered from CDP Open Data Portal [54].
Acknowledgments
The authors would like to recognize the effort made by the technicians of the 97 analyzed cities, during the data gathering process and also all the mPOWER research team from the University of Glasgow, Platform-London, Stitching Transnational Institute, The Society for the Reduction of Carbon Limited, Institute for Political Ecology and Energy Cities (Energy-Cities Association). Authors would also like to thank Itsaso Leceta for support in statistical theory. All statistical analyses were performed using the GNU software Gretl [68].
Conflicts of Interest
The authors declare no conflict of interest. The funders had no role in the design of the study; in the collection, analyses or interpretation of data; in the writing of the manuscript; or in the decision to publish the results.
Appendix A
Table A1.
List of considered local authorities, country, type and inhabitants.
Table A1.
List of considered local authorities, country, type and inhabitants.
| Country | Name of Local Authority | Abreviated Name | M/D | Inhabitants |
|---|---|---|---|---|
| Austria | Vienna | Vienna | M | 1,911,191 |
| Belgium | Ghent | Ghent | M | 263,927 |
| Ranst | Ranst | M | 19,187 | |
| Bosnia & H. | Zenica | Zenica | M | 109,679 |
| Burgas | Burgas | M | 210,000 | |
| Bulgaria | Dobrich | Dobrich | M | 82,240 |
| Silistra | Silistra | M | 44,940 | |
| Dubrovnik | Dubrovnik | M | 44,743 | |
| Krizevci | Krizevci | M | 21,000 | |
| Croatia | Rijeka | Rijeka | M | 128,000 |
| Velika Gorica | Velika | M | 63,517 | |
| Zagreb | Zagreb | M | 807,254 | |
| Cyprus | Aradippou | Aradippou | M | 19,228 |
| Nicosía (South) | Nicosía | M | 55,014 | |
| Czech R. | Litomerice | Litomerice | M | 25,000 |
| Denmark | Frederikshavn | Frederikshavn | M | 61,000 |
| Finland | Tampere | Tampere | M | 232,000 |
| Auxerre | Auxerre | M | 34,634 | |
| France | Grenoble | Grenoble | M | 451,096 |
| Metz | Metz | M | 222,000 | |
| Georgia | Tbilisi | Tbilisi | M | 1,184,818 |
| Germany | Frankfurt | Frankfurt | M | 750,000 |
| Mannheim | Mannheim | M | 324,009 | |
| Chalandri | Chalandri | M | 74,000 | |
| Greece | Illion (University of West Attica) | Illion | M | 84,793 |
| Komotini | Komotini | M | 66,919 | |
| Oichalias | Oichalias | M | 11,228 | |
| Atlantic Seaboard North (Donegal, Sligo, Mayo, Galway Climate Change Agency) | Atlantic | D | 613,292 | |
| Ireland | Dublin | Dublin | M | 553,165 |
| Kells | Kells | M | 6135 | |
| Meath County Council | Meath | D | 195,044 | |
| Acquappesa | Acquappesa | M | 1876 | |
| Falconara Albanese | Falconara | M | 1451 | |
| Mantova | Mantova | M | 48,835 | |
| Italy | Palma Campania, San Giuseppe Vesuviano and Striano | PC_SG_S | D | 54,750 |
| San Lucido | Lucido | M | 6223 | |
| Santorso | Santorso | M | 5236 | |
| Udine | Udine | M | 97,761 | |
| Lithuania | Tauragé | Tauragé | M | 43,853 |
| Montenegro | Podgorica | Podgorica | M | 622,028 |
| Alphen aan den Rijn | Alphen | M | 120,000 | |
| Amsterdam | Amsterdam | M | 854,316 | |
| Netherlands | Drechtsteden | Drechtsteden | D | 280,000 |
| Heerhugowaard | Heerhugowaard | M | 58,389 | |
| Heerlen | Heerlen | M | 86,935 | |
| Horst aan de Maas | Horst | M | 42,295 | |
| Palecznica | Palecznica | M | 3600 | |
| Poland | Piaseczno | Piaseczno | M | 79,861 |
| Warsaw | Warsaw | M | 1,790,658 | |
| Almada | Almada | M | 96,404 | |
| Portugal | Matosinhos | Matosinhos | M | 175,478 |
| Torres Vedras | Torres Vedras | M | 80,000 | |
| Vila Nova de Gaia | Vila | M | 299,938 | |
| Romania | Miercurea Ciuc | Miercurea | M | 41,971 |
| Mizil | Mizil | M | 14,312 | |
| Belgrade | Belgrade | M | 1,166,763 | |
| Serbia | Negotin | Negotin | M | 32,007 |
| Niš | Niš | M | 260,000 | |
| Šabac | Šabac | M | 110,148 | |
| Barcelona | Barcelona | M | 1,600,000 | |
| Cadiz | Cadiz | M | 119,000 | |
| Canet d’En Berenguer | Canet | M | 6697 | |
| Consell Comarcal Girones | CC_Girones | D | 197,104 | |
| Diputació de Barcelona | D_Barcelona | D | 5,664,579 | |
| El Prat de Llobregat | E_Prat | M | 65,385 | |
| Errenteria | Errenteria | M | 40,030 | |
| Spain | Logroño | Logroño | M | 152,485 |
| Lugo | Lugo | M | 98,276 | |
| Mollet del Vallès | Mollet | M | 51,600 | |
| Monachil | Monachil | M | 8007 | |
| Navarra | Navarra | D | 654,214 | |
| Pamplona | Pamplona | M | 203,944 | |
| Rubí | Rubí | M | 77,464 | |
| San Sebastian | San Sebastian | M | 180,989 | |
| Valencia | Valencia | M | 800,000 | |
| Sweden | Malmö | Malmö | M | 344,166 |
| Växjö | Växjö | M | 92,000 | |
| Adalar | Adalar | M | 15,238 | |
| Bornova (Izmir) | Bornova | M | 450,992 | |
| Turkey | Çorlu | Çorlu | M | 288,692 |
| Istanbul Metropolitan Municipality | Istanbul | M | 15,519,267 | |
| Kepez | Kepez | M | 30,436 | |
| Kirklareli | Kirklareli | M | 79,038 | |
| Coventry | Coventry | D | 363,242 | |
| Devon | Devon | D | 802,375 | |
| Manchester | Manchester | M | 2,700,000 | |
| Mendip | Mendip | D | 115,587 | |
| North Somerset Council | North Somerset | D | 213,919 | |
| UK | Nottingham | Nottingham | M | 330,000 |
| Plymouth | Plymouth | M | 260,000 | |
| Rochdale | Rochdale | M | 211,000 | |
| Sheffield City Region & West Yorkshire Combiend | Shef&W_York | D | 1,400,000 | |
| Wakefield Council | Wakefield | D | 348,312 | |
| West Lothian Council | West Lothian | D | 183,000 | |
| Wiltshire | Wiltshire | D | 500,024 | |
| Ukraine | Lviv | Lviv | M | 724,314 |
| Zhytomyr City Council | Zhytomyr | M | 264,318 |
Table A2.
Values of rGHG and rTC obtained after data validation.
Table A2.
Values of rGHG and rTC obtained after data validation.
| Name of Local Authority | rGHG [CO2-eq-t·cap−1·yr−1] | rTC [MWh·cap−1·yr−1] |
|---|---|---|
| Acquappesa | 2.61 | 9.56 |
| Adalar | - | - |
| Almada | 5.24 | 33.78 |
| Alphen aan den Rijn | 9.73 | |
| Amsterdam | 5.27 | 27.78 |
| Aradippou | 5.12 | 9.51 |
| Atlantic Seaboard North | - | - |
| Auxerre | 0.49 | - |
| Barcelona | 2.13 | 9.37 |
| Belgrade | - | - |
| Bornova (Izmir) | 2.00 | 6.02 |
| Burgas | 5.68 | 13.73 |
| Cadiz | 5.14 | 11.59 |
| Canet d’En Berenguer | - | - |
| Chalandri | 6.39 | 9.60 |
| Consell Comarcal Girones | 5.00 | - |
| Çorlu | - | - |
| Coventry | 3.58 | - |
| Devon | 10.34 | 28.66 |
| Diputació de Barcelona | 4.42 | - |
| Dobrich | 7.11 | 14.82 |
| Drechtsteden | 7.22 | 30.44 |
| Dublin | 7.96 | 19.58 |
| Dubrovnik | - | - |
| El Prat de Llobregat | 4.82 | 16.05 |
| Errenteria | 5.69 | 13.71 |
| Falconara Albanese | 1.35 | - |
| Frankfurt | 12.62 | 18.93 |
| Frederikshavn | 7.51 | 23.68 |
| Ghent | 5.48 | 26.06 |
| Grenoble | 3.73 | 28.71 |
| Heerhugowaard | - | - |
| Heerlen | 9.52 | - |
| Horst aan de Maas | 16.43 | 48.27 |
| Illion (University of West Attica) | 4.30 | 10.68 |
| Istanbul | 3.06 | 0.63 |
| Kells | - | - |
| Kepez | - | - |
| Kirklareli | - | - |
| Komotini | 8.04 | 11.64 |
| Krizevci | 3.80 | 7.11 |
| Litomerice | 3.27 | 22.02 |
| Logroño | 4.58 | 16.18 |
| Lugo | - | - |
| Lviv | 3.88 | 13.53 |
| Malmö | 1.53 | - |
| Manchester | 5.00 | 20.29 |
| Mannheim | 9.67 | 20.30 |
| Mantova | 5.14 | 19.89 |
| Matosinhos | 4.61 | 16.15 |
| Meath County Council | 7.45 | - |
| Mendip | 7.73 | 23.74 |
| Metz | 3.92 | 17.15 |
| Miercurea Ciuc | - | - |
| Mizil | 3.45 | 9.60 |
| Mollet del Vallès | 2.70 | 10.05 |
| Monachil | - | - |
| Navarra | 8.67 | 34.56 |
| Negotin | - | - |
| Nicosía (South) | - | 21.94 |
| Niš | 6.46 | 10.86 |
| North Somerset Council | - | - |
| Nottingham | 3.70 | 19.36 |
| Oichalias | 5.11 | 12.52 |
| Palecznica | 5.68 | - |
| Palma Campania, San Giuseppe Vesuviano and Striano | 4.07 | 10.63 |
| Pamplona | 5.04 | 22.82 |
| Piaseczno | 7.72 | 21.43 |
| Plymouth | 4.05 | 16.76 |
| Podgorica | 2.25 | - |
| Ranst | 5.95 | 29.76 |
| Rijeka | 3.80 | 13.96 |
| Rochdale | 4.41 | - |
| Rubí | 3.01 | 9.75 |
| Šabac | - | - |
| San Lucido | - | - |
| San Sebastian | 6.47 | 15.55 |
| Santorso | 6.17 | 19.75 |
| Sheffield City Region & West Yorkshire Combined | 7.93 | - |
| Silistra | - | - |
| Tampere | 8.28 | 26.18 |
| Tauragé | - | - |
| Tbilisi | 2.85 | 11.36 |
| Torres Vedras | 4.95 | 19.67 |
| Udine | 5.39 | 21.95 |
| Valencia | 2.45 | 9.89 |
| Växjö | 2.91 | 15.09 |
| Velika Gorica | 3.80 | 13.92 |
| Vienna | 4.37 | 19.76 |
| Vila Nova de Gaia | 5.47 | 19.26 |
| Wakefield Council | 9.09 | 25.47 |
| Warsaw | 6.55 | 15.19 |
| West Lothian Council | .20 | 0.63 |
| Wiltshire | 6.95 | 23.10 |
| Zagreb | 3.63 | 14.90 |
| Zenica | 2.31 | 5.80 |
| Zhytomyr City Council | 2.80 | 9.19 |
Appendix B. Baseline Survey for Energy Transition in mPower Digital
Welcome to the mPower Digital Learning Program!
This is the online survey that allows the mPower team to establish a baseline for the energy transition project in your municipality. Try to answer all the questions do not hesitate to add more information or send your questions where necessary to olatz.azurza@ehu.eus.
Thank you for participating!
Disclaimers:
Data protection:
This project has received funding from the European Union’s Horizon 2020 research and innovation program under grant agreement number 785171. This project follows the EU data protection & security law, which is enforceable since 25 May 2018.
Please click here. I agree to share this data with the mPower Project.
Data use:
This data may be used to enhance the current transition towards a sustainable energy system in the European Union. The data may not be used for private or profit purposes but only as a public and free resource. The generated and published data will be stored in Glasgow Enlighten: Research Data (the University of Glasgow [UGLA]’s research data repository online), which meets the EU’s open research data pilot requirements. Please remember that the data obtained in this survey can be used for scientific purposes (publications, conferences, etc.) and the collected, generated and published data will be stored in Glasgow Enlighten: Research Data (the University of Glasgow [UGLA]’s research data repository online), which meets the EU’s open research data pilot requirements.
Please click here. I agree to share our municipality energy transition data for scientific purposes as it is public in nature.
Introduction:
Name: ________________
Email contact: ________________
Municipality: ________________
Country: ________________
Inhabitants: ________________ (data year: 201_). The preferred data year is 2019.
PART 1: ENERGY GENERATION AND CONSUMPTION, GHG EMISSIONS
Renewable energy generation data:
Please indicate the type of data you are providing:
(Preferred) Please click here I will consider all renewable installations in my municipality (whether public or private).
Please click here. I will only consider all public renewable installations in my municipality:
Installed renewable thermal power: ________________MW;
(data year: 201_) The preferred data year is 2019.
Renewable thermal energy production: ________________ MWh/year;
(data year: 201_) The preferred data year is 2019.
Installed renewable electric power: ________________ MW;
(data year: 201_) The preferred data year is 2019.
Renewable electric energy production: ________________MWh/year;
(data year: 201_) The preferred data year is 2019.
Source of data: Municipal/Other. Link (if other): ________________
Any other comments: ________________
NOTE: Please fill in the “data year”. It is very important for us. The data should be from 2019 or as close as possible. Thank you!
Energy consumption data:
Please, indicate the type of data you are providing:
(Preferred) Please click here I will consider all forms of energy consumption in my municipality (whether public or private).
Please click here. I will only consider all forms of public energy consumption in my municipality:
Electricity: ________________MWh/year;
(data year: 201_)
Natural gas: ________________MWh/year;
(data year: 201_)
Liquid fuels (i.e., mobility etc.): ________________MWh/year;
(data year: 201_)
Coal: ________________MWh/year;
(data year: 201_)
Biomass: ________________MWh/year;
(data year: 201_)
Other: Type: ________________; ________________MWh/year;
(data year: 201_)
Source of data: Municipal/Other. Link (if other): ________________
Comments: ________________
NOTE: Please fill in the “data year”. It is very important for us. The data should be from 2019 or as close as possible. Thank you!
Greenhouse Gas Emissions data:
Please indicate the type of data you are providing:
(Preferred) please click here I will consider all forms of energy consumption in my municipality (whether public or private).
Please click here. I will only consider all forms of public energy consumption in my municipality:
GHG emissions: ________________eq-CO2 tonnes/year;
(data year: 201_)
Source of data: Municipal/Other. Link (if other): ________________
Comments: ________________
If your city/municipality has any data documents with more information about energy or GHG emission data, you can share the link with us here (or send it via email to olatz.azurza@ehu.eus).
PART 2: BUDGET and STAFF
Plans for investment
In this section we are interested in past and the future plans for energy transition, and the information about citizen participation in your municipality’s energy transition:
Does your municipality already have published plans for renewable energy power development? Y/N
If so, what’s the amount of additional renewable power (MW) planned for the next tax year? :________________
Budget and Staff
People working on energy issues: ________________ (data year: 201_) (number of equivalent full-time municipal employees or subcontractees.)
People working on energy transition issues: ________________ (data year: 201_) (energy efficiency, promotion of renewable energies, energy democracy, sustainable mobility, etc. Please, do NOT count people working on energy issues again.)
Annual budget for energy transition (should exclude personal costs): ________________ (data year: 201_)
Source of data: Municipal/Other. Link (if other): ________________
Comments: ________________
If you have any interesting documents that you want to share with us about the energy transition in your municipality, you can paste the link here (or send it via email to olatz.azurza@ehu.eus).
Campaigns and citizen participation:
Number of municipality-led initiatives and campaigns for energy transition in the LAST 3 years: ________________
Number of municipality-led initiatives and campaigns for energy transition for the NEXT 3 years: ________________
Number of citizen/cooperative-led initiatives and campaigns for energy transition in the LAST 3 years: ________________
Number of citizen/cooperative led initiatives and campaigns for energy transition for the NEXT 3 years: ________________
Source of data: Municipal/Other. If other, link:
Comments: ________________
If you have any documens about the staff, campaigns and budget for energy transition that you want to share, you can paste the link here (or send it via email to olatz.azurza@ehu.eus).
Appendix C. List of Variables Gathered during Data Collection
Table A3.
List of variables, units and metadata gathered from local authorities.
Table A3.
List of variables, units and metadata gathered from local authorities.
| Geographical DATA (Demographic, Climatic) | Acronym | Unit | Metadata | ||
|---|---|---|---|---|---|
| Name | N | - | Doc_link | - | Comments_questionaire |
| Country | C | - | - | - | - |
| Inhabitants | Inhab | - | Inhab_year | Inhab_source | Prac_comment |
| Area | A | km2 | - | Area_source | - |
| Temperature Increase | TI | °C | - | [69] | - |
| Heating Degree Days | HDD | Celsius-based degree days | HDD_year | [67] | - |
| Cooling Degree Days | CDD | Celsius-based degree days | CDD_year | [67] | - |
| Irradiance | Irrad | W/m2 | Irra_year | [70] | - |
| Wind_potential | WP | W/m2 | WP_year | [66] | - |
| Renewable Energy Generation Data | Unit | ||||
| Data Type | DTR | All/public | R_link | Source_R | R_Comments |
| Thermal Power | TP_MW | MW | TP_year | - | - |
| Thermal Energy | TE_MWh | MWh/year | TE_year | - | - |
| Electric Power | EP_MW | MW | EP_year | - | - |
| Electric Energy | EE_MWh | MWh/year | EE_year | - | - |
| Annual Energy Consumption | Unit | ||||
| Data Type | DTC | All/public | C_link | Source_C | C_Comments |
| Electricity | EC_MWh | MWh/year | EC_year | - | - |
| Natural_Gas | NG_MWh | MWh/year | NG_year | - | - |
| Liquid_Fuels | LF_MWh | MWh/year | LF_year | - | - |
| Coal | C_MWh | MWh/year | Coal_year | - | - |
| Biomass | B_MWh | MWh/year | B_year | - | - |
| Other energy type | - | - | - | ||
| Other Energy E | OE_MWh | MWh/year | OE_year | - | - |
| Annual Total Consumption | TC_MWh | MWh/year | TC_year | - | - |
| GHG Emissions | Unit | ||||
| Data Type | DTE | All/public | E_link | Source_E | E_comments |
| Annual GHG Emissions | GHG | eq_CO2_tonnes/year | GHG_year | - | - |
| Plans/Staff/Budget | Unit | ||||
| Published plans for Renewable Power | Plan | Yes/No | Budget_link | - | - |
| Additional RES Power next year | Add_MW | MW | - | - | - |
| Staff in energy issues | Staff_energy | Full Time Equivalent | Staff_year | - | - |
| Staff in transition issues | Staff_transition | Full Time Equivalent | - | - | - |
| Annual transition budget | Trans_budg | € | Budget_year | Budget_source | - |
| Transition Campaigns | Unit | ||||
| Number_munic_led_transit_last3y | # | Source_link | Data_source | - | |
| Number_munic_led_transit_next3y | # | - | - | - | |
| Number_citizen_coop_led_ last3y | # | - | - | - | |
| Number_citizen_coop_led_ next3y | # | - | - | - | |
Table A4.
List of variables derived from original data.
Table A4.
List of variables derived from original data.
| Derived Variable | Acronym | Unit | Formula |
|---|---|---|---|
| Population Density | Pop_density | Inhab/km2 | = Inhab/A |
| Annual GHG Emissions per capita | rGHG | eq_CO2_tonnes/year/inhab | = GHG/Inhab |
| Annual Total Consumption per capita | rTC | MWh/year/inhab | = TC/Inhab |
| Emission Rate | EmR | eq_CO2_tonnes/MWh | = GHG/TC |
| Annual Renewable Energy Generation | tRES | MWh/year | = (TE_MWh + EE_MWh) |
| Annual Renewable Energy Generation per capita | rRES | MWh/year/Inhab | = tRES/Inhab |
| Annual Renewable energy generation vs. Total Energy Consumption | RES_TC | (-) | = tRES/TC |
| Transition Staff per capita | rStaff | FTE/Inhab | = Staff_transition/Inhab |
| Annual Transition Budget per capita | rBudget | €/year/Inhab | = Trans_budg/Inhab |
| Thermal renewable energy generation utility Capacity Factor | CF_ther_RES | (-) | = TE_MWh/(TP_MW·24·365) |
| Electrical renewable energy generation utility Capacity Factor | CF_elec_RES | (-) | = EE_MWh/(EP_MW·24·365) |
References
- McGlade, C.; Ekins, P. The geographical distribution of fossil fuels unused when limiting global warming to 2 °C. Nature 2015, 517, 187–190. [Google Scholar] [CrossRef]
- European Commission. Communication From The Commission To The European Parliament, The European Council, The Council, The European Economic And Social Committee And The Committee Of The Regions The European Green Deal. 2019. Available online: https://eur-lex.europa.eu/legal-content/EN/TXT/?uri=CELEX%3A52019DC0640 (accessed on 23 June 2021).
- IEA. Data tables—Data & Statistics, IEA. 2018. Available online: https://www.iea.org/data-and-statistics/data-tables (accessed on 18 May 2021).
- European Union. 2050 long-Term Strategy. Climate Action—European Commission. 2016. Available online: https://ec.europa.eu/clima/policies/strategies/2050_en (accessed on 3 May 2021).
- Burke, M.J.; Stephens, J. Political power and renewable energy futures: A critical review. Energy Res. Soc. Sci. 2018, 35, 78–93. [Google Scholar] [CrossRef]
- Akizu, O.; Urkidi, L.; Bueno, G.; Lago, R.; Barcena, I.; Mantxo, M.; Basurko, I.; Lopez-Guede, J.M. Tracing the emerging energy transitions in the Global North and the Global South. Int. J. Hydrogen Energy 2017, 42, 18045–18063. [Google Scholar] [CrossRef]
- Florini, A.; Sovacool, B.K. Who governs energy? The challenges facing global energy governance. Energy Policy 2009, 37, 5239–5248. [Google Scholar] [CrossRef]
- van der Schoor, T.; van Lente, H.; Scholtens, B.; Peine, A. Challenging obduracy: How local communities transform the energy system. Energy Res. Soc. Sci. 2016, 13, 94–105. [Google Scholar] [CrossRef]
- Allen, E.; Lyons, H.; Stephens, J.C. Women’s leadership in renewable transformation, energy justice and energy democracy: Redistributing power. Energy Res. Soc. Sci. 2019, 57. [Google Scholar] [CrossRef]
- Bell, S.E.; Daggett, C.; Labuski, C. Toward feminist energy systems: Why adding women and solar panels is not enough. Energy Res. Soc. Sci. 2020, 68, 101557. [Google Scholar] [CrossRef]
- Liu, L.; Bouman, T.; Perlaviciute, G.; Steg, L. Effects of trust and public participation on acceptability of renewable energy projects in the Netherlands and China. Energy Res. Soc. Sci. 2019, 53, 137–144. [Google Scholar] [CrossRef]
- Capellán-Pérez, I.; Campos-Celador, Á.; Terés-Zubiaga, J. Renewable Energy Cooperatives as an instrument towards the energy transition in Spain. Energy Policy 2018, 123, 215–229. [Google Scholar] [CrossRef]
- Dóci, G.; Vasileiadou, E.; Petersen, A.C. Exploring the transition potential of renewable energy communities. Futures 2015, 66, 85–95. [Google Scholar] [CrossRef] [Green Version]
- Hentschel, M.; Ketter, W.; Collins, J. Renewable energy cooperatives: Facilitating the energy transition at the Port of Rotterdam. Energy Policy 2018, 121, 61–69. [Google Scholar] [CrossRef]
- Grabs, J.; Langen, N.; Maschkowski, G.; Schäpke, N. Understanding role models for change: A multilevel analysis of success factors of grassroots initiatives for sustainable consumption. J. Clean. Prod. 2016, 134, 98–111. [Google Scholar] [CrossRef]
- Seyfang, G.; Haxeltine, A. Growing Grassroots Innovations: Exploring the Role of Community-Based Initiatives in Governing Sustainable Energy Transitions. Environ. Plan. C Gov. Policy 2012, 30, 381–400. [Google Scholar] [CrossRef] [Green Version]
- Kooij, H.-J.; Oteman, M.; Veenman, S.; Sperling, K.; Magnusson, D.; Palm, J.; Hvelplund, F. Between grassroots and treetops: Community power and institutional dependence in the renewable energy sector in Denmark, Sweden and the Netherlands. Energy Res. Soc. Sci. 2018, 37, 52–64. [Google Scholar] [CrossRef]
- Akizu, O.; Bueno, G.; Barcena, I.; Kurt, E.; Topaloğlu, N.; Lopez-Guede, J.M. Contributions of Bottom-Up Energy Transitions in Germany: A Case Study Analysis. Energies 2018, 11, 849. [Google Scholar] [CrossRef] [Green Version]
- Hoicka, C.E.; Conroy, J.; Berka, A.L. Reconfiguring actors and infrastructure in city renewable energy transitions: A regional perspective. Energy Policy 2021, 158, 112544. [Google Scholar] [CrossRef]
- Blanchet, T. Struggle over energy transition in Berlin: How do grassroots initiatives affect local energy policy-making? Energy Policy 2015, 78, 246–254. [Google Scholar] [CrossRef]
- IEA. Cities Are at the Frontline of the energy Transition—News, IEA, Sep. 2016. Available online: https://www.iea.org/news/cities-are-at-the-frontline-of-the-energy-transition (accessed on 10 June 2021).
- United Nations. ‘Transforming our World: The 2030 Agenda for Sustainable Development’, United Nations, A/RES/70/1. 2015. Available online: https://sdgs.un.org/sites/default/files/publications/21252030%20Agenda%20for%20Sustainable%20Development%20web.pdf (accessed on 4 May 2021).
- UNFCCC. Urban Climate Action Is Crucial to Bend the Emissions Curve. 2020. Available online: https://unfccc.int/news/urban-climate-action-is-crucial-to-bend-the-emissions-curve (accessed on 10 June 2021).
- C40. Urban Climate Action Impacts Framework: A Framework for Describing and Measuring the Wider Impacts of Urban Climate Action. 2020. Available online: https://www.c40.org/research (accessed on 10 June 2021).
- European Commission. The European Green Deal. 2019. Available online: https://eur-lex.europa.eu/resource.html?uri=cellar:b828d165-1c22-11ea-8c1f-01aa75ed71a1.0002.02/DOC_1&format=PDF (accessed on 3 May 2021).
- Cumbers, A.; Traill, H. Public Ownership in the Pursuit of Economic Democracy in a Post-Neoliberal Order. In Economic Policies for a Post-Neoliberal World; Arestis, P., Sawyer, M., Eds.; Springer International Publishing: Cham, Switzerland, 2021; pp. 225–268. [Google Scholar] [CrossRef]
- Geels, F.W.; Sovacool, B.K.; Schwanen, T.; Sorrell, S. Sociotechnical transitions for deep decarbonization. Science 2017, 357, 1242–1244. [Google Scholar] [CrossRef]
- Truffer, B.; Murphy, J.T.; Raven, R. The geography of sustainability transitions: Contours of an emerging theme. Environ. Innov. Soc. Transit. 2015, 17, 63–72. [Google Scholar] [CrossRef]
- Comodi, G.; Cioccolanti, L.; Polonara, F.; Brandoni, C. Local authorities in the context of energy and climate policy. Energy Policy 2012, 51, 737–748. [Google Scholar] [CrossRef]
- Pérez, M.D.L.E.M.; Scholten, D.; Stegen, K.S. The multi-speed energy transition in Europe: Opportunities and challenges for EU energy security. Energy Strat. Rev. 2019, 26, 100415. [Google Scholar] [CrossRef]
- Emelianoff, C. Local Energy Transition and Multilevel Climate Governance: The Contrasted Experiences of Two Pioneer Cities (Hanover, Germany, and Vãxjã, Sweden). Urban Stud. 2014, 51, 1378–1393. [Google Scholar] [CrossRef]
- Dhakal, S.; Ruth, M. Creating low Carbon Cities; 1 online resource vols; Springer: Cham, Switzerland, 2017; Available online: http://site.ebrary.com/id/11360288 (accessed on 5 May 2021).
- Broto, V.C.; Robin, E.; While, A.H. Climate Urbanism: Towards a Critical Research Agenda; 1 online resource vols; Palgrave Macmillan: Cham, Switzerland, 2020; Available online: https://search.ebscohost.com/login.aspx?direct=true&scope=site&db=nlebk&db=nlabk&AN=2694667 (accessed on 5 May 2021).
- Dobbelsteen, A.V.D.; Roggema, R.; Tillie, N.; Broersma, S.; Fremouw, M.; Martin, C.L. Urban Energy Masterplanning—Approaches, Strategies, and Methods for the Energy Transition in Cities. Urban Energy Transit. 2018, 635–660. [Google Scholar] [CrossRef]
- Joas, F.; Pahle, M.; Flachsland, C.; Joas, A. Which goals are driving the Energiewende? Making sense of the German Energy Transformation. Energy Policy 2016, 95, 42–51. [Google Scholar] [CrossRef]
- Akizu-Gardoki, O.; Wakiyama, T.; Wiedmann, T.; Bueno, G.; Arto, I.; Lenzen, M.; Lopez-Guede, J.M. Hidden Energy Flow indicator to reflect the outsourced energy requirements of countries. J. Clean. Prod. 2020, 278, 123827. [Google Scholar] [CrossRef]
- Tagliapietra, S.; Zachmann, G.; Edenhofer, O.; Glachant, J.-M.; Linares, P.; Loeschel, A. The European union energy transition: Key priorities for the next five years. Energy Policy 2019, 132, 950–954. [Google Scholar] [CrossRef] [Green Version]
- Mediavilla, M.; Miguel, L.J. Un modelo marco para la transición energética. In Proceedings of the 9th International Conference of the European Society for Ecological Economics, Istanbul, Turkey, 14–17 June 2011. [Google Scholar]
- Stephens, J.C. Energy Democracy: Redistributing Power to the People Through Renewable Transformation. Environ. Sci. Policy Sustain. Dev. 2019, 61, 4–13. [Google Scholar] [CrossRef] [Green Version]
- Becker, S.; Naumann, M. Energy democracy: Mapping the debate on energy alternatives. Geogr. Compass 2017, 11, e12321. [Google Scholar] [CrossRef]
- Hess, D.J. Energy democracy and social movements: A multi-coalition perspective on the politics of sustainability transitions. Energy Res. Soc. Sci. 2018, 40, 177–189. [Google Scholar] [CrossRef]
- Brown, L.R.; Larsen, J.; Roney, J.M.; Adams, E.E. The Great Transition: Shifting from Fossil Fuels to Solar and Wind Energy, 1st ed.; W.W. Norton & Company: New York, NY, USA, 2015. [Google Scholar]
- Fairchild, D.; Weinrub, A.; Horowitz, D.A.; Baker, I.; Benander, L. Energy democracy: Advancing Equity in Clean Energy Solutions; 1 online resource (xi 273 pages), illustrations vols; Island Press: Washington, DC, USA, 2017; Available online: https://search.ebscohost.com/login.aspx?direct=true&scope=site&db=nlebk&db=nlabk&AN=1884517 (accessed on 10 May 2020).
- Meehan, G. Thank You Fossil Fuels and Good Night: The 21st Century’s Energy Transition; University of Utah Press: Salt Lake City, UT, USA, 2017. [Google Scholar]
- Bazilian, M.; Nakhooda, S.; Van de Graaf, T. Energy governance and poverty. Energy Res. Soc. Sci. 2014, 1, 217–225. [Google Scholar] [CrossRef]
- Neacsa, A.; Panait, M.; Muresan, J.D.; Voica, M.C. Energy Poverty in European Union: Assessment Difficulties, Effects on the Quality of Life, Mitigation Measures. Some Evidences from Romania. Sustainability 2020, 12, 4036. [Google Scholar] [CrossRef]
- Villamor, E.; Akizu-Gardoki, O.; Azurza, O.; Urkidi, L.; Campos-Celador, A.; Basurko, I.; Hinojal, I.B. European Cities in the Energy Transition: A Preliminary Analysis of 27 Cities. Energies 2020, 13, 1315. [Google Scholar] [CrossRef] [Green Version]
- Covenant of Mayors, Covenant of Mayors. 2021. Available online: https://www.covenantofmayors.eu/about/covenant-community/signatories.html (accessed on 28 January 2021).
- Energy Cities. 2021. Available online: https://energy-cities.eu/ (accessed on 30 April 2021).
- mPOWER—Municipal Power. 2021. Available online: https://municipalpower.org/ (accessed on 30 April 2021).
- Boretti, A. High-frequency standard deviation of the capacity factor of renewable energy facilities: Part 1—Solar photovoltaic. Energy Storage 2019, 2, e101. [Google Scholar] [CrossRef] [Green Version]
- Capacity Factor, Wikipedia. 2021. Available online: https://en.wikipedia.org/w/index.php?title=Capacity_factor&oldid=1028599113 (accessed on 18 June 2021).
- Iconography of Correlations, Wikipedia. 2021. Available online: https://en.wikipedia.org/w/index.php?title=Iconography_of_correlations&oldid=1036175368 (accessed on 1 September 2021).
- Bills, A. 2019 Cities Percentage Energy Mix|CDP Open Data Portal, CDP. 2021. Available online: https://data.cdp.net/Renewable-Energy/2019-Cities-Percentage-Energy-Mix/iudz-wy42 (accessed on 21 May 2021).
- Cortiços, N.D. Improving residential building efficiency with membranes over façades: The Mediterranean context. J. Build. Eng. 2020, 32, 101421. [Google Scholar] [CrossRef]
- Diran, D.; Henrich, B.; Geerdink, T. Supporting Municipal Energy Transition Decision-making. 2020. Available online: https://www.newenergycoalition.org/custom/uploads/2020/12/20-12-17-ESTRAC-D.1.2-Supporting-Municipal-Energy-Transition-Decision-making.pdf (accessed on 7 October 2021).
- Wei, T.; Zhou, J.; Zhang, H. Rebound effect of energy intensity reduction on energy consumption. Resour. Conserv. Recycl. 2019, 144, 233–239. [Google Scholar] [CrossRef]
- Sorrell, S. Energy Substitution, Technical Change and Rebound Effects. Energies 2014, 7, 2850–2873. [Google Scholar] [CrossRef]
- Freire-González, J.; Puig-Ventosa, I. Energy Efficiency Policies and the Jevons Paradox. Int. J. Energy Econ. Policy 2015, 5, 69–79. [Google Scholar]
- Jevons, W.S. The Coal Question: An Enquiry Concerning the Progress of the Nation, and the Probable Exhaustion of Our Coal-Mines; Macmillan: London, UK, 1865. [Google Scholar]
- Polimeni, J.M. The Jevons Paradox and the Myth of Resource Efficiency Improvements; 1 online resource (184 pages) vols; Earthscan: London, UK, 2008; Available online: http://site.ebrary.com/id/10210546 (accessed on 2 June 2021).
- O’Neill, D.W.; Fanning, A.L.; Lamb, W.F.; Steinberger, J.K. A good life for all within planetary boundaries. Nat. Sustain. 2018, 1, 88–95. [Google Scholar] [CrossRef] [Green Version]
- Akizu-Gardoki, O.; Bueno, G.; Wiedmann, T.; Lopez-Guede, J.M.; Arto, I.; Hernandez, P.; Moran, D. Decoupling between human development and energy consumption within footprint accounts. J. Clean. Prod. 2018, 202, 1145–1157. [Google Scholar] [CrossRef]
- Covenant of Mayors—Home, Covenant of Mayors. 2021. Available online: https://www.covenantofmayors.eu/ (accessed on 30 April 2021).
- Global Covenant of Mayors, Global Covenant of Mayors. 2021. Available online: https://www.globalcovenantofmayors.org/ (accessed on 2 September 2021).
- DTU. Global Wind Atlas. Available online: https://globalwindatlas.info (accessed on 25 June 2021).
- BizEE Software. Degree Days—An Introduction, BizEE Degree Days: Weather Data for Energy Saving. 2008. Available online: https://www.degreedays.net/introduction (accessed on 25 June 2021).
- Cottrell, A.; Lucchetti, R. gretl (GNU Regression, Econometric and Time-series Library). 2007. Available online: http://gretl.sourceforge.net/ (accessed on 26 May 2021).
- Map|Glocal Climate Change: A project by EDJNet’. Available online: https://climatechange.europeandatajournalism.eu/en/map (accessed on 25 June 2021).
- EU Science Hub. JRC Photovoltaic Geographical Information System (PVGIS)—European Commission. 2019. Available online: https://re.jrc.ec.europa.eu/pvg_tools/en/#MR (accessed on 25 June 2021).
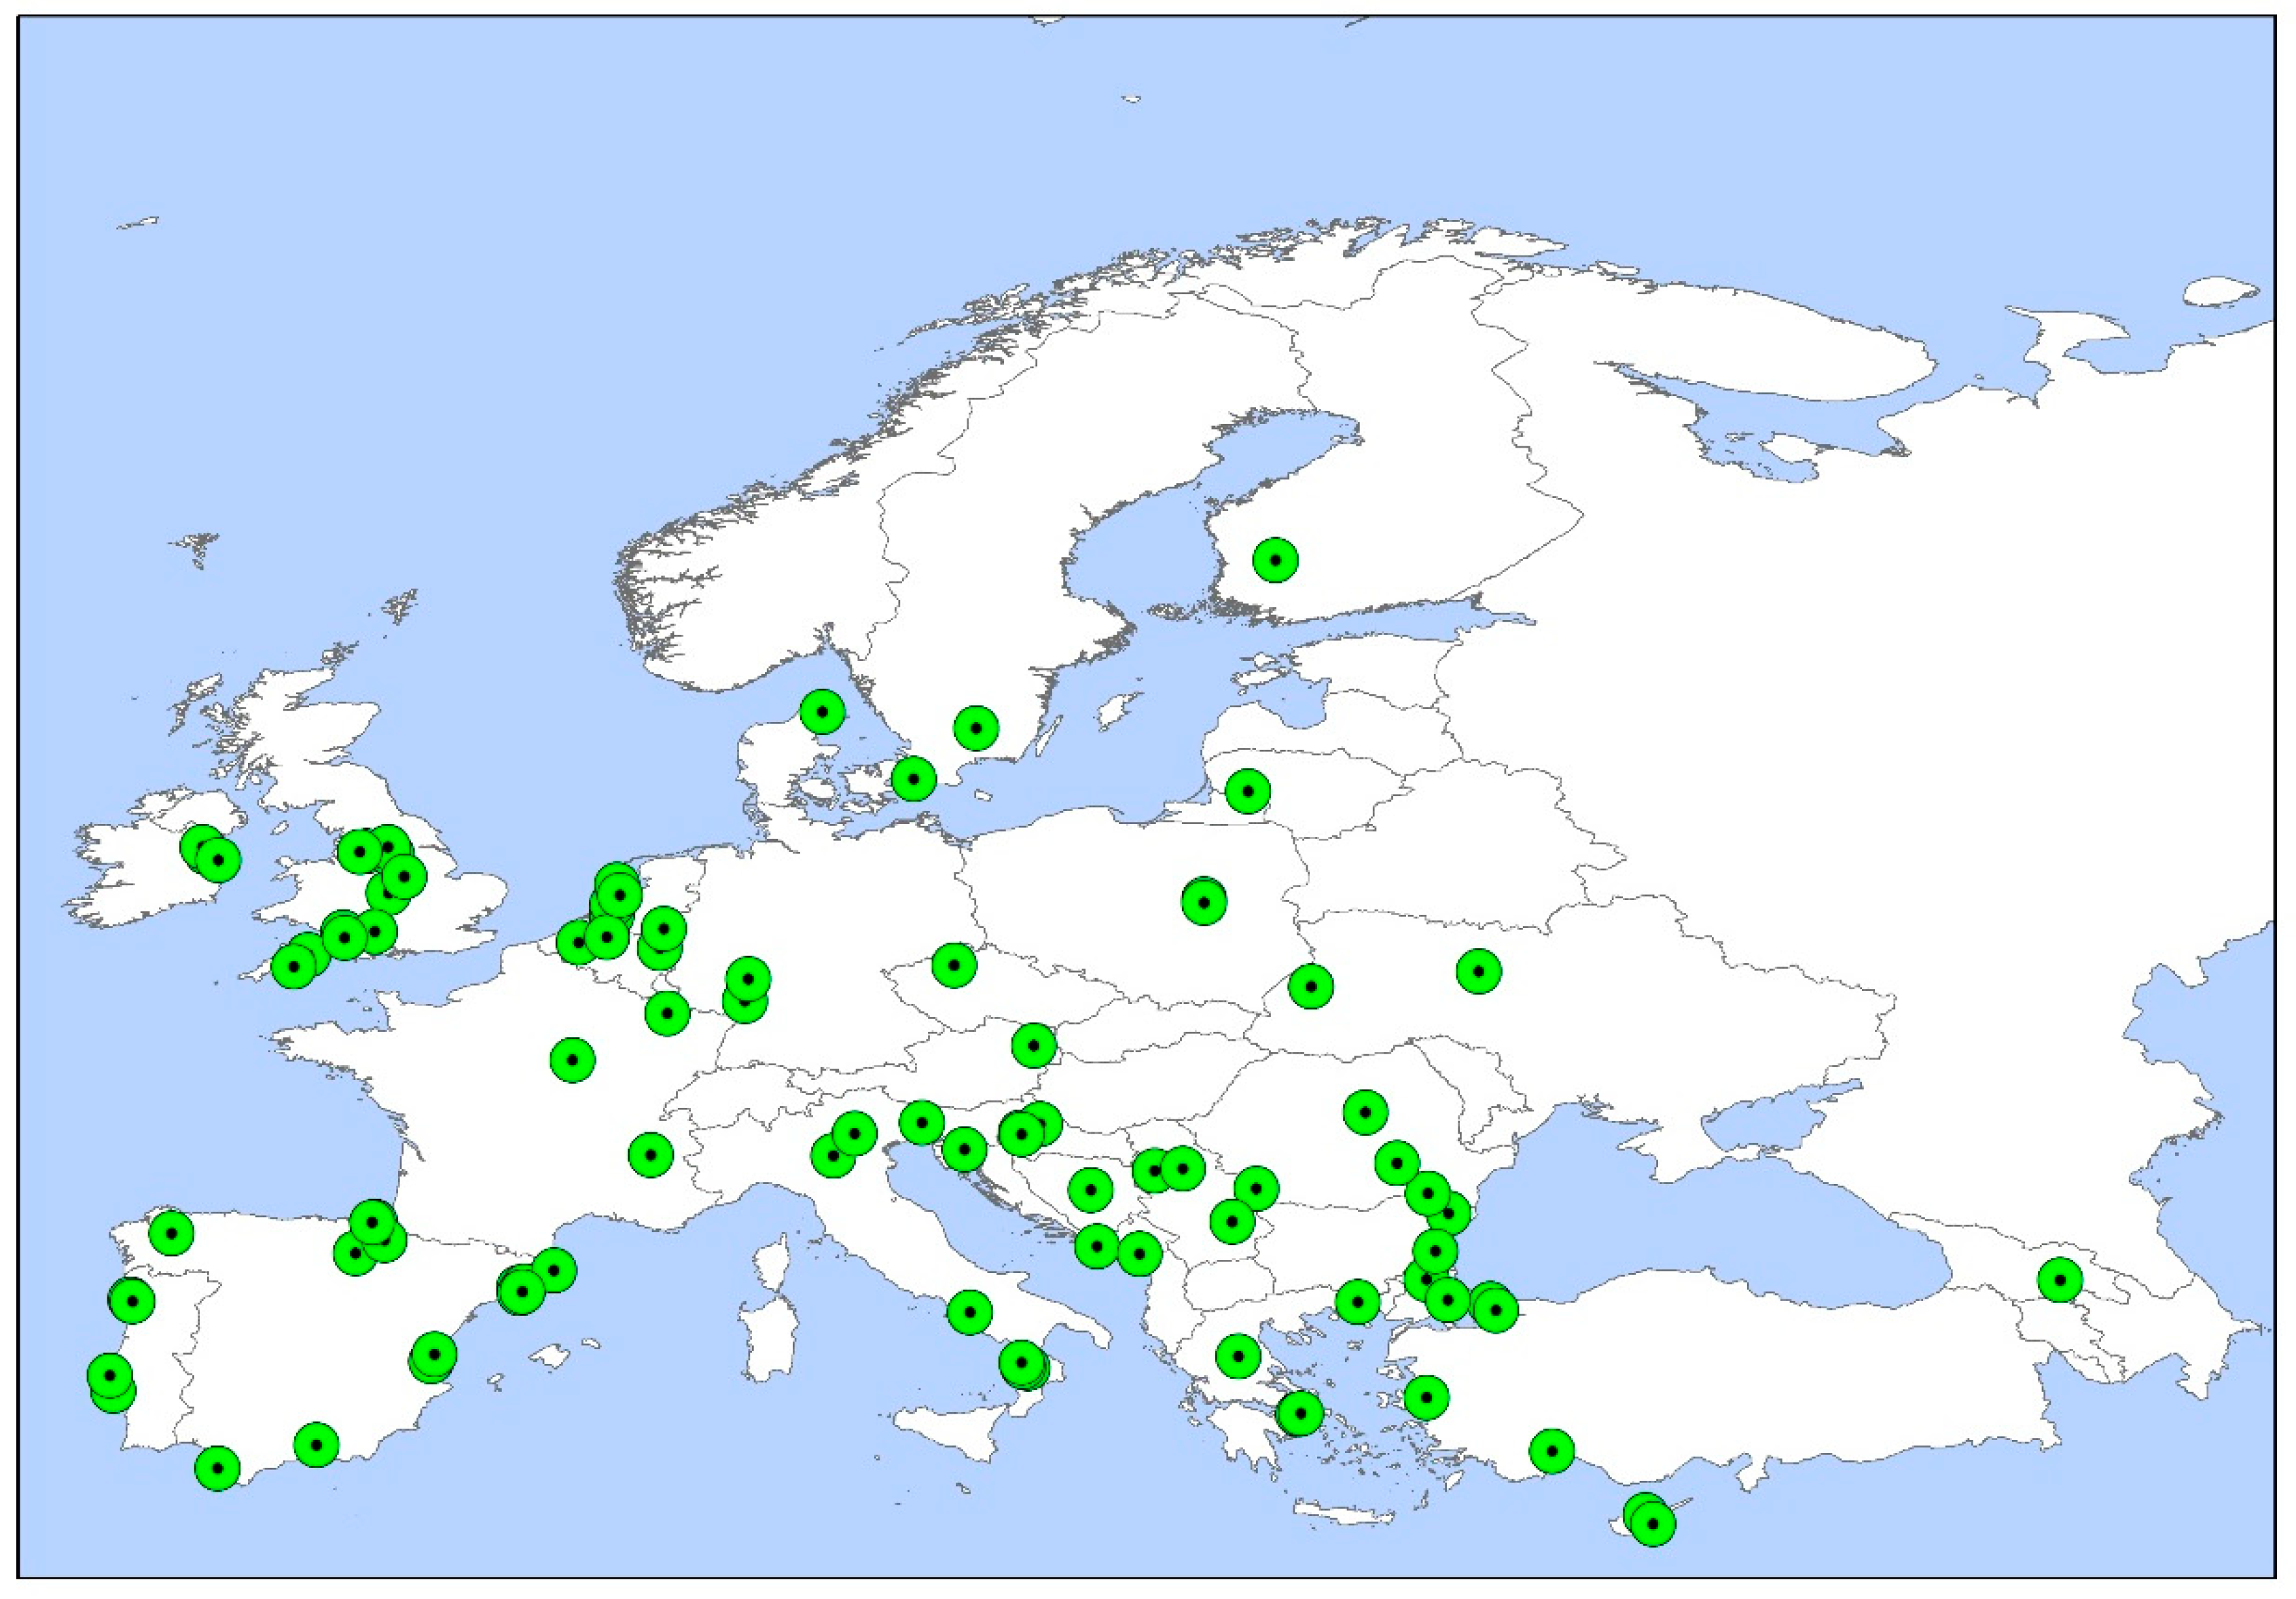
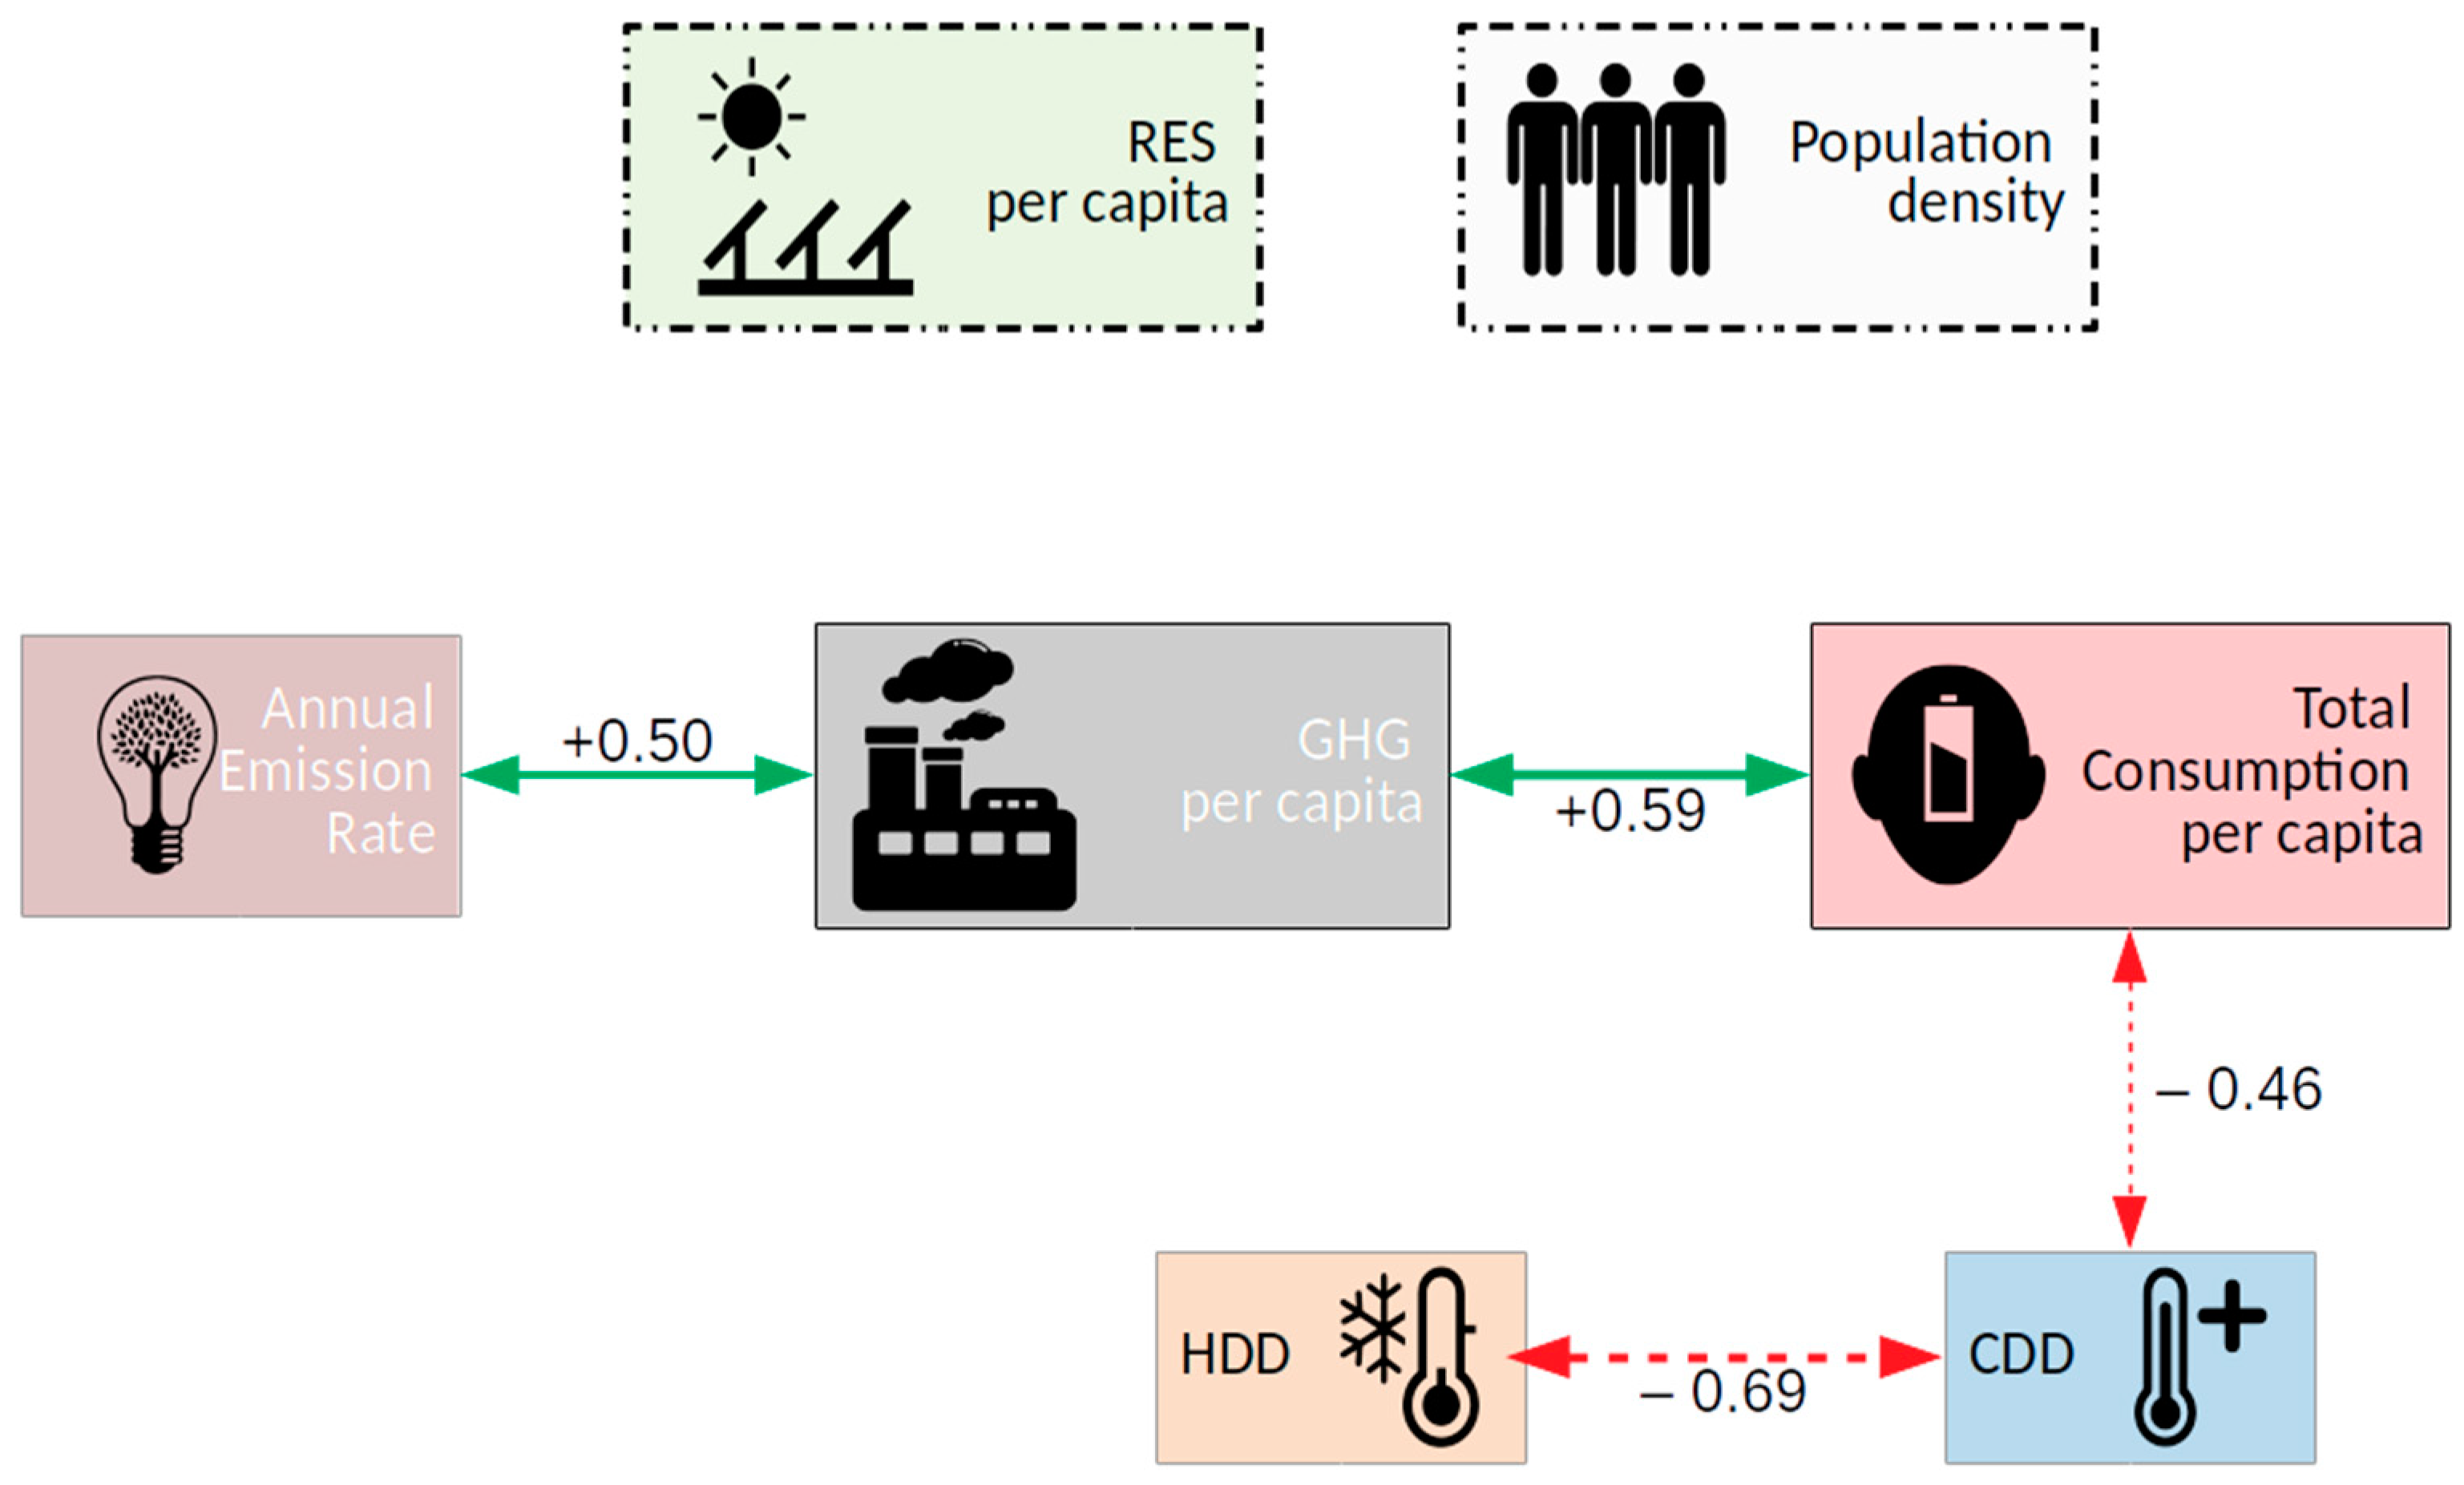

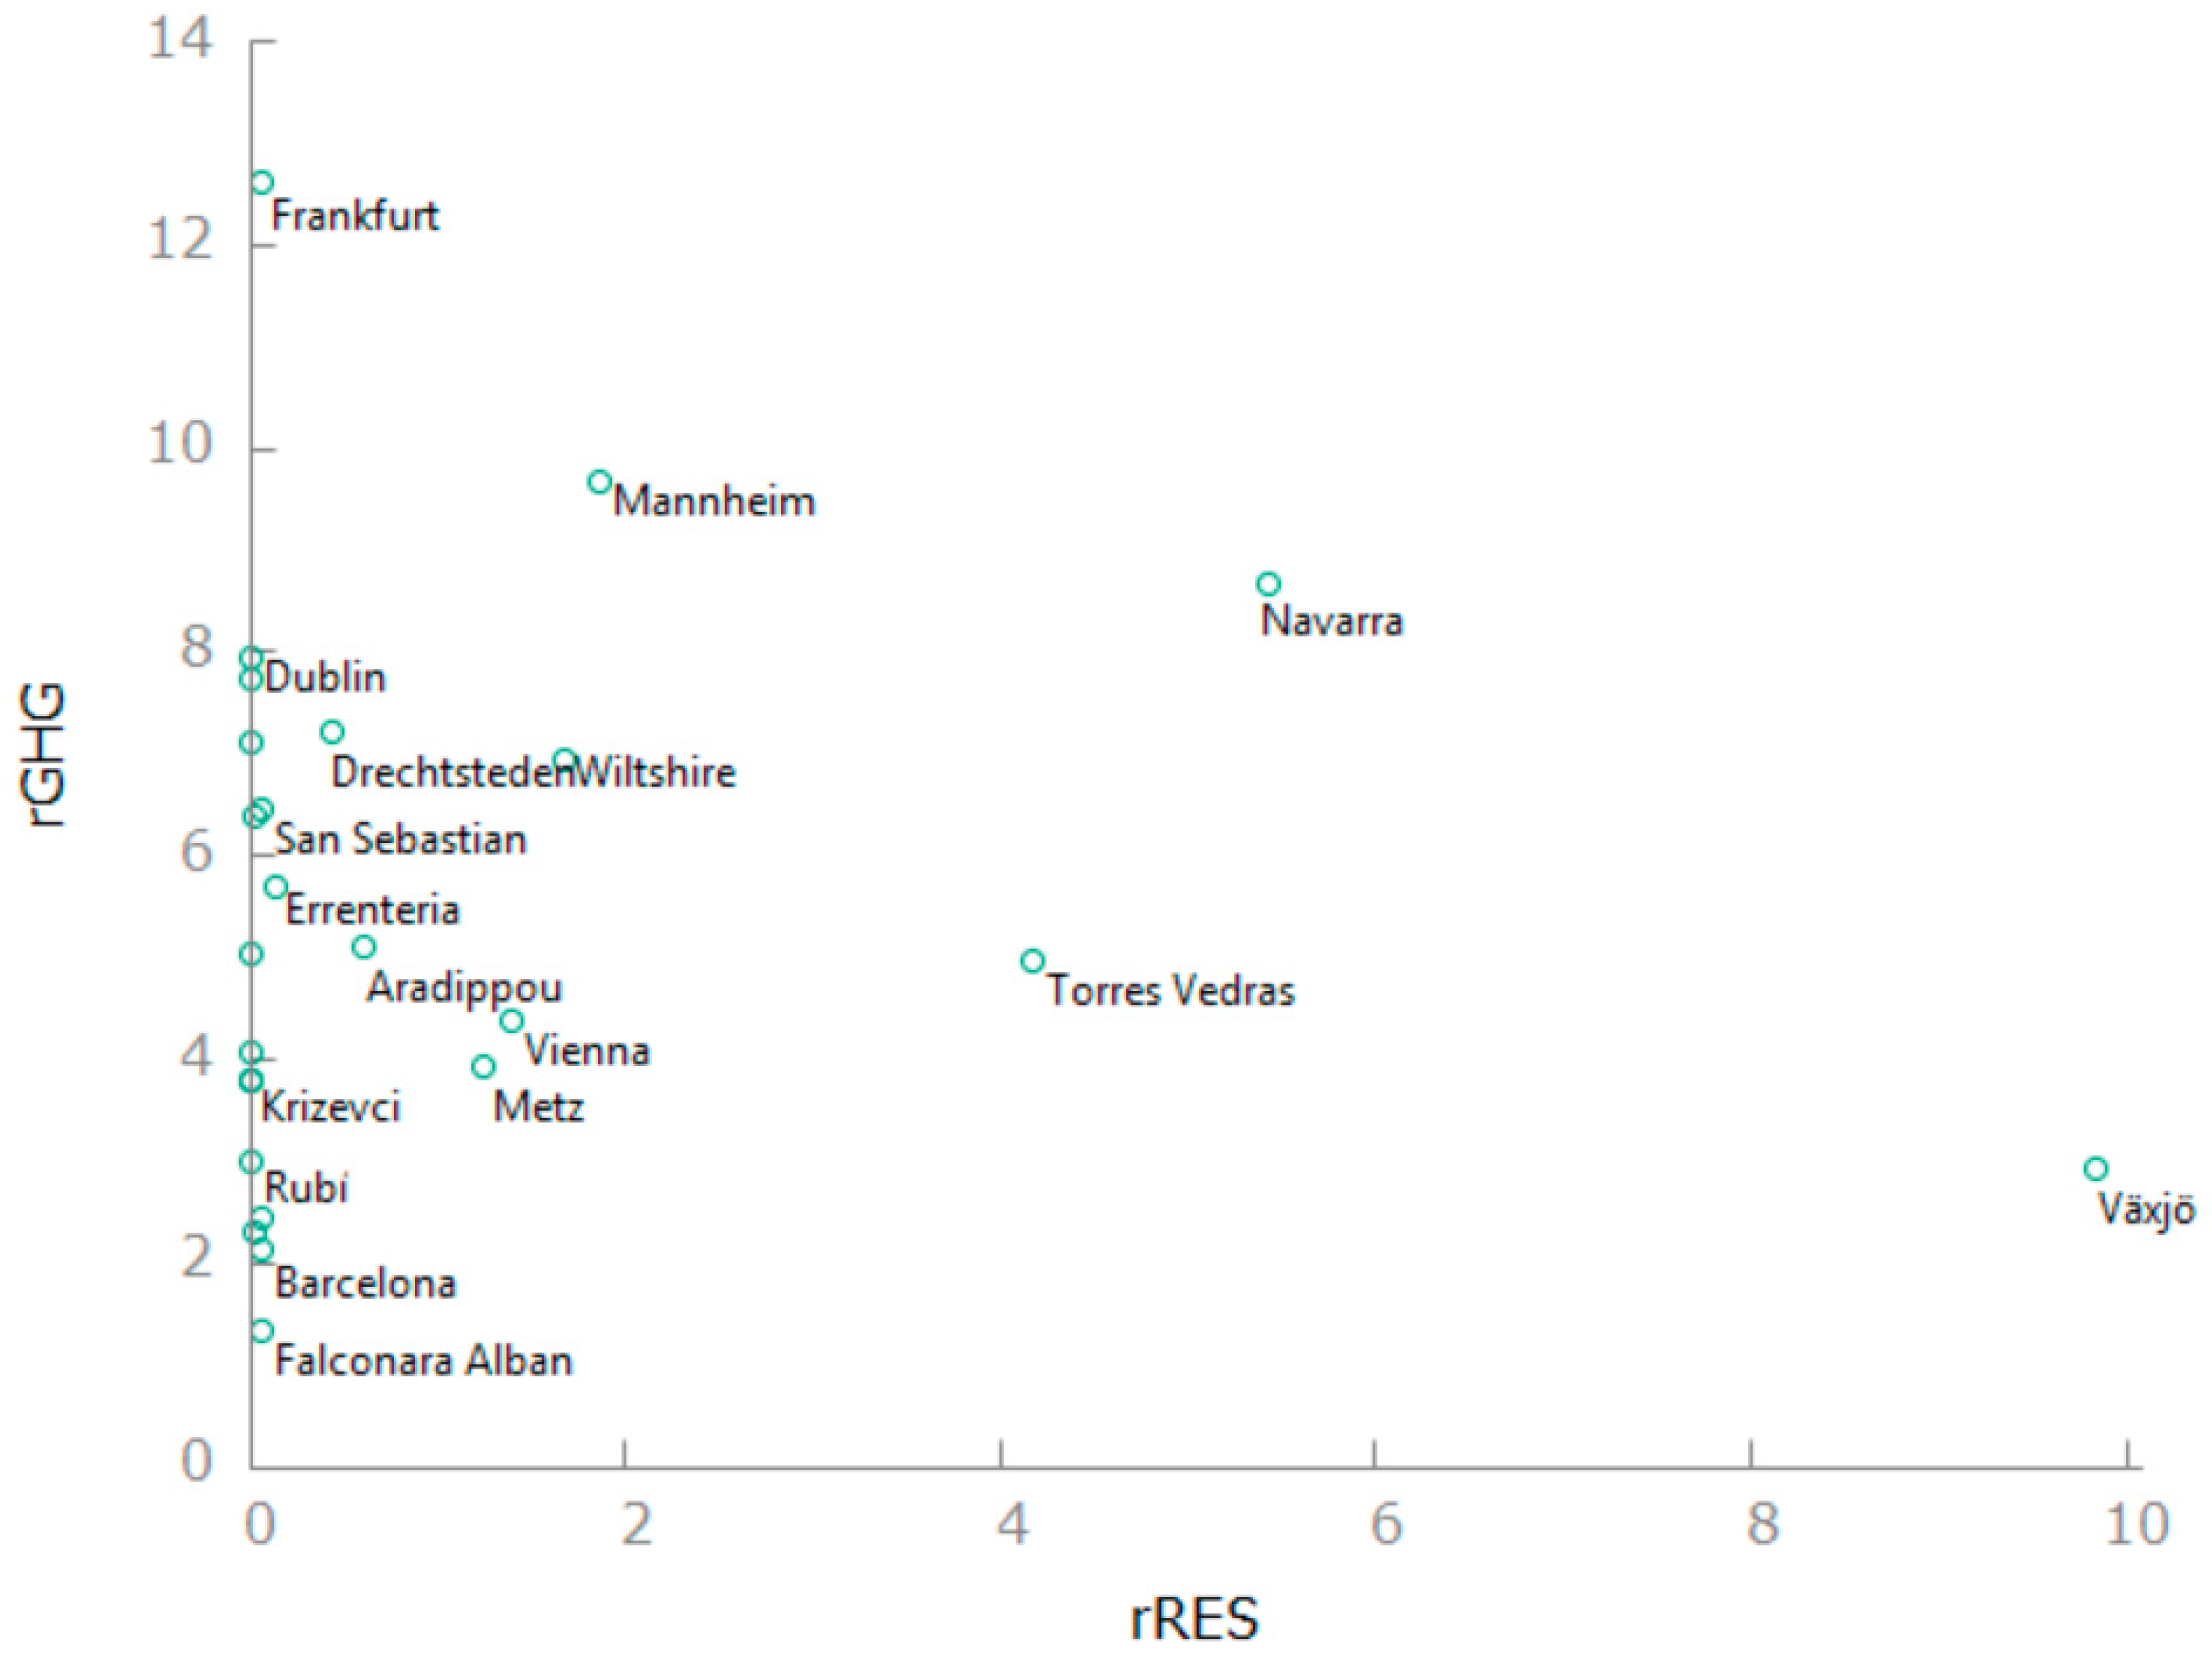
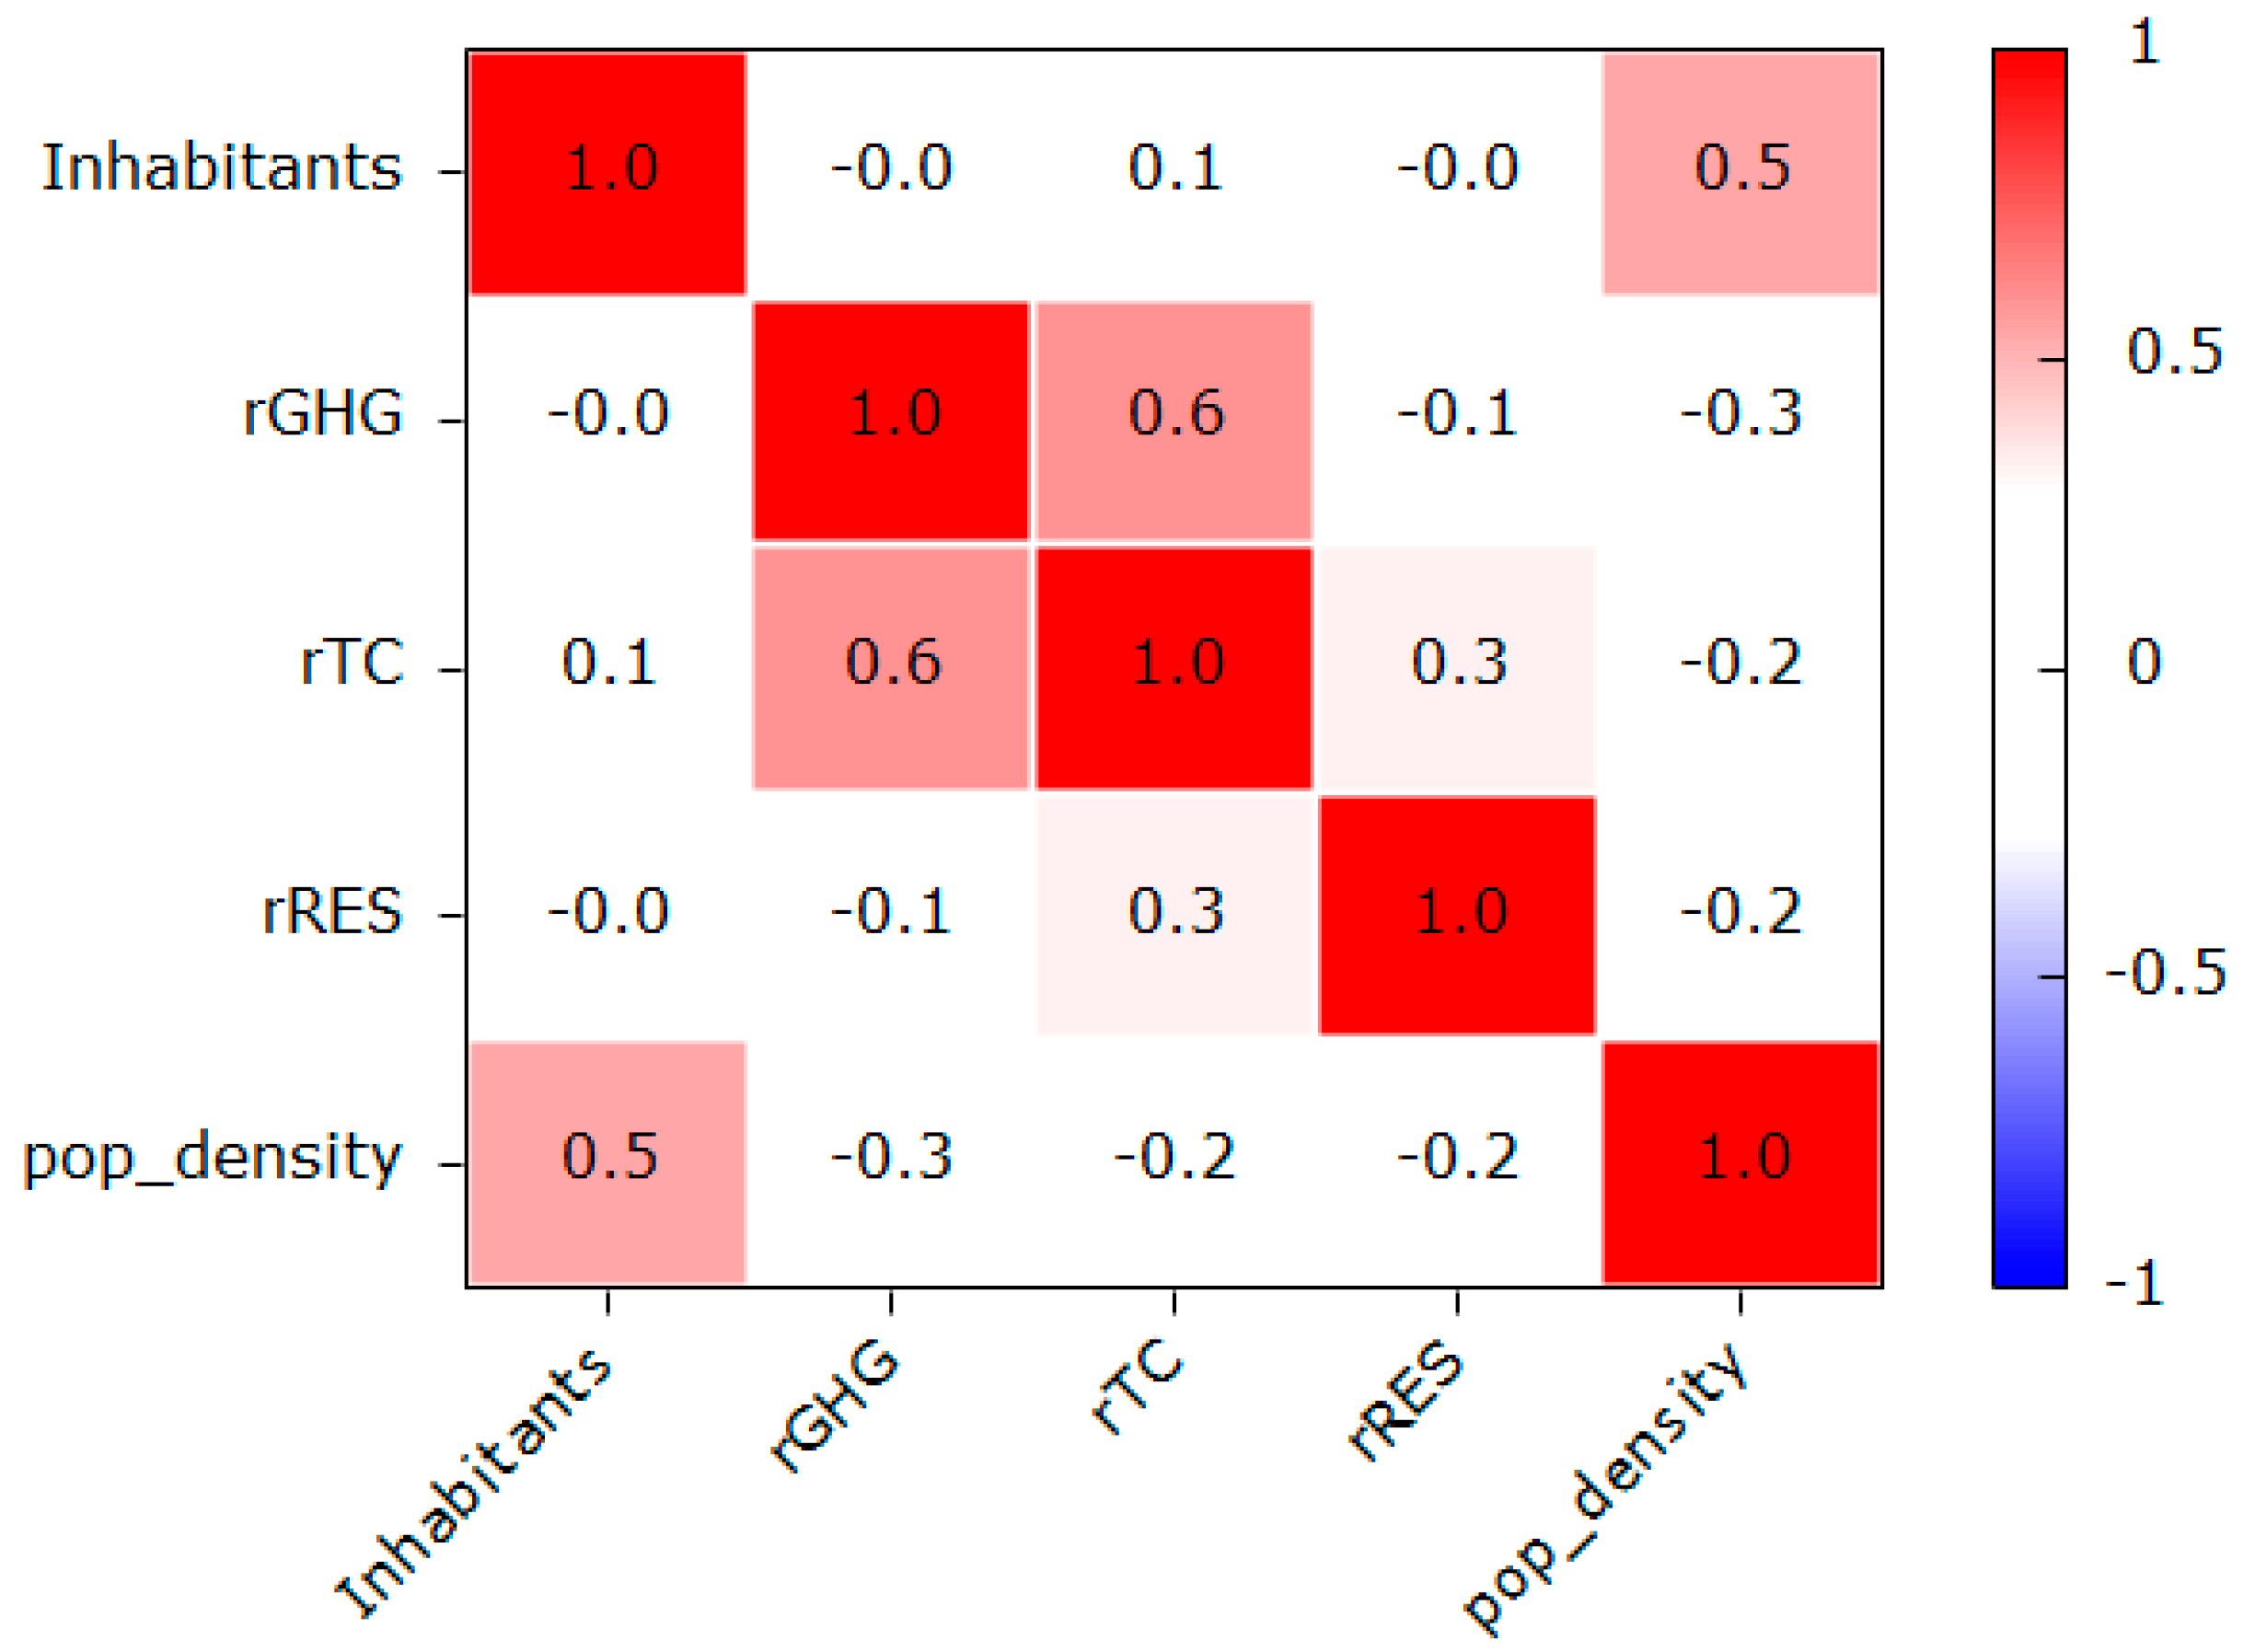
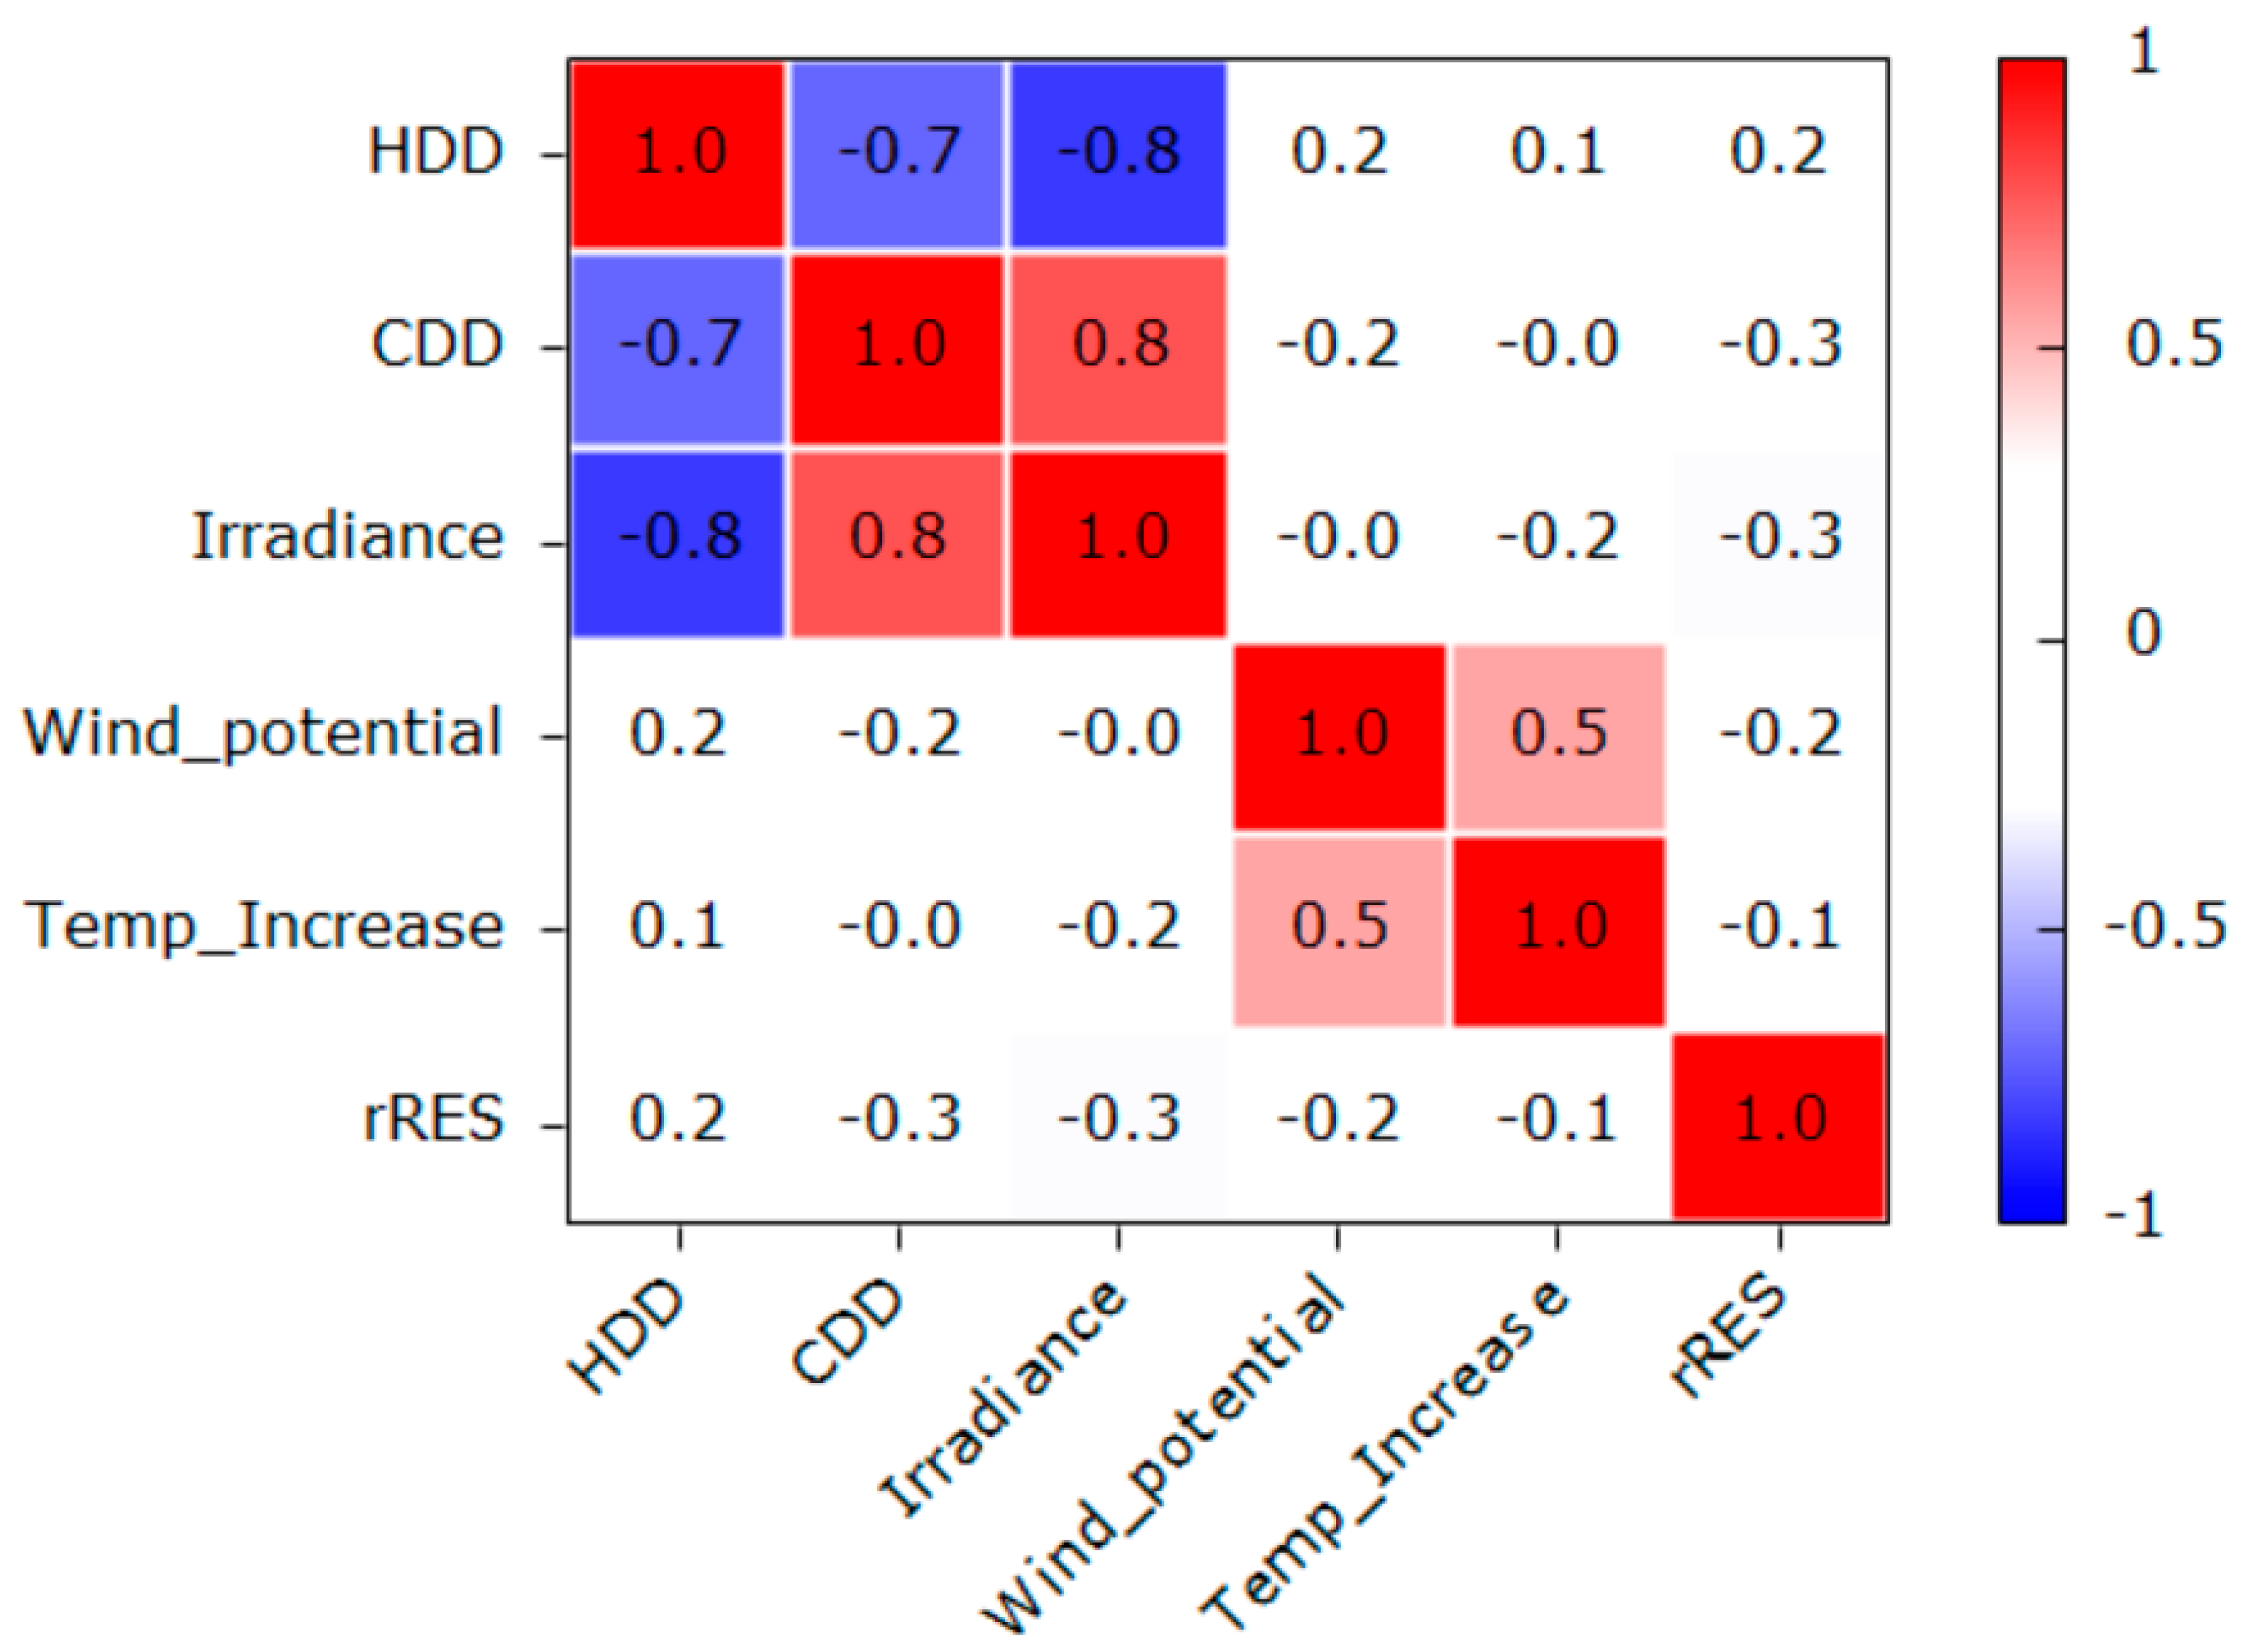
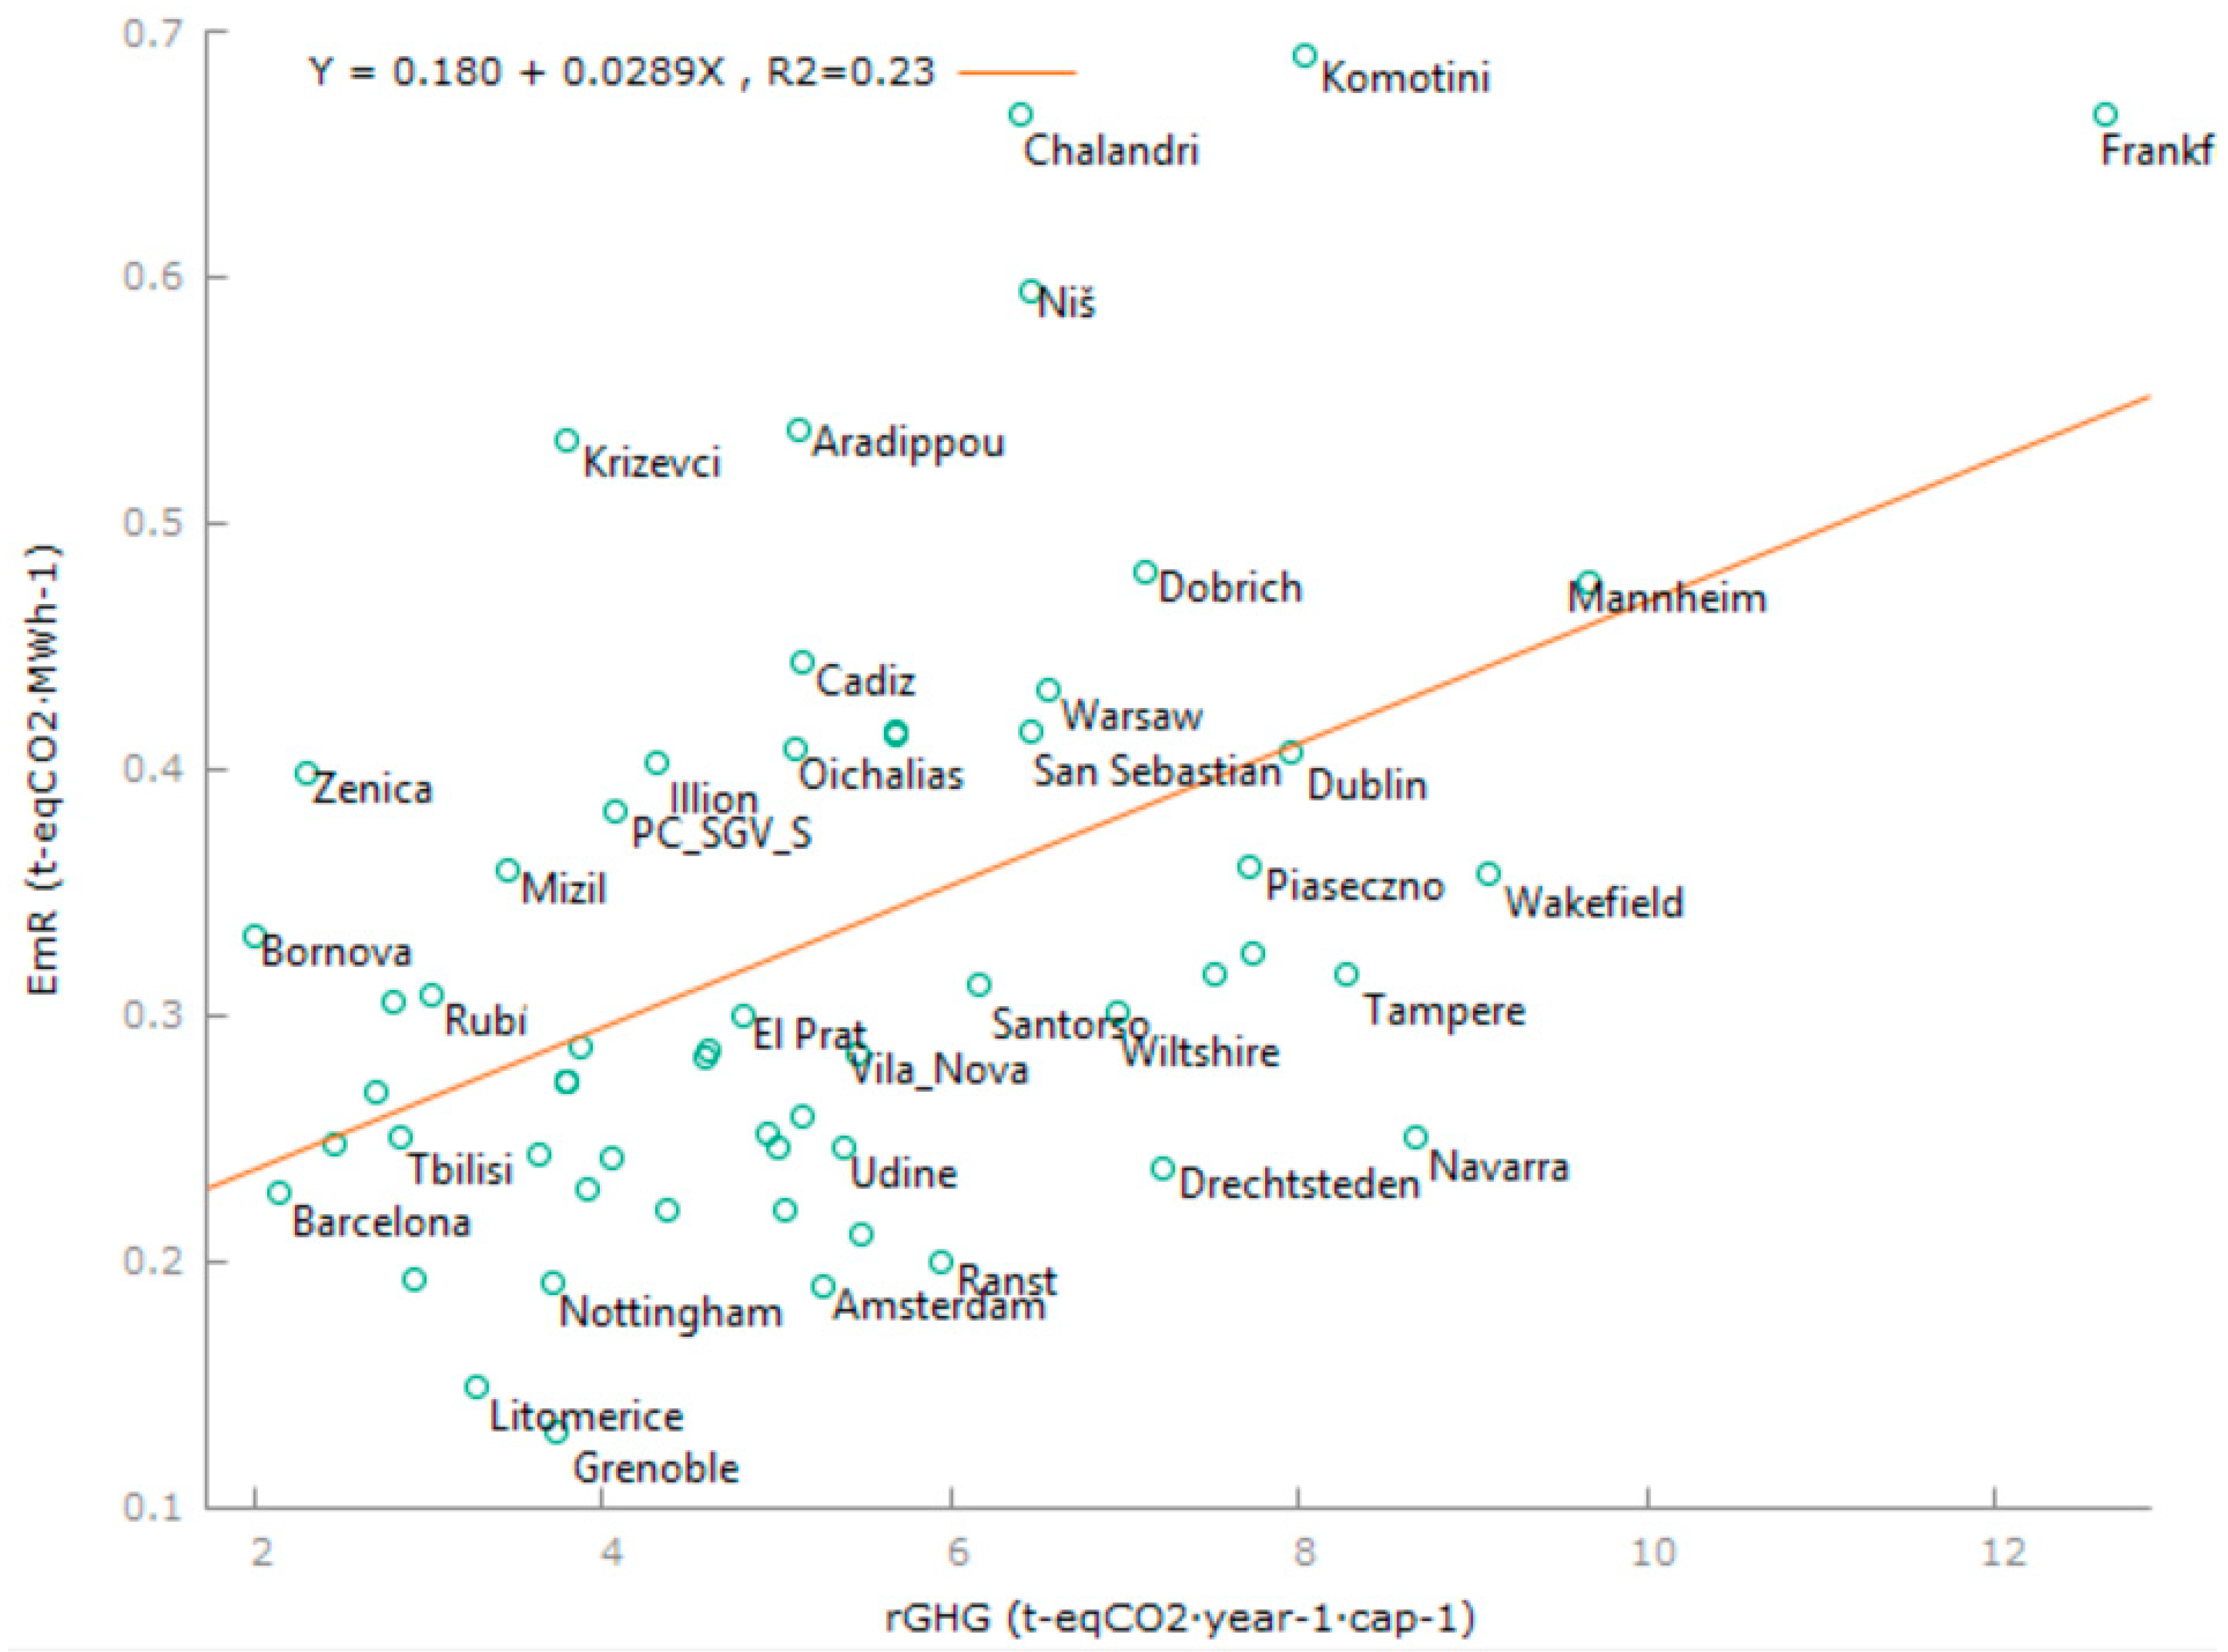
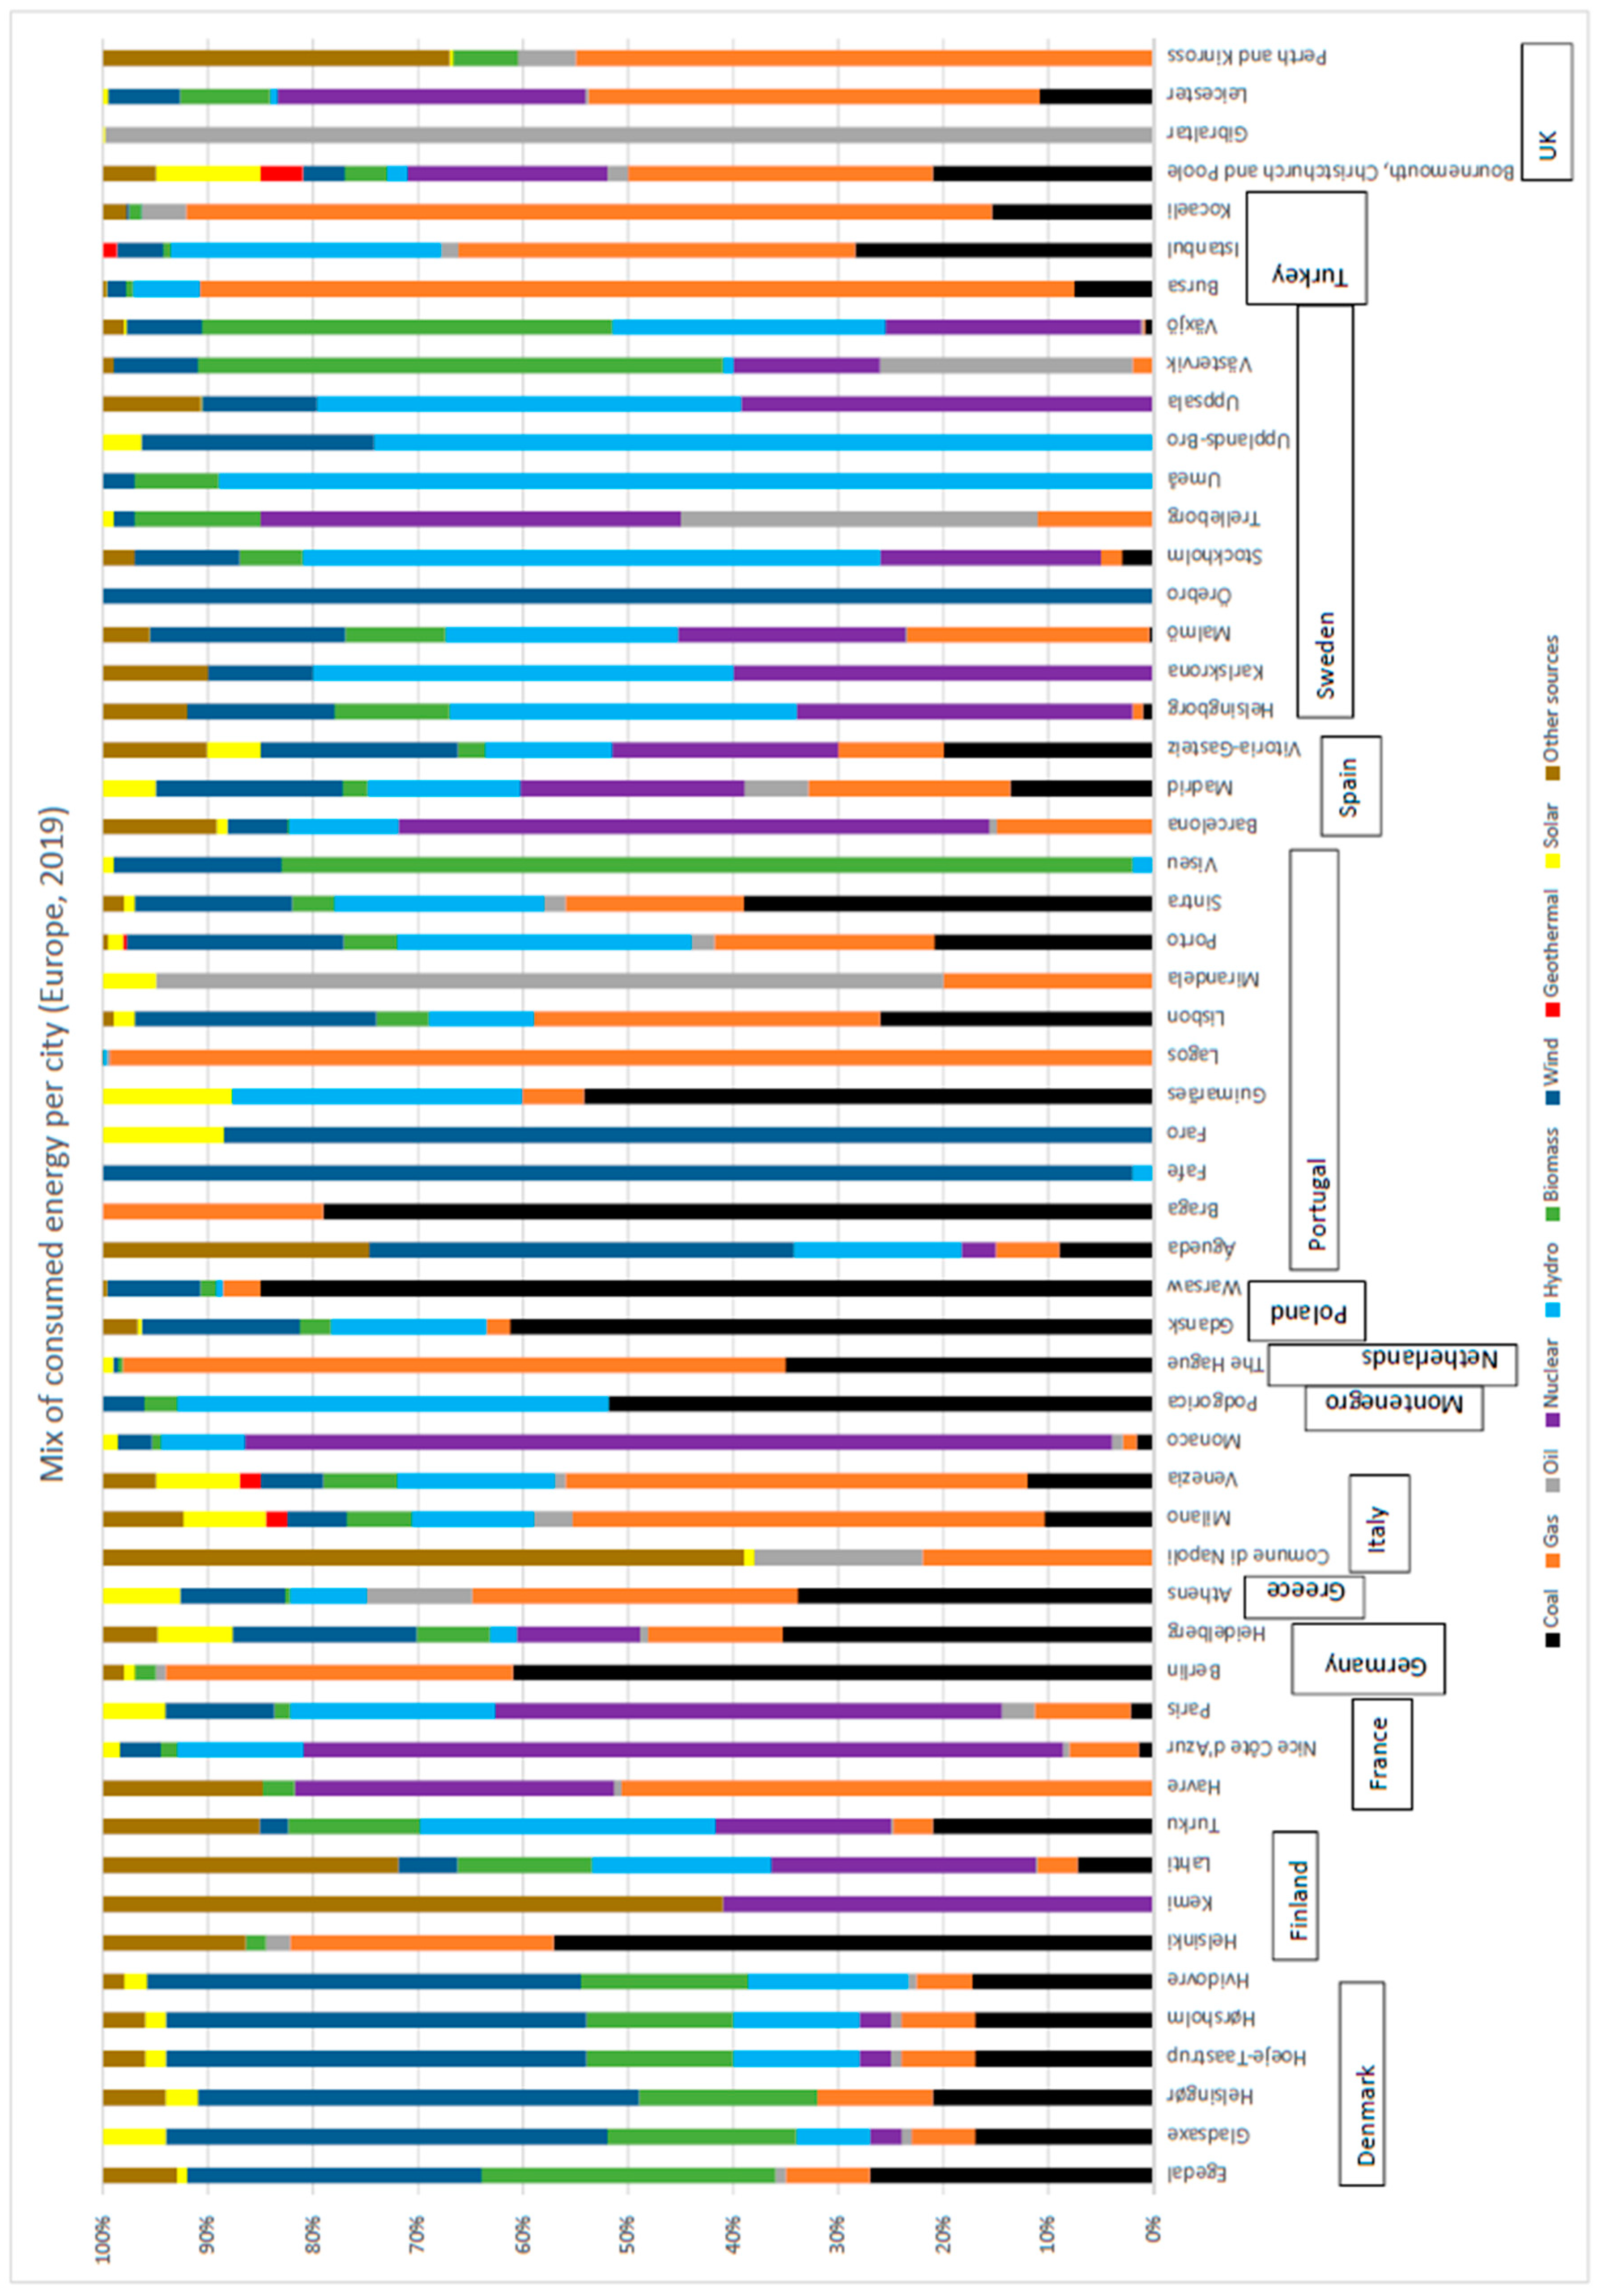
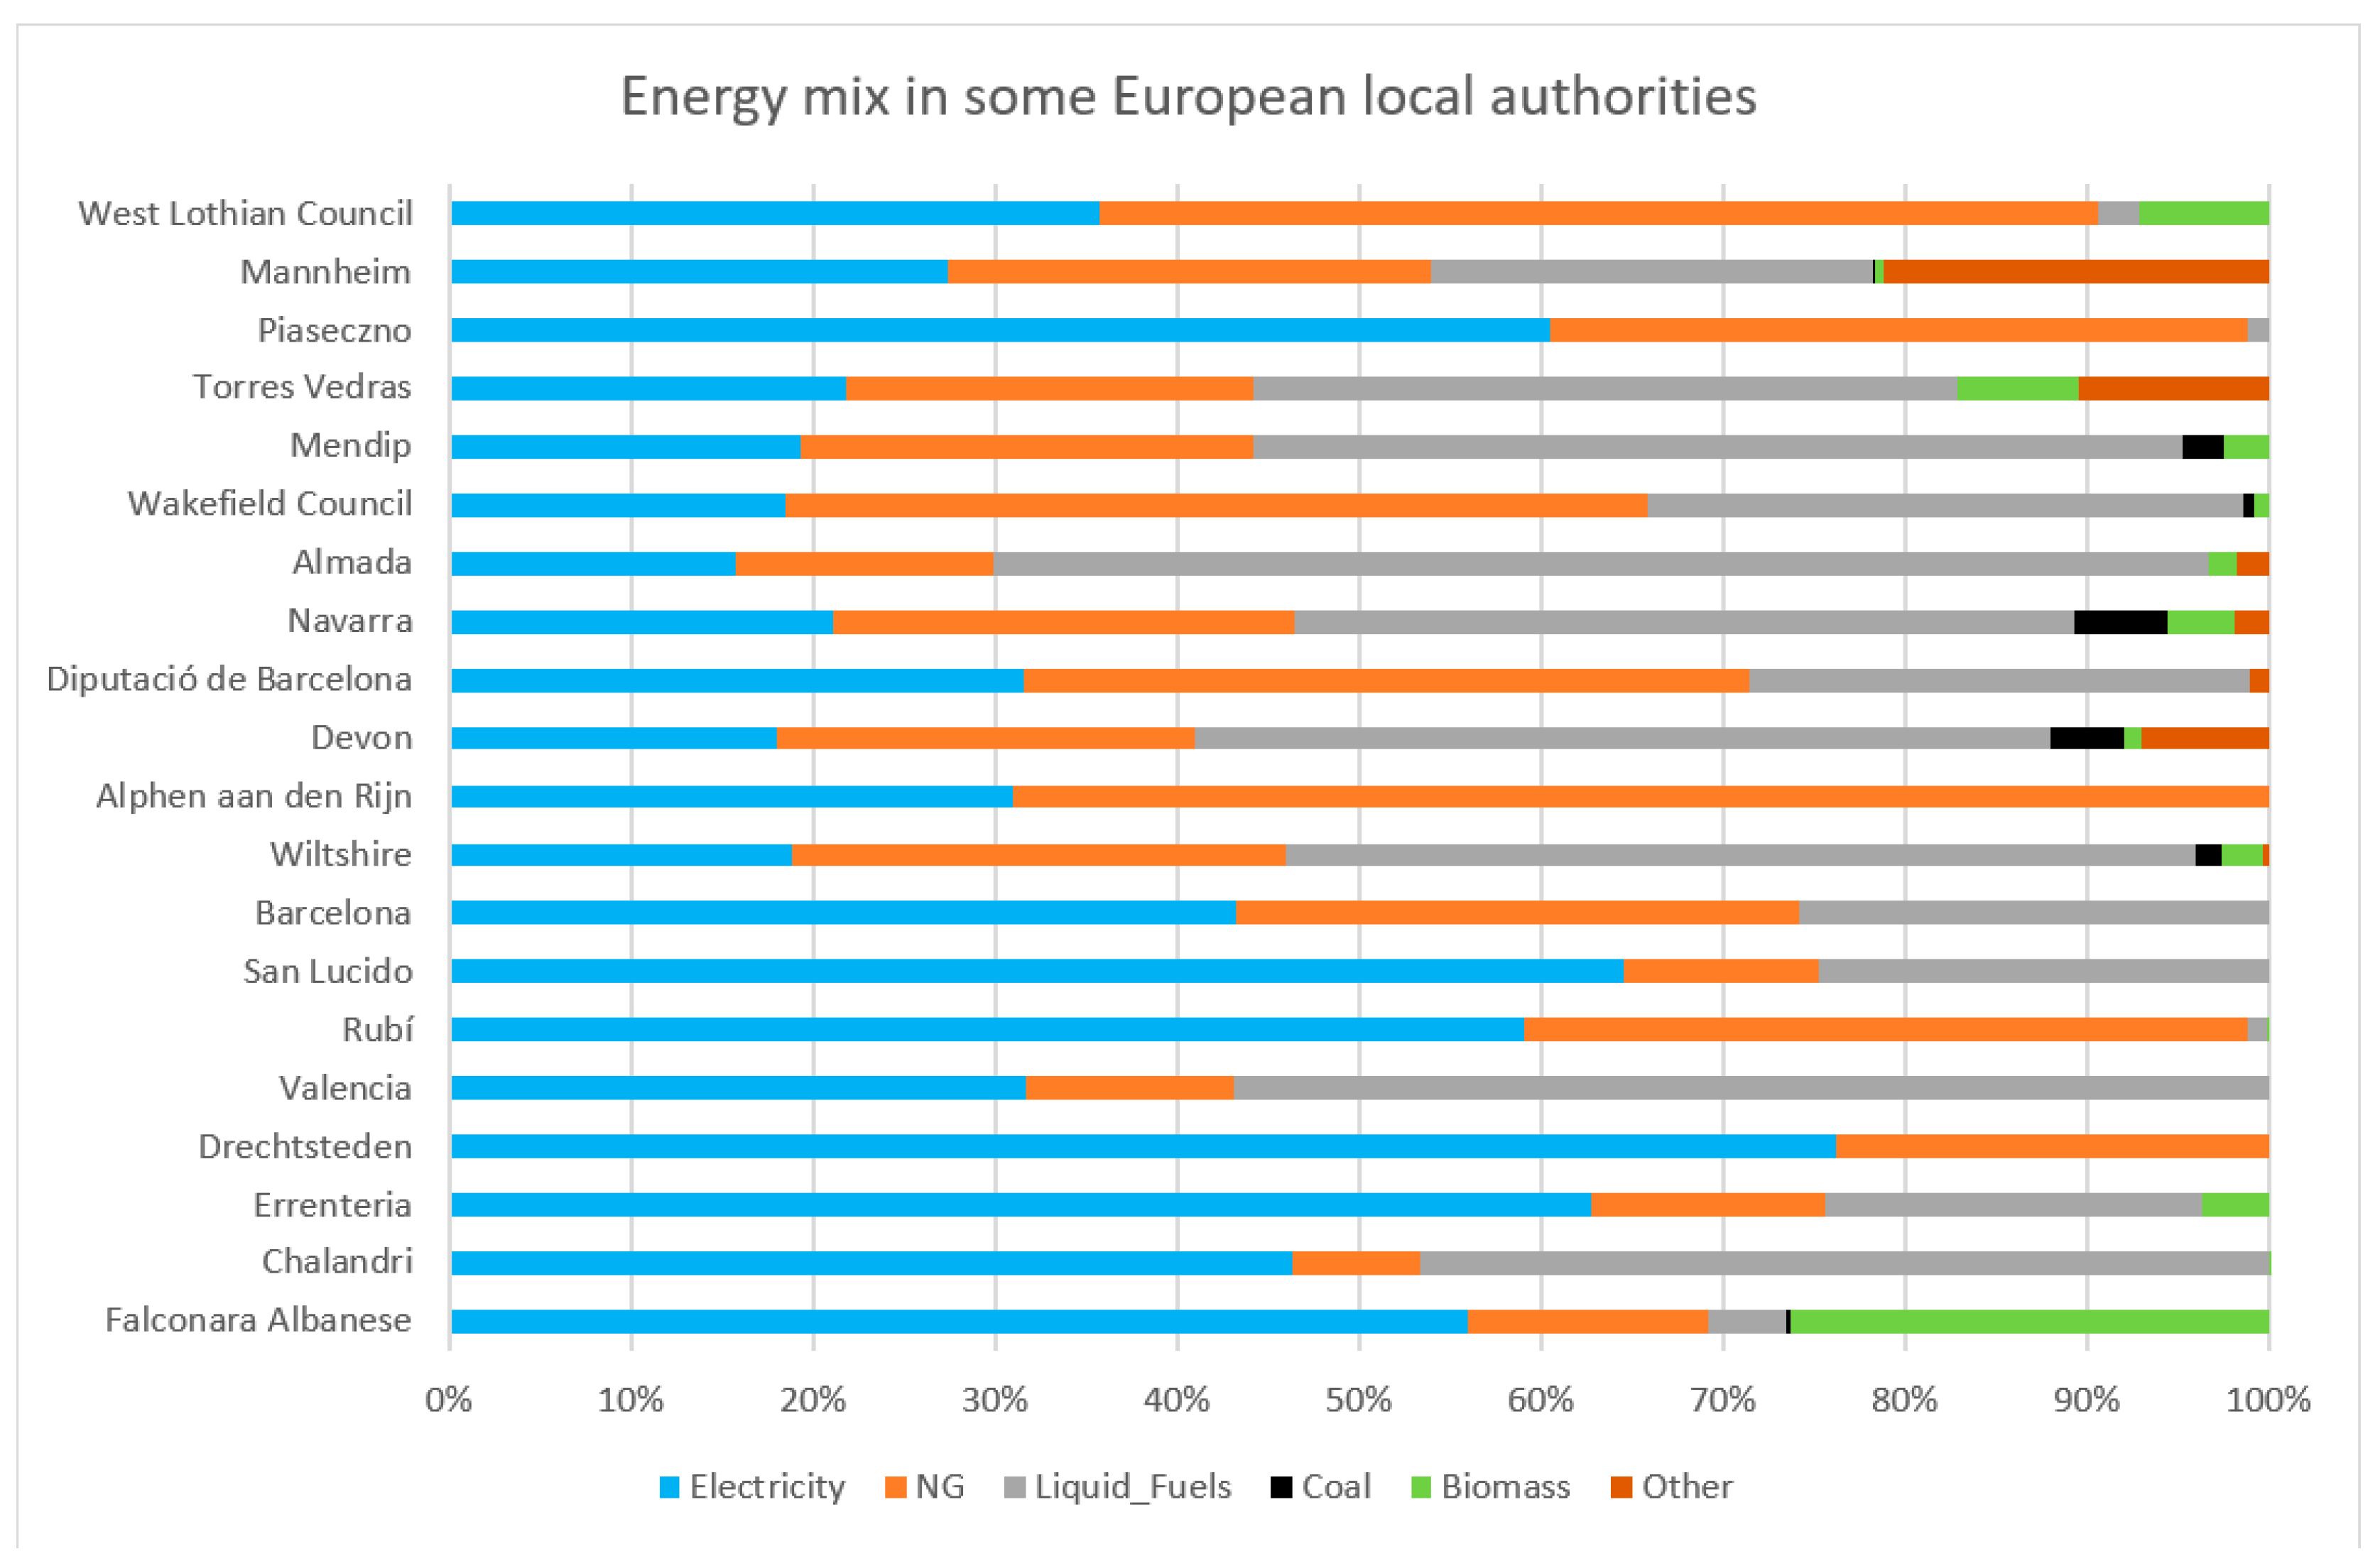
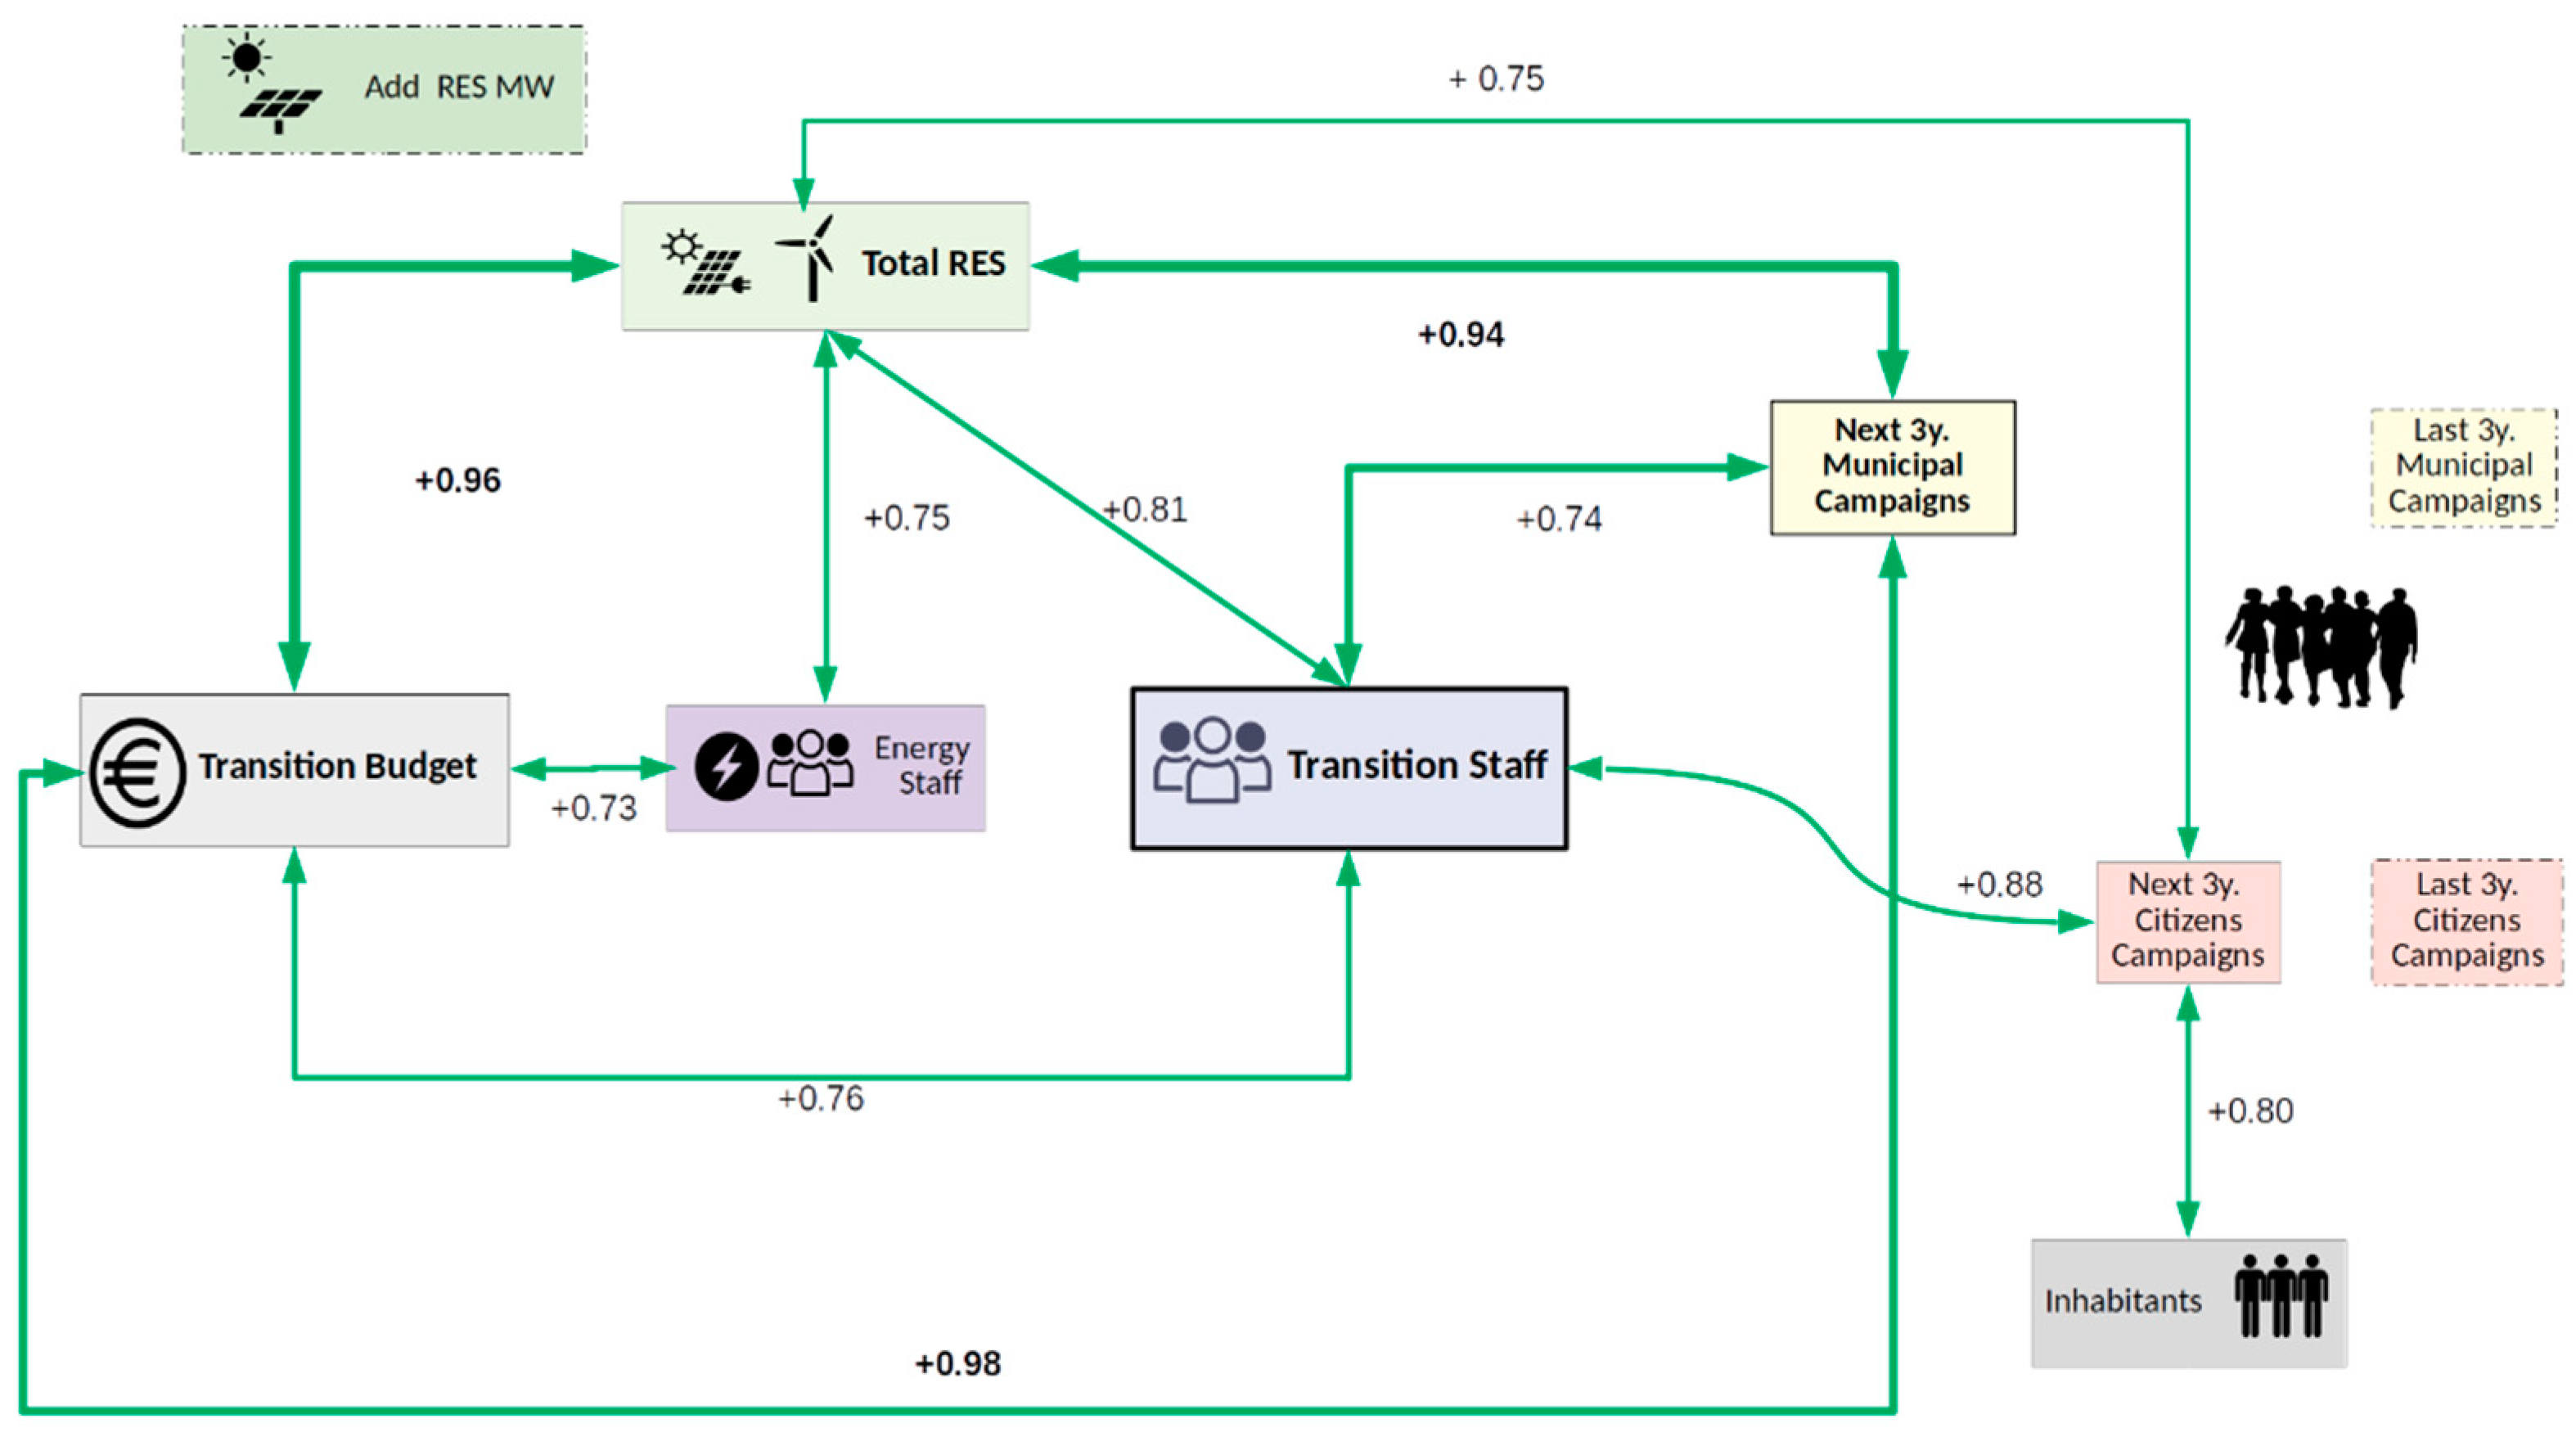

Publisher’s Note: MDPI stays neutral with regard to jurisdictional claims in published maps and institutional affiliations. |
© 2021 by the authors. Licensee MDPI, Basel, Switzerland. This article is an open access article distributed under the terms and conditions of the Creative Commons Attribution (CC BY) license (https://creativecommons.org/licenses/by/4.0/).