Article

Are Business Policy Measures in Response to the COVID-19 Pandemic to Be Equally Valued? An Exploration According to SMEs Owners’ Business Expectations

by
Charlie Tchinda
1,2,† and
Marcus Dejardin
1,3,*
1
CERPE, DeFiPP, Université de Namur, 5000 Namur, Belgium
2
Study Unit, Union des Classes Moyennes (UCM), 5100 Namur, Belgium
3
CIRTES, LIDAM, Université catholique de Louvain, 1348 Ottignies-Louvain-la-Neuve, Belgium
*
Author to whom correspondence should be addressed.
Union des Classes Moyennes (UCM), a federation for the defense and representation of self-employed workers and SMEs in Wallonia and Brussels (Belgium). The views expressed in this article are those of the authors and do not necessarily represent those of UCM.
Sustainability 2021, 13(21), 11576; https://doi.org/10.3390/su132111576
Submission received: 20 July 2021 / Revised: 12 October 2021 / Accepted: 14 October 2021 / Published: 20 October 2021
(This article belongs to the Special Issue Entrepreneurship and Business Sustainability)

Abstract

:
A variety of public economic policy measures have been designed and implemented in an effort to enable SMEs to limit damages resulting from the adverse sanitary and economic shocks associated with COVID-19. The originality of our study is to propose a rating of the various economic policy measures, the rating being expressed by SMEs owners conditional to their business expectations. In so doing, our contribution is to highlight the policy measures to be implemented in order to support resilient and ambitious ventures with the most positive prospects, which are likely to contribute the most to economic recovery. We exploit an original and rich dataset derived from a survey conducted in May 2020 among a representative sample of more than 2100 Belgian (Walloon) SMEs. The Belgian experience is remarkable because the wide variety of measures it undertook echoes many of the measures taken by OECD countries. Our results suggest that the respondents have an overall positive evaluation of the various economic and social policy measures implemented by the Belgian authorities. More importantly, the rating by SME owners with the most favorable expectations are, however, significantly different than their counterpart. Measures helping firms to maintain their workforce are particularly highly rated by firms with the best prospects. It also appears that those firms prefer short-term and transitory measures.

1. Introduction

The sudden breakthrough of the coronavirus pandemic significantly disrupted the global economy. Companies have suffered a multifaceted shock. On the one hand, a significant number of firms had to lockdown, thus undergoing a supply shock because of their inability to produce and sell their products on the markets. On the other hand, businesses that could continue to operate were facing less demand than usual. Indeed, the cessation of activity in some sectors reduced orders and, therefore, the activity of suppliers [1].
In addition, workers in the stalled sectors were laid off for economic reasons or simply dismissed, with the main consequence to be the loss of income for both employees and the self-employed, exacerbating the weakness of demand [2,3].
To mitigate liquidity shortages and avoid bankruptcies that might follow from the COVID-19 pandemic, it was necessary to support the afflicted companies. Closed businesses no longer received payments and those operating did so in slow motion. Cash flow problems arose acutely and the risk that they would turn into solvency problems increased as time passed. Indeed, many of the fixed costs, such as rents and interest payments, remain due, while the cash flow destined to meet these obligations vanished [4]. The objective was then to design measures with a basic principle that could be stated as “No cash in, no cash out” for self-employed workers and companies.
The effect of the crisis had been particularly considered by academics via the number of companies and self-employed workers who had to stop their activities. The demographic characteristics of halting companies and those resisting were the first elements highlighted in studies. As an example, Fairlie [5] observes a significant decline in the number of businesses operating in the USA between February and May 2020. Looking at the demographics of owners, he notes that women and immigrants were the most affected populations.
Particular attention was also devoted to the dynamics of the main indicators of business activity. Thus, turnover, employment, cash flow, and the length of time a firm was able to continue paying its bills was examined by industry, by gender of the owner, and by other business characteristics [6]. Much research still remains in terms of understanding the internal and external determinants of companies’ resistance and resilience to negative shocks, and allowing resources to recover, more or less quickly, after large-scale adverse events is critical [7,8]. Researchers may also question of which policies are best, from an economic viewpoint, to curb the crisis. In this regard, the tools of monetary and fiscal policy and their relative adequacy fueled debates among academic economists [9,10,11].
The originality of the present contribution comes from the fact that, despite the huge interest of economists in the economic impact of the COVID-19 pandemic, very little attention has been given to the perception and rating of the supportive measures by SME owners and the self-employed. Our approach puts SMEs, more specifically their owners and self-employed people, at the center of the discussion.
The opinion of the self-employed and heads of SMEs can be seen as an assessment of economic policy measures from the point of view of the “stakeholders”. In May 2020, the date to which our data correspond, the rapid initial response policies in question were already in effect. Thus, contextually, we are neither in an ex ante evaluation, nor in an ex post evaluation. We consider our study as a rating evaluation, by the targeted recipients, of an ongoing economic policy in its early phase [12]. To serve this purpose, we use their rating of the various policy measures designed and implemented to support them in limiting the damage of the crisis to their businesses.
Although we were in a difficult period, we can see that some business leaders remained optimistic and/or ambitious about the possibilities of growing their business in the short term. Their rating of the various policy measures is analyzed jointly with their business expectations, i.e., how they foresee the short-term development of their activities. We were in a context of an early-stage crisis, when everything stopped abruptly. No one knew when activity would return to its early 2020 level and the short-term expectations of the majority of firm owners were pessimistic.
Thus, our questions of interest are formulated as follows. How do SME owners and self-employed people rate policy measures taken to respond to the COVID-19 crisis? Are their business expectations associated with their rating of policy measures? Which policy measures to support companies have the most positive prospects?
To answer our research questions and substantiate the above arguments, we exploit an original and rich dataset derived from a survey conducted in May 2020 among a representative sample of more than 2100 Belgian (Walloon) SMEs. The time at which the information was collected is an asset of the survey. Indeed, in May 2020, the effects of the shock were already tangible in Belgium [13]; from a medical viewpoint, COVID-19 itself was a little better known; macroeconomic forecasts, integrating the shock, were made available, and agents were able to project themselves a bit more on what the image of the future [14]. The dependent variable in our econometric regressions corresponds to the measurement, through a Likert scale, of small firm owner opinions about the various implemented policy measures. The Belgian experience is interesting because the wide variety of undertaken measures echo many of the measures taken within the OECD countries.
Our results suggest that the respondents have an overall positive evaluation of the various economic and social policy measures implemented by the Belgian authorities. More importantly, the assessment of SME owners with the most favorable short-term expectations is significantly different (higher or lower). Measures helping the firm to maintain the workforce under contract were particularly highly rated by firms with the highest prospects. It also appears that those firms did not want some measures to be maintained for too long. Additionally, policy measures to provide more loans and higher guarantees from public financial institutions were appreciated, although less clearly. Ultimately, we believe that our article contributes to informing policymakers about the type of entrepreneurial policies likely to help more resilient and ambitious firms, which are likely to contribute the most to economic recovery, in comparison with laggard and zombie firms [15,16].
In the next section, we present the policy measures active at the time of the survey to support business activities during the COVID-19 crisis. Although this study can be regarded as largely exploratory, Section 3 highlights some arguments for an a priori, or theoretical, treatment of the question raised. In Section 4, we introduce how we conducted our empirical analysis and report the obtained results. Section 5 is devoted to the conclusion, where we draw some lessons from the results of our study.

2. Policy Measures Taken to Support Business Activities during the COVID-19 Crisis

All countries, including Belgium, designed and implemented packages of economic and social policy measures to meet the huge challenge of the COVID-19 crisis. In an environment where everything stopped abruptly, Belgian authorities reacted quickly and vigorously to support both households and businesses, with a view to softening the harmful effects of the COVID-19 pandemic on the country’s economy.

2.1. Employment and Social Policy Measures

One of the main expenditures for businesses, especially SMEs, which represent the bulk of the Belgian economic landscape, is the overall cost associated with labor. Therefore, special attention is devoted to the contributions of businesses to social security, and relief from the amounts payable to workers. In Belgium, some companies were obliged to lockdown, thus facing an abrupt stop to their sales. They were allowed to grant temporary unemployment to their employees for economic reasons, also called force majeure. The usual benefits were raised from 65% to 70% of gross wages, supplemented by a lump-sum benefit of EUR 5.63 per day [17].
The social measures taken in Belgium and in the majority of OECD countries in response to the COVID-19 crisis are inspired by the job retention schemes previously used during the financial crisis of 2008 [18,19]. Depending on its environment, each country adapted these mechanisms to help employees keep their contracts with their employers, even if their work was suspended. Named Kurzarbeit in Germany and partial activity in France, these can take the form of short-time work (STW) schemes that directly subsidize hours not worked. Another variant of this scheme was used in the Netherlands, under the name Emergency Bridging Measure, with the payment of a wage subsidy, making it possible to maintain the workers’ income even during periods when they are not working (see also [20]).
Unlike employees, the self-employed are generally not insured against the loss of their job. Whether they work alone or have salaried workers, SME owners in Belgium are considered self-employed with respect to social security matters. Starting in March 2020, self-employed workers forced to interrupt their activity because of the COVID-19 crisis were allowed to defer the payment of their social security contributions. They could also benefit from a monthly replacement income of 1291.69 euros or, if a family depended on them, of 1614.10 euros. This measure known as bridging right was first implemented in March 2020 for three months. It was subsequently prolonged until 31 August 2020; for individuals working in industries in difficulty or remaining closed, it was prolonged through 31 December 2020 [16]. In other OECD countries, support measures for self-employed workers range “from providing sick leave payments and unemployment benefits, to lump sum subsidies. (…) France set up a solidarity fund for the self-employed of EUR 2 billion, and provides EUR 1500 monthly compensation for self-employed (and small companies), when their turnover is less than EUR 1 million and they experience a drop in their turnover of 70% or more. (…) In the United Kingdom, self-employed and gig economy workers, who are not entitled to sick pay, receive assistance worth GBP 500 million as part of the 2020 Budget” (pp. 28–29, [21]).

2.2. Financial Policy Measures

The emergency measures implemented to tackle the COVID-19 health crisis led to severe difficulties for companies trying to meet their financial obligations [22]. With the drying up of their treasury owing to the cessation of their activities, they needed financial support to stay afloat. There is evidence that, even in normal conditions, SMEs generally have fewer of their own resources and confront difficulties in accessing external finance, except through their banks [23,24]. Here, we present financial support to SMEs in Belgium and similar measures in some OECD countries. These include regional allowances, credit repayment facilities, and guarantees provided by public financial institutions to commercial banks in order to keep lending money to entrepreneurs and SMEs.
On 18 March 2020, the National Security Council of Belgium strengthened its measures to fight the coronavirus. In order to support businesses and self-employed people directly impacted by these measures, the Walloon Government (Wallonia is one of the three regions of Federal Belgium; the other two regions are Brussels and Flanders) set up an extraordinary fund of EUR 573.8 million. Under defined conditions, Walloon businesses and self-employed persons could benefit from an indemnity of 5000 EUR or assistance of 2500 EUR subject to acceptance after verification of the application file by officials of the Public Service of Wallonia. The single lump-sum amount of 5000 EUR was given to each company and self-employed person strongly affected by the measures of the National Security Council in the fight against the coronavirus.
The Walloon Government also granted a one-off flat-rate aid of EUR 2500 to each self-employed worker and small business owner who operates in Wallonia and who has benefited from full temporary replacement revenue in March and April 2020. The grant was also awarded if the manager of the business was not a self-employed worker and/or if most workers were placed on temporary economic unemployment for force majeure in March and April 2020. An additional compensation of EUR 3500 was announced on 10 July 2020. This additional compensation was granted to companies that are still fully affected by the impact of the COVID-19 crisis and/or are obliged to remain closed.
The general schemes for direct lump sum subsidies are mainly targeted at SMEs and/or the self-employed. The amount granted and the required conditions vary significantly across countries [21]. “In France, small companies and self-employed can be granted a EUR 1500 monthly compensation, when their turnover is less than EUR 1 million and they experience a drop in their turnover of 70% or more. Germany has made EUR 10 billion available in direct subsidies to one-person businesses and micro-enterprises. Bavaria offers a scheme of immediate and easily accessible aid from EUR 5000 to 30,000 for affected companies. (…) The United Kingdom is increasing grants to small businesses eligible for Small Business Rate Relief from GBP 3000 to 10,000. Furthermore, GBP 25,000 in grants is provided to retail, hospitality and leisure businesses operating from smaller premises, with a ratable value over GBP 15,000 and below GBP 51,000. Small businesses in England that already pay little or no business rates will be eligible for a one-off coronavirus grant of up to GBP 3000. Scotland is to provide grants of at least GBP 3000 to small businesses in sectors facing the worst economic impact of COVID-19” (p. 38, [21]).
The payment of mortgages/credits and premiums for fire insurance and outstanding balance for families, viable firms, and the self-employed could be deferred until the end of September 2020 without being charged a fee. In May 2020, the payment of consumer credit was also allowed to be deferred for three months, which could be renewed for another three months.
A moratorium on the repayment of debt was also introduced, whereby SMEs could defer the repayment of debt [21]. In Belgium, the federal government and the financial sector issued a message to the self-employed, the heads of SMEs, and the market, guaranteeing EUR 50 billion in new credits and credit lines with a maximum term of 12 months (excluding refinancing credits) provided until 30 September 2020.
Action in Wallonia/Belgium mirrors action in other OECD countries. “Australian banks announced support for SMEs through a six-month break in loan repayments” (p. 59, [21]). “Backed by the Government, the Italian Banking Association announced an agreement with various business associations to set in place a large-scale moratorium on debt repayments, including mortgages and repayments of small loans and revolving credit lines. It would concern loans subscribed by companies until 31 January 2020” (p. 107, [21]).
To encourage commercial banks to continue to provide loans to SMEs, many countries designed and implemented public guarantee schemes. The Walloon region, through its financial organization called Sowalfin, also set up financial products on advantageous terms for companies needing liquidity. The so-called ricochet loan should allow entrepreneurs to obtain a mixed credit composed of a guarantee of 75% on the desired bank credit and a subordinated loan of maximum 50% of the bank loan. However, the combined value must not exceed EUR 45,000.
In the United Kingdom, following a similar scheme, the government created emergency loans to SMEs known as ‘Bounce back Loans’ (BBLs), which were 100% guaranteed by the government, and thus were not considered as possible non-performing loans, even if the lenders could not repay them [9]. Similar guarantees schemes were also implemented in many other European and Asian countries.

2.3. Tax and Fiscal Policy Measures

Additional difficulties that companies often face are related to fiscal and administrative burdens. These are among the most important obstacles to business development mentioned by the heads of SMEs. The easing and delaying of not just formalities and documents to be filed, but also payments, were implemented to support companies and the self-employed during this harsh period. Most OECD countries introduced such deferrals and relief with respect to corporate and income tax payments, albeit with varying scope, duration, and intensity [22].
In Belgium, three main fiscal measures were taken in response to the Coronavirus crisis. Additional flexibility in the payment of tax arrears was granted to businesses in distress, including new postponement and repayment plans. The deadlines of fiscal declarations were postponed for at least two months in March 2020. This measure was prolonged for sectors remaining distressed after the first lockdown. Social security contributions were also postponed for incorporated firms regarding their employees. The self-employed also obtained a reduction in their social security contributions. The emergency measures implemented by the Federal Government, Regions, and Communities, to protect Belgian businesses and households from the crisis caused by the Coronavirus pandemic, were expected to cost 14.3 billion euros in 2020, based on figures from the National Bank of Belgium [25].
The U.S. Treasury Department deferred tax payments without interest or penalties with the aim of shoring up liquidity. Canada introduced deferral of income tax until 31 August 2020. Many countries are not charging interest on delayed payments, while also offering payment in instalments after the deferral period; these countries include Canada, Ireland, Lithuania, and the United Kingdom [22].

3. Theoretical Insights and Perspectives

As a reminder, in this study, we are interested in the rating by SMEs owners of various economic policy measures in response to the COVID-19 crisis, their rating being connected to their business prospects. Linking the business prospects of the firm with the policy measures implemented can be done with the help of some theoretical insights and, furthermore, opens up some theoretical perspectives.
The resource-based view suggests [26,27,28] that a company anticipating its forthcoming activity will also consider its capabilities, the resources it currently has, and those it is likely to need. Moreover, it will identify whether these capabilities and resources are internal or external. The temporality of these anticipations, whether short-, medium-, or long-term, would also play a role [29]. An additional issue for the firm will be to be able to recombine its capabilities and resources, in particular to face uncertainty, as suggested by the dynamic capabilities theory [30,31].
In a fast-growing body of literature in entrepreneurship, the concept of the ambitious entrepreneur is gaining weight as an important predictor of firms’ performance outcome. Entrepreneurs qualified as ambitious want, intend, or expect to extensively grow their firms. Growth expectations are considered to be a tool to operationalize the concept of the ambitious entrepreneur. It combines what the entrepreneur wants to achieve with the opportunities and constraints s/he perceives [15,32].
In a period of great uncertainty, like that of the COVID-19 crisis, having growth expectations for the company is a signal of resilience. Indeed, in their expectations, entrepreneurs integrate the adverse environment, evaluating their resources and capabilities to find entrepreneurial ways to create as much value as possible despite surrounding constraints [12,33,34].
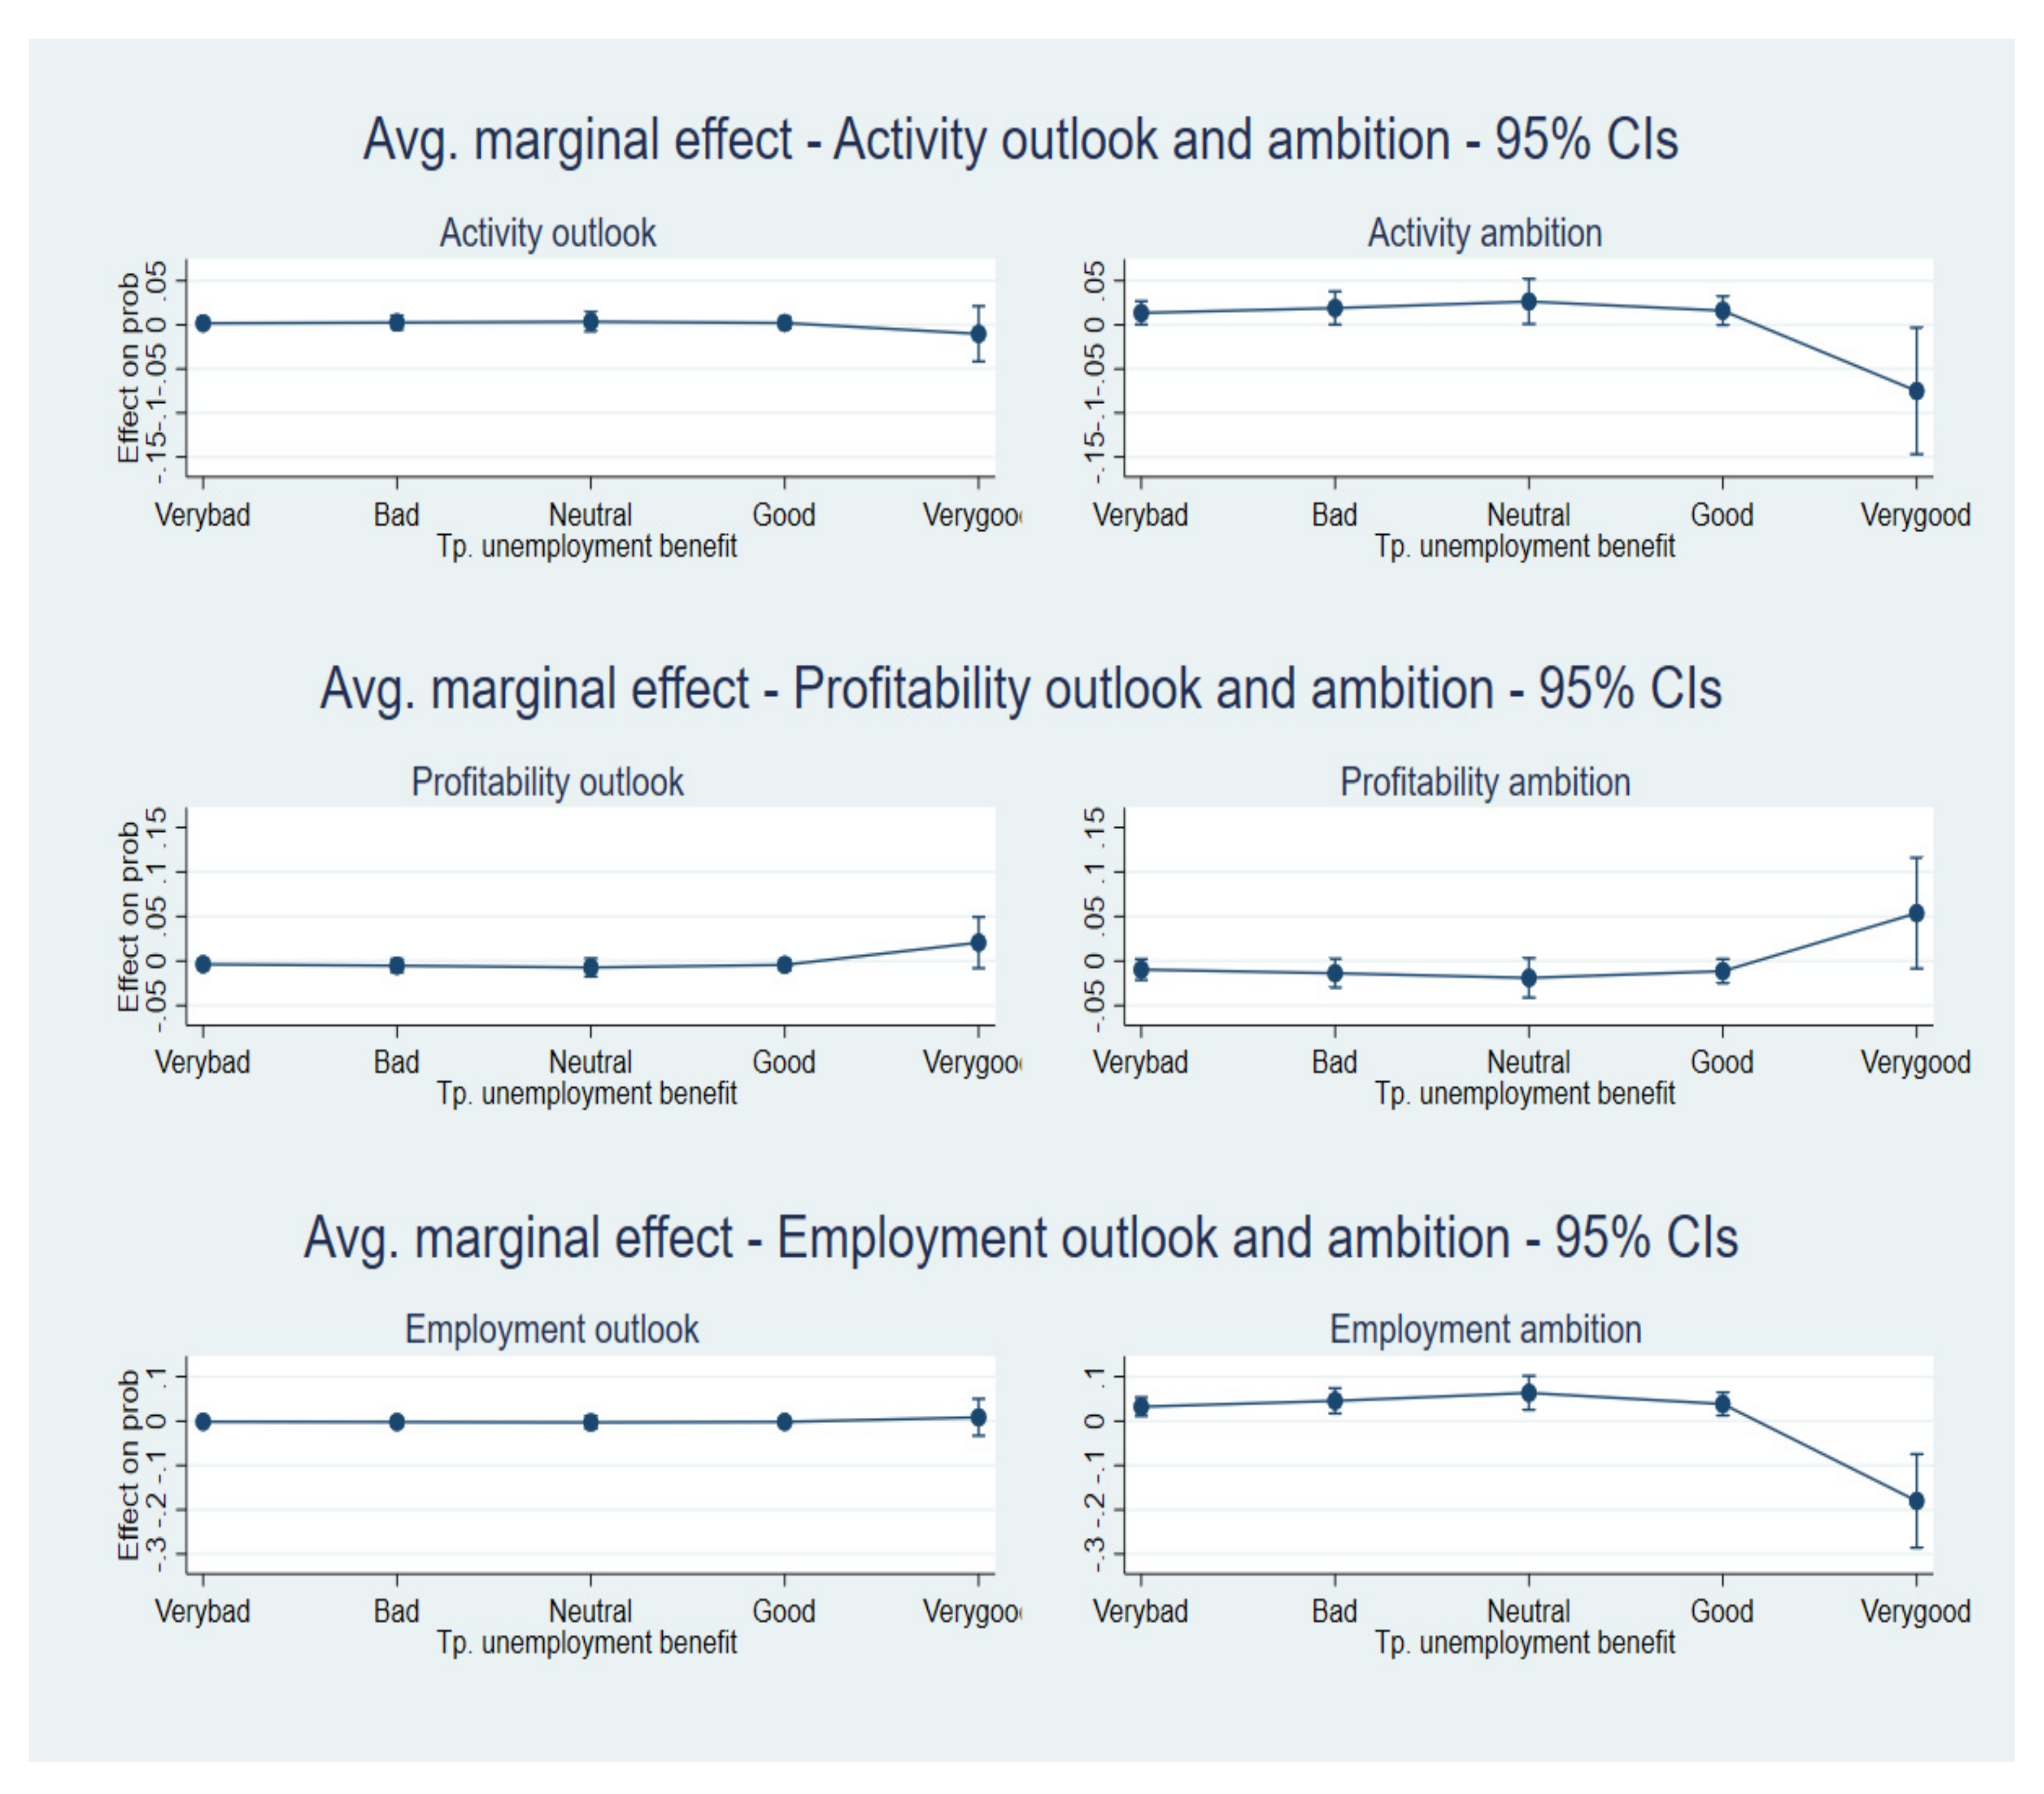
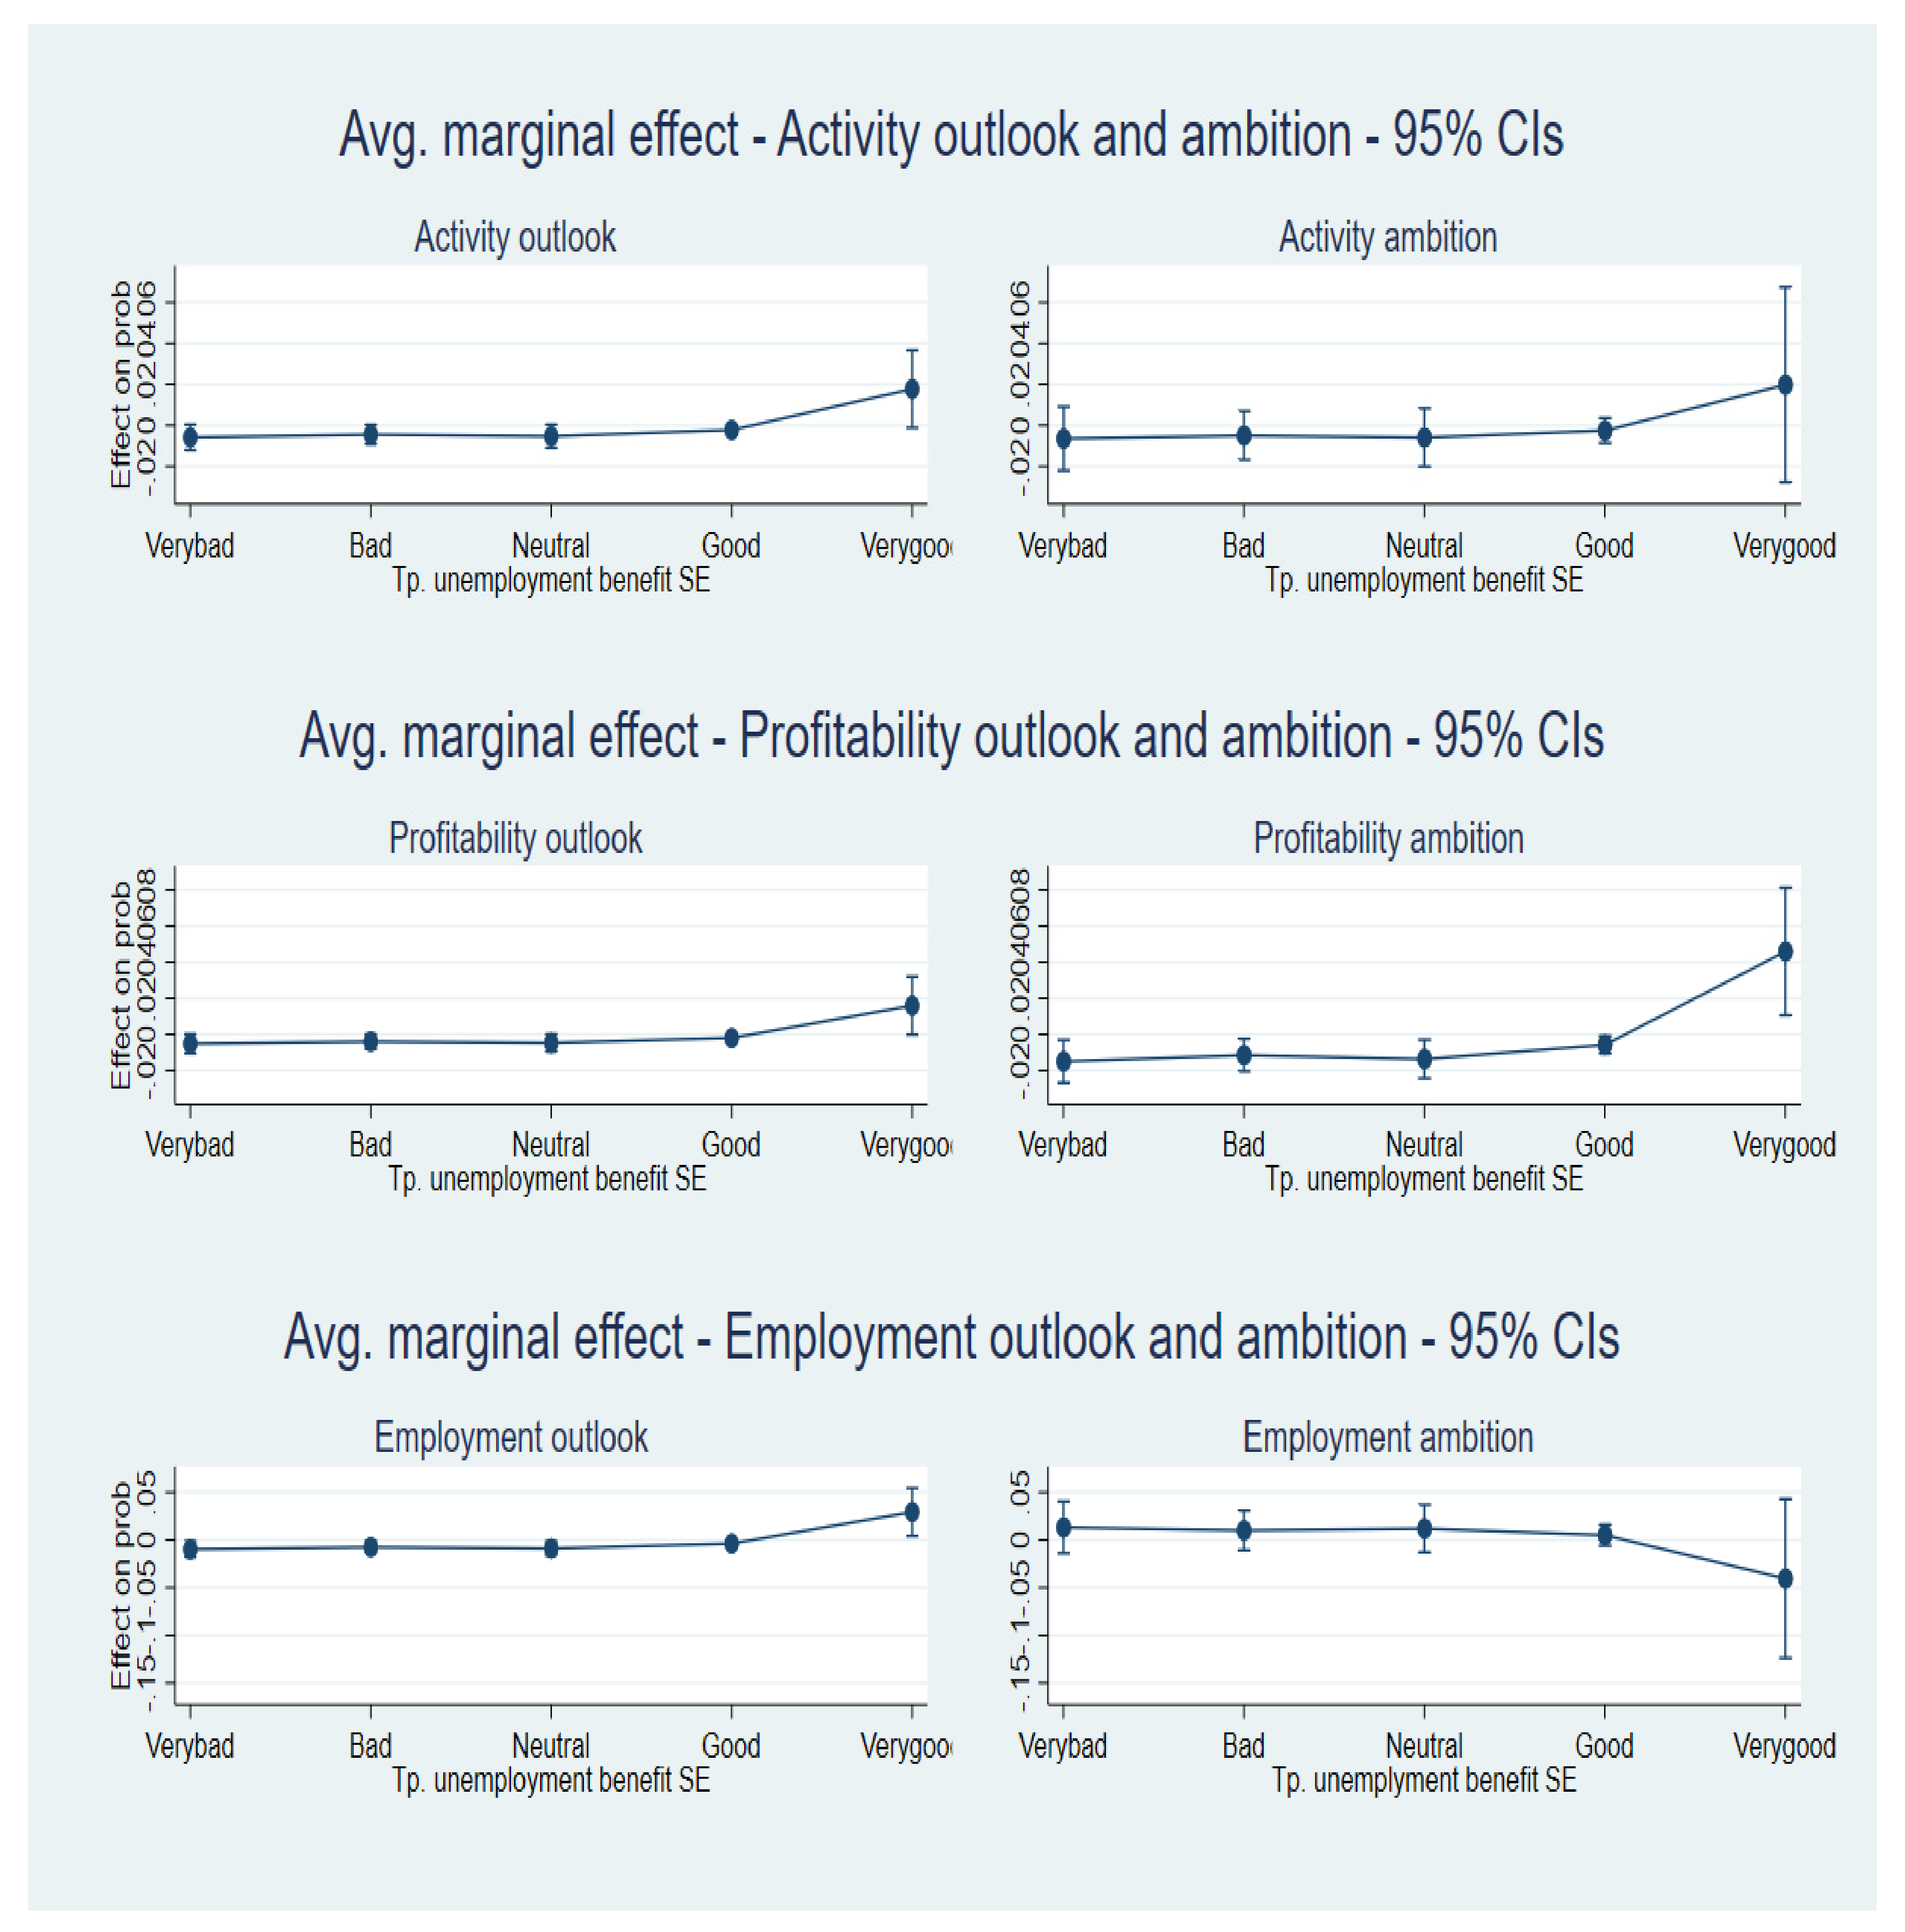
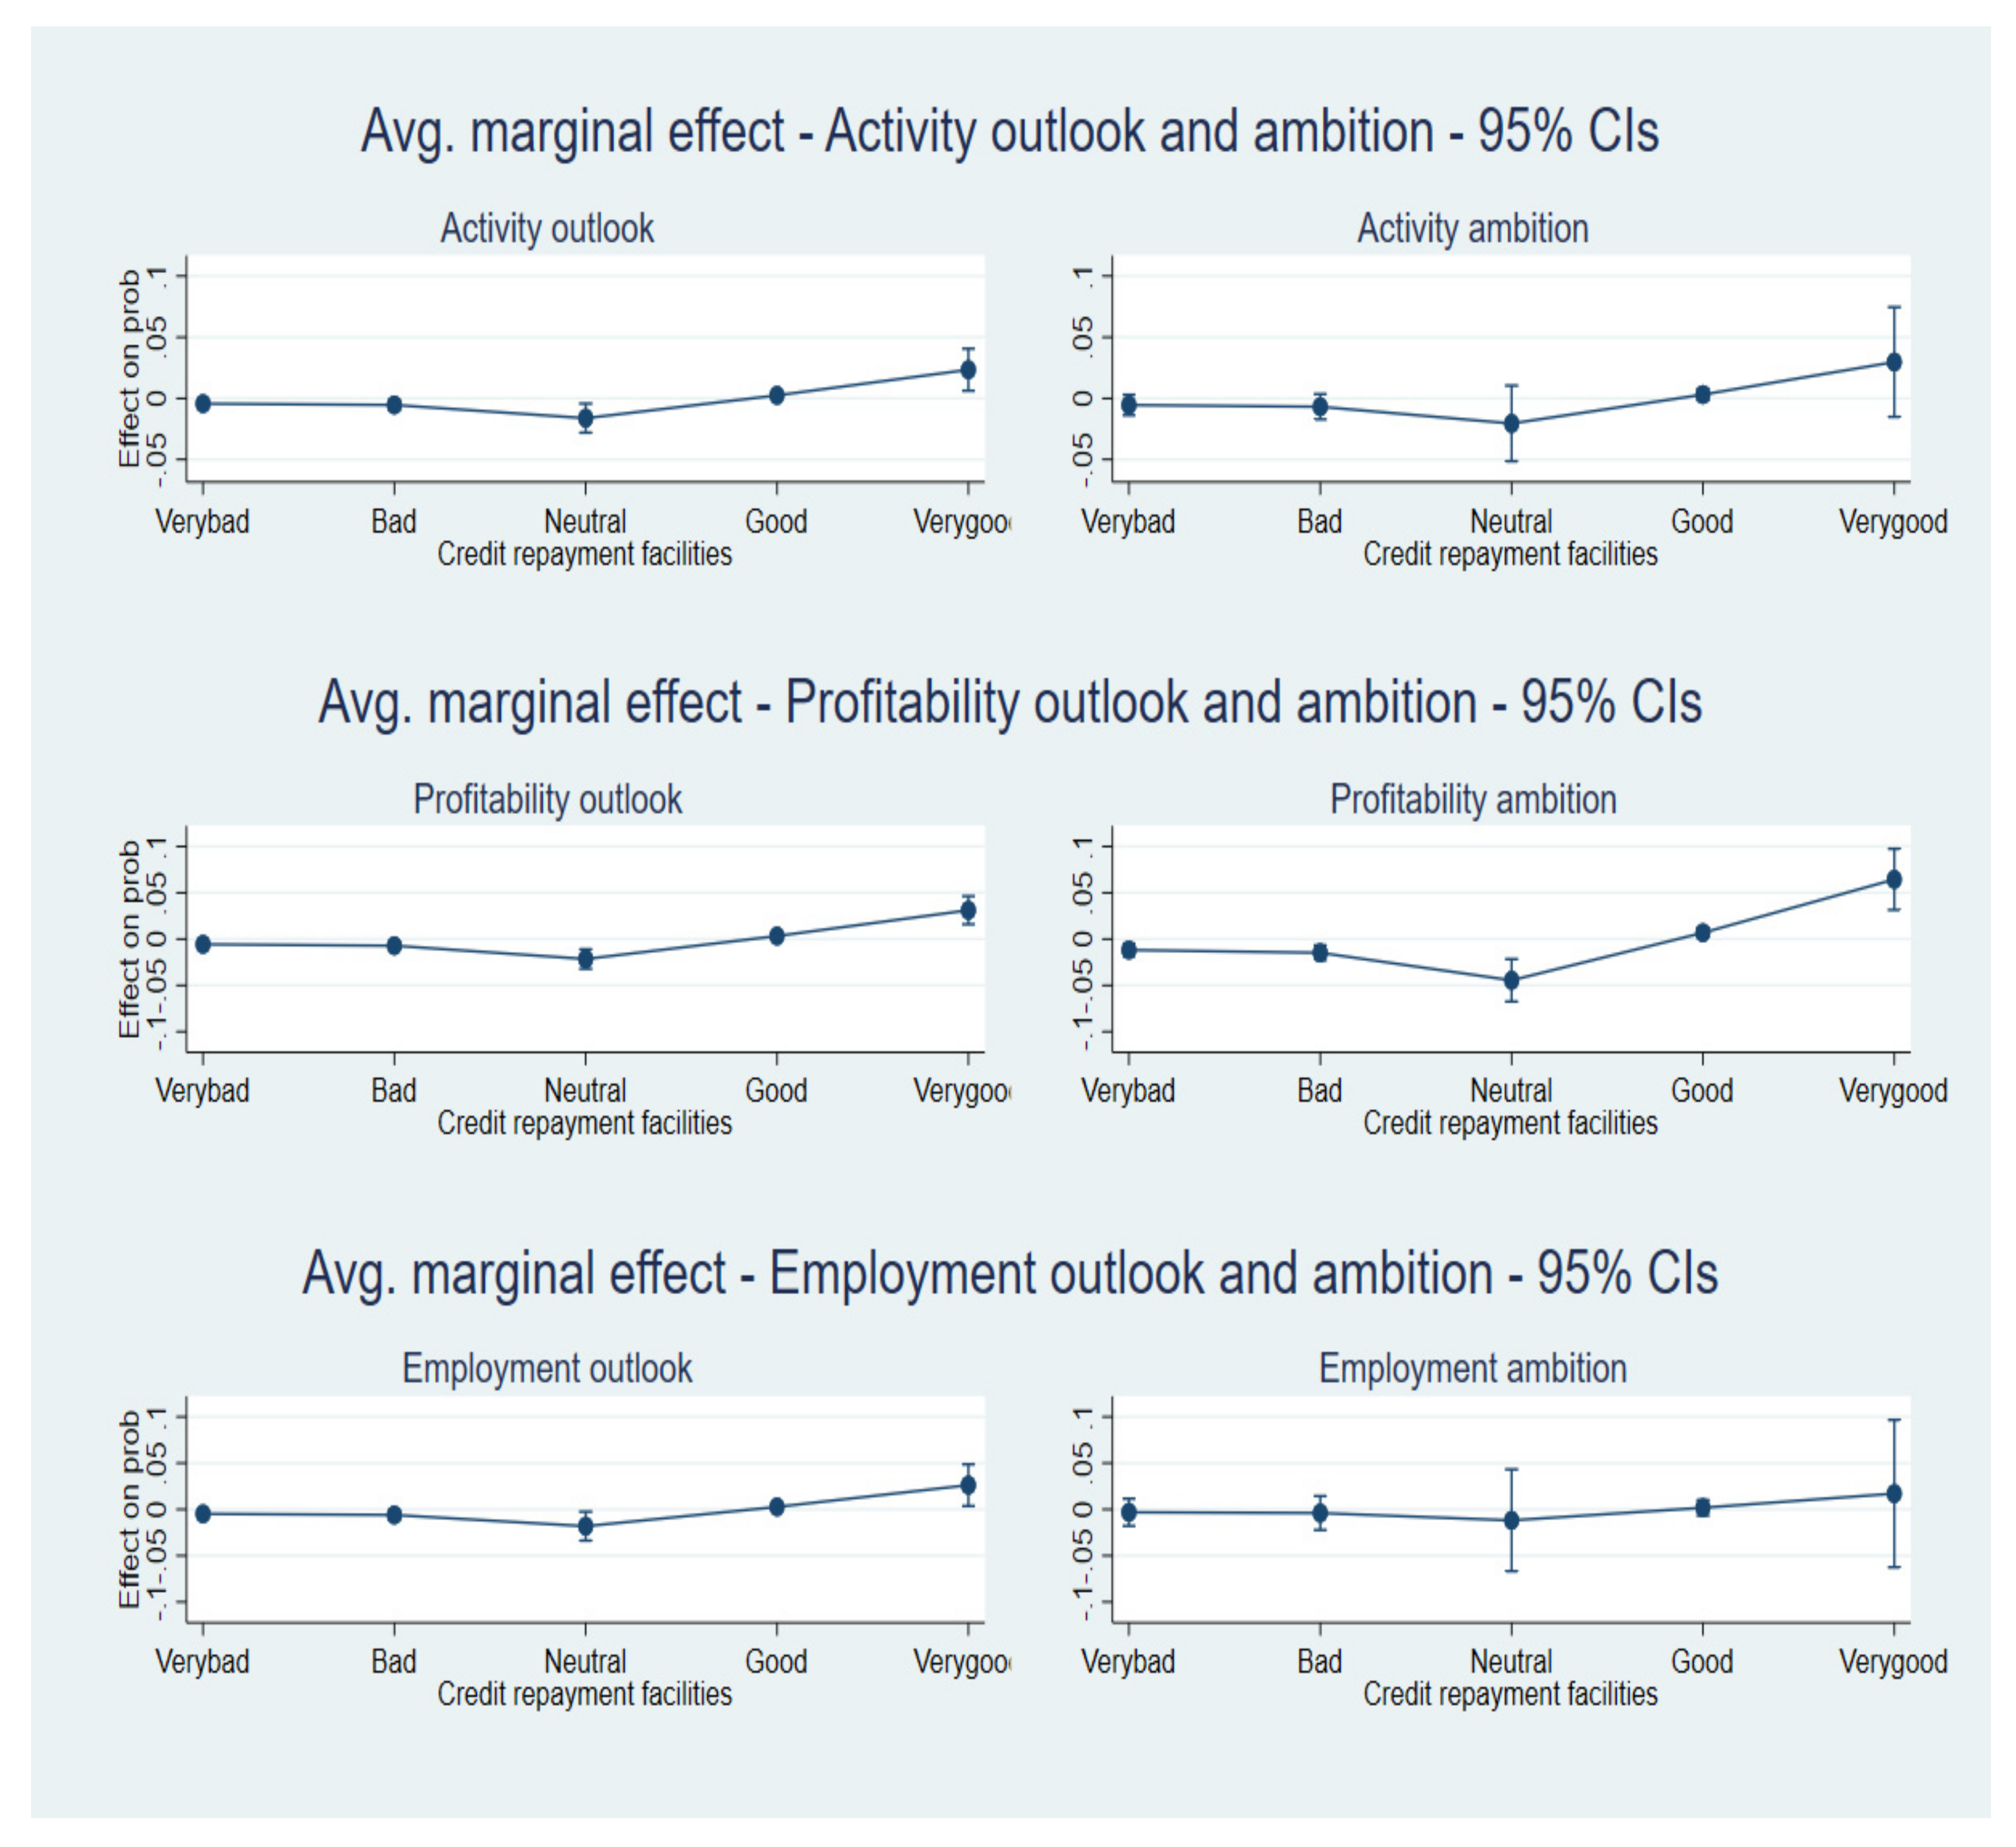
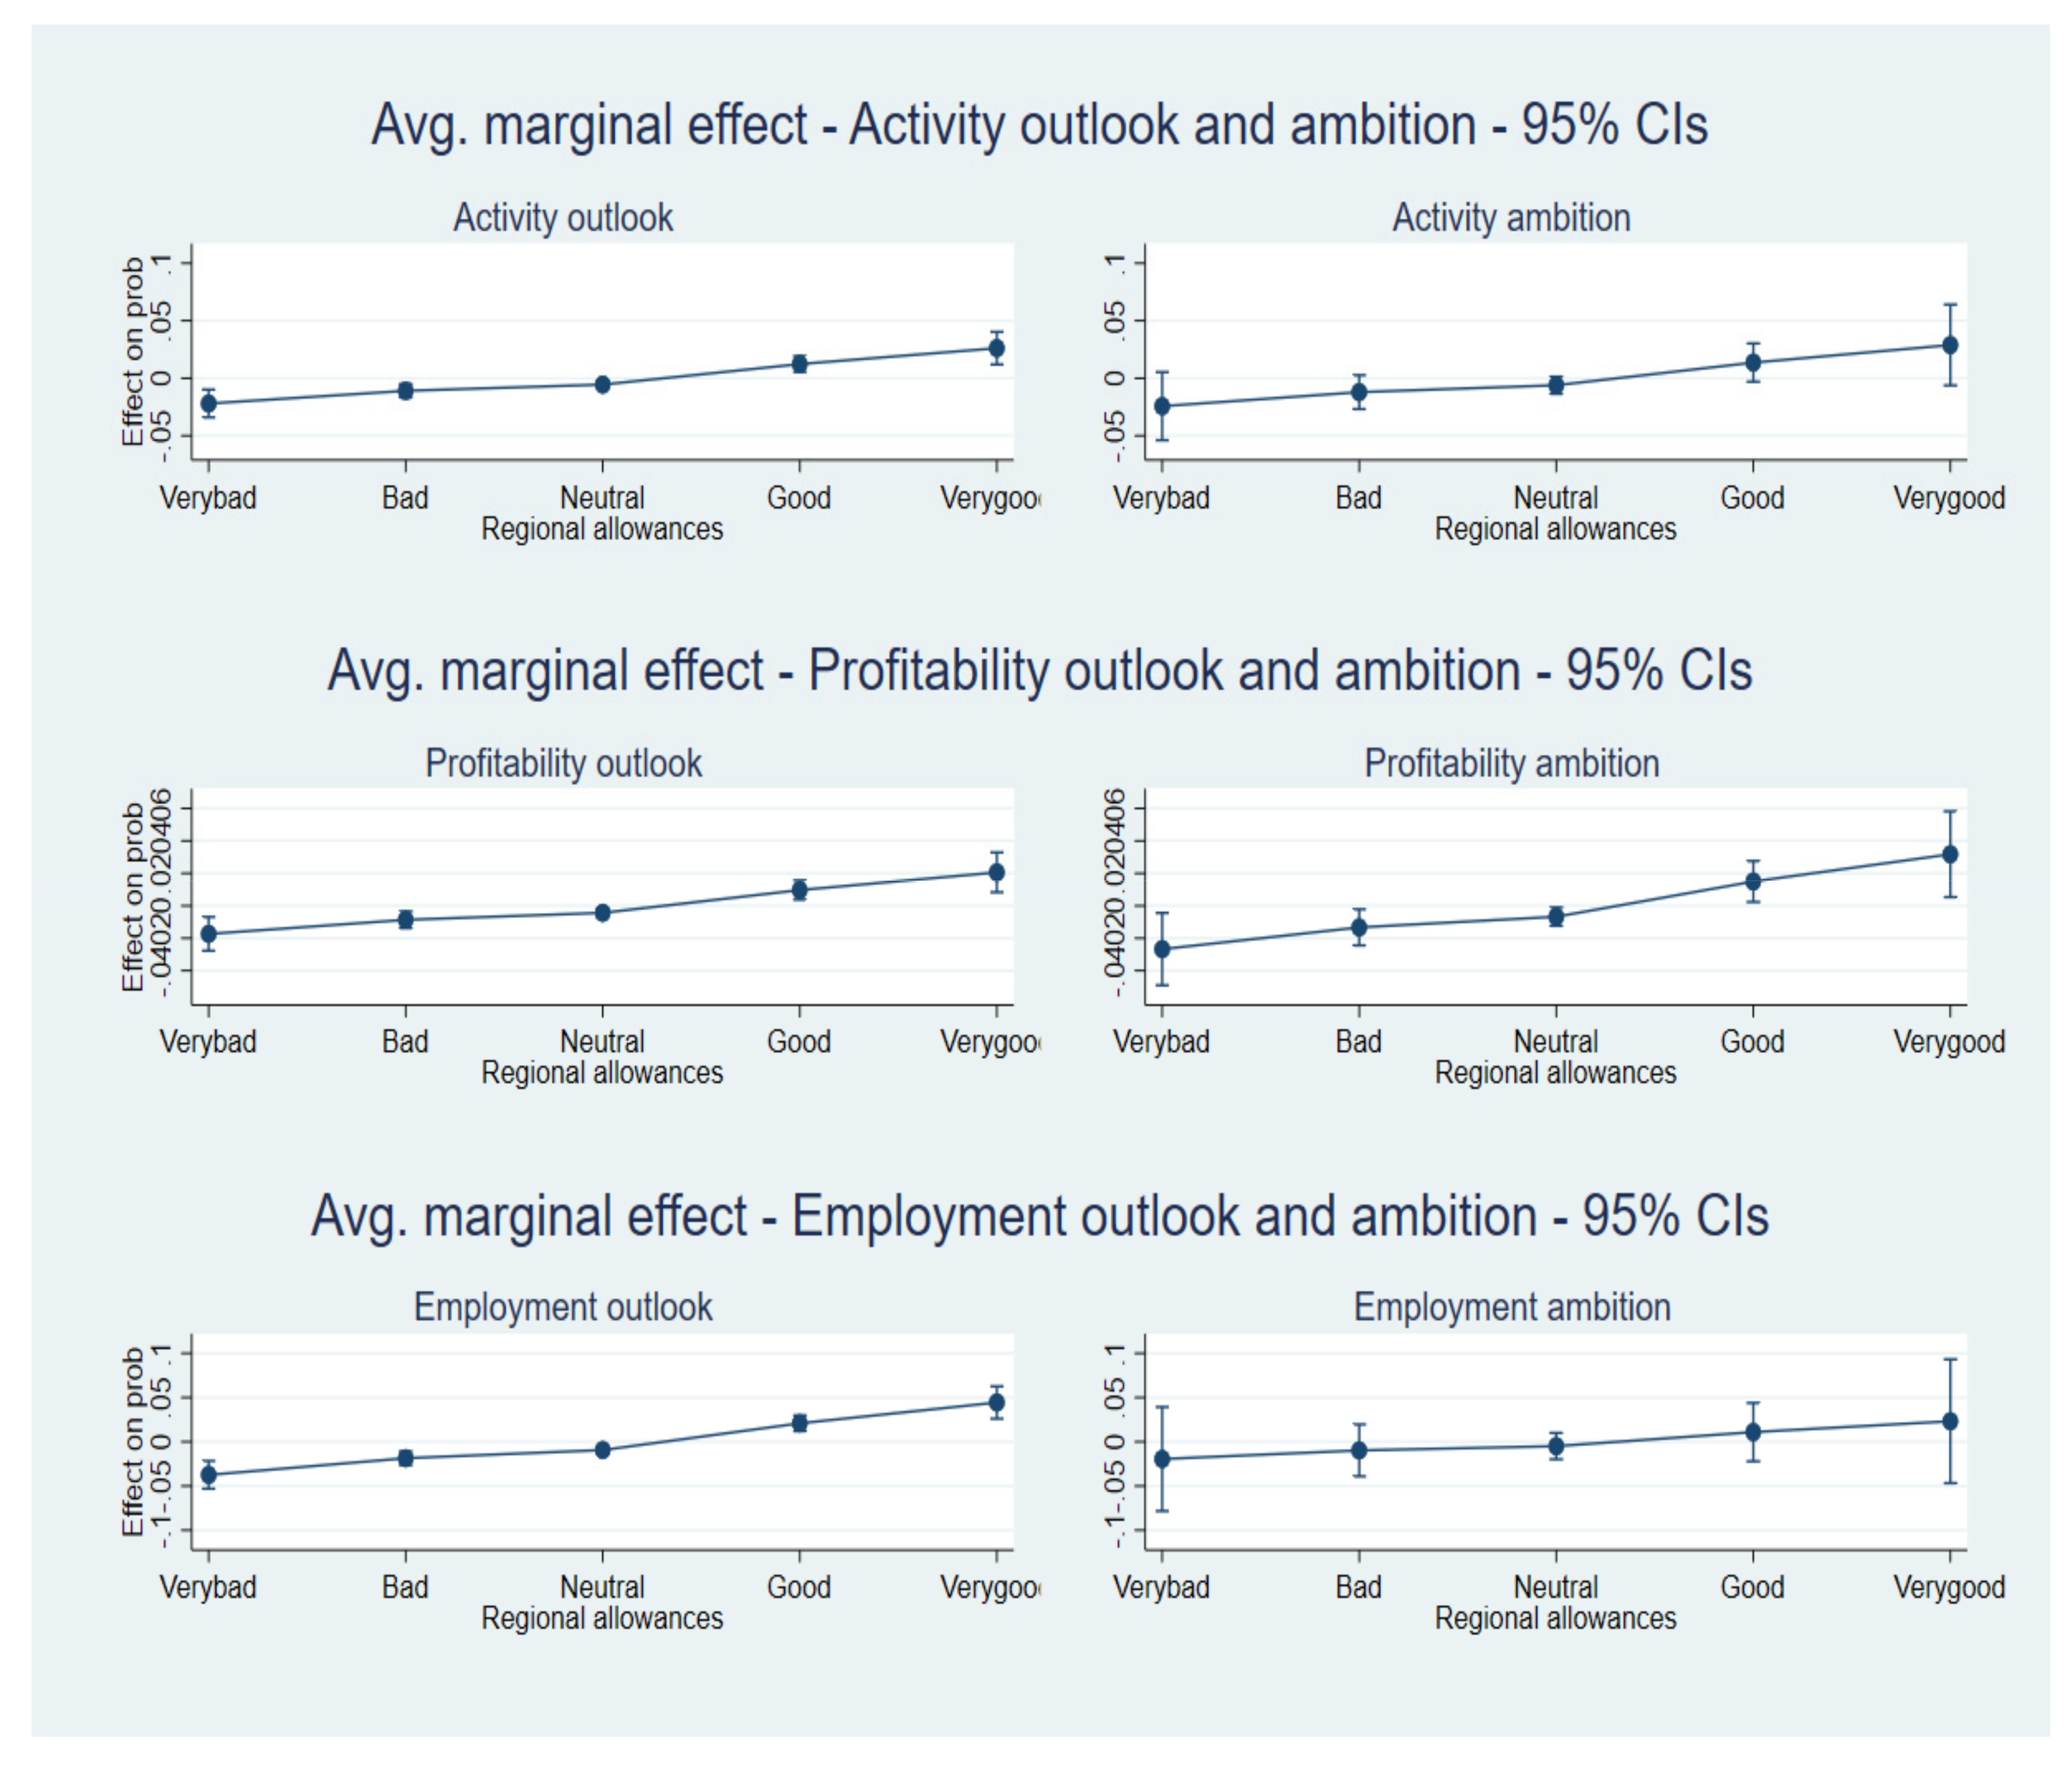
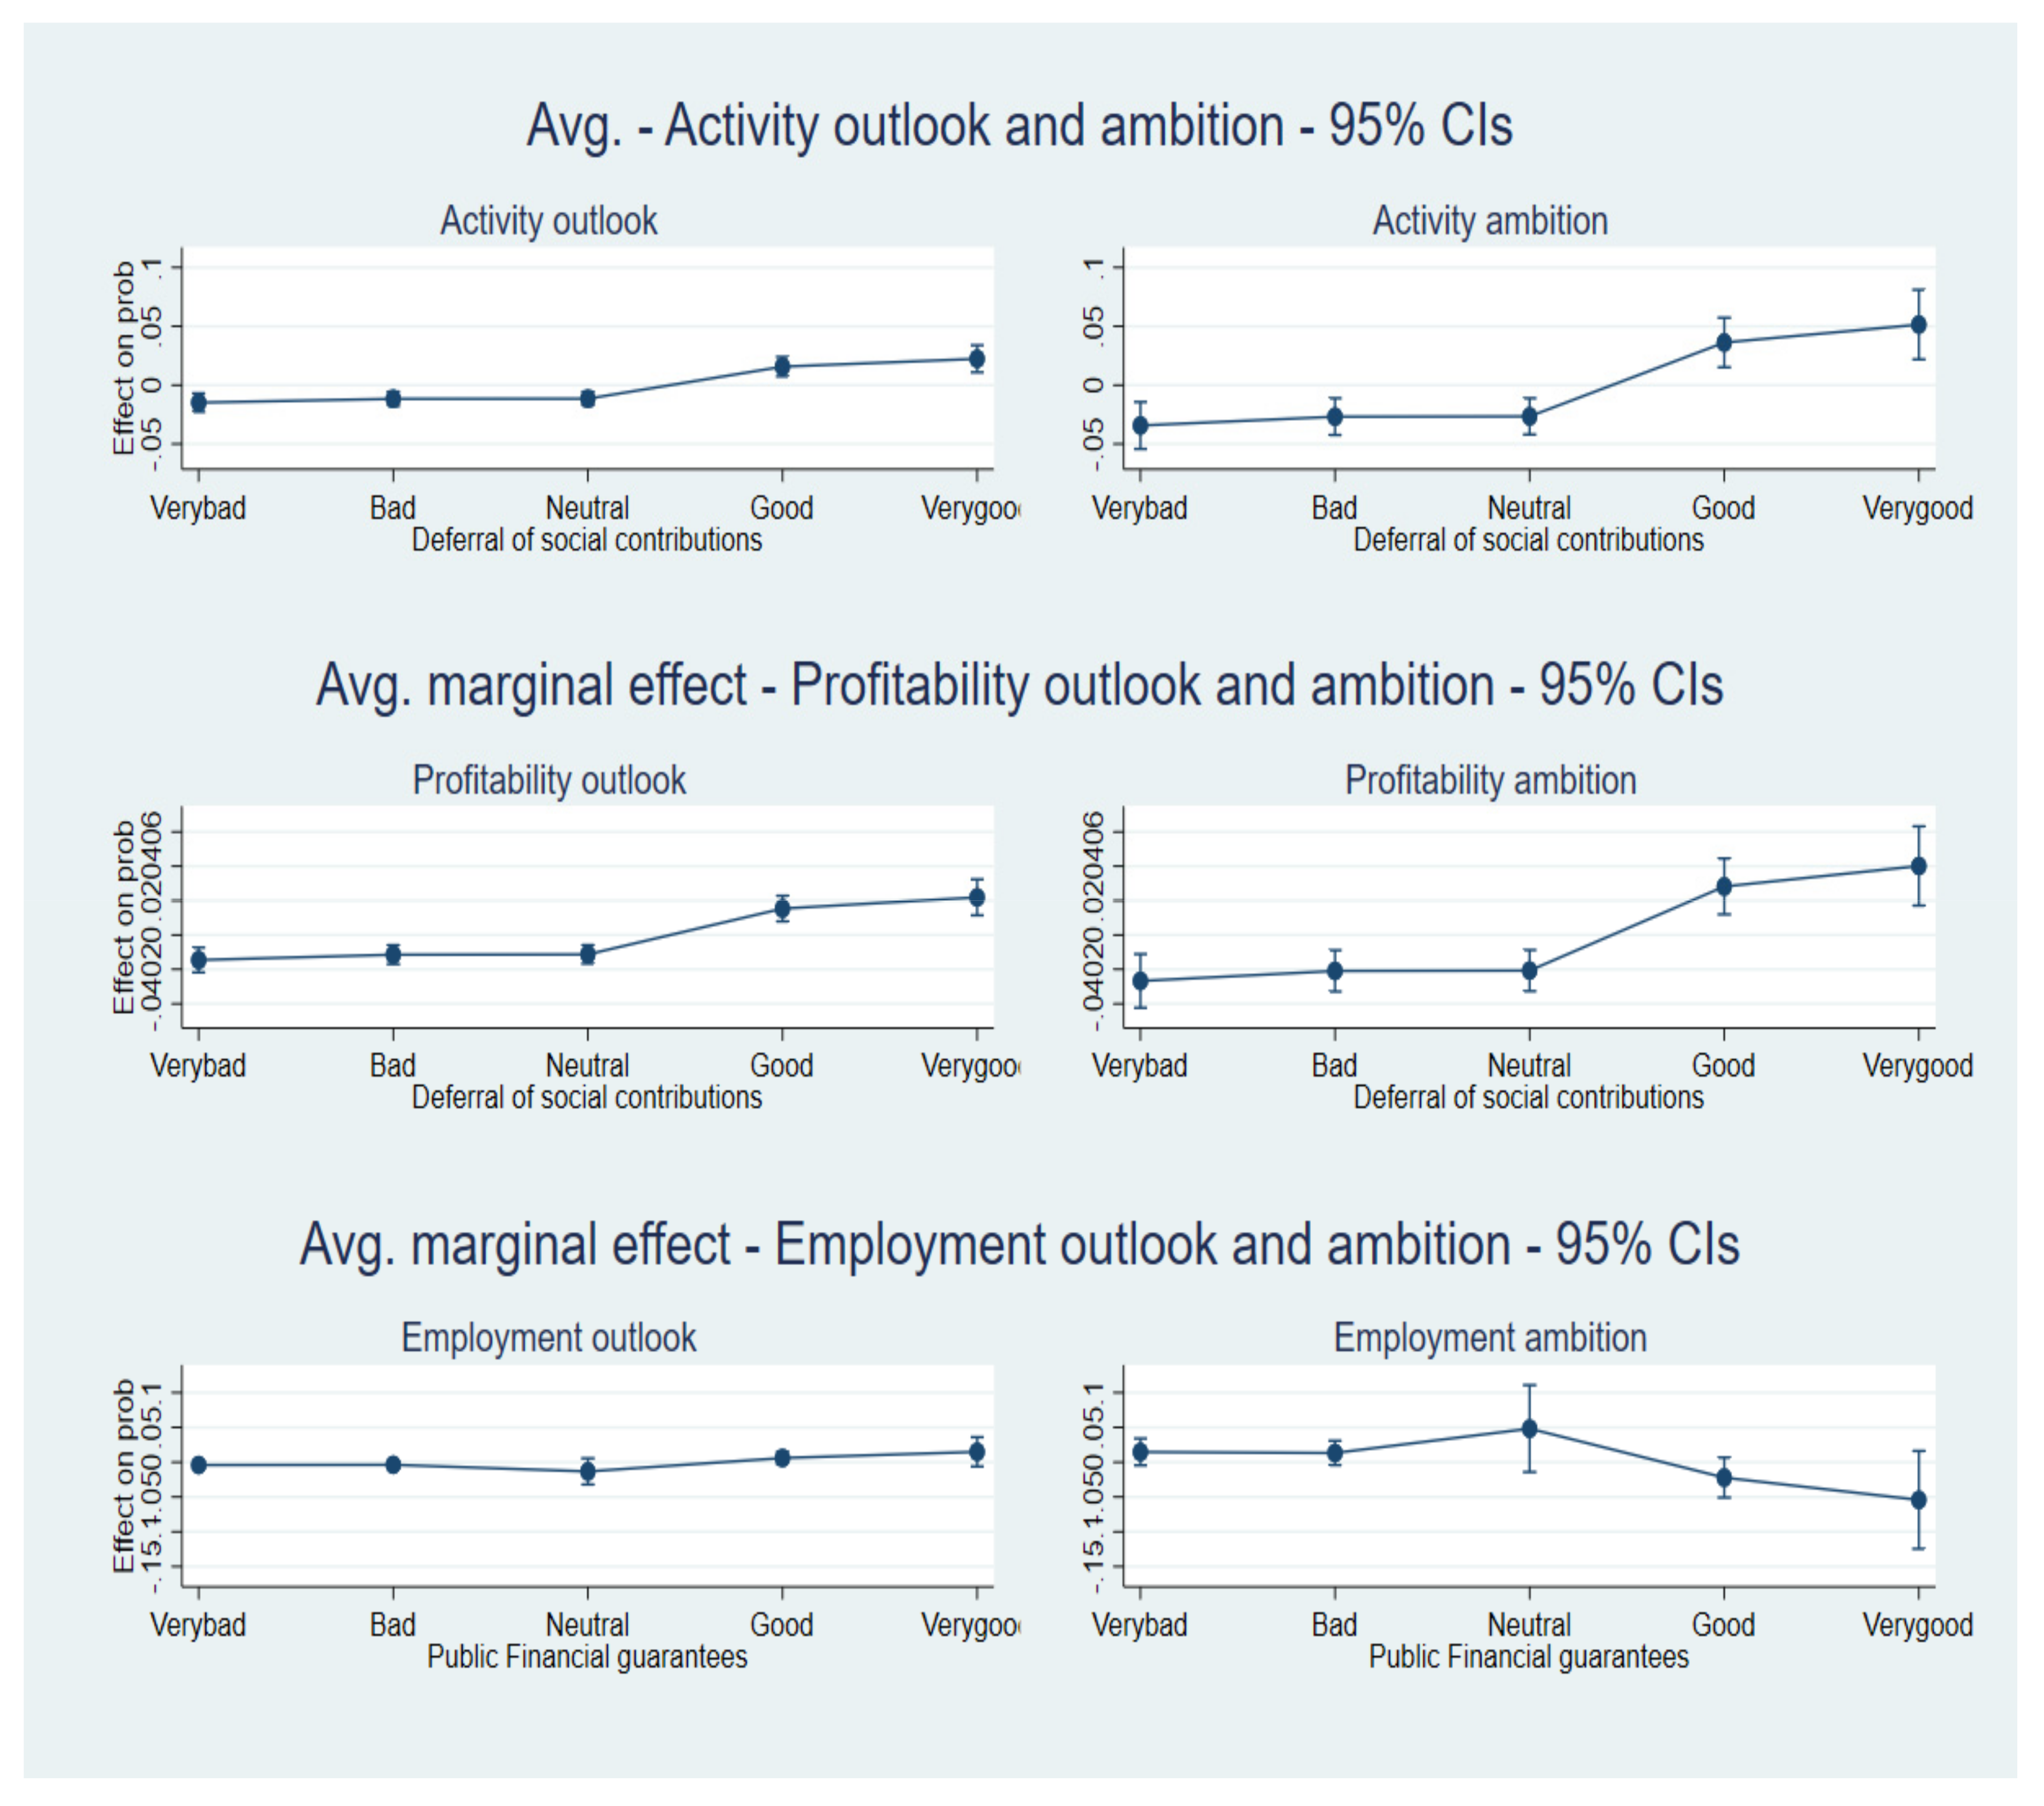
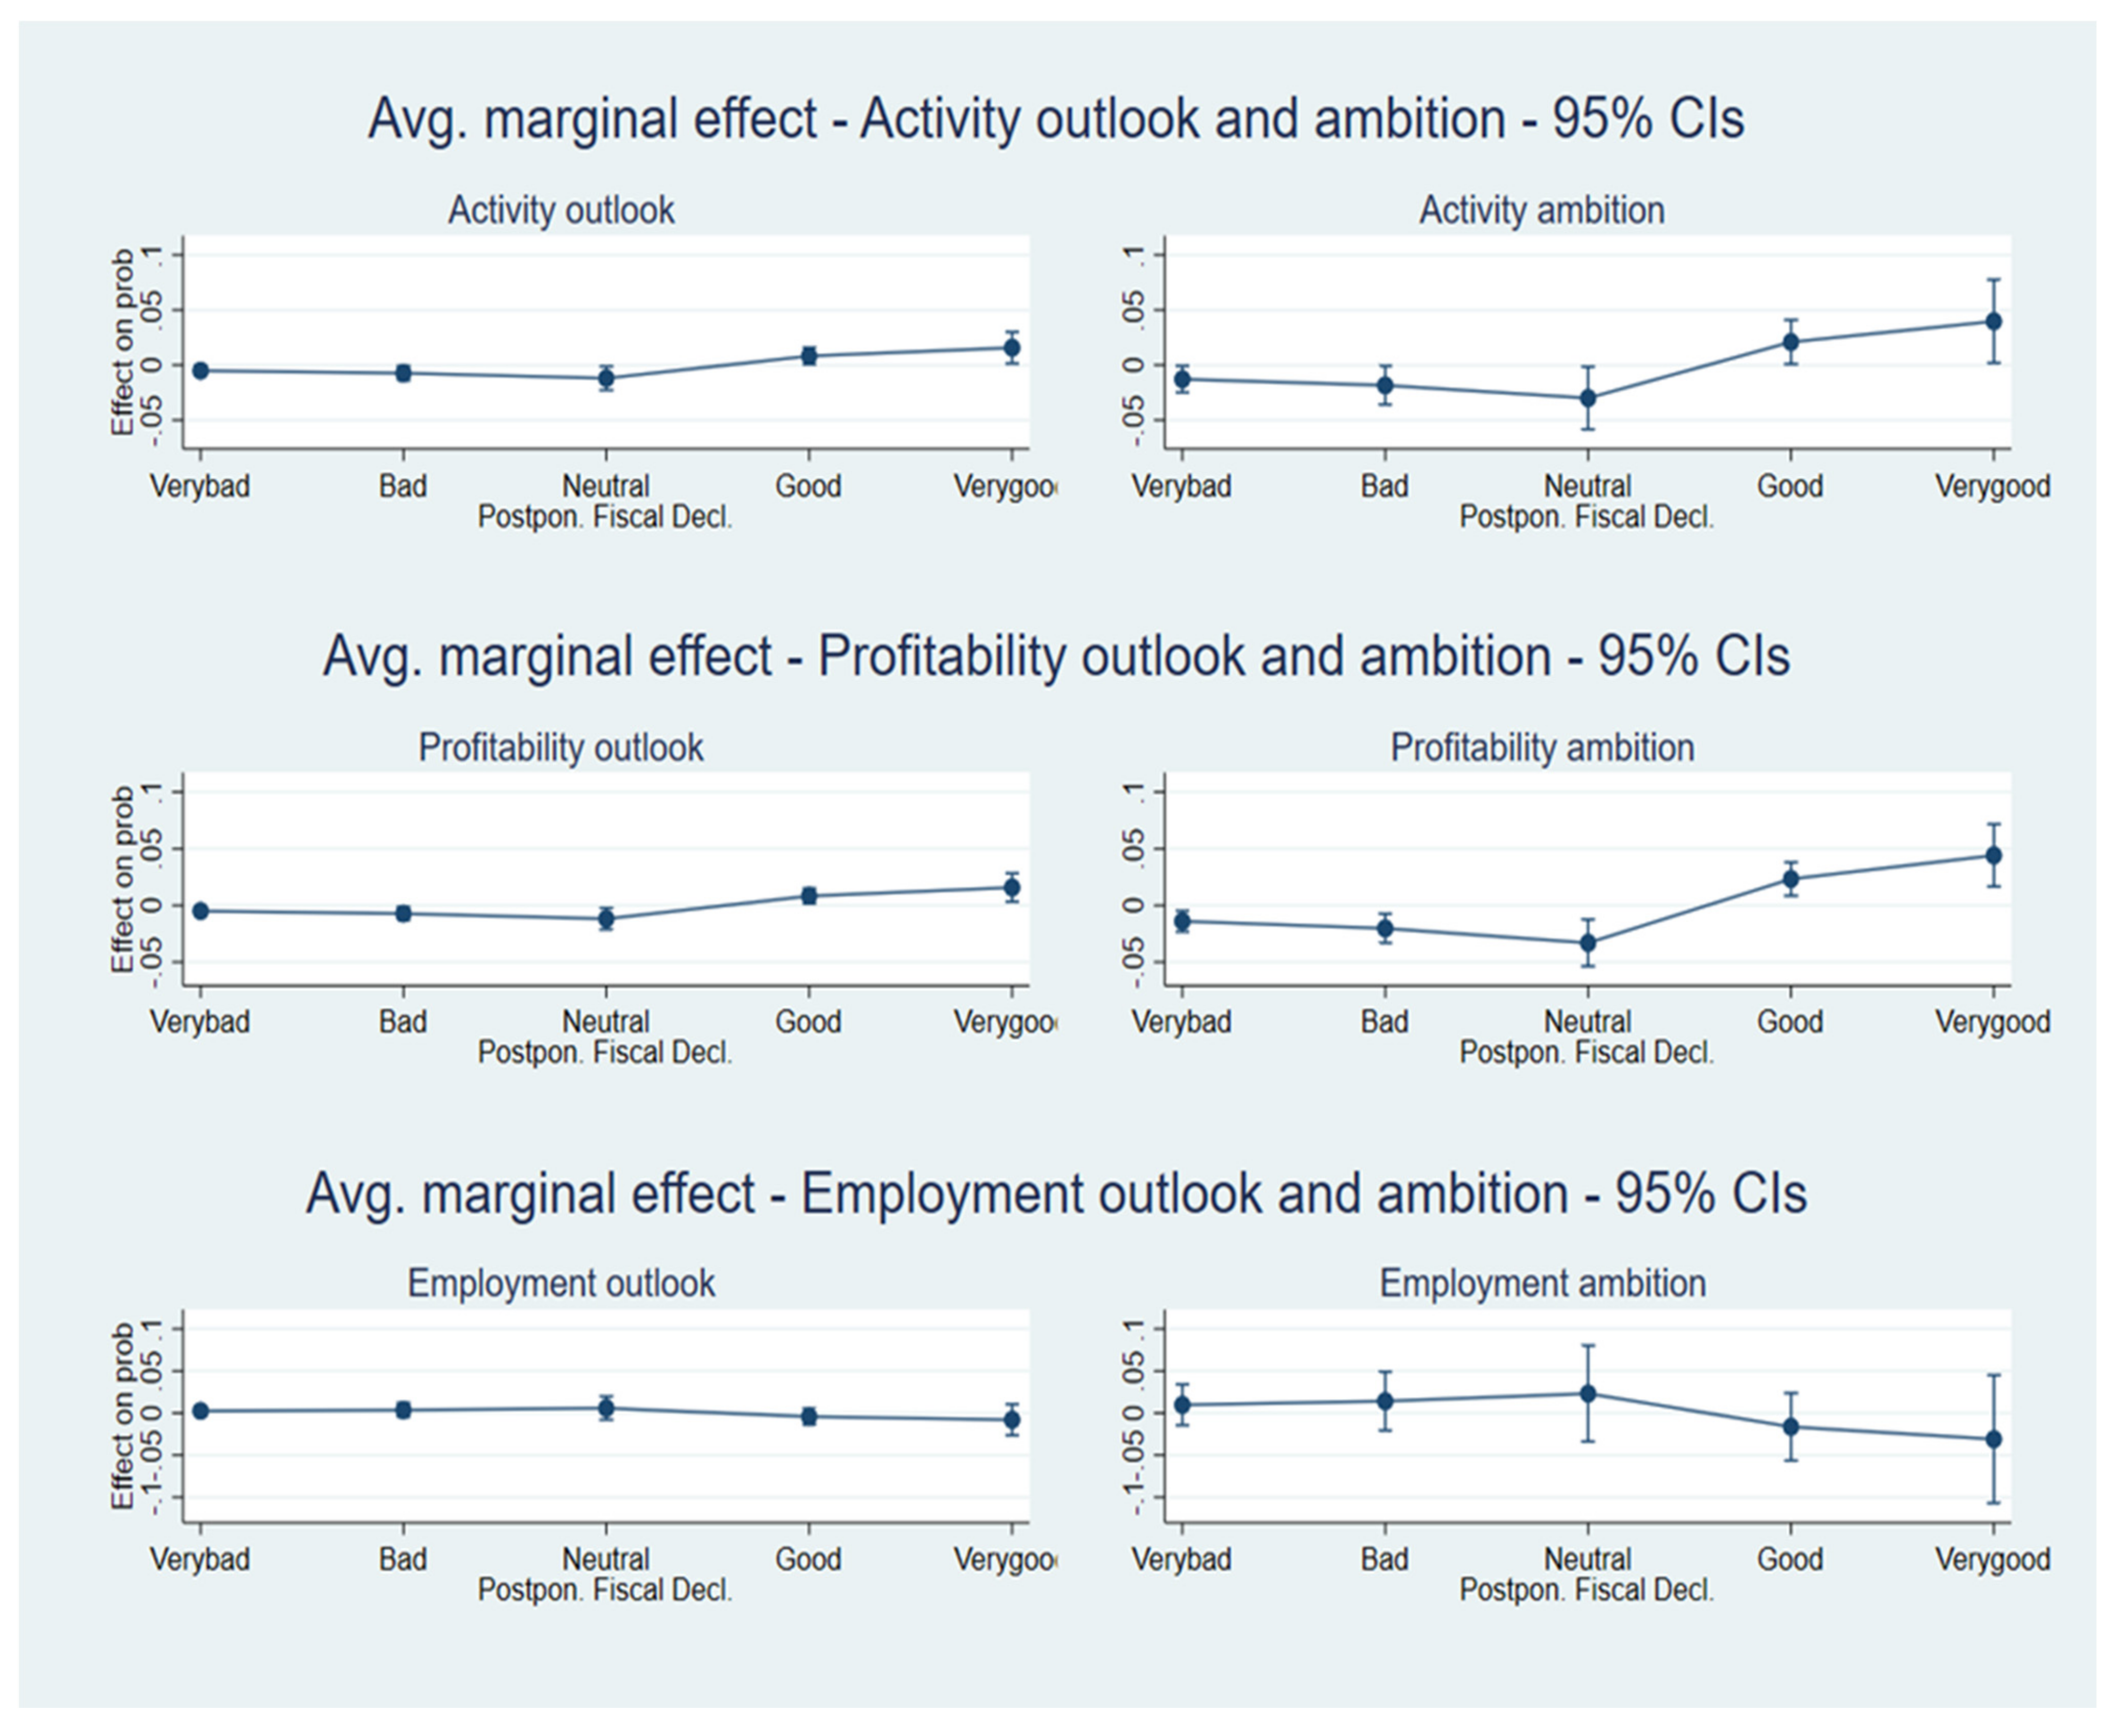
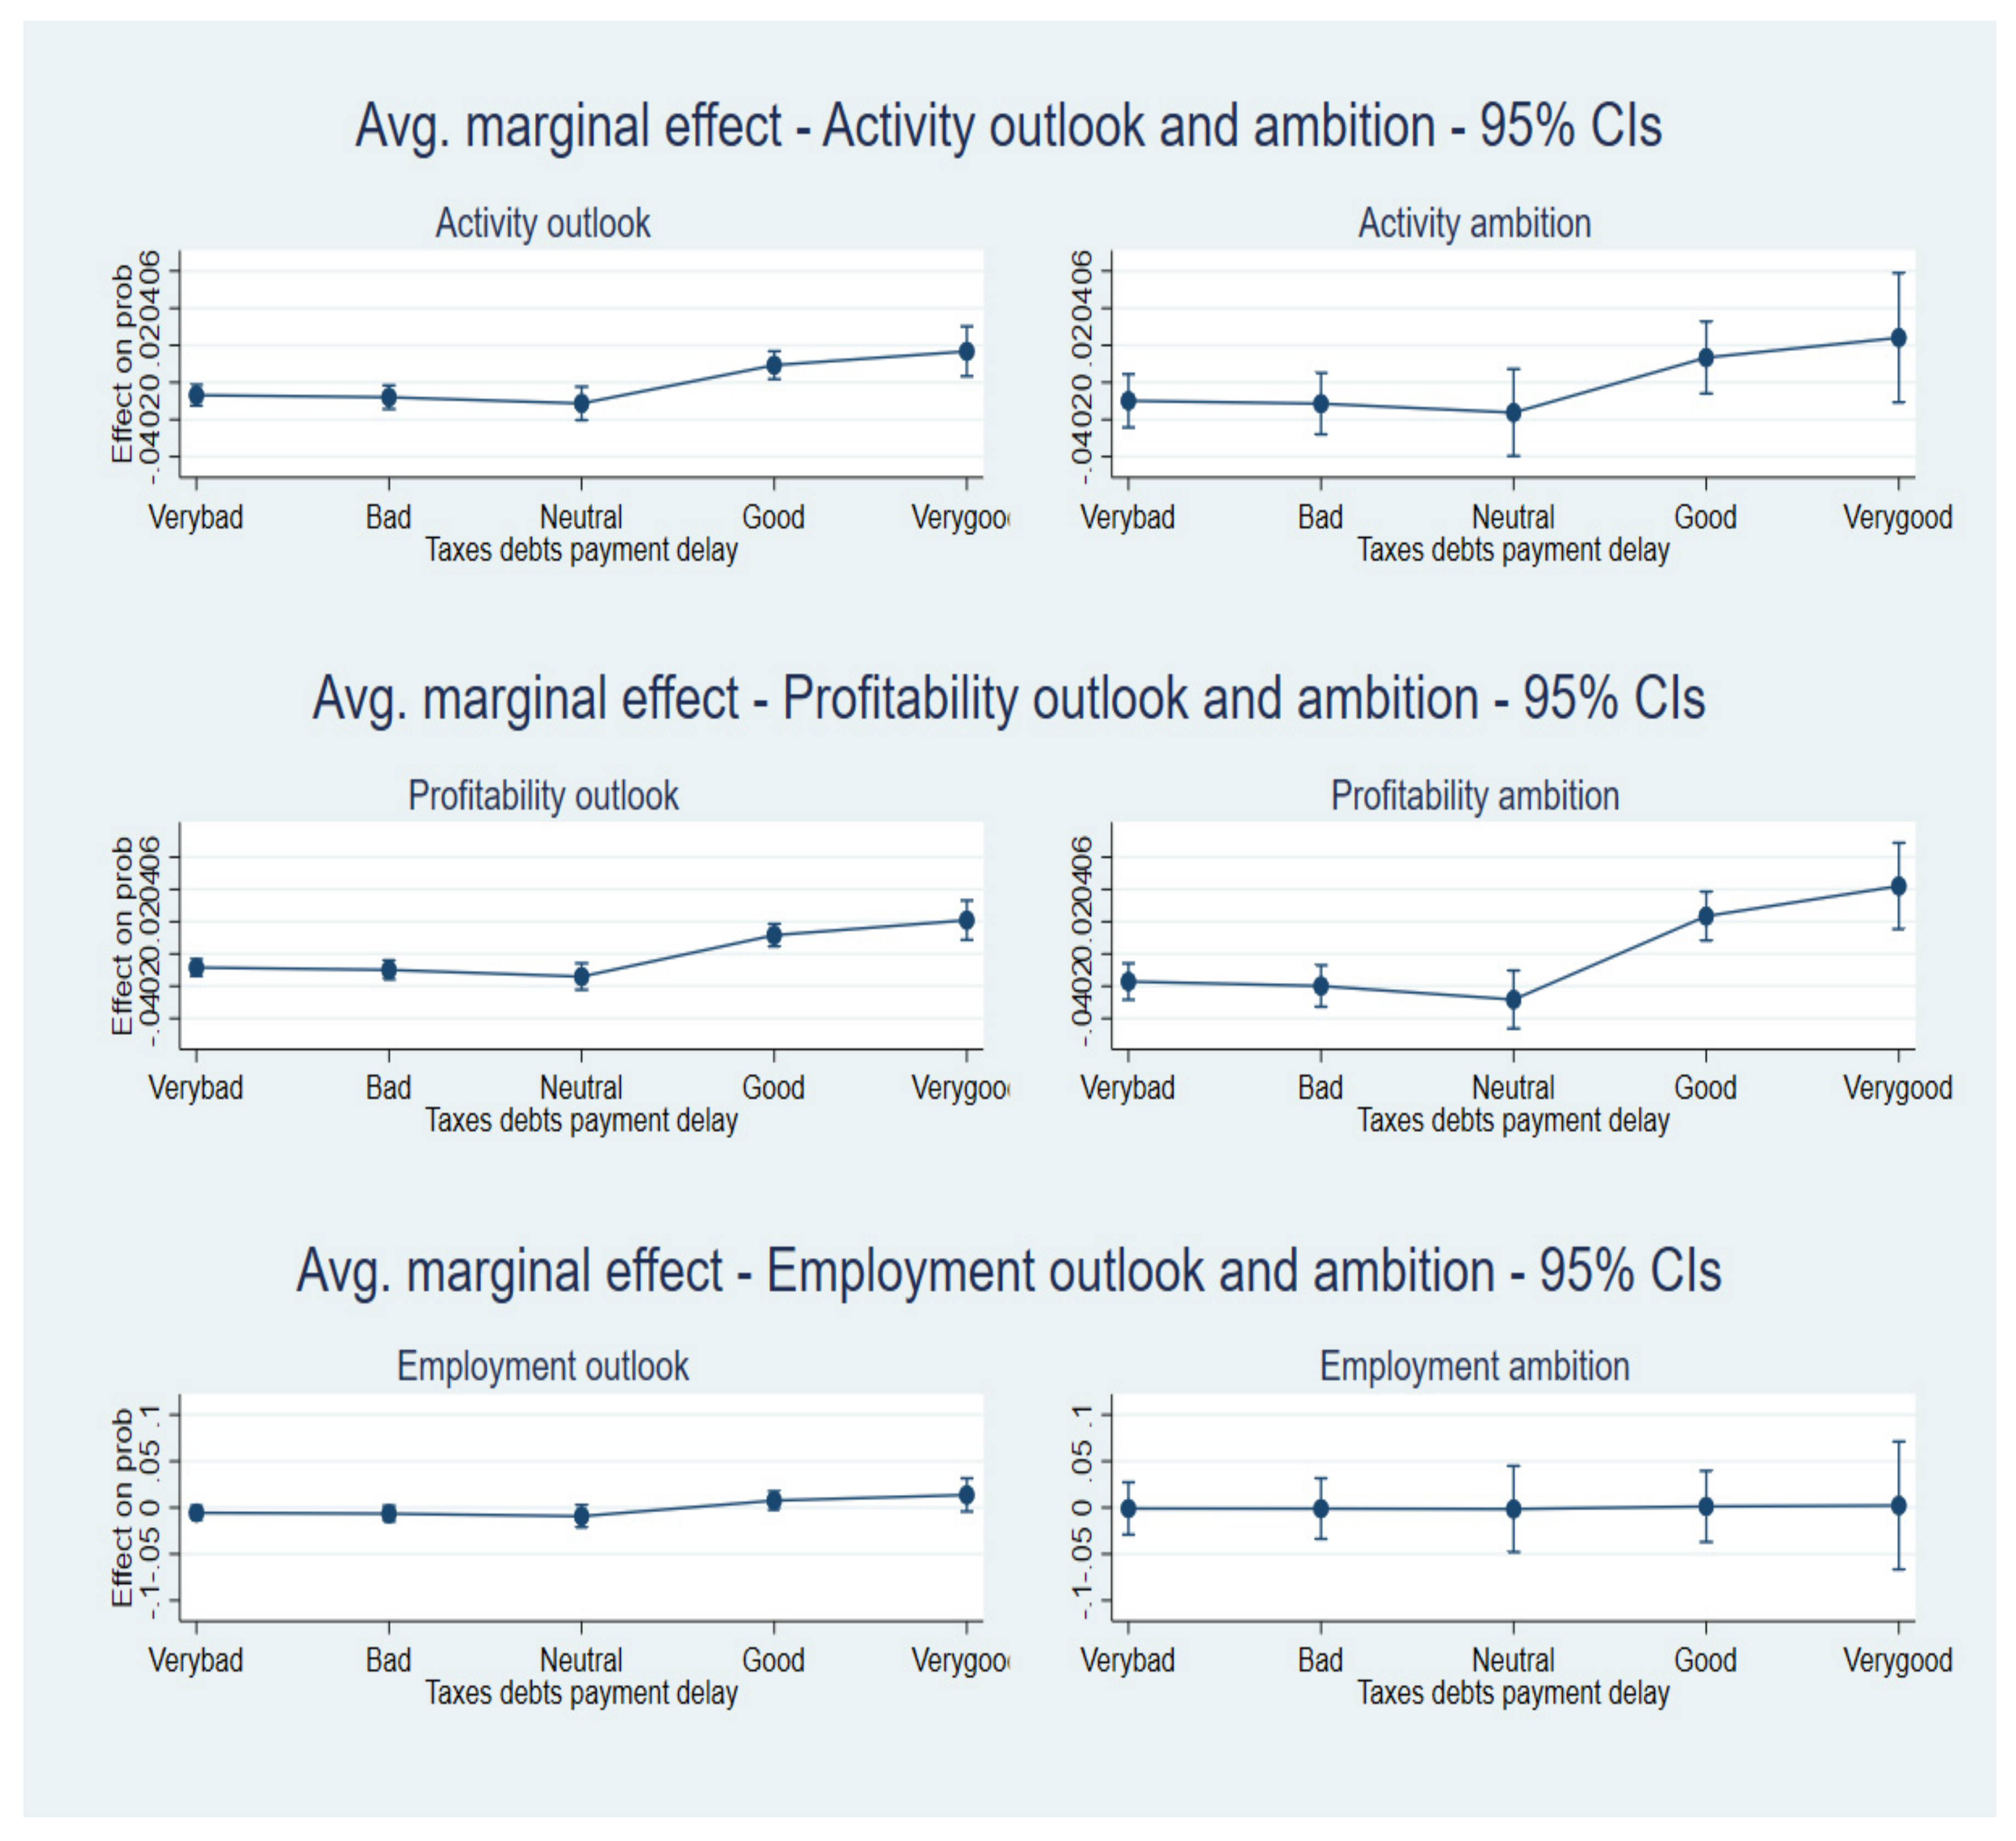
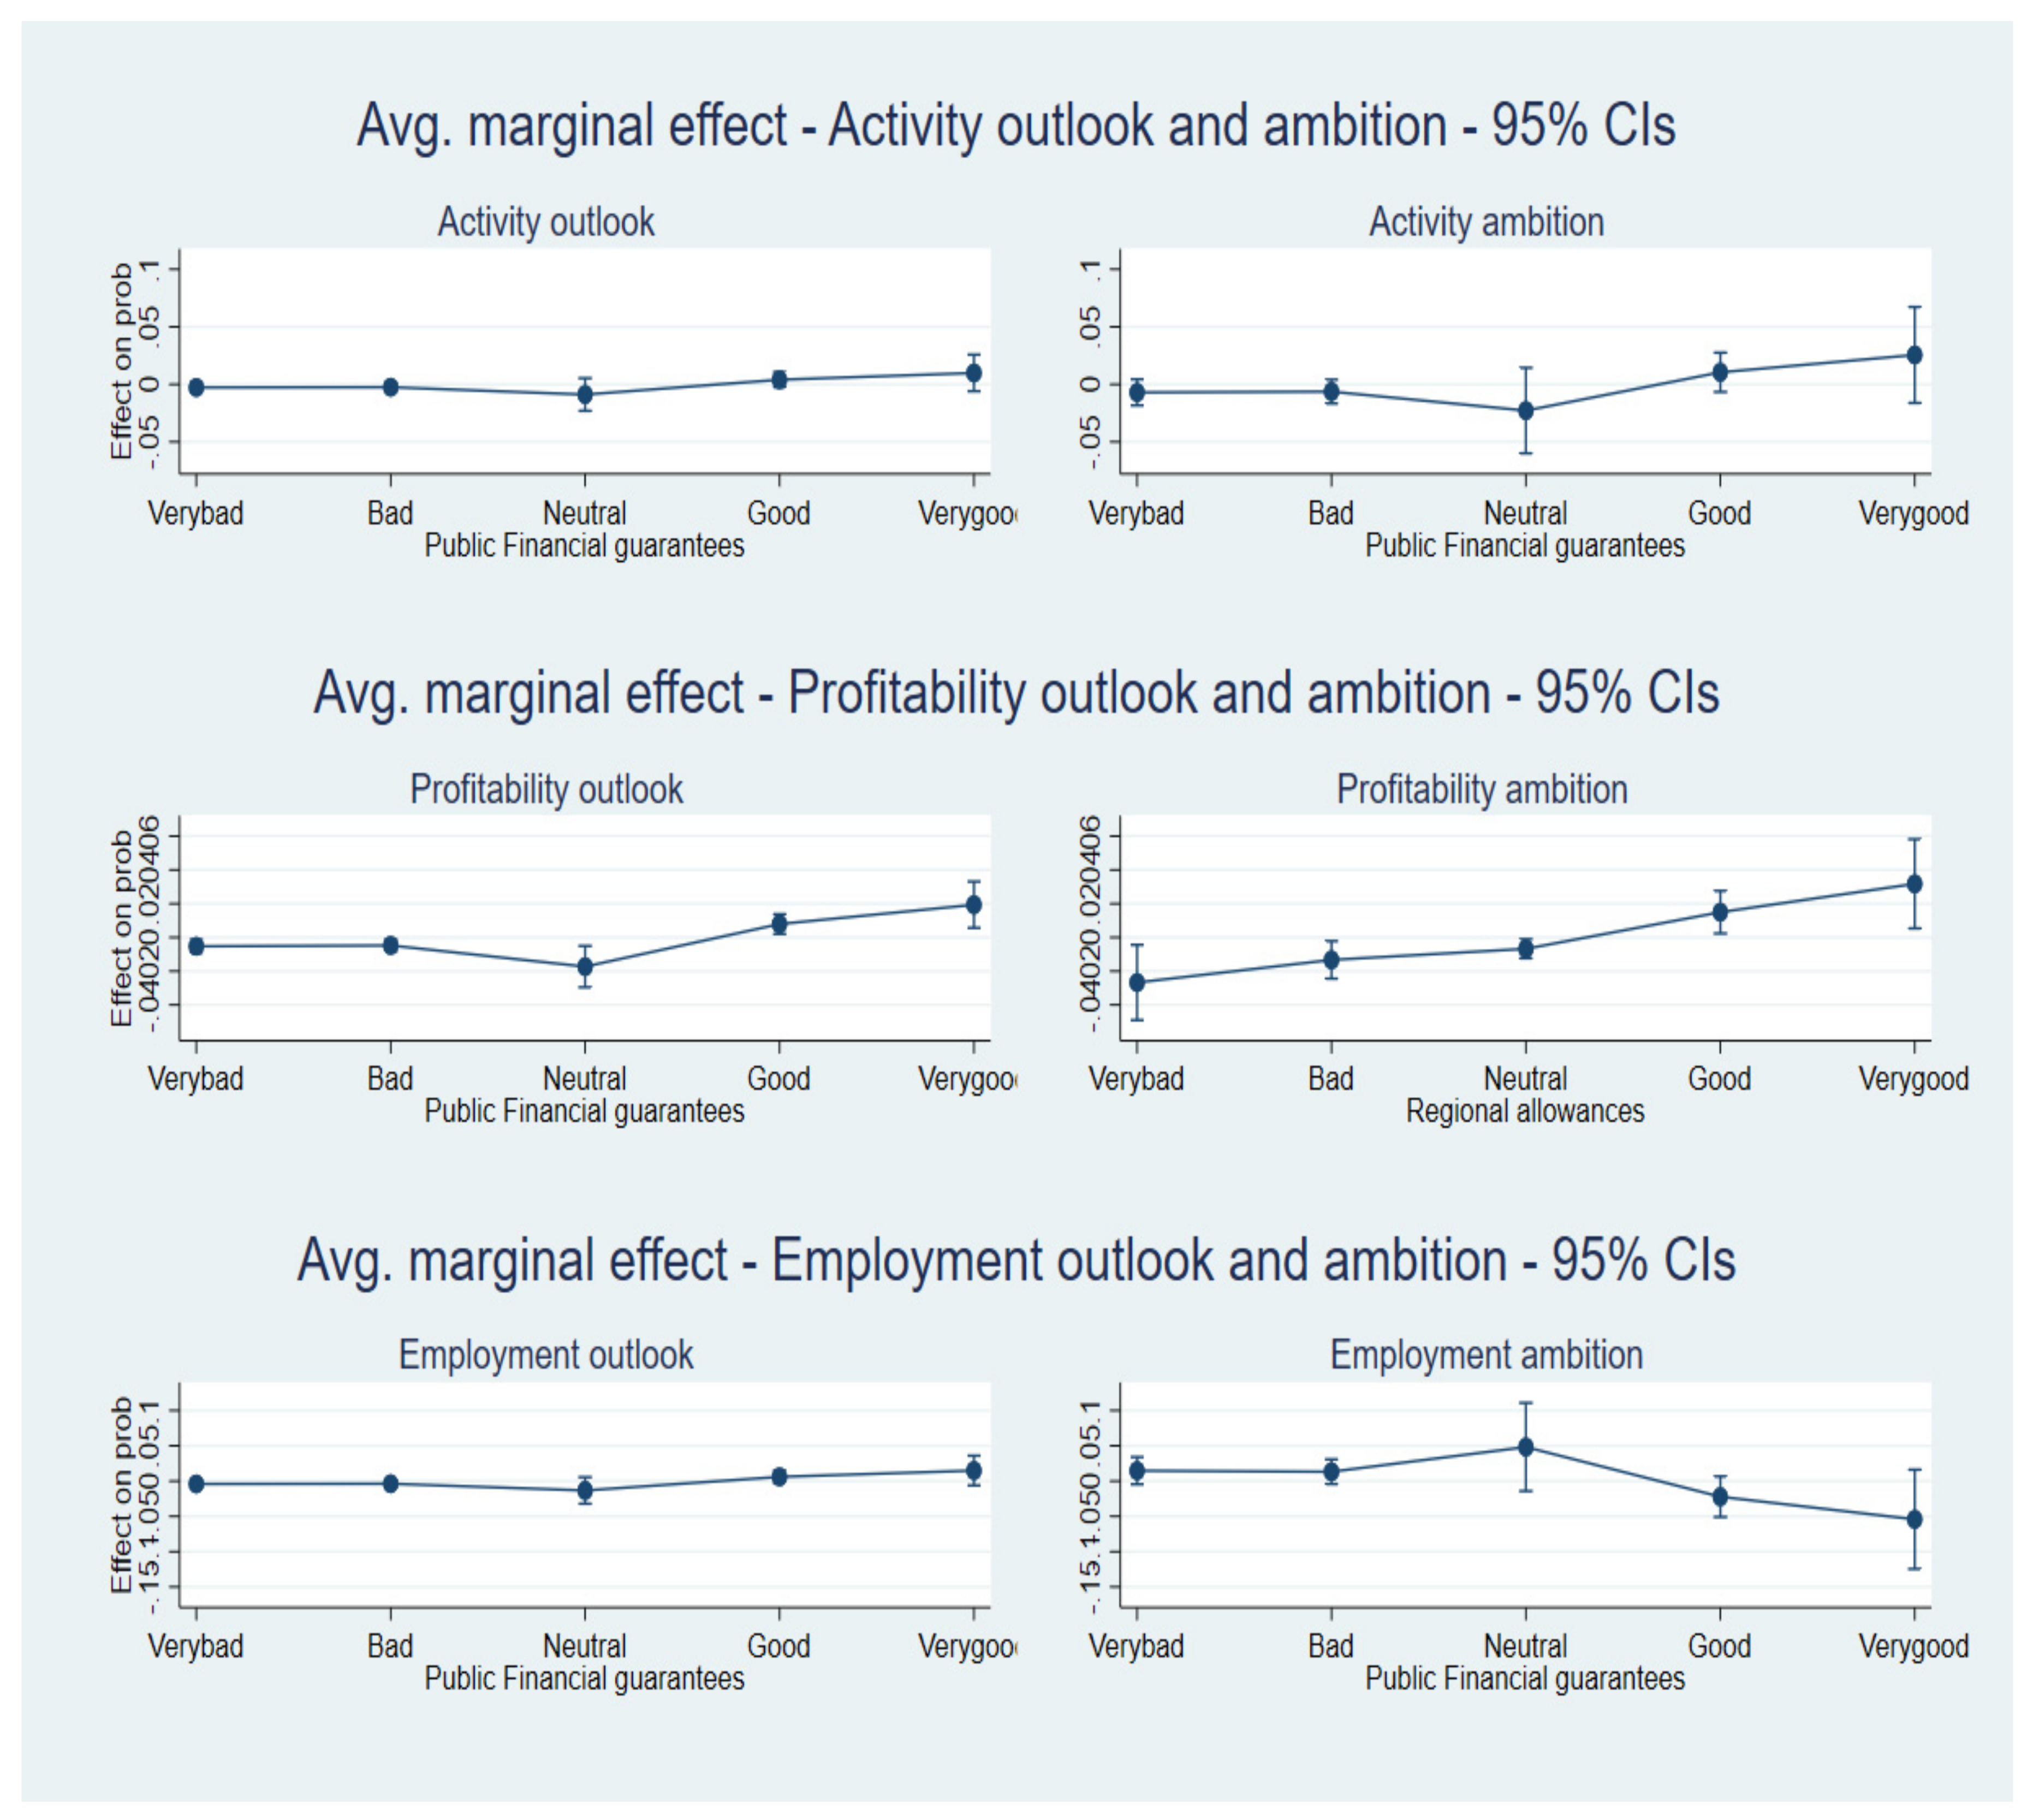
A priori, or from a theoretical viewpoint, we expect self-employed people and business-owners with employees with the most promising prospects/expectations to have a different opinion about policy measures than the others. Those measures transforming, or helping them to transform, these promising prospects into concrete activity and business results might be the most appreciated. (Growing) economic activity, measured by (increasing) turnover, entails (increasing) cash flow requirements. Any measure making it possible to alleviate cash flow requirements will be, a fortiori, welcome because, by freeing up financial resources, it makes it easier to be able to seize business opportunities that arise, even during this cloudy and uncertain period. In contrast, business owners with little or no favorable prospects would be inclined to consider policy measures allowing them to survive to be positive, waiting for better days.
In addition, a company that sees forthcoming business opportunities anticipates that it will need all possible resources, including its employees, to turn these opportunities into actual activities and profit. If the downturn in activity is perceived to be temporary, the company will tend to want to retain its staff. Thus, those policy measures that allow temporary unemployment while maintaining the contractual relationship between the employee and the company will be positively considered. Contrastingly, those policy measures are such that companies with little or no favorable prospects are less likely to appreciate them.

4. Empirical Analysis

4.1. Data

The data used come from an online survey sent to French-speaking self-employed and SMEs owners in Belgium. The link to the questionnaire, handled through the SurveyMonkey® platform, was incorporated into an email sent to more than 85,000 self-employed workers and owners of SMEs, all of whom are members of UCM, the largest French-speaking organization representing and defending self-employed workers.
The questionnaire consisted of four large blocks. The first block addressed recent developments in activity, profits, and employment, as well as their short-term prospects. Then, in the second block, respondents were asked about the impact and consequences of the COVID-19 pandemic on the organization of their company and the possible changes in strategy that could follow. At the time of the survey, initial policy responses designed to help entrepreneurs respond to COVID-19 were implemented by both federal and regional public authorities. At the same time, other measures were proposed by organizations and SME federations. We asked Walloon self-employed workers their opinion on the various measures decided and/or proposed. Questions related to the profile of the firm and the entrepreneur, which we use as control variables in our econometric models, were also included in the questionnaire.
More than 2700 responses were obtained, representing more than 3.0% of emails sent. As economic and social policy measures are taken both at the federal and regional levels and the heads of SMEs included in our listings are mainly located in Wallonia, a region fully covered by UCM, we dropped respondents living in Flanders or Brussels in order to focus on the Walloon region. The final sample on which our results are based comprised more than 2100 observations.

4.2. Variables and Descriptive Statistics

4.2.1. Dependent Variables

For this online survey, the main interest was to capture the rating of UCM’s affiliates about a list of independent economic policy measures taken in response to the COVID-19 pandemic (Table 1). The Likert scale is a suitable tool to quantify these subjective preferences, thinking, feeling, and action in a validated and reliable manner [35]. It is a set of statements describing a real or a hypothetical situation. Participants are asked to determine their level of agreement (e.g., from strongly disagree to strongly agree) and/or rating with a given statement. For the survey, we asked the business leaders responding to the questionnaire to assess and appreciate the different policy measures taken to support business activities. Their responses were collected according to whether they consider the policy implemented to be a very bad or a very good idea, on an increasing scale from 1 to 5.
More than three out of four (77.9%) respondents report obtaining at least one of the aids contained in the Belgian COVID-19 support package. This high take up rate is consistent with what happened in other countries. In the United States, Foroohar [36] highlights that an unprecedented 70% of small businesses were supported by public emergency relief measures in the first half of 2020.
Table 2 presents the breakdown of respondents, by percentage of the overall sample, according to their assessment of the various support measures. It emerges from Table 2 that the self-employed workers and the owners of Walloon SMEs had an overall positive assessment of the various economic and social policy measures decided upon and/or implemented by the Belgian authorities. Among the most popular measures, we cite the “bridge right”, which represents temporary unemployment benefits for self-employed workers and the extension of social benefits until 31 December 2020. More than 75% of the respondents stated that these were good and/or very good policies. Despite lower proportions, we see that, for all the other measures, more than 60% of the respondents have a positive assessment.

4.2.2. Independent Variables of Interest

As previously noted, one block of the questionnaire collects the perceptions of respondents regarding the evolution and the short-term prospects of their activities. Our variables of interest are based on responses relating to the expectations about business activities, profit, and employment (hereafter, Table 3). Using a five-point Likert scale, participants were asked to unveil their perception of their activity development, profits, and employment over the next few months. On this scale, the lowest score corresponds to a strong decrease and the highest to a strong increase. In each of our models, the first variable of interest corresponds to this data as they were collected, without any transformation.
At the time of the survey, the majority of Walloon self-employed workers believed that the prospect for activity was poor. Indeed, those who declared that the activity and, therefore, their turnover would fall and/or fall sharply, represent nearly three out of five (57.2%) respondents. On the other side, only 13.2% expected their activity to increase or strongly increase. The remaining 29.6% declared that the volume of activity of their company would be stable in the near future.
The expectations of SME owners in Wallonia were also pessimistic because more than half (52.9%) of those responding to our study foresaw a decrease or a strong decrease in their profits at that time. On the other hand, more than a quarter (25.4%) anticipated an increase or a strong increase. Profits would remain stable for more than one out of five respondents (21.7%).
Although weaker, employment prospects also look limited. In fact, only 3.6% of business owners surveyed planned to increase the number of persons with whom they were working. Knowing that employment often responds to cyclical shocks with a certain delay, 64.0% of respondents declared that their workforce would remain unchanged. However, nearly one out of three SME owners (32.4%) already anticipated a decline in employment in their firm, three months after the outbreak of the Coronavirus crisis.
To better discriminate between businesses whose owners report positive prospects from the others, we created binary variables. Thus, when the self-employed or SME owner declares that turnover, profits, or employment will increase or strongly increase, the concerned variable takes the value 1. For all other observations, it takes the value 0. These variables also allow for capturing the positive short-term expectation of the entrepreneur regarding activity, profits, and employment. We deduce that 13.2% of the entrepreneurs questioned have positive prospects concerning their activity. Similarly, 25.4% believe their profits will be greater in the short term, while 3.6% have positive employment prospects.
We realize that the most pessimistic business leaders were also those who have benefited the most from the support measures. Indeed, more than 82.0% of those who have decreasing or strongly decreasing prospects with respect to activity, profitability, or employment report having received one of the aids versus the overall take up rate of 77.9%.

4.2.3. Independent Control Variables

The control variables include profile elements of both the entrepreneur and the firm (hereafter, Table 4). The containment measures imposed to limit the spread of the Coronavirus pandemic resulted in the total or partial closure of some firms. Likewise, many self-employed workers were obliged to stop their activity. A question about the openness of the firm was included in the survey.
Table A1, Table A2, Table A3, Table A4, Table A5 and Table A6 (Appendix A) are cross tables of the main COVID-19 support measures with entrepreneur and company demographics. These tables report the relative frequency of each cell. The last column shows the distribution of the sample according to this set of demographic data related to the entrepreneur and the company.
With regard to the entrepreneur, the usual demographic data were collected, namely gender, age, and level of education. Our sample is representative of all self-employed workers in Wallonia according to gender and age criteria.
The sample comprises 61.6% men, implying that 38.4% are female. These proportions are close to those of the population of self-employed workers in Wallonia, where 63.2% are men and 36.8% are women.
The average age of our sample is the same as that of all self-employed workers in Wallonia, 47.5 years old, according to the National Social Insurance Institute for Self-Employed Workers (Inasti) in Belgium.
The respondents’ level of education is diverse and fairly well distributed. More than one out of four has a secondary education degree or less. The apprenticeship sector, which combines secondary school courses and practice, is represented by nearly 9.0%. Holders of a Bachelor’s degree are the most represented in our sample, accounting for 38.8% of respondents. Finally, 27.1% of them have a Master’s or a PhD.
The usual variables concerning the company were used: legal form, sector of activity or industry, lifetime, and size. In addition, we account for whether the company could continue its activity totally or partially.
Regarding legal form, we only consider two forms. On the one hand, sole proprietors or individual firms and, on the other hand, all the other forms, referred to as corporate firms. Sole proprietorship is the most represented in our sample, with a share of 54.0%. Companies with other legal corporate organization represent the remaining 46.0%.
In terms of sectors, the liberal professions have the greater representation. About 23.0% of the respondents are active in this sector. Non-food trade represents 15.1% of respondents. The construction sector and market services have similar weights, 12.1% and 11.7%, respectively. Hospitality is not very far behind at 9.8%. Art and culture (6.0%), manufacturing (4.5%), and food trade (4.3%) are less well represented. The other sectors not included elsewhere represent 13.5% of the sample. The latter are mainly non-market sectors.
Our sample is representative of firm sizes in Wallonia, where we essentially have very small firms. In this area, more than 80% of employers have fewer than four salaried workers. More than half (53.4%) of the respondents work alone, as solo self-employed. In addition, about one-third (32.4%) have fewer than five salaried workers. Business leaders with between five and nine employees comprise 6.8% of the sample. If we include companies with between 10 and 49 workers, this class represents 6.5% of our sample.
The different classes of businesses according to age are also fairly well distributed, with 17.4% of the companies in our sample being less than 3 years old. About ten percent (10.3%) are between 4 and 5 years old, while 14.3% are between 6 and 10 years old. The largest class is that of 11 to 20 years, comprising 21.7% of the sample. Those between 21 and 30 years old account for 16.4%; the remaining 20% have existed for more than 30 years.

4.3. Ordered Probit Model

4.3.1. Motivation and Justification

The natural candidate for modeling ordinal variables is the class of discrete and ordered multiple-choice models. For this, we rely on the ordered probit model.
In most applications, researchers opt for the ordered probit model when the dependent variable has multiple ordered categories. In this setting, a main hypothesis is the well-known parallel-lines assumption. When we have more than two categories, the ordered probit model becomes equivalent to a series of binary probit regressions where one category is contrasted with all the others [37]. The parallel-lines assumption simply states that the parameters of each variable included in the binary regressions are the same, which is for each category. An important limitation of the simple ordered model is that the parallel-lines hypothesis is often violated [37,38,39,40,41,42,43]. The solution to the parallel line problem is to estimate a generalized ordered probit model. In this case, we assume that the independent variables can have different coefficients for each value of the dependent variable. One disadvantage of the latter model is the high number of parameters, which makes estimation and interpretation of the model tedious. Brandt’s test results for parallel regression lines were contrasted in our empirical analysis. We decided not to investigate further on the issue.
It is mostly assumed that error variances are the same for all cases. Yatchew and Griliches [44] already note that, when a binary or ordinal regression model incorrectly assumes that error variances are the same for all cases, the standard errors are wrong and (unlike ordinary least squares (OLS)) the parameter estimates are biased [42,44]. We may also have good reasons to have an explicit specification of the determinants of heteroscedasticity. Indeed, there might be concerns about heterogeneity in the perception and/or assessment of individuals from different groups in different contexts.
In the context of our study, one might think that some entrepreneurs evaluate the supportive policies based not only on their intrinsic and/or demographic characteristics, but also on the situation of their business. Indeed, we are in the context of the COVID-19 pandemic. At the time of the survey, measures to restrict and reduce social contact in order to limit the spread of the virus were actively in place, the center of media attention. Some businesses were forced to completely stop their activities. Others remained partially opened. In addition, within the same sector, some companies may be totally opened, partially opened, or closed. It is legitimate to think that we can have some heterogeneity in the perception and evaluation of supportive measures given whether the company continues to operate or not. To resolve the problem of heterogeneity in the perception and/or evaluation depending on the case, a heterogeneous choice model might be a reasonable choice. This model provides us with a means for dealing with heteroscedasticity and the noises that it can cause to the parameter estimates.

4.3.2. Model Specification

Respondents to our study were asked to rate the different policies on the basis of a five-category Likert scale. For example, we have “very good” = 5, “good” = 4, “neutral” = 3, “bad” = 2, and “very bad” = 1 to assess the different policy measures on which they had to express opinions. In the case of ordered probit models, our dependent variable, which is the score obtained by the measure, denoted as y, is just a collapsed or limited version of a latent variable y* [42,45,46,47]. As respondents cross thresholds or cutpoints on y*, their observed values on y change. In our case, we have j = 1…5 values and we can write the following:
When j = 1, then - ∞ < y* < α1
For j ≥ 1, y = j if αj < y* < αj+1
The underlying y* can be written as follows:
  y i * = k x i k β k + u i
where x is the vector of k explanatory variables and βk is the coefficient attached to the kth variable xk. In the case of the probit model, ui is considered to follow a normal distribution with mean 0 and variance σ2.
In conventional ordinal probit models, the error term ui is assumed i.i.d. normal with unit variance for all observations, that is, σ2 = 1. In the heteroscedastic probit, the variance of the error term or its standard deviation σi is specified as a function of explanatory variables zm = (zi1, zi2, …, ziM) to reflect differences in residual variability. Modeling of heteroscedastic variance has both constructive and defensive uses. It is known that differences in variance between subjects or between groups in the population can cause biased coefficient estimates and can complicate the comparison of distinct groups. Thus, incorporating a model for variance can be necessary for proper inference, even if the variance function itself is not a topic of interest to the researcher [42,45,46,47]. Our variance equation includes sex; age; and the fact that the firm was closed, partially opened, or totally opened during the first lockdown. The variance equation is written as follows:
σ i = exp ( m = 1 M z i m γ m )
where z is a vector of M variables, which can be variables also included in x.
Pr y i = 1 = Pr ( y i * α 1 ) = Φ α 1 k x i k β k exp ( m = 1 M z i m γ m )
Pr ( y i = j ) =   Pr ( α j < y i * < α j + 1 ) = Pr ( α j < k x i k β k + u i < α j + 1 )
From Equation (4), we obtain the following:
Pr ( y i = j ) = Pr ( α j k x i k β k < u i < α j + 1 k x i k β k )
Pr ( y i = j ) = Φ α j + 1 k x i k β k exp ( m = 1 M z i m γ m ) Φ α j k x i k β k exp ( m = 1 M z i m γ m )
As we have a five-point Likert scale,
Pr ( y = 5 ) = Pr y i * > 5 = 1 Φ α 5 k x i k β k exp ( m = 1 M z i m γ m )
where Φ is the cumulative distribution function of the standard normal distribution. The model estimates the βk, γm, and αj together. The log likelihood function that is maximized is as follows:
l n L = i = 1 N j = 1 J I j y i l n Φ α j + 1 k x i k β k exp ( m = 1 M z i m γ m ) Φ α j k x i k β k exp ( m = 1 M z i m γ m )
With I j y i = 1   i f   y i = j 0   e l s e w h e r e .

4.3.3. Statistical Checks

In the results of the regressions presented, the tests relating to the constants, or to the thresholds between the different levels, are tests of comparison with respect to zero. However, our interest is to know if these thresholds are different and, therefore, allow us to keep all our ordered categories. The null hypothesis here is that the constants are equal to each other. This hypothesis is rejected in all our formulations confirming that our five categories are all relevant.

4.4. Results

Before starting the analysis of our regressions, it should be reminded that the entrepreneurs who responded to our study have an overall positive assessment of the various support policy measures decided by the Belgian governments as part of the response to the Coronavirus crisis (see Table 2). However, when we condition these evaluations on the short-term prospects of the firm, we observe some surprising and interesting differences between optimistic and/or ambitious firm owners and the others.
Table 5 summarizes the results of our regressions. In line with Section 2, support policy measures are assembled in three groups: employment and social policy measures, financial policy measures, and tax and fiscal policy measures. Positive or negative signs indicate the direction of the effects for each of the support policy measures considered. The synthetic results appearing in Table 5 are commented on below. For the detailed results of the different estimated models, please consider Table A7, Table A8, Table A9, Table A10, Table A11, Table A12, Table A13, Table A14, Table A15, Table A16 and Table A17 in Appendix B.

4.4.1. Employment and Social Policy Measures

When we keep the prospect variables (in terms of business activities, profit, and employment) in their original form, i.e., as measured by Likert scale, none are significant in explaining the SME owners’ rating of employment and social policy measures. Using the dummy transformation (binary), we find that entrepreneurs with the most positive expectations in terms of activity are more likely to give lower scores in the rating of the policy (at 10%). Having positive activity prospects reduces the rating of the policy decision to allocate temporary unemployment benefits to salary workers. A priori, good profit prospects are likely to increase the rating of the temporary unemployment measure, but we may observe that the coefficients attached to the profitability prospects are not significant (consider Appendix B, Table A7, for detailed results). Concerning short-term employment expectations, evaluation scores of employers with positive employment prospects are significantly lower. The results for entrepreneurs with positive prospects in terms of turnover and employment make sense. Indeed, workers who benefit from temporary unemployment benefits owing to the crisis cannot work. However, in the case of positive sales prospects, business leaders need their entire workforce and they are less likely to perceive interest in the policy measure. Panels of Figure A1 in Appendix B show that the significant differences in the appreciation are observable between the highest scores (good (4) and very good (5)).
When we consider the results for the question of whether self-employed and business owners participating in the survey were ready to support measures for employees and the self-employed forced to stop their activities to be extended through 31 December 2020 (Appendix B, Table A8), we have similar findings to what was obtained for temporary unemployment benefits. Furthermore, the coefficients are more significant, meaning stronger negative associations, between business activity prospects, employment prospects, and the extension of these measures through the end of 2020.
As previously mentioned, the significant difference between SMEs with positive prospects and the others arise when we move in the highest scores (Appendix B, Figure A2).
Regarding the self-employed, which include all heads of SMEs with or without salary workers, they have a positive assessment of the “bridge right” (DROIPAS). This rating increases when short-term profitability expectations are high. Whatever the considered expectation (activity, profit, and employment), when they are measured according to the Likert scale, we observe that, the higher we go up the scale, the more likely the respondent will have a positive evaluation score (consider Appendix B, Table A9, for detailed results).
However, when using the dummy (binary) approach that discriminates business leaders with the best prospects against the others, the results are mixed. Only profitability prospects are positively and significantly related to the evaluation of the bridge right. The coefficient attached to the short-term expectations in terms of business activity is positive, but not significant. In contrast, entrepreneurs with the most positive employment expectations may have lower scores in the assessment of this policy. However, this last relationship is not significant.

4.4.2. Financial Policy Measures

The higher the profitability prospect, the better the rating by our respondents concerning the credit repayment facilities according to entrepreneurs (Appendix B, Table A10). These payment facilities allow them to spread loan repayments, thus reducing pressure on their treasury. It is a boon for companies with short-term profit expectations. Indeed, they can reinvest the amounts not disbursed, thus increasing their leverage.
The guarantee of public institutions allows entrepreneurs to obtain loans on favorable terms without guarantees and/or pledging of their assets. The results (see Appendix B, Table A16, for details) are similar to those concerning receiving money that will be invested to obtain a higher expected short-term return.
However, when we discriminate those with higher positive prospects from others, SME owners with positive prospects for profit have a better rating of regional aid than others, unlike the positive prospects for activity and employment, which have no influence on the measure’s assessment. The marginal effects also highlight the fact that the ratings of entrepreneurs with higher profitability prospects are higher than those of the others in the transition to the highest scores.
As mentioned in Section 2.2, the Walloon region paid the self-employed and owners of SMEs active on its territory lump sums to relieve their cash flow and preserve (part) of their purchasing power. If we look at the variables relating to short-term prospects in their initial form, the better the prospect, the more companies have a positive assessment of regional aid. The heads of SMEs generally appreciate the regional flat-rate allowances (Appendix B, Table A11). Those with positive profit prospects are more likely to appreciate more, as they receive money that they can use to increase their leverage, as with credit repayment facilities.

4.4.3. Tax and Fiscal Policy Measures

By allowing companies to defer the payment of their social contributions, it is possible for them to alleviate the impact of the shock of the pandemic on their payroll costs. All variables relating to company prospects, in terms of business activities, profits, and employment, have a positive sign. Thus, the self-employed and employers have a positive assessment of the postponement of the payment of social security contributions. The higher the score relating to their expectations in terms of activity, profit, and employment, the more likely they are to have a positive assessment of this measure (Appendix B, Table A12).
However, the dummy that discriminates against entrepreneurs with positive or very positive employment prospects shows no effect on the rating of this measure. This last result can be explained by the fact that SME owners who have stronger positive employment prospects are indifferent about this type of policy.
Self-employed and SME owners in Wallonia, with positive prospects regarding business activity and profitability, positively appreciate the postponement of tax declarations (Appendix B, Table A13). That is similar to the reduction in administrative constraints during the crisis, which might allow them to focus on running their businesses.
The deferral of payment of tax debts produces a similar result to that of credit repayment facilities and loan guarantees granted by public financial institutions (Appendix B, Table A14).
The deferral of the payment of taxes can also be considered as an inflow of money. Entrepreneurs with a positive prospect about their business activity and profit can use these unpaid sums to increase profit leverage. The exoneration of taxes and social security contributions on compensation fees to be paid to dismissed workers is less rated by entrepreneurs with higher employment prospects. Indeed, they may not be concerned with the dismissal of their workers (see Appendix B, Table A15 and Table A17).

4.5. Being Cautious and Taking Stock

The policy measures examined herein were taken in response to the emergency and have already produced results. We recognize that much has already changed regarding policies to support businesses and the self-employed under COVID-19 since the time of the survey in May 2020. While some are still applicable, as of September 2021, with extensions implemented, others were modified or stopped. However, an economic and social bloodbath remains possible [48]. All companies, not just the weakest, risk closure. Businesses still face great uncertainty and a downturn in activity. However, “in the absence of ultimate market scrutiny, the presence of moral hazard and the risk of politicization, the focus here should be to set terms that create strong incentives for both companies and governments to exit the temporary arrangements as recovery picks up” (p. 2, [4]).
For the design and implementation of future support plans, at least two prerequisites are to be considered. First, it is critical to listen to business leaders and/or their representatives before and/or during the implementation of the measures. This helps to know if the solutions proposed fit the actual problems encountered. Second, measures would be designed to target companies with the best prospects, for which the impact of recovery plans are expected to be the greatest [49,50]. These firms are likely to quickly transform their expectations into activities, profits, and, if possible, increase employment, thus benefiting society as a whole.

5. Conclusions

Several policy measures, of different types, were designed and rapidly implemented to limit the damages caused by the adverse sanitary and economic shocks provoked by the COVID-19 pandemic. Among these, a set of measures were defined and implemented to support the self-employed and firms along with their business activity. In this article, we examine these measures through the eyes of business owners, both self-employed and SME owners/employers. We try to do this by crossing their opinion with their short-term development prospects. In so doing, we obtain information about the policy measures, allowing us to distinguish which are aligned with self-declared organizational positive orientation. In a complementary way, we also obtain information about the policy measures that were most appreciated by small firms with less favorable prospects.
The study was made possible by the provision of an original and rich dataset derived from a survey conducted in May 2020 of a representative sample of more than 2100 Belgian (Walloon) SMEs. The Belgian situation is interesting because of the wide variety of measures taken by Belgian public authorities that were analogous to several measures taken by other OECD countries. This is likely to increase the relevance of the results.
The main independent variables are the expected short-run evolution of business activity, profits, and employment, each included separately. The business owners with the most favorable expectations, at that time, are also subject to specific analysis. Control variables include size, age, and legal form of the firm; level of education of the business owner; industry; as well as whether the firm was active, partially shut down, or totally locked down.
Our results suggest that the respondents had an overall positive evaluation of the various economic and social policy measures implemented by the Belgian authorities. Additionally, the assessment of SME owners with the most favorable short-term expectations were significantly different (higher or lower). In particular, respondents with the most positive prospects in terms of activity/turnover and profit were also those who most appreciated the financial and fiscal support measures. Measures helping the firm to maintain its workforce under contract were particularly highly rated. It also appears that the firms with the best prospects did not want some measures to be maintained for too long. To transform quickly favorable expectations into results, the firm must be able to quickly rely on its workforce. Additionally, policy measures to provide more loans and higher guarantees from public financial institutions were also appreciated, although less clearly.
Our contribution modestly sheds some light on those political measures, appearing best able to safeguard entrepreneurial activities during the early stage of a sudden economic and financial collapse. Moreover, the support of entrepreneurs who expect their activities to be resilient may have a higher collective return. However, the question is far from being fully answered, with further research needed to assess the quality of self-declared expectations in highly uncertain time and to identify the set of elements inside the firm and those related to entrepreneurial ecosystems [51], promoting resilience and ambition.

Author Contributions

Both authors contributed to conception, analysis, interpretation, and writing. C.T. conducted the survey data collection. All authors have read and agreed to the published version of the manuscript.

Funding

The APC was funded by DeFiPP/CERPE.

Institutional Review Board Statement

Not applicable.

Informed Consent Statement

Not applicable.

Data Availability Statement

The data are not publicly available due to privacy restrictions.

Conflicts of Interest

The authors declare no conflict of interest.

Appendix A. Some Descriptive Statistics

Table A1. Independent variables and temporary unemployment benefits.
Appreciation of Temporary Unemployment Benefits
PERSACTVery BadBadNeutralGoodVery GoodTotal
Strongly decrease1.771.103.534.422.9613.78
Decrease2.524.209.7215.8611.1743.46
Neutral1.022.125.7913.477.2029.59
Increase0.270.882.394.992.3410.87
Strongly increase0.090.270.350.840.752.30
Total5.658.5721.7839.5824.43100.00
PERSRENTVery badBadNeutralGoodVery goodTotal
Strongly decrease1.811.283.534.333.0914.05
Decrease2.253.628.2614.6610.0338.83
Neutral0.711.634.649.814.9021.69
Increase0.841.995.2110.696.2725.00
Strongly increase0.040.040.130.090.130.44
Total5.658.5721.7839.5824.43100.00
PERSEMPLVery badBadNeutralGoodVery goodTotal
Strongly decrease2.081.592.923.532.1212.23
Decrease0.841.773.147.167.2420.14
Neutral2.564.8114.9327.5614.1864.05
Increase0.180.400.801.330.753.45
Strongly increase0.000.000.000.000.130.13
Total5.658.5721.7839.5824.43100.00
EDUCATIONVery badBadNeutralGoodVery goodTotal
Primary0.130.130.180.130.180.75
Secondary1.952.395.949.454.7924.52
Apprenticeship0.490.892.313.281.958.91
Bachelor2.003.507.1816.109.9838.76
Master0.981.515.599.056.9224.04
PhD0.090.180.581.550.623.02
Total5.638.6021.7739.5624.43100.00
Very badBadNeutralGoodVery goodTotal
Male3.735.1512.6924.0116.0261.61
Female1.913.429.0515.498.5238.39
Total5.648.5721.7539.5024.55100.00
OpennessVery badBadNeutralGoodVery goodTotal
Closed2.132.405.246.224.3620.36
Part. Open1.873.428.8418.049.9642.13
Opened1.642.807.5615.4210.0937.51
Total5.648.6221.6439.6924.40100.00
SIZEVery badBadNeutralGoodVery goodTotal
SOLO4.025.2114.9722.316.8553.36
1–4 workers1.282.695.2612.5410.6432.42
5–9 workers0.130.270.802.782.836.80
10–19 workers0.130.270.310.972.163.84
20–49 workers0.090.130.310.531.552.61
50 workers and more0.000.000.130.440.400.97
Total5.658.5721.7839.5824.43100.00
LIFETIMEVery badBadNeutralGoodVery goodTotal
Less than 1 Y0.350.271.551.060.273.50
1–3 Y1.371.683.365.352.1713.94
4–5 Y0.621.372.834.161.2810.27
6–10 Y0.751.642.925.753.1914.25
11–20 Y0.841.504.259.165.9321.68
21–30 Y0.750.883.326.774.6516.37
More than 30 Y0.971.193.547.306.9920.00
Total5.668.5421.7739.5624.47100.00
LEGALVery badBadNeutralGoodVery goodTotal
Individual3.585.8315.1920.728.7054.02
Corporate2.082.746.5818.8615.7245.98
Total5.658.5721.7839.5824.43100.00
SECTORVery badBadNeutralGoodVery goodTotal
Art. and Cult.0.290.531.292.301.636.03
Hospitality1.151.292.113.112.159.81
Lib. Prof.1.001.875.7410.533.8322.97
Food Trade0.290.101.051.341.534.31
Non-food Trade0.911.242.445.604.8815.07
Services M.0.190.911.915.173.5411.72
Construction0.961.152.584.882.5812.15
Industry0.190.290.721.671.584.45
Other sectors0.671.243.255.502.8213.49
Total5.658.6121.1040.1024.55100.00
Table A2. Independent variables and deferral of social security contributions.
Appreciation of Deferral of Social Security Contributions
PERSACTVery BadBadNeutralGoodVery GoodTotal
Strongly decrease1.831.833.384.772.3114.12
Decrease4.025.4912.7615.276.2843.82
Neutral1.992.949.1511.214.1029.38
Increase0.480.952.784.331.9110.46
Strongly increase0.240.080.481.030.402.23
Total8.5511.2928.5536.6214.99100.00
PERSRENTVery badBadNeutralGoodVery goodTotal
Strongly decrease2.111.633.984.492.4714.67
Decrease3.465.0111.2114.005.0538.73
Neutral1.351.876.687.993.3421.23
Increase1.552.786.649.824.1024.89
Strongly increase0.080.000.040.320.040.48
Total8.5511.2928.5536.6214.99100.00
PERSEMPLVery badBadNeutralGoodVery goodTotal
Strongly decrease2.031.553.543.221.5511.89
Decrease1.471.915.966.882.8619.09
Neutral4.777.5518.1724.9710.1465.61
Increase0.240.280.801.510.443.26
Strongly increase0.040.000.080.040.000.16
Total8.5511.2928.5536.6214.99100.00
EDUCATIONVery badBadNeutralGoodVery goodTotal
Primary0.120.080.320.120.080.72
Secondary3.122.847.358.112.9224.32
Apprenticeship0.761.443.082.680.888.83
Bachelor2.844.1110.1814.866.6338.62
Master1.602.686.399.664.0324.36
PhD0.120.201.121.200.523.15
Total8.5511.3428.4336.6215.06100.00
SEXVery badBadNeutralGoodVery goodTotal
Male5.556.5917.2622.259.5561.21
Female2.964.6311.3114.385.5138.79
Total8.5111.2328.5736.6415.06100.00
OpennessVery badBadNeutralGoodVery goodTotal
Closed2.282.565.966.813.6421.26
Part. Open2.924.7612.0516.975.3242.03
Open3.324.0410.4512.856.0436.71
Total8.5311.3728.4636.6315.01100.00
SIZEVery badBadNeutralGoodVery goodTotal
SOLO5.136.7216.6221.437.8357.73
1–4 workers2.743.468.3510.704.4529.70
5–9 workers0.320.681.752.031.236.00
10–19 workers0.160.281.071.150.763.42
20–49 workers0.160.120.440.990.602.31
50 workers and more0.040.040.320.320.120.83
Total8.5511.2928.5536.6214.99100.00
LIFETIMEVery badBadNeutralGoodVery goodTotal
Less than 1 Y0.320.481.001.190.523.50
1–3 Y1.711.914.145.301.3914.46
4–5 Y0.961.912.833.581.1510.43
11–20 Y1.872.196.098.083.1121.35
21–30 Y1.151.434.786.332.4316.13
6–10 Y1.272.154.025.221.9914.66
More than 30 Y1.271.235.626.934.4219.47
Total8.5611.3128.4736.6415.01100.00
Very badBadNeutralGoodVery goodTotal
Individual4.976.8816.7820.487.2056.30
Corporate3.584.4111.7716.147.7943.70
Total8.5511.2928.5536.6214.99100.00
SECTORVery badBadNeutralGoodVery goodTotal
Art. and Cult.0.430.521.342.841.216.33
Hospitality1.461.082.673.101.299.61
Lib. Prof.1.462.807.809.263.0624.39
Food Trade0.520.431.381.380.654.35
Non-food Trade1.381.723.755.172.5914.61
Services M.0.731.082.844.742.1511.55
Construction1.211.513.454.091.3411.59
Industry0.390.260.991.770.784.18
Other Sectors1.081.944.054.441.9013.40
Total8.6611.3328.2636.7914.95100.00
Table A3. Independent variables and unemployment benefits for self-employed.
Appreciation of Unemployment Bene
Fits for Self-Employed
PERSACTVery BadBadNeutralGoodVery GoodTotal
Strongly decrease1.451.102.045.134.1113.82
Decrease2.432.985.0920.1613.4344.09
Neutral1.721.643.2912.929.7929.37
Increase0.470.821.104.783.4110.57
Strongly increase0.200.230.120.780.822.15
Total6.266.7711.6343.7731.56100.00
PERSRENTVery badBadNeutralGoodVery goodTotal
Strongly decrease1.251.142.045.564.5014.49
Decrease2.663.134.1915.9412.6538.57
Neutral1.410.942.5810.066.1521.14
Increase0.861.572.8212.107.9925.33
Strongly increase0.080.000.000.120.270.47
Total6.266.7711.6343.7731.56100.00
PERSEMPLVery badBadNeutralGoodVery goodTotal
Strongly decrease1.680.941.494.543.2511.90
Decrease0.941.102.198.815.7618.79
Neutral3.524.587.3228.9721.7366.13
Increase0.080.160.631.450.703.01
Strongly increase0.040.000.000.000.120.16
Total6.266.7711.6343.7731.56100.00
EDUCATIONVery badBadNeutralGoodVery goodTotal
Primary0.040.000.240.280.200.75
Secondary1.851.573.5810.896.6124.50
Apprenticeship0.630.391.064.092.718.89
Bachelor2.523.073.7016.6312.3938.30
Master1.021.612.7510.468.7324.58
PhD0.200.120.311.420.942.99
Total6.256.7611.6443.7731.58100.00
SEXVery badBadNeutralGoodVery goodTotal
Male3.934.377.6726.0019.0461.01
Female2.322.363.8917.7812.6338.99
Total6.256.7311.5743.7831.67100.00
OpennessVery badBadNeutralGoodVery goodTotal
Closed2.091.582.658.656.2821.24
Part. Open2.132.654.5418.9913.9442.24
Opened2.052.574.4616.1111.3336.52
Total6.286.7911.6543.7431.54100.00
SIZEVery badBadNeutralGoodVery goodTotal
SOLO4.193.887.0125.3318.5258.93
1–4 workers1.612.153.0513.009.5529.37
5–9 workers0.120.350.782.661.685.60
10–19 workers0.230.230.271.530.943.21
20–49 workers0.080.120.310.900.702.11
50 workers and more0.040.040.200.350.160.78
Total6.266.7711.6343.7731.56100.00
LIFETIMEVery badBadNeutralGoodVery goodTotal
1–3 Y1.291.331.696.393.7714.48
11–20 Y0.941.061.889.617.4520.95
21–30 Y1.220.901.886.715.3716.08
4–5 Y0.591.061.614.712.8610.83
6–10 Y0.820.982.006.674.3914.87
Less than 1 Y0.350.200.551.371.063.53
More than 30 Y1.061.262.008.326.6319.26
Total6.286.7911.6143.7831.54100.00
LEGALVery badBadNeutralGoodVery goodTotal
Individual4.274.037.1325.3716.4157.20
Corporate2.002.744.5018.4015.1542.80
Total6.266.7711.6343.7731.56100.00
SECTORVery badBadNeutralGoodVery goodTotal
Art. and Cult.0.420.420.472.552.386.24
Hospitality0.680.811.614.202.299.59
Lib. Prof.1.021.572.8411.547.7224.69
Food Trade0.340.420.592.040.984.37
Non-food Trade0.811.021.445.985.6014.85
Services M.0.470.471.104.924.4511.41
Construction0.850.931.704.923.4411.84
Industry0.340.340.381.951.154.16
Other Sectors1.190.981.485.223.9912.86
Total6.116.9611.6243.3231.99100.00
Table A4. Independent variables and unemployment benefits for self-employed.
Appreciation of Regional Support (Allowances)
PERSACTVERY BADBadNeutralGoodVery GoodTotal
Strongly decrease3.482.142.103.362.5513.64
Decrease6.076.927.4117.166.8844.44
Neutral3.403.485.0210.976.3129.18
Increase1.341.251.704.252.0210.56
Strongly increase0.400.240.320.730.492.19
Total14.6914.0416.5536.4618.25100.00
PERSRENTVery badBadNeutralGoodVery goodTotal
Strongly decrease3.282.232.513.932.2714.20
Decrease5.915.956.6013.407.2039.05
Neutral2.552.593.448.583.8421.00
Increase2.833.203.9710.484.8225.29
Strongly increase0.120.080.040.080.120.45
Total14.6914.0416.5536.4618.25100.00
PERSEMPLVery badBadNeutralGoodVery goodTotal
Strongly decrease3.441.862.022.951.5411.82
Decrease2.992.873.206.883.1219.06
Neutral7.778.9410.8525.3313.0365.92
Increase0.450.360.491.250.533.08
Strongly increase0.040.000.000.040.040.12
Total14.6914.0416.5536.4618.25100.00
EDUCATIONVery badBadNeutralGoodVery goodTotal
Primary0.120.160.160.160.080.69
Secondary4.433.134.478.333.7424.11
Apprenticeship1.221.021.593.501.598.90
Bachelor5.496.506.0213.627.0738.70
Master2.972.894.119.395.2424.59
PhD0.450.370.281.380.533.01
Total14.6714.0716.6336.3818.25100.00
SEXVery badBadNeutralGoodVery goodTotal
Male9.929.1910.1321.5110.5361.29
Female4.764.806.4314.927.8138.71
Total14.6813.9916.5536.4418.34100.00
OpennessVery badBadNeutralGoodVery goodTotal
Closed4.523.343.506.523.5021.39
Part. Open5.755.836.8916.017.5041.97
Opened4.364.856.1914.067.1736.63
Total14.6314.0216.5936.5918.17100.00
SIZEVery badBadNeutralGoodVery goodTotal
SOLO7.977.738.9822.3411.0958.11
1–4 workers4.374.655.1410.125.3429.62
5–9 workers0.970.771.051.981.015.79
10–19 workers0.930.400.530.930.533.32
20–49 workers0.320.360.530.810.242.27
50 workers and more0.120.120.320.280.040.89
Total14.6914.0416.5536.4618.25100.00
LIFETIMEVery badBadNeutralGoodVery goodTotal
1–3 Y2.271.862.275.392.9214.71
11–20 Y3.242.763.407.014.1820.59
21–30 Y2.552.433.125.632.5116.25
4–5 Y1.581.701.953.811.5410.58
6–10 Y1.951.952.395.962.4714.71
Less than 1 Y0.650.450.611.380.533.61
More than 30 Y2.472.882.807.264.1319.54
Total14.7114.0316.5436.4418.28100.00
LEGALVery badBadNeutralGoodVery goodTotal
Individual7.377.7710.3620.4810.2856.25
Corporate7.326.276.1915.997.9743.75
Total14.6914.0416.5536.4618.25100.00
SECTORVery badBadNeutralGoodVery goodTotal
Art. and Cult.0.831.010.702.501.416.46
Hospitality2.241.851.632.941.199.84
Lib. Prof.3.383.603.919.363.7824.03
Food Trade1.010.830.791.320.484.44
Non-food Trade1.581.802.075.234.7015.38
Services M.1.191.361.584.792.2411.16
Construction2.201.712.553.341.5411.34
Industry0.530.530.661.800.484.00
Other Sectors1.801.582.335.052.5913.36
Total14.7614.2816.2136.3418.41100.00
Table A5. Independent variables and tax payment delay.
Appreciation of Tax Payment Delay
PERSACTVery BadBadNeutralGoodVery GoodTotal
Strongly decrease1.241.243.724.583.2914.08
Decrease2.654.4912.8815.407.9643.39
Neutral1.372.917.8312.025.7829.91
Increase0.300.982.314.792.1410.53
Strongly increase0.170.130.390.770.642.10
Total5.739.7627.1337.5719.81100.00
PERSRENTVery badBadNeutralGoodVery goodTotal
Strongly decrease1.541.204.114.323.5114.68
Decrease2.233.9411.3013.867.4038.72
Neutral0.981.935.568.813.9821.27
Increase0.902.706.0310.534.7924.95
Strongly increase0.090.000.130.040.130.39
Total5.739.7627.1337.5719.81100.00
PERSEMPLVery badBadNeutralGoodVery goodTotal
Strongly decrease1.411.203.123.592.3111.64
Decrease1.111.845.736.424.3619.47
Neutral3.006.4217.2926.1912.6765.55
Increase0.170.300.941.330.473.21
Strongly increase0.040.000.040.040.000.13
Total5.739.7627.1337.5719.81100.00
SEXVery badBadNeutralGoodVery goodTotal
Male3.616.0216.9422.6112.7761.95
Female2.113.7410.0615.057.0938.05
Total5.729.7627.0037.6619.86100.00
OPENNESSVery badBadNeutralGoodVery goodTotal
Closed1.212.025.777.154.7420.88
Part. Opened2.414.0511.3216.667.9642.40
Opened2.153.709.9913.697.1936.72
Total5.779.7727.0837.4919.89100.00
SIZEVery badBadNeutralGoodVery goodTotal
SOLO3.385.5214.5921.9511.0856.53
1–4 workers1.803.178.4310.915.9530.25
5–9 workers0.260.471.712.611.166.20
10–19 workers0.210.341.280.940.903.68
20–49 workers0.040.210.680.940.512.40
50 workers and more0.040.040.430.210.210.94
Total5.739.7627.1337.5719.81100.00
LIFETIMEVery badBadNeutralGoodVery goodTotal
Less than 1 Y0.210.301.161.240.733.64
1–3 Y1.111.544.035.102.5714.36
4–5 Y0.860.992.793.561.9710.16
6–10 Y0.862.143.605.662.3114.57
11–20 Y1.372.235.927.334.2421.09
21–30 Y0.941.464.206.303.6416.55
More than 30 Y0.391.115.448.324.3719.63
Total5.749.7727.1337.5119.85100.00
LEGALVery badBadNeutralGoodVery goodTotal
Individual2.955.8214.3820.4511.0454.64
Corporate2.783.9412.7517.128.7745.36
Total5.739.7627.1337.5719.81100.00
SECTORVery badBadNeutralGoodVery goodTotal
Art. And Cult.0.320.461.852.411.396.43
Hospitality0.691.342.643.151.769.58
Lib. Prof0.881.856.579.674.2123.18
Food Trade0.320.461.431.111.114.44
Non food trade0.931.204.165.323.4715.09
Services M.0.511.202.734.862.5511.85
Construction0.881.303.563.661.9911.38
Industry0.190.281.301.900.794.44
Other sectors0.931.573.335.232.5513.60
Total5.659.6727.5837.3019.81100.00
Table A6. Independent variables and credit repayment facilities.
Appreciation of Credit Repayment Facilities
PERSACTVery BadBadNeutralGoodVery GoodTotal
Strongly decrease0.580.673.425.863.6414.17
Decrease1.072.0410.7020.129.8143.74
Neutral0.441.075.2816.126.5329.44
Increase0.090.402.264.842.9810.57
Strongly increase0.040.090.580.750.622.09
Total2.224.2622.2547.6923.58100.00
PERSRENTVery badBadNeutralGoodVery goodTotal
Strongly decrease0.531.073.205.733.8614.39
Decrease1.111.919.5017.858.5738.94
Neutral0.310.494.7111.014.4420.96
Increase0.270.804.8012.926.5725.36
Strongly increase0.000.000.040.180.130.36
Total2.224.2622.2547.6923.58100.00
PERSEMPLVery badBadNeutralGoodVery goodTotal
Strongly decrease0.670.893.154.402.6611.77
Decrease0.400.805.028.265.2419.72
Neutral1.152.4413.2833.3514.8865.10
Increase0.000.130.801.600.753.29
Strongly increase0.000.000.000.090.040.13
Total2.224.2622.2547.6923.58100.00
EDUCATIONVery badBadNeutralGoodVery goodTotal
Primary0.000.000.310.220.180.71
Secondary0.581.206.0110.735.6624.19
Apprenticeship0.270.492.183.831.658.42
Bachelor0.941.608.6419.338.7839.29
Master0.400.944.6312.346.1924.50
PhD0.040.040.451.291.072.90
Total2.234.2822.2347.7523.52100.00
SEXVery badBadNeutralGoodVery goodTotal
Male1.202.5414.5829.0714.4461.84
Female1.031.747.5318.689.1838.16
Total2.234.2822.1147.7523.63100.00
OpennessVery badBadNeutralGoodVery goodTotal
Closed0.581.074.699.015.3520.71
Part. Open0.851.968.9721.299.6842.75
Opened0.801.208.5717.318.6636.55
Total2.234.2422.2247.6123.69100.00
SIZEVery badBadNeutralGoodVery goodTotal
SOLO1.332.4411.8627.4913.2356.35
1–4 workers0.671.337.0613.997.2830.33
5–9 workers0.090.181.643.111.206.22
10–19 workers0.130.180.931.471.023.73
20–49 workers0.000.090.441.380.532.44
50 workers and more0.000.040.310.270.310.93
Total2.224.2622.2547.6923.58100.00
LIFETIMEVery badBadNeutralGoodVery goodTotal
1–3 Y0.310.583.117.033.1614.19
11–20 Y0.620.624.4511.124.5821.40
21–30 Y0.361.073.876.944.1416.37
4–5 Y0.220.582.494.452.4510.19
6–10 Y0.360.533.257.382.9814.50
Less than 1 Y0.130.180.931.421.023.69
More than 30 Y0.220.714.149.305.2919.66
Total2.224.2722.2447.6423.62100.00
LEGALVery badBadNeutralGoodVery goodTotal
Individual1.292.3512.4825.9812.6154.71
Corporate0.931.919.7721.7110.9745.29
Total2.224.2622.2547.6923.58100.00
SECTORVery badBadNeutralGoodVery goodTotal
Art. and Cult.0.000.241.543.071.496.33
Hospitality0.290.672.643.692.459.74
Lib. Prof.0.340.775.0412.245.4223.80
Food Trade0.100.380.861.821.014.17
Non-food Trade0.480.433.656.384.1715.12
Services M.0.190.432.066.242.7811.71
Construction0.430.343.215.092.2111.28
Industry0.050.291.061.971.064.41
Other Sectors0.430.722.406.813.0713.44
Total2.304.2722.4647.3123.66100.00

Appendix B. Ordered Probit Estimation Results

Table A7. Ambition or prospects and temporary unemployment benefits for salary workers.
(1)(2)(3)(4)(5)(6)
CHOTEMPCHOTEMPCHOTEMPCHOTEMPCHOTEMPCHOTEMP
PERSACT−0.019
(0.030)
AMBACT −0.139 *
(0.072)
PERSRENT 0.038
(0.028)
AMBRENT 0.100
(0.061)
PERSEMPL 0.016
(0.040)
AMBEMPL −0.349 ***
(0.132)
Individual ControlsYESYESYESYESYESYES
Firm ControlsYESYESYESYESYESYES
Obs905905905905905905
DegFreedom333333333333
p-value0.0000.0000.0000.0000.0000.000
LogLhd−1135.265−1133.549−1134.466−1134.149−1135.388−1130.487
Note: Standard errors in parentheses. *** p < 0.01, ** p < 0.05, * p < 0.1. The table presents coefficients estimates of variables of interest of heteroskedastic ordered probit model with Huber/White robust standard errors. The first two columns, (1) and (2), concern activity outlook. These are followed by profitability prospects in columns (3) and (4). Columns (5) and (6) report the coefficients related to employment outlook. Individual controls include sex, age, and education. Firms’ controls take into account the legal form, the industry, the size, and the lifetime duration of the venture. In the variance equation of the heteroskedastic probit model, sex and age are not significant. The situation of the firm, whether it is totally or partially opened, strongly and negatively affects variability in policy assessment/perception. Hence, the variability of assessment/perception is lower for firms that can continue to operate compared with those that must remain closed.
Figure A1. Average marginal effects of the short-term expectations on unemployment benefits to salary workers.
Sustainability 13 11576 g0a1
Table A8. Ambition or prospects and extension of temporary unemployment benefits through 31 December 2020.
(1)(2)(3)(4)(5)(6)
CHTP31DECCHTP31DECCHTP31DECCHTP31DECCHTP31DECCHTP31DEC
PERSACT−0.085 ***
(0.023)
AMBACT −0.188 ***
(0.054)
PERSRENT −0.024
(0.018)
AMBRENT 0.037
(0.038)
PERSEMPL −0.087 ***
(0.029)
AMBEMPL −0.348 ***
(0.105)
Individual ControlsYESYESYESYESYESYES
Firm ControlsYESYESYESYESYESYES
Obs195119511951195119511951
DegFreedom343434343434
p-value0.0000.0000.0000.0000.0000.000
LogLhd−2318.356−2320.628−2327.742−2328.286−2322.430−2321.419
Note: Standard errors in parentheses. *** p < 0.01, ** p < 0.05, * p < 0.1. The table presents coefficients estimates of variables of interest of heteroskedastic ordered probit model with Huber/White robust standard errors. The first two columns, (1) and (2), concern activity outlook. These are followed by profitability prospects in columns (3) and (4). Columns (5) and (6) report the coefficients related to employment outlook. Individual controls include sex, age, and education. Firm controls take into account the legal form, the industry, the size, and the lifetime duration of the venture. In the variance equation of the heteroskedastic probit model, sex and age are not significant. The situation of the firm, whether it is totally or partially opened, strongly and negatively affects variability in policy assessment/perception. Hence, the variability of assessment/perception is lower for firms that can continue to operate compared with those that have to remain closed.
Figure A2. Average marginal effects of the short-term expectations on extension of unemployment benefits to salary workers and self-employed through 31 December 2021.
Sustainability 13 11576 g0a2
Table A9. Ambition or prospects and temporary unemployment benefits for self-employed.
(1)(2)(3)(4)(5)(6)
DROIPASDROIPASDROIPASDROIPASDROIPASDROIPAS
PERSACT0.053 *
(0.029)
AMBACT 0.059
(0.073)
PERSRENT 0.047 *
(0.025)
AMBRENT 0.137 **
(0.056)
PERSEMPL 0.088 **
(0.040)
AMBEMPL −0.120
(0.127)
Individual ControlsYESYESYESYESYESYES
Firm ControlsYESYESYESYESYESYES
Obs220722072207220722072207
DegFreedom343434343434
p-value0.0000.0000.0000.0000.0000.000
LogLhd−2889.396−2890.896−2889.399−2888.230−2888.280−2890.868
Note: Standard errors in parentheses. *** p < 0.01, ** p < 0.05, * p < 0.1. The table presents coefficients estimates of variables of interest of heteroskedastic ordered probit model with Huber/White robust standard errors. The first two columns, (1) and (2), concern activity outlook. These are followed by profitability prospects in columns (3) and (4). Columns (5) and (6) report the coefficients related to employment outlook. Individual controls include sex, age, and education. Firm controls take into account the legal form, the industry, the size, and the lifetime duration of the venture. In the variance equation of the heteroskedastic probit model, sex and age are not significant. The situation of the firm, whether it is totally or partially opened, strongly and negatively affects variability in policy assessment/perception. Hence, the variability of assessment/perception is lower for firms that can continue to operate compared with those that must remain closed.
Figure A3. Average marginal effects of the short-term expectations on temporary unemployment benefits to the self-employed.
Sustainability 13 11576 g0a3
Table A10. Ambition or prospects and credit repayment facilities.
(1)(2)(3)(4)(5)(6)
CRREPFACCRREPFACCRREPFACCRREPFACCRREPFACCRREPFAC
PERSACT0.073 **
(0.029)
AMBACT 0.091
(0.072)
PERSRENT 0.093 ***
(0.025)
AMBRENT 0.197 ***
(0.055)
PERSEMPL 0.080 **
(0.036)
AMBEMPL 0.052
(0.124)
Individual ControlsYESYESYESYESYESYES
Firm ControlsYESYESYESYESYESYES
Obs196019601960196019601960
DegFreedom343434343434
p-value0.0090.0300.0000.0010.0060.032
LogLhd−2433.785−2436.684−2429.397−2430.683−2434.706−2437.472
Note: Standard errors in parentheses. *** p < 0.01, ** p < 0.05, * p < 0.1. The table presents coefficients estimates of variables of interest of heteroskedastic ordered probit model with Huber/White robust standard errors. The first two columns, (1) and (2), concern activity outlook. These are followed by profitability prospects in columns (3) and (4). Columns (5) and (6) report the coefficients related to employment outlook. Individual controls include sex, age, and education. Firm controls take into account the legal form, the industry, the size, and the lifetime duration of the venture. In the variance equation of the heteroskedastic probit model, sex and age are not significant. The situation of the firm, whether it is totally or partially opened, strongly and negatively affects variability in policy assessment/perception. Hence, the variability of assessment/perception is lower for firms that can continue to operate compared with those that must remain closed.
Figure A4. Average marginal effects of the short-term expectations on credit repayment facilities.
Sustainability 13 11576 g0a4
Table A11. Ambition or prospects and regional allowances.
(1)(2)(3)(4)(5)(6)
INDREGINDREGINDREGINDREGINDREGINDREG
PERSACT0.089 ***
(0.027)
AMBACT 0.099
(0.063)
PERSRENT 0.070 ***
(0.023)
AMBRENT 0.108 **
(0.047)
PERSEMPL 0.152 ***
(0.037)
AMBEMPL 0.078
(0.121)
Individual ControlsYESYESYESYESYESYES
Firm ControlsYESYESYESYESYESYES
Obs2.1372.1372.1372.1372.1372.137
DegFreedom343434343434
p-value0.0000.0000.0000.0000.0000.000
LogLhd−3193.397−3199.414−3195.092−3198.058−3188.256−3200.518
Note: Standard errors in parentheses. *** p < 0.01, ** p < 0.05, * p < 0.1. The table presents coefficients estimates of variables of interest of heteroskedastic ordered probit model with Huber/White robust standard errors. The first two columns, (1) and (2), concern activity outlook. These are followed by profitability prospects in columns (3) and (4). Columns (5) and (6) report the coefficients related to employment outlook. Individual controls include sex, age, and education. Firm controls take into account the legal form, the industry, the size, and the lifetime duration of the venture. In the variance equation of the heteroskedastic probit model, sex and age are not significant. The situation of the firm, whether it is totally or partially opened, strongly and negatively affects variability in policy assessment/perception. Hence, the variability of assessment/perception is lower for firms that can continue to operate compared with those that must remain closed.
Figure A5. Average marginal effects of the short-term expectations on regional allowances.
Sustainability 13 11576 g0a5
Table A12. Ambition or prospects and deferral of social security contributions.
(1)(2)(3)(4)(5)(6)
REPCOTIREPCOTIREPCOTIREPCOTIREPCOTIREPCOTI
PERSACT0.084 ***
(0.024)
AMBACT 0.193 ***
(0.059)
PERSRENT 0.082 ***
(0.022)
AMBRENT 0.150 ***
(0.045)
PERSEMPL 0.104 ***
(0.032)
AMBEMPL 0.000
(0.103)
Individual ControlsYESYESYESYESYESYES
Firm ControlsYESYESYESYESYESYES
Obs217421742174217421742174
DegFreedom343434343434
p-value0.0000.0000.0000.0000.0000.000
LogLhd−3123.532−3125.386−3122.288−3125.267−3124.397−3130.923
Note: Standard errors in parentheses. *** p < 0.01, ** p < 0.05, * p < 0.1. The table presents coefficients estimates of variables of interest of heteroskedastic ordered probit model with Huber/White robust standard errors. The first two columns, (1) and (2), concern activity outlook. These are followed by profitability prospects in columns (3) and (4). Columns (5) and (6) report the coefficients related to employment outlook. Individual controls include sex, age, and education. Firm controls take into account the legal form, the industry, the size, and the lifetime duration of the venture. In the variance equation of the heteroskedastic probit model, sex and age are not significant. The situation of the firm, whether it is totally or partially opened, strongly and negatively affects variability in policy assessment/perception. Hence, the variability of assessment/perception is lower for firms that can continue to operate compared with those that must remain closed.
Figure A6. Average marginal effects of the short-term expectations on deferral of social security contributions.
Sustainability 13 11576 g0a6
Table A13. Ambition or prospects and postponement of all fiscal declarations.
(1)(2)(3)(4)(5)(6)
DECLFISDECLFISDECLFISDECLFISDECLFISDECLFIS
PERSACT0.058 **
(0.028)
AMBACT 0.149 **
(0.075)
PERSRENT 0.058 **
(0.024)
AMBRENT 0.163 ***
(0.055)
PERSEMPL −0.029
(0.034)
AMBEMPL −0.114
(0.142)
Individual ControlsYESYESYESYESYESYES
Firm ControlsYESYESYESYESYESYES
Obs198119811981198119811981
DegFreedom343434343434
p-value0.0000.0000.0000.0000.0000.000
LogLhd−2685.945−2686.186−2685.427−2683.770−2688.135−2688.148
Note: Standard errors in parentheses. *** p < 0.01, ** p < 0.05, * p < 0.1. The table presents coefficients estimates of variables of interest of heteroskedastic ordered probit model with Huber/White robust standard errors. The first two columns, (1) and (2), concern activity outlook. These are followed by profitability prospects in columns (3) and (4). Columns (5) and (6) report the coefficients related to employment outlook. Individual controls include sex, age, and education. Firm controls take into account the legal form, the industry, the size, and the lifetime duration of the venture. In the variance equation of the heteroskedastic probit model, sex and age are not significant. The situation of the firm, whether it is totally or partially opened, strongly and negatively affects variability in policy assessment/perception. Hence, the variability of assessment/perception is lower for firms that can continue to operate compared with those that must remain closed.
Figure A7. Average marginal effects of the short-term expectations on postponement of all fiscal declarations.
Sustainability 13 11576 g0a7
Table A14. Ambition or prospects and taxes debts payment delay.
(1)(2)(3)(4)(5)(6)
RFISDEBTRFISDEBTRFISDEBTRFISDEBTRFISDEBTRFISDEBT
PERSACT0.051 **
(0.021)
AMBACT 0.074
(0.055)
PERSRENT 0.063 ***
(0.020)
AMBRENT 0.127 ***
(0.043)
PERSEMPL 0.042
(0.028)
AMBEMPL 0.007
(0.107)
Individual ControlsYESYESYESYESYESYES
Firm Controls
Obs1982.0001982.0001982.0001982.0001982.0001982.000
DegFreedom34.00034.00034.00034.00034.00034.000
p-value0.0000.0000.0000.0000.0000.000
LogLhd−2753.424−2755.569−2750.738−2751.970−2755.248−2756.460
Note: Standard errors in parentheses. *** p < 0.01, ** p < 0.05, * p < 0.1. The table presents coefficients estimates of variables of interest of heteroskedastic ordered probit model with Huber/White robust standard errors. The first two columns, (1) and (2), concern activity outlook. These are followed by profitability prospects in columns (3) and (4). Columns (5) and (6) report the coefficients related to employment outlook. Individual controls include sex, age, and education. Firm controls take into account the legal form, the industry, the size, and the lifetime duration of the venture. In the variance equation of the heteroskedastic probit model, sex and age are not significant. The situation of the firm, whether it is totally or partially opened, strongly and negatively affects variability in policy assessment/perception. Hence, the variability of assessment/perception is lower for firms that can continue to operate compared with those that must remain closed.
Figure A8. Average marginal effects of the short-term expectations on taxes debts payment delay.
Sustainability 13 11576 g0a8
Table A15. Ambition or prospects and taxes payment delay.
(1)(2)(3)(4)(5)(6)
TAXPAYDELTAXPAYDELTAXPAYDELTAXPAYDELTAXPAYDELTAXPAYDEL
PERSACT0.063 ***
(0.020)
AMBACT 0.132 ***
(0.050)
PERSRENT 0.048 ***
(0.017)
AMBRENT 0.083 **
(0.037)
PERSEMPL 0.040
(0.025)
AMBEMPL −0.026
(0.090)
Individual ControlsYESYESYESYESYESYES
Firm ControlsYESYESYESYESYESYES
Obs202720272027202720272027
DegFreedom343434343434
p-value0.0000.0000.0000.0000.0000.000
LogLhd−2859.638−2862.092−2861.437−2863.325−2864.333−2865.810
Note: Standard errors in parentheses. *** p < 0.01, ** p < 0.05, * p < 0.1. The table presents coefficients estimates of variables of interest of heteroskedastic ordered probit model with Huber/White robust standard errors. The first two columns, (1) and (2), concern activity outlook. These are followed by profitability prospects in columns (3) and (4). Columns (5) and (6) report the coefficients related to employment outlook. Individual controls include sex, age, and education. Firm controls take into account the legal form, the industry, the size, and the lifetime duration of the venture. In the variance equation of the heteroskedastic probit model, sex and age are not significant. The situation of the firm, whether it is totally or partially opened, strongly and negatively affects variability in policy assessment/perception. Hence, the variability of assessment/perception is lower for firms that can continue to operate compared with those that must remain closed.
Figure A9. Average marginal effects of the short-term expectations on tax payment delay.
Sustainability 13 11576 g0a9
Table A16. Ambition or prospects and guarantees from the banking sector to provide loans.
(1)(2)(3)(4)(5)(6)
BANKGARBANKGARBANKGARBANKGARBANKGARBANKGAR
PERSACT0.045 *
(0.025)
AMBACT 0.093
(0.065)
PERSRENT 0.060 ***
(0.023)
AMBRENT 0.152 ***
(0.050)
PERSEMPL 0.057 *
(0.034)
AMBEMPL −0.027
(0.113)
Individual ControlsYESYESYESYESYESYES
Firm ControlsYESYESYESYESYESYES
Obs1847.0001847.0001847.0001847.0001847.0001847.000
DegFreedom34.00034.00034.00034.00034.00034.000
p-value0.0000.0000.0000.0000.0000.000
LogLhd−2392.960−2393.569−2390.957−2389.916−2392.973−2394.654
Note: Standard errors in parentheses. *** p < 0.01, ** p < 0.05, * p < 0.1. The table presents coefficients estimates of variables of interest of heteroskedastic ordered probit model with Huber/White robust standard errors. The first two columns, (1) and (2), concern activity outlook. These are followed by profitability prospects in columns (3) and (4). Columns (5) and (6) report the coefficients related to employment outlook. Individual controls include sex, age, and education. Firm controls take into account the legal form, the industry, the size, and the lifetime duration of the venture. In the variance equation of the heteroskedastic probit model, sex and age are not significant. The situation of the firm, whether it is totally or partially opened, strongly and negatively affects variability in policy assessment/perception. Hence, the variability of assessment/perception is lower for firms that can continue to operate compared with those that must remain closed.
Figure A10. Average marginal effects of the short-term expectations on public financial guarantees.
Sustainability 13 11576 g0a10
Table A17. Ambition or prospects and loans and exoneration of taxes and employers social security contributions on dismissall compensation fees—Only firms with salary workers.
(1)(2)(3)(4)(5)(6)
DEFIPREAVDEFIPREAVDEFIPREAVDEFIPREAVDEFIPREAVDEFIPREAV
PERSACT−0.067
(0.044)
AMBACT −0.081
(0.096)
PERSRENT −0.061
(0.042)
AMBRENT −0.009
(0.087)
PERSEMPL −0.234 ***
(0.084)
AMBEMPL −0.343 **
(0.166)
Individual ControlsYESYESYESYESYESYES
Firm ControlsYESYESYESYESYESYES
Obs861.000861.000861.000861.000861.000861.000
DegFreedom33.00033.00033.00033.00033.00033.000
p-value0.0110.0240.0110.0350.0000.013
LogLhd−1029.865−1030.891−1029.909−1031.198−1020.774−1028.723
Note: Standard errors in parentheses. *** p < 0.01, ** p < 0.05, * p < 0.1. The table presents coefficients estimates of variables of interest of heteroskedastic ordered probit model with Huber/White robust standard errors. The first two columns, (1) and (2), concern activity outlook. These are followed by profitability prospects in columns (3) and (4). Columns (5) and (6) report the coefficients related to employment outlook. Individual controls include sex, age, and education. Firm controls take into account the legal form, the industry, the size, and the lifetime duration of the venture. In the variance equation of the heteroskedastic probit model, sex and age are not significant. The situation of the firm, whether it is totally or partially opened, strongly and negatively affects variability in policy assessment/perception. Hence, the variability of assessment/perception is lower for firms that can continue to operate compared with those that must remain closed.
Figure A11. Average marginal effects of the short-term expectations on exoneration of taxes on dismissal compensations.
Sustainability 13 11576 g0a11

References

  1. Fairlie, R.; Fossen, F. The early impacts of the COVID-19 pandemic on business sales. Small Bus. Econ. 2021, 1–2. Available online: https://doi.org/10.1007/s11187-021-00479-4 (accessed on 1 June 2020). [CrossRef]
  2. Mankiw, N.G. The COVID-19 Recession of 2020; Harvard University: Cambridge, MA, USA, 2020. [Google Scholar]
  3. OECD. Worker security and the COVID-19 crisis. In OECD Employment Outlook 2020; OECD: Paris, France, 2020. [Google Scholar] [CrossRef]
  4. OECD. Supporting Businesses in Financial Distress to Avoid Insolvency during the COVID-19 Crisis; OECD: Paris, France, 2020. [Google Scholar]
  5. Fairlie, R. The Impact of COVID-19 on Small Business Owners: The First Three Months after Social-Distancing Restrictions; CESifo Working Paper 8581; CESifo: Munich, Germany, 2020. [Google Scholar]
  6. Alekseev, G.; Amer, S.; Gopal, M.; Kuchler, T.; Schneider, J.; Stroebel, J.; Wernerfelt, N. The Effects of COVID-19 on U.S. Small Businesses: Evidence from Owners, Managers, and Employees; CEPR Discussion Paper 15290; CEPR: London, UK, 2020. [Google Scholar]
  7. Linnenluecke, M.K. Resilience in business and management research: A review of influential publications and a research agenda. Int. J. Manag. Rev. 2017, 19, 4–30. [Google Scholar] [CrossRef]
  8. Kuckertz, A.; Brändle, L. Creative reconstruction: A structured literature review of the early empirical research on the COVID-19 crisis and entrepreneurship. Manag. Rev. Q. 2021, 1–27. [Google Scholar] [CrossRef]
  9. Goodhart, C.H.; Tsomocos, D.; Wang, X. Support for Small Businesses Amid COVID-19; VoxEU & CEPR: London, UK, 2020. [Google Scholar]
  10. Segura, A.; Villacorta, A. Firm-Bank Linkages and Optimal Policies in a Lockdown; Discussion Paper 14838; Centre for Economic Policy Research: London, UK, 2020. [Google Scholar]
  11. Kahn, C.; Wagner, W. Liquidity Provision during a Pandemic; Discussion Paper 14701; Centre for Economic Policy Research: London, UK, 2020. [Google Scholar]
  12. Bartik, A.W.; Bertrand, M.; Cullen, Z.; Glaeser, E.L.; Luca, M.; Stanton, C. The impact of COVID-19 on small business outcomes and expectations. Proc. Natl. Acad. Sci. USA 2020, 117, 17656–17666. [Google Scholar] [CrossRef]
  13. National Bank of Belgium. Report 2020—Economic and Financial Developments; National Bank of Belgium: Brussels, Belgium, 2021. [Google Scholar]
  14. European Commission. European Economic Forecast. Spring 2020; Institutional Paper 125; European Commission: Brussels, Belgium, 2020. [Google Scholar] [CrossRef]
  15. Hermans, J.; Vanderstraeten, J.; van Witteloostuijn, A.; Dejardin, M.; Ramdani, D.; Stam, E. Ambitious entrepreneurship: A review of growth aspirations, intentions, and expectations”. Adv. Entrep. Firm Emerg. Growth 2015, 17, 127–161. [Google Scholar] [CrossRef]
  16. Andrews, D.; Petroulakis, F. Breaking the Shackles: Zombie Firms, Weak Banks and Depressed Restructuring in Europe; European Central Bank Working Paper Series 2240; European Central Bank: Frankfurt, Germany, 2019. [Google Scholar]
  17. Eurofound, COVID-19 EU PolicyWatch. Database of National-Level Responses. Available online: https://static.eurofound.europa.eu/covid19db/ (accessed on 23 August 2021).
  18. Hijzen, A.; Venn, D. The Role of Short-Time Work Schemes during the 2008–09 Recession; Employment and Migration Working Papers 115; OECD: Paris, France, 2020. [Google Scholar] [CrossRef]
  19. OECD. Job Retention Schemes during the COVID-19 and Beyond; OECD: Paris, France, 2020. [Google Scholar]
  20. Groenewegen, J.; Hardeman, S.; Stam, E. Does COVID-19 state aid reach the right firms? COVID-19 state aid, turnover expectations, uncertainty and management practices. J. Bus. Ventur. Insights 2021, 16, e00262. [Google Scholar] [CrossRef]
  21. OECD. Coronavirus (COVID-19): SME Policy Responses; OECD: Paris, France, 2020. [Google Scholar]
  22. OECD. OECD Economic Outlook; Interim Report; OECD: Paris, France, 2020. [Google Scholar]
  23. Berger, A.N.; Udell, G.F. Small business and debt finance. In Handbook of Entrepreneurship Research; Acs, Z.J., Audretsch, D.B., Eds.; International Handbook Series on Entrepreneurship; Springer: Boston, MA, USA, 2003; Volume 1. [Google Scholar]
  24. Bonnet, J.; Cieply, S.; Dejardin, M. Credit rationing or overlending? An exploration into financing imperfection. Appl. Econ. 2016, 48, 5563–5580. [Google Scholar] [CrossRef] [Green Version]
  25. National Bank of Belgium. Belgian Prime News; National Bank of Belgium: Brussels, Belgium, 2020; p. 88. [Google Scholar]
  26. Barney, J. Firm resources and sustained competitive advantage. J. Manag. 1991, 17, 99–120. [Google Scholar] [CrossRef]
  27. Barney, J. Is the resource-based “view” a useful perspective for strategic management research? Yes. Acad. Manag. Rev. 2001, 26, 41–56. [Google Scholar] [CrossRef]
  28. Galbreath, J. Which resources matter the most to firm success? An exploratory study of resource-based theory. Technovation 2005, 25, 979–987. [Google Scholar] [CrossRef]
  29. Didonet, S.R.; Fearne, A.; Simmons, G. Determining the presence of a long-term/short-term dilemma for SMEs when adopting strategic orientation to improve performance. Int. Small Bus. J. 2020, 38, 90–110. [Google Scholar] [CrossRef] [Green Version]
  30. Teece, D.J.; Pisano, G.; Shuen, A. Dynamic capabilities and strategic management. Strateg. Manag. J. 1997, 18, 509–533. [Google Scholar] [CrossRef]
  31. Lin, Y.; Wu, L.-Y. Exploring the role of dynamic capabilities in firm performance under the resource-based view framework. J. Bus. Res. 2014, 67, 407–413. [Google Scholar] [CrossRef]
  32. Stam, E.; Bosma, N.; van Witteloostuijn, A.; De Jong, J.; Bogaert, S.; Edwards, N.; Jaspers, F. Ambitious entrepreneurship: A review of the state of the art. In StudieReeks 23; Vlaamse Raad voor Wetenschap en Innovatie: Brussels, Belgium, 2012. [Google Scholar]
  33. Bloom, N.; Davis, S.J.; Foster, L.; Lucking, B.; Ohlmacher, S.; Saporta-Eksten, I. Business-Level Expectations and Uncertainty; NBER Working Paper w28259; NBER: Cambridge, MA, USA, 2020. [Google Scholar]
  34. Lamorgese, A.; Linarello, A.; Patnaik, M.; Schivardi, F. Management Practices and Resilience to Shocks: Evidence from COVID-19; CEPR Discussion Paper 15987; CEPR: London, UK, 2021. [Google Scholar]
  35. Joshi, A.; Kale, S.; Chandel, S.; Pal, D.K. Likert scale: Explored and explained. Br. J. Appl. Sci. Technol. 2015, 7, 396–403. [Google Scholar] [CrossRef]
  36. Foroohar, R. Small Business: A Canary in the US Economic Coal Mine. 2020. Available online: https://www.ft.com/content/da6e13f2-8913-4d97-a0ff-124347b5ad4d (accessed on 19 July 2021).
  37. Williams, R.A. Generalized ordered logit/partial proportional odds models for ordinal dependent variables. Stata J. 2006, 6, 58–82. [Google Scholar] [CrossRef] [Green Version]
  38. Wolfe, R.; Gould, W. An approximate likelihood-ratio test for ordinal response models. Stata Tech. Bull. 1998, 42, 24–27. [Google Scholar]
  39. Allison, P.D. Comparing logit and probit coefficients across groups. Sociol. Methods Res. 1999, 28, 186–208. [Google Scholar] [CrossRef]
  40. Norusis, M. SPSS 13.0 Advanced Statistical Procedures Companion; Prentice Hall: Upper Saddle River, NJ, USA, 2005. [Google Scholar]
  41. Long, J.S.; Freese, J. Regression Models for Categorical Dependent Variables Using Stata, 2nd ed.; Stata Press: College Station, TX, USA, 2006. [Google Scholar]
  42. Williams, R.A. Using heterogeneous choice models to compare logit and probit coefficients across groups. Sociol. Methods Res. 2009, 37, 531–559. [Google Scholar] [CrossRef] [Green Version]
  43. Williams, R.A. Fitting heterogeneous choice models with oglm. Stata J. 2010, 10, 540–567. [Google Scholar] [CrossRef] [Green Version]
  44. Yatchew, A.; Griliches, Z. Specification error in probit models. Rev. Econ. Stat. 1985, 67, 134–139. [Google Scholar] [CrossRef]
  45. Greene, W.H. Econometric Analysis, 7th ed.; Pearson Education Limited: London, UK, 2012. [Google Scholar]
  46. Greene, W.H.; Hensher, D.A. Modeling Ordered Choices: A Primer, 1st ed.; Cambridge University Press: Cambridge, UK, 2010. [Google Scholar]
  47. Wooldrige, J.M. Econometric Analysis of Cross Section and Panel Data, 2nd ed.; The MIT Press: Cambridge, MA, USA, 2010. [Google Scholar]
  48. Penciakova, V.; Sander NGourinchas, P.; Kalemli-Ozcann, S. COVID-19 and SME Failures; NBER Working Paper 27877; NBER: Cambridge, MA, USA, 2020. [Google Scholar]
  49. OECD. One Year of SME and Entrepreneurship Policy Responses to COVID-19: Lessons Learned to “Build Back Better”; OECD: Paris, France, 2021. [Google Scholar]
  50. Bögenhold, D.; O’Hagan-Luff, M.; Parastuty, Z.; van Stel, A. How Do Policy Instruments Shape Intentions to Become Solo or Employer Entrepreneur? In Proceedings of the 60th ERSA Congress, Territorial Futures—Visions and Scenarios for a Resilient Europe, Online, 24–27 August 2021. [Google Scholar]
  51. Spigel, B.; Stam, E. Entrepreneurial ecosystems. In SAGE Handbook of Entrepreneurship and Small Business; Blackburn, R., De Clercq, D., Heinonen, J., Eds.; SAGE: Thousand Oaks, CA, USA, 2018; Chapter 21. [Google Scholar] [CrossRef] [Green Version]
Table 1. List of dependent variables: different policy measures.
NameDescription
CHOTEMPOrdinal (1 = Very bad idea…5 = very good idea) Appreciation of temporary unemployment benefits
REPCOTIOrdinal (1 = Very bad idea…5 = very good idea) Appreciation of deferral of social security contributions
INDREGOrdinal (1 = Very bad idea…5 = very good idea) Appreciation of regional aids
DROIPASOrdinal (1 = Very bad idea…5 = very good idea) Appreciation of temporary allowances for self-employed
CHTP31DECOrdinal (1 = Very bad idea…5 = very good idea) Appreciation of extension of temporary unemployment benefits until 31 December 2020
DEFIPREAVOrdinal (1 = Very bad idea…5 = very good idea) Appreciation of elimination of taxes and employer charges dismissal compensations
PROLPREAOrdinal (1 = Very bad idea…5 = very good idea) Appreciation of extension by the same duration of dismissal notices suspended by the COVID-19 crisis
OUTPLACOrdinal (1 = Very bad idea…5 = very good idea) Appreciation of public support for the outplacement of dismissed workers
LOCALTAXOrdinal (1 = Very bad idea…5 = very good idea) Appreciation of the suspension of local taxes
GOVGARANOrdinal (1 = Very bad idea…5 = very good idea) Appreciation of guarantees from public financial institutions
DECLFISOrdinal (1 = Very bad idea…5 = very good idea) Appreciation of the postponement of all social declarations
BANKGAROrdinal (1 = Very bad idea…5 = very good idea) Appreciation of guarantees from the banking sector to provide loans
TAXPAYDELOrdinal (1 = Very bad idea…5 = very good idea) Appreciation of federal tax payment delay
CRREPFACOrdinal (1=Very bad idea…5 = very good idea) Appreciation of credit repayment facilities
RFISDEBTOrdinal (1=Very bad idea…5 = very good idea) Appreciation of taxes debts repayment delay
Table 2. Unconditional evaluation of the different policy measures in response to COVID-19.
VariablesVery BadBadNeutralGoodVery GoodTotal
CHOTEMP5.658.5721.7839.5824.43100.00
DROIPAS6.266.7711.6343.7731.56100.00
REPCOTI8.5511.2928.5536.6214.99100.00
CHTP31DEC1.824.4418.6342.1932.92100.00
DECLFIS3.658.4336.1933.6418.09100.00
DEFIPREAV2.393.9820.0337.8135.80100.00
CRREPFAC2.224.2622.2547.6923.58100.00
INDREG14.6914.0416.5536.4618.25100.00
GOVGARAN3.234.1731.8541.4119.34100.00
RFISDEBT5.189.1329.7339.0416.91100.00
TAXPAYDEL5.739.7627.1337.5719.81100.00
Table 3. Variables of interest: short-term prospects.
NameDescription
PERSACTOrdinal (1 = Very bad…5 = very good) Short term perceived business prospects
PERSRENTOrdinal (1 = Very bad…5 = very good) Short term perceived profitability prospects
PERSEMPLOrdinal (1 = Very bad…5 = very good) Short term perceived employment prospects
AMBACTBinary = 1 if PERSACT > 3 and 0 otherwise
AMBRENTBinary = 1 if PERSRENT > 3 and 0 otherwise
AMBEMPLBinary = 1 if PERSEMPL > 3 and 0 otherwise
Table 4. List of control variables.
NameDescription
SEXBinary = 1 if the respondent is a woman and 0 otherwise
AGENumerical: age of the respondent
JURFORMBinary = 1 if the firm is managed as a legal (moral) form, 0 otherwise
SOLOBinary = 1 if the entrepreneur works alone form, 0 otherwise
SIZE1to4Binary = 1 if the firm has btw 1 and 4 workers, 0 otherwise
SIZE5to9Binary = 1 if the firm has btw 5 and 9 workers, 0 otherwise
SIZE10to19Binary = 1 if the firm has btw 10 and 19 workers, 0 otherwise
SIZE20to49Binary = 1 if the firm has btw 20 and 49 workers, 0 otherwise
SIZE30PlusBinary = 1 if the firm has more than 30 workers, 0 otherwise
LFT (Lifetime)1Less than 1 year
LFT(Lifetime)2Between 1 and 3 years
LFT(Lifetime)3Between 4 and 5 years
LFT(Lifetime)4Between 6 and 10 years
LFT(Lifetime)5Between 11 and 20 years
LFT(Lifetime)6Between 21 and 30 years
LFT(Lifetime)7More than 30 years
FOODBinary = 1 if the firm is active in the food trading sector and 0 otherwise
NONFOODBinary = 1 if the firm is active in the non-food trading sector and 0 otherwise
INDUSTBinary = 1 if the firm is active in the industrial sector and 0 otherwise
CONSTRBinary = 1 if the firm is active in the construction sector and 0 otherwise
PROFLIBBinary = 1 if the respondent is active in liberal professions sector and 0 otherwise
HOSPITALITYBinary = 1 if the firm is active hotels, restoration, and cafes and 0 otherwise
ARTCULTBinary = 1 if the firm is active in arts, culture, and events organization and 0 otherwise
SERVMARBinary = 1 if the firm is active in business services and 0 otherwise
OSECTORSBinary = 1 if the firm is active in a sector other than those cited, 0 otherwise
TOPOPENBinary = 1 if the firm is totally opened and 0 otherwise
PARTOPENBinary = 1 if the firm is partially opened and 0 otherwise
CLOSEDBinary = 1 if the firm is totally closed and 0 otherwise
Table 5. Summary of estimation results.
Short-Term Prospect (Likert Scale)Short-Term Prospect (Binary)
PERSACTPERSRENTPERSEMPLAMBACTAMBRENTAMBEMPL
Employment and social policy measures
CHOTEMP [−]
CHTP31DEC
DROIPAS[+][+](+) (+)
Financial policy measures
CRREPFAC(+)+(+) +
INDREG+++ (+)
BANKGAR[+]+[+] +
Tax and fiscal policy measures
DECLFIS(+)(+) (+)+
REPCOTI+++++
RFISDEBT(+)+ +
TAXPAYDEL(+)+ +(+)
+/− : positively/negatively significant at 1%. (+/−): positively/negatively significant at 5%. [+/−]: positively/negatively significant at 10%. Empty cell: not significant.
Publisher’s Note: MDPI stays neutral with regard to jurisdictional claims in published maps and institutional affiliations.

