Review

Electric Buses in Malaysia: Policies, Innovations, Technologies and Life Cycle Evaluations

1
Institute of Power Engineering (IPE), University Tenaga Nasional, Kajang 43000, Malaysia
2
Electrical Engineering Department, Fahad Bin Sultan University, Tabuk 71454, Saudi Arabia
3
Department of Renewable Energy Engineering, Fahad Bin Sultan University, Tabuk 71454, Saudi Arabia
4
Department of Electrical and Electronics Engineering, Chaitanya Bharathi Institute of Technology, Hyderabad 500075, India
5
Department of Electrical and Electronics Engineering, Nisantasi University, Istanbul 34398, Turkey
6
School of Engineering, Faculty of Innovation and Technology, Taylor’s University, Subang Jaya 47500, Malaysia
7
Department of Electrical and Electronics Engineering, Community College, University of Hafr Al Batin, Hafr Al-Batin 31991, Saudi Arabia
8
Faculty of Electrical and Electronic Engineering, University Tun Hussein Onn Malaysia, Parit Raja 86400, Malaysia
9
Department of Architecture, Faculty of Built Environment, University of Malaya, Kuala Lumpur 50603, Malaysia
*
Author to whom correspondence should be addressed.
Sustainability 2021, 13(21), 11577; https://doi.org/10.3390/su132111577
Submission received: 6 September 2021 / Revised: 4 October 2021 / Accepted: 15 October 2021 / Published: 20 October 2021
(This article belongs to the Special Issue E-transportation for Future Sustainability)

Abstract

:
A large-scale adoption of electric buses (EBs) is a promising solution to mitigate greenhouse gas emissions from the transportation sector. In the upcoming decades, the development of EB technologies will be initiated worldwide, including in Malaysia. Government policies to support EB deployments have been widely established. Therefore, Malaysia’s National Automotive Policy has stated a roadmap of policies to promote a national groundwork accordingly. Following the elaboration of Malaysia’s goals for EBs deployments by 2014 and 2020, there are crucial associated topics for EBs implementation, including EB innovations and technologies adoption. This study presents a deep discussion about the groundwork of EB innovations that have been initiated in Malaysia to meet the roadmap targets. This paper also comprehensively reviews the technical specifications of EB innovation technologies, including Electric Bus Innovation Malaysia, Malaysia Automotive Institute, and Go Auto prototypes. In addition, this study outlines the EB technologies that have been launched in three states in Malaysia, known as Putrajaya, Melaka, and Sarawak. Furthermore, a generic framework for life cycle assessments of EB is presented, focusing on the economic and environmental impacts. This framework provides the necessary groundwork for further studies on charging infrastructure requirements.

1. Introduction

With industrial activities and power and heat generation, the transport sector is considered one of the significant energy-demanding sectors globally. In 2015, International Energy Agency (IEA) reported that the worldwide transport sector consumed around 31,310 TWh of the total energy demand, which approximately represented 14% of global greenhouse gas (GHG) emissions [1,2]. In 2010, Malaysia’s transportation accounted for 40% of total energy use and 22.9% of Malaysia’s GHG emissions. To meet Malaysia’s commitment under the Paris Agreement for mitigating GHG emissions intensity by 45% in 2030, the Government targeted to launch 2000 electric buses (EBs) to be adopted into its transportation sector [3]. In this regard, the author in [4] introduced a critical review about the challenges and possibilities of the inclusion of electric vehicles to reduce the carbon footprint in the transport sector. The study concludes that the transport sector’s decarburization could be possible by using EVs as a sustainable and efficient alternative to traditional diesel- and petrol-based vehicles. The impacts of EB batteries on sustainable development have been discussed in [5]. Authors in [6] assessed the emission of pollutants from public transport based on the example of diesel buses and trolleybuses. The research results clearly show that using trolleybuses in public transportation reduces the damage costs of the emission of pollutants that amount to approximately EUR (€) 30,000–60,000 per year for the analyzed lines in this study. In [7], The possibilities and limitations of developing public transport in Poland based on electric buses were presented. The main results of the work demonstrated that the optics of Poland’s national and regional authorities are focused mainly on electric buses without a thorough analysis of the legitimacy of their operation. In the same context, a review of electric public transport development has been done in [8]. In terms of economic impact evaluation of EB, an in-depth techno-economic analysis of the public transport sector in a small to midsize city and its surrounding area is reported by [9]. Based on this study, the total cost of ownership results for electric buses shows a strong cost decrease until the year 2030, reaching 23.5% lower TCOs compared to the conventional diesel bus.
However, there are several significant challenges to expanding the buses’ electrification in transportation networks. Thus, bus electrification could increase the electricity demand and significantly change the spatial-temporal shapes of requests, potentially impacting the electricity on existing infrastructure [10]. Addressing these barriers may need upgrading of electricity supply infrastructure and modernization on future electrical grid expansion. It can be noted that the expanding interdependency between stationary electric power generation, particularly renewable resources, and the transportation sector are emerging. Recently, such participation has been of particular significance nowadays because of the upcoming introduction of EBs. EBs with the prospective diffusion of bus-to-grid integration (BGI) technologies can offer several benefits in this context. BGI could support load balancing, backup electrical power, regulate voltage and frequency, reduce peak-loads, decrease the uncertainty in grid load forecasts, and increase the adoption of renewable energy. Alternately in the past decade, the charging technology and battery capacity of EBs have been improved from slow charging and low ability to ultrafast charging and high capacity, which has emerged to play an essential role in replacing conventional bus operation, powered by diesel or gasoline, with EB [11]. Since lithium-ion batteries have remarkable performances in balancing the power and energy densities, these batteries are primarily employed as an energy storage system in EBs [12]. However, this storage system frequently suffers from high replacement costs and short battery lives [13]. An efficient thermal management system for Li-ion batteries is challenging due to their high operating temperatures and risk of thermal runaway. The research in [14] proposed an improved cooling solution for a Li-ion battery pack. The results show that the battery stack’s peak temperature is decreased by 30.62% by using air cooling and reduced by 38.40% by using liquid cooling.
Moreover, it is crucial to improve the energy management of EB-ESS in terms of external and internal performances. On the other hand, for EBs’ external operations, rational scheduling of EBs based on the characteristics of the working loads can lower operational expenses. Nonetheless, improvements in the battery management system (BMS) based on the discharging and charging characteristics of batteries can effectively extend the battery life for the internal operations of the EBs [15]. Due to appropriate policy implementation and declining battery costs, global electric bus adoption is set to triple by 2025. Wood Mackenzie Power and Renewables stated that EBs adoption in China has exponentially increased from 2018 to 2025 [16], as shown in Figure 1.
Based on propulsion configuration, EBs would be performed by different degrees of electrification. These configurations can be classified into four types: fuel cell electric bus (FCEB), hybrid electric bus (HEB) series and parallel, and battery electric bus (BEB) [17]. The power source for electric engines is the main difference between these technologies. In this context, HEB employs both an internal combustion engine (ICE) and an electric motor (EM) to provide wheels with traction power [18]. The EM of FCEB is powered by a fuel cell technology that converts hydrogen and oxygen by applying a pair of redox reactions into electricity, water, and heat [19,20,21]. In comparison, the BEB technology is powered by an energy storage system (ESS) stored in an onboard battery pack [22,23]. The BEB technology is operationalized using two configurations based on the charging form: BEB overnight technology and BEB opportunity technology [24]. In this regard, BEB overnight technology would be operated with a range of up to 300 km with charging time (2–4 h). In contrast, the BEB opportunity technology has a smaller battery that could be fully charged within (5–10 min), where this bus could be operated at a limited range (35–50 km).
Recently, few researchers have correspondingly investigated the adoption of electric bus technologies and operations in Malaysia. In [11], the authors examined the possibility of EB operation as an alternative to traditional bus operation (powered by natural gas) in Putrajaya city, Malaysia. The study was analyzed based on the existing bus network in Putrajaya. The advanced EB operating model has adjusted accordingly by applying several operational issues, including charging facility and battery capacity. Furthermore, in [25], the industrial design-led approach is presented to enhance public acceptance for EB in Malaysia by examining several positive and negative scenarios worldwide for improving public transportation systems in Malaysia. In [26], the researchers estimated the required generated power for charging 100,0000 electric vehicles (EVs) and 2000 EBs by 2030 in Malaysia, where an EB is powered by 70 kWh. Based on this estimation, the researcher recommended increasing the electric energy generation capacity to meet the country’s electric energy peak demand by charging EVs and EBs by 2030. However, reviewing roadmap policies associated with EBs is neglected in various previous studies that discussed EBs in Malaysia. Therefore, there is a gap in understanding the interaction between policies and EB deployments in Malaysia. In addition, discussion in the areas of EB innovations and technologies in Malaysia is not specifically covered in any literature.
To address these gaps, this paper comprehensively detailed a roadmap of a series of policies reported by Malaysia National Automotive Policy (NAP) linked to EB deployments in 2014 and 2020. In this paper, some EB innovations that manufacturing companies in Malaysian have developed are thoroughly described. Besides, EB technologies that are currently operated in some transient networks around Malaysia are deeply deliberated. Harmoniously, this paper assesses the potential to replace conventional bus technologies (powered by diesel) with EB in Malaysia by proposing a generic framework that outlines the EB life cycle.
This paper contributes to the existing body of knowledge by suggesting a generic framework that summarizes the previous studies’ theoretical findings, which could lay out the theoretical background for future studies tackling the issue of transitioning from fossil fuel to electric-based transportation. Furthermore, the study’s framework is generic and can be tailored to suit any regional requirements set by the governing bodies of regional authorities. The framework also serves as potential guidance to new initiatives set by partners within the Malaysian context or within regions that have similar policies to outline the progress made and the challenges faced in the Malaysian context both in terms of policymaking and the expected outcomes.
The remainder of this paper is organized as follows. Section 2 outlines Malaysia roadmap policies by 2014 and 2020. The recent EB innovations in Malaysia are thoroughly discussed in Section 3. Three EB technologies that have been implemented in Malaysia are intensely reviewed in Section 4. Section 5 presents a generic framework of EB life cycles. Finally, the conclusion and a brief overview of the future research are presented in Section 6.

2. Malaysia Roadmap by 2014 and 2020: Goals and Policies

Under the Third Industrial Master Plan (IMP3) 2006–2020, the Malaysian Ministry of International Trade and Industry (MITI) established the first chapter of NAP back in 2006 to guide in strengthening the automotive sector [27]. NAP’s strategies mainly focus on deploying the automotive sectors based on consumers’ interests, industry expansion, and competitiveness. In this paper, the scope regarding NAP 2014 and NAP 2020 has been narrowed down to matters associated with EBs policy, goals, and achievements, as discussed in the next section.

2.1. NAP 2014

NAP 2014 concentrates on developing a sustainable and highly competitive automotive manufacturing sector, where the buses in the public transport sector are part of this strategy. Thus, consistent with NAP 2014, Malaysia has planned to adopt 100,000 EVs by 2020 with initiative up to RM150 million investments from potential local investors to implement 100 EBs for several implementation mechanisms, including outright purchase transit-oriented developments and leasing. NAP 2014 puts a lot of emphasis on supply chain, market expansion, green initiatives, human capital, and development of the entire automotive ecosystem, particularly EB deployments [28].
The international description of energy efficient vehicles (EEVs) are vehicles that assemble a set of requirements in terms of fuel consumption (L/km) and carbon emission level (CO2/km). Thus, EEV includes EV, hybrid electric vehicle (HEV), fuel-efficient vehicles, EB, HEB, FCEB. In this context, the main goal of NAP 2014 was to transform the automotive manufacturing in Malaysia towards becoming the Association of Southeast Asian Nations (ASEAN) hub for EEV by the year 2020 [28], as shown in Figure 2. This target would be achieved by enhancing research and development resources in various technologies, such as rechargeable battery technologies, light material, telematics, tooling, and component design.

2.2. NAP 2020

Various consultations and engagements were initiated in NAP 2020 with support from numerous intellects, academia, agencies, ministries, research and analysts’ entities, financial institutions, associations, and industry players [27,29]. The core target of NAP 2020 was built on constructing specific strategic plans with future development targets towards Malaysia’s competitive and potential advantage based on addressing disruptors and capitalizing opportunities in tandem with the future growth of the global automotive industry. In the electric bus domain, specific measures have been clarified in NAP 2020, which are as follows:
1.
Stimulate application and manufacturing of local battery packs batteries together with enhancement of BMS.
2.
Establish standards to promote wireless charging and battery swapping.
3.
Establish standards for disposal and recycling of batteries.
4.
Develop practicability research on hydrogen fuel cell technology.
5.
Build EB smart grid interoperability centers.
6.
Employ well-to-wheel model in the computation of emission from EB.

2.3. Compared Kuala Lumpur Roadmaps with Other Cities

This section compares Kuala Lumpur, Malaysia’s policy action toward EB Adoption, with other cities according to World Resources Institute (WRI). Based on a categorization system classified as either implementation or policy-based, WRI has reported mass EB adoption in 15 cities to assess their relative policy. These cities have been chosen because their EB deployment experiences may offer valuable information for different cities [30]. In the policy action, the cities have considered or actively considered specific EB policies or adoption targets. The city has procured and is working EBs either as a test or as part of its regular public transportation service in the implementation action. The level to how each of the 16 cities has undertaken actual policy and/or implementation steps was assessed to place each city was assigned to one of five stages (Stages 0–4, as shown in Table 1). These acts are used in this study to identify where in Malaysia EB adoption is in terms of location.
Stage Zero (0): At present, there have been no specific EB-related safeguards in place in the city. However, while a few discussions have taken place, no action has yet been made. Stage One (1): The city is exploring EB deployment at this level (also known as the emerging stage), starting to perform analysis and research on the viability and applicability of EBs in the local context, and conducting a relevant roadmap. Stage Two (2): In this stage (which is also called the breakthrough stage), the city starts to test the EB technologies with pilot projects, investigating areas for improvement, trying to collect operational data, and arranging for mass adoption of EBs. Stage Three (3): At this stage (also called the growing stage), by launching more EBs, the city is speeding up the adoption process. Meanwhile, route-based or city-level planning has begun to improve operational efficiency and ensure quality service. Stage Four (4): At this stage (known as the consolidated stage), the city is working toward complete electrification of its local bus system, achieving the highest level of electrification that willing to or could achieve without losing service quality.
A.
Addis Ababa had introduced the first two trolley EBs that were assembled locally by supporting a Russian company. However, the Ethiopian Government has not had any initiative in planning about adopting EBs.
B.
Ahmedabad is in a move to adopt EBs, where eight EBs were dedicated to the city.
C.
Although the manufacturer conducted an EB pilot test in Quito, the Government has not had any meaningful discussions about adopting EB or made any plans in this area.
D.
In Mexico City, the Government is conducting a long-term policy and is scheduling to adopt EB pilots on specific routes once the analysis and research have been completed.
E.
Cape Town developed a structured pilot plan after conducting a small fleet of EBs (not yet operational). When the case study was conducted, however, the initiative was under investigation by local authorities.
F.
Bangalore has a three-month EB trial administered by a manufacturing company, but the decision-makers did not further develop the project or purchase EB. Thus, the EB adoption project in Bangalore cannot be considered the trial phase as a structured pilot.
G.
The pilot project for adopting EB in Belo Horizonte was started in 2016, but the project has not been formally implemented at the time of reporting.
H.
IADB pilot project for EB adoption in Bogotá was launched in previous years, but the project was not formally implemented at the time of reporting.
I.
In the race to deploy and test EBs, Singapore has emerged as the frontrunner by captivating multiple substantial initiatives in recent years. Singapore city has published the guidelines and standards for autonomous vehicles (AVs), but it is on track for planned pilot deployment in 2022.
J.
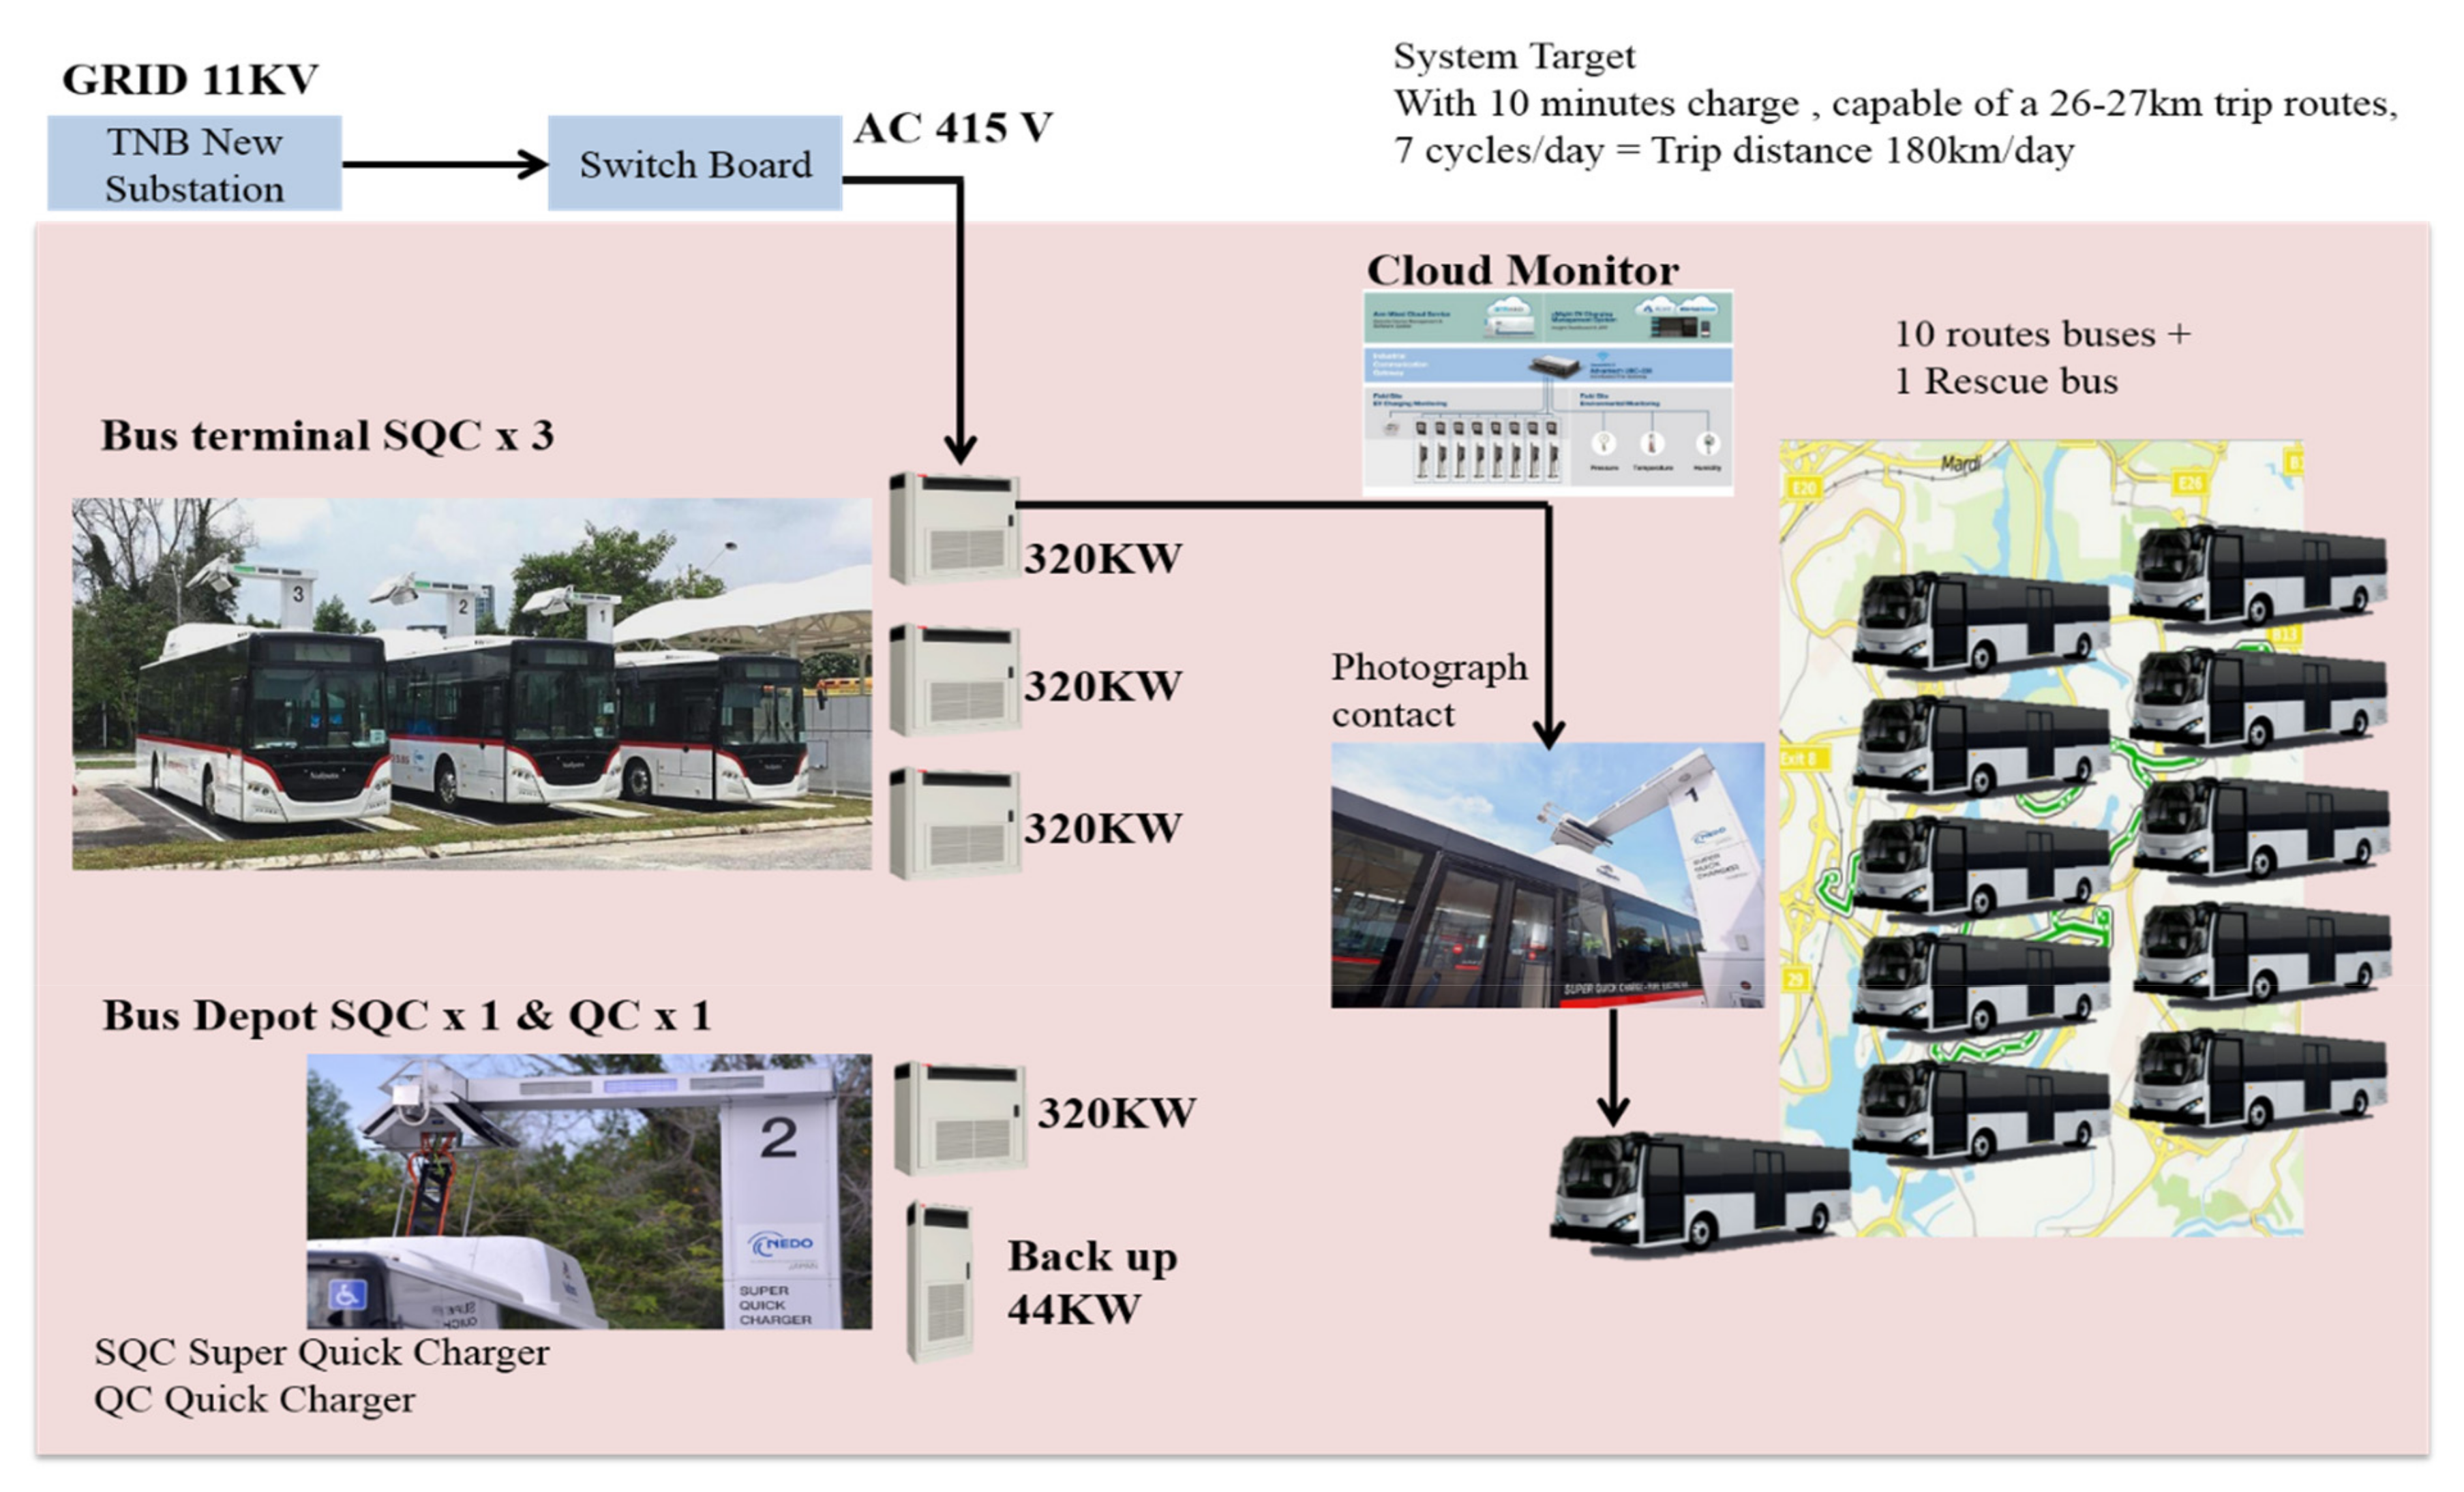
There have been various EBs pilot projects in Putrajaya conducted by multiple manufacturing companies, such as Putra NEDO EB Project associated with the charging system of super quick charge (SQC).
K.
Nowadays, there are 15 BYD K9UB BEs as a part of the EMT Madrid fleet operation. Additionally, EMT Madrid has approved a 35 million Euro investment for the purchase of 50 new EBs.
L.
The 25 EBs in Philadelphia were deployed in 2019, which California-based automaker Proterra built. This project is supported by the federal low or no emission vehicle program and Pennsylvania Act 89.
M.
A total of 25 EBs have been assigned to the Manali fleet. The EBs, on the other hand, only run for a limited period each year, and they plan to scale up the project is unclear.
N.
In late 2018, Santiago integrated 100 EBs, followed by another 100 in early 2019. However, it is unclear whether these new buses qualify as “bulk route operations”.
O.
Shenzhen is the world’s first major city to run an entirely EB fleet (around 16,000 EBs).
The chart in Table 1 and countries’ progression towards adoption EBs are related to GHG emissions. It can be seen that a small number of countries contribute most of the greenhouse gas emissions, and the top 10 emitters account for more than two-thirds of the global annual greenhouse gas emissions. Most of them also have huge populations and economies. Together, they account for more than 50% of the world’s population and nearly 60% of its GDP. Thus, the chart in Table 1 is in agreement with Figure 3 whereby China being the most advanced progress country with EBs, is the largest emitter, with 26% of global greenhouse gas emissions, followed by the US with 13%, the European countries with 7.8% and India with 6.7% [31,32].

3. EB Innovations in Malaysia

This section focuses primarily on Malaysian research and development companies that introduced EBs based on design-led innovations. These companies, such as Sync R&D, Malaysian Automotive Institute (MAI), and Go Auto-Higher, cooperated with the Malaysian Government to develop a more sustainable public transport system. It is essential to mention that the COVID 19 has affected many sectors, including industry, innovation, and transport section worldwide [33,34]. The new pandemic affects the EB innovations in Malaysia, as discussed in [35].

3.1. Sync R&D EB Prototype

Sync R&D is a Malaysian product development company established in 2006. This company introduced an EB prototype, known as Electric Bus Innovation Malaysia (EBM). To ensure that the EB prototype will not rust and has a lighter mass, the bus is constructed by assembling layers upon layers of monocoque fiberglass frames. These layers can also make the bus safer and sturdier in the event of an unfortunate incident. As shown in Figure 4, EBIM is 12 m long and can accommodate 40 passengers. For vehicle type approval, EBIM is designed following United Nations Economic Commission for Europe (UNECE) standards supplied by Automotive Engineering of Transport Department Malaysia. The interior and external parameters of the EBIM bus, which was used to develop the Malaysian drive cycle model, are shown in Table 2 [36]. The significant tests have been applied either on the road or in-house, as detailed in Table 3.

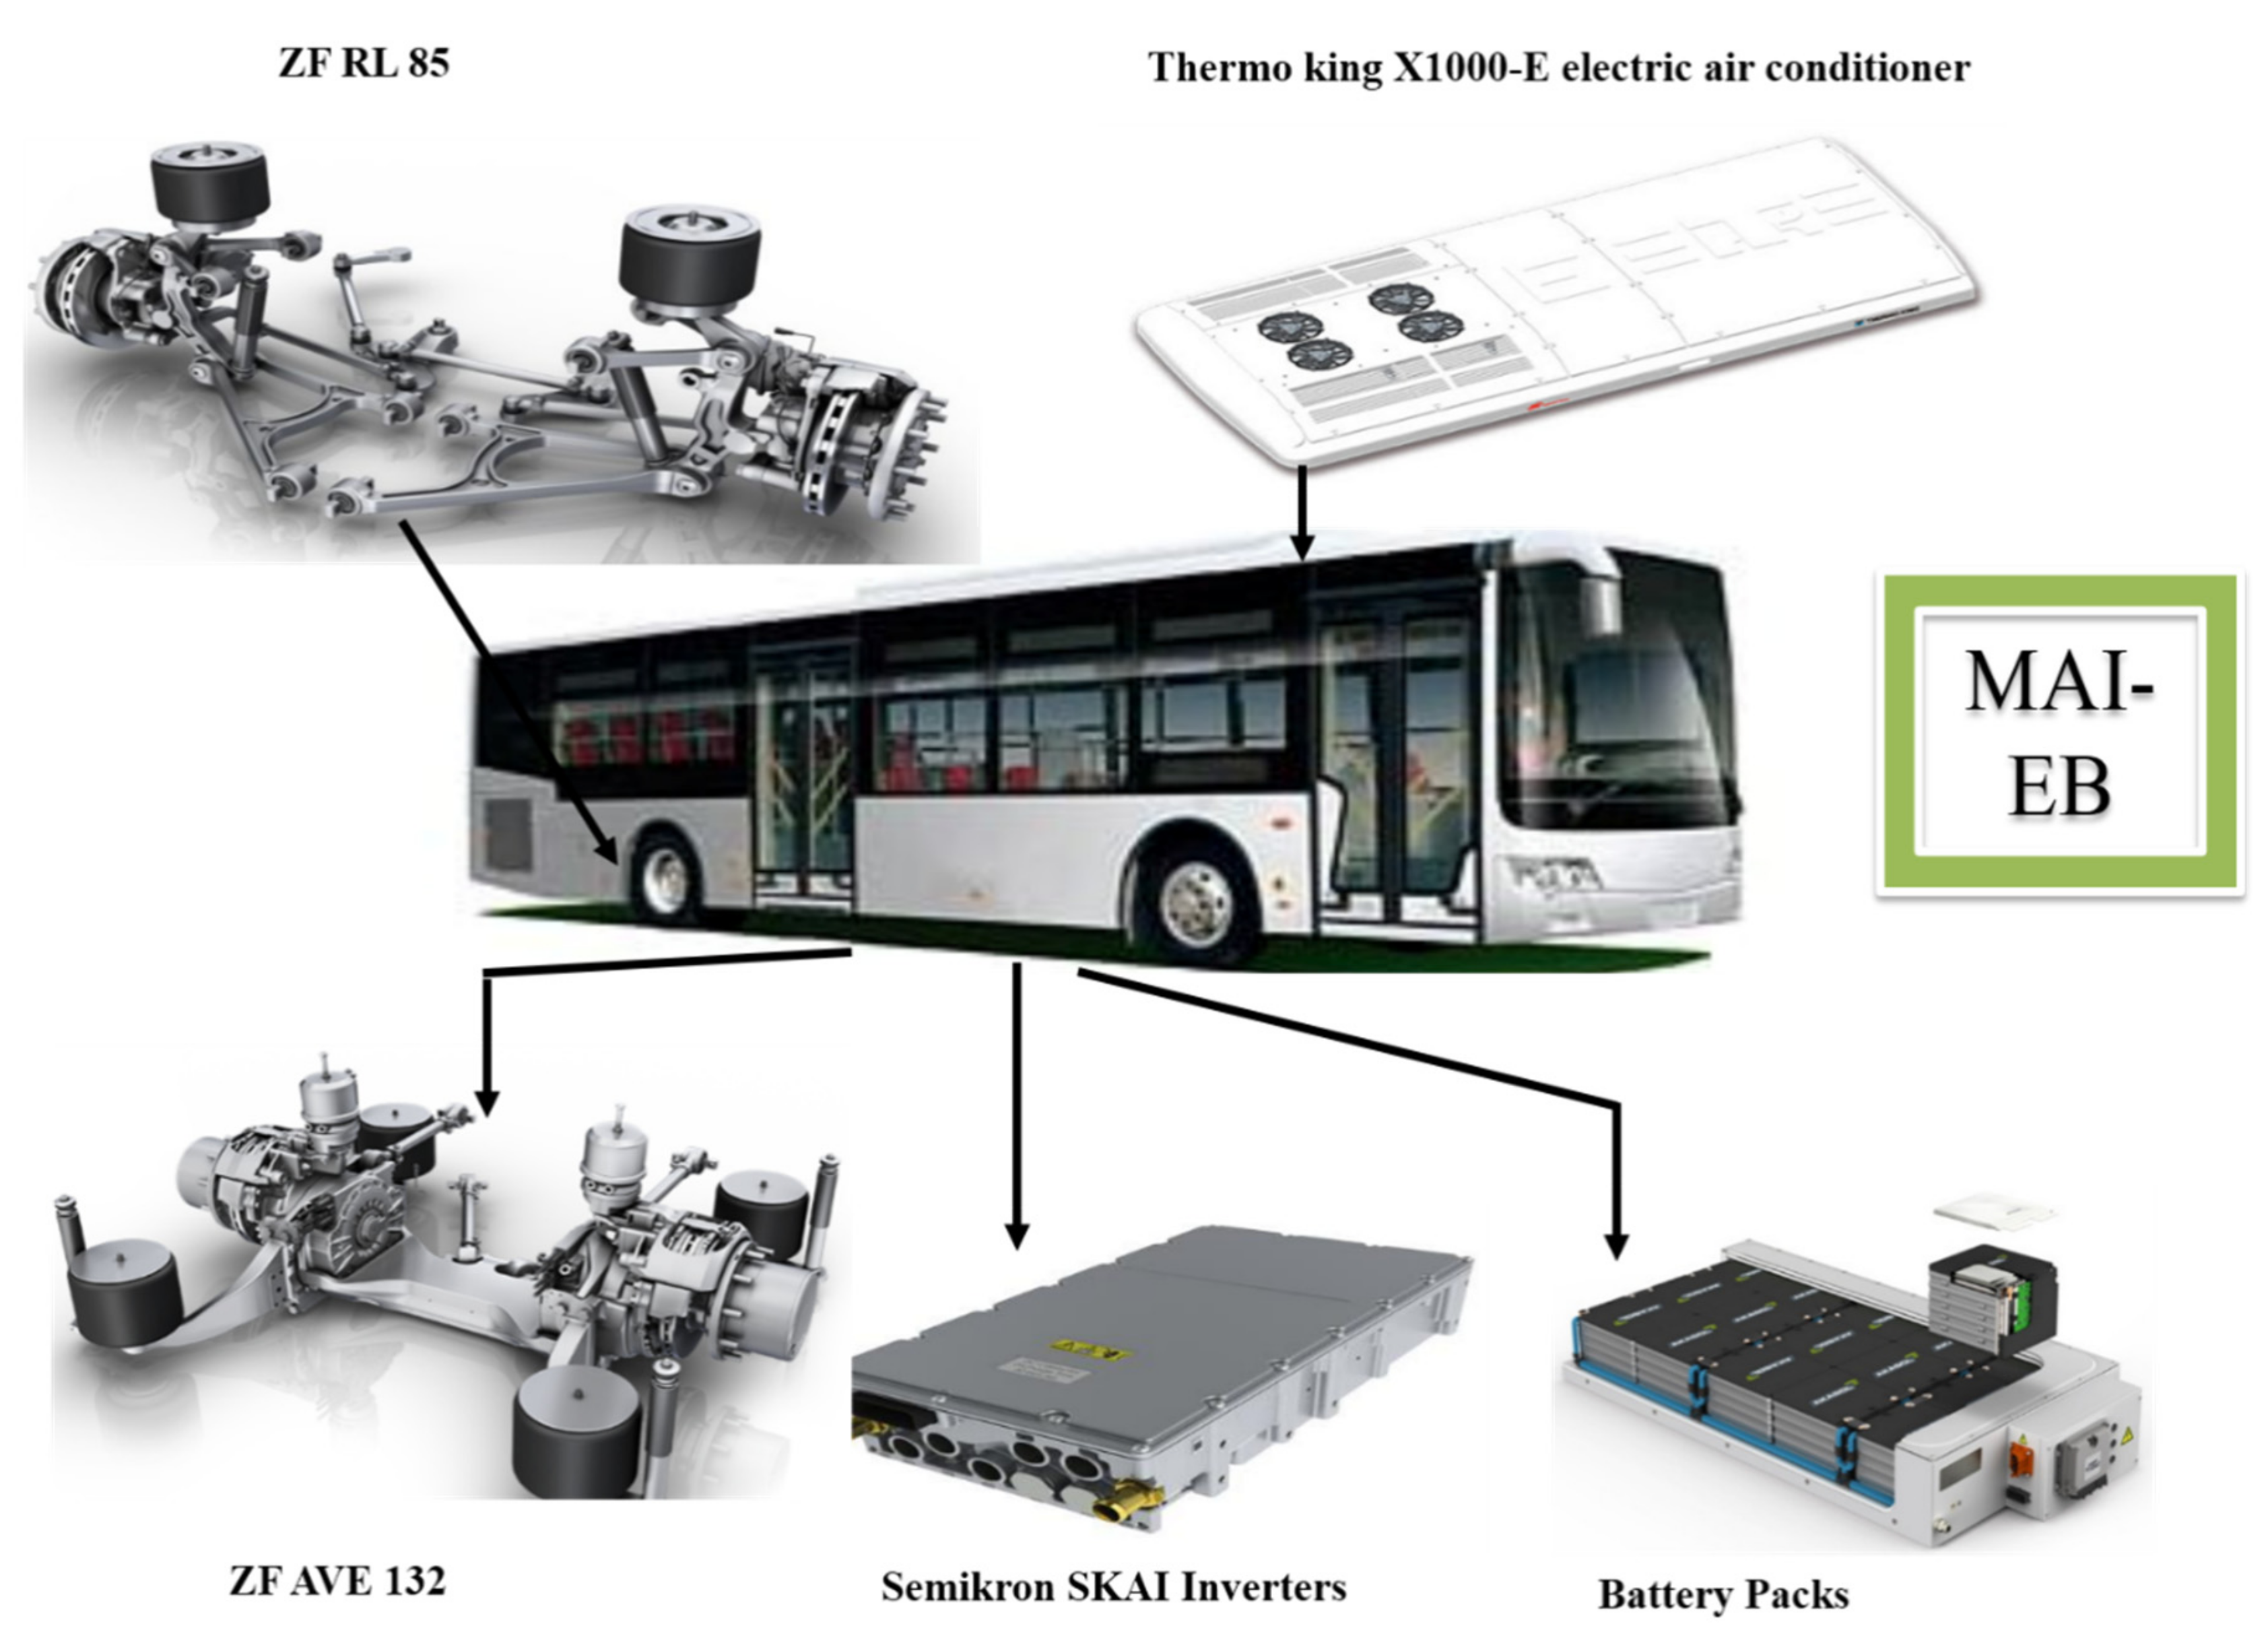
3.2. Malaysian Automotive Institute (MAI) EB Prototype

During the NAP 2014 Roadmap launch, MAI unveiled an electric bus prototype, as depicted in Figure 5. The bus includes a combined body and chassis and an ultra-low floor design for simple access and egress. The front and rear bumpers and the body panels are comprised of fiberglass, aluminum, or high-impact acrylonitrile butadiene styrene (ABS) plastic. The body panels are similarly designed for rapid replacement when damaged during work.
The MAI-EB prototype bus is powered by a modular set of three 633 V lithium-ion battery packs, customized to deliver 90 kWh, 180 kWh, or 270 kWh; this means that the bus may be made more versatile by adjusting the capacity of the 270-kWh configuration, which can make up for a single shift on an urban bus route and cover a range of about 200 km. In general, a battery management system (BMS) is used to keep track of the present state of the batteries and check that the batteries are firmly connected and disconnected when they are being charged [37]. The bus has regenerative braking technology, which is operated through supervisory controller systems and in charge of other subsystems (power steering, BMS, cooling, etc.). One of the vital management aspects of the BEB is scheduling. In this regard, optimal charging schedule planning for electric buses using aggregated day-ahead auction bids is proposed [38]. The results showed that the auction-based charging of all 22 buses outperforms as-soon-as-possible schedules by 7% to even 28% of daily cost savings using the aggregated bids.
Buses equipped with airbag suspension on both the front and rear axles help both the bus and its passengers by reducing the risk of overturning. In the front, we have a low floor axle, which is attached to a set of airbag suspension that has a 7000 kg rating, while in the rear, we have a whole electric axle, which is also connected to a group of airbag suspension that has an 11,000 kg rating [39]. The entire suspension system enables the bus to transport 65 passengers; additional technical information is shown in Table 4.

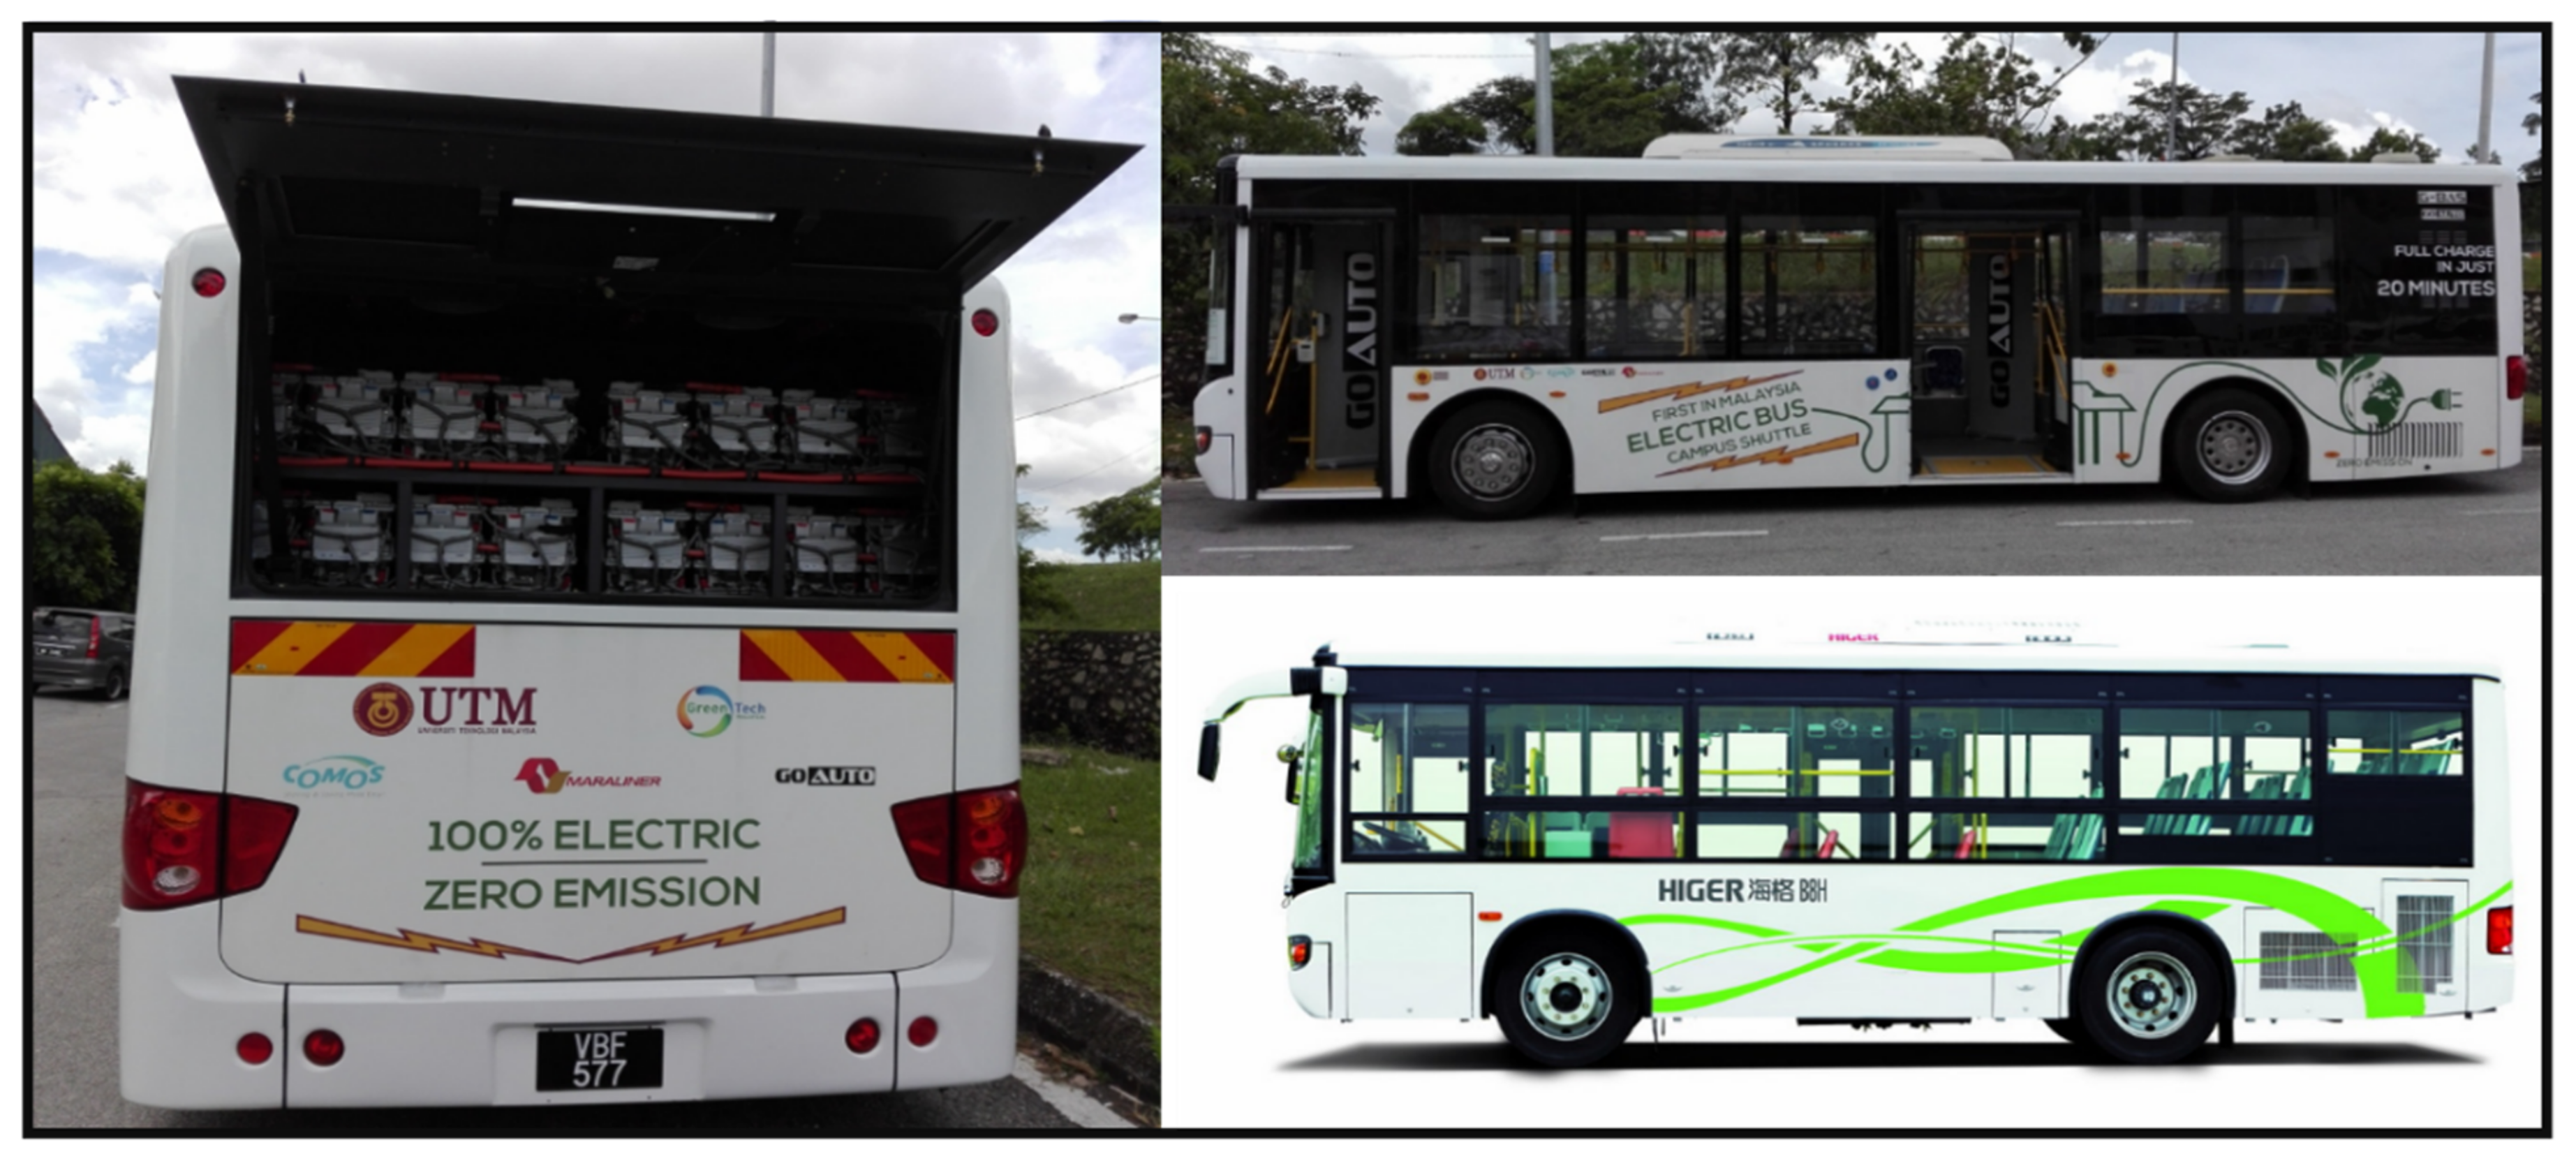
3.3. Go Auto-Higer EB Prototype

By the end of 2017, Go Auto, better known in Malaysia as the distributor for Haval automobiles, revealed plans to introduce completely electric buses. The collaborative venture with Higer Bus Company Ltd. and other electric vehicle component makers is also part of this electric bus project. The research led to developing an electric bus, which they first tested at UTM in Johor, Malaysia, as shown in Figure 6.
The Go Auto-Higher bus could be charged in less than twenty minutes using a special double plug configuration with a specific twin plug setup. The higher-designed bus employs a dual point to charge the vehicle twice as much. This dual charging system speeds up the charging process and provides flexibility. In places without such charging stations, the standard single plug outlet may be utilized, albeit with slower charging periods, because the individual batteries are at the bus’s rear high up [40].
As a result, based on the authors’ view of this study, the cooperation between Malaysian local companies with global companies such as ZF, Siemens, and BYD K9 companies will potentially increase the growth of EB deployments in Malaysia. For example, Siemens has cooperated with more than 50 countries, such as England, France, Russia, and Austria, to develop several EBs by providing their manufacturing components. This cooperation leads to an increase in EB adoptions in public transportation networks [41].

4. Electric Bus Technologies in Malaysia

Recently, many EB technologies have been launched in Malaysia by several manufacturing companies: New Energy and Industrial Technology Development Organization (NEDO), China’s Foshan Feichi Automobile Manufacturing Co Ltd., and BYD K9. The following section reviews these technologies accordingly in three Malaysian states; Putrajaya, Sarawak, and Melaka.

4.1. EB Technology in Putrajaya

Putra-NEDO EB project has been launched in Malaysia and Japan to replace fossil-fuel-powered buses with faster charge electric buses, as seen in Figure 7. This initiative entails the investment of 3.6 billion JPY (USD 360 million) over five years. NEDO provides financial support for the industry under the agency’s International Demonstration Project of Energy Consumption Efficiency Technology and System Demonstration. Two 23-km circular routes in Cyberjaya and Putrajaya each began running exclusively with eight single-deck buses labeled Nadiputra [42].
The buses are energized by Toshiba’s SCiB™ long-life and rechargeable lithium-ion battery. At Putrajaya Central Station, the chargers have been placed. Figure 7 shows how the Internet of things (IoT) networks observed the temperature of the battery, health condition, and electronic properties of the buses and chargers while they were in operation. Toshiba, HASETEC Corporation (manufacturer of Super-Quick Chargers), PUES Corporation (producer of electric power trains), and Oriental Consultants Global Company Limited (responsible for economic and environmental evaluation) are the projects partners [43,44].

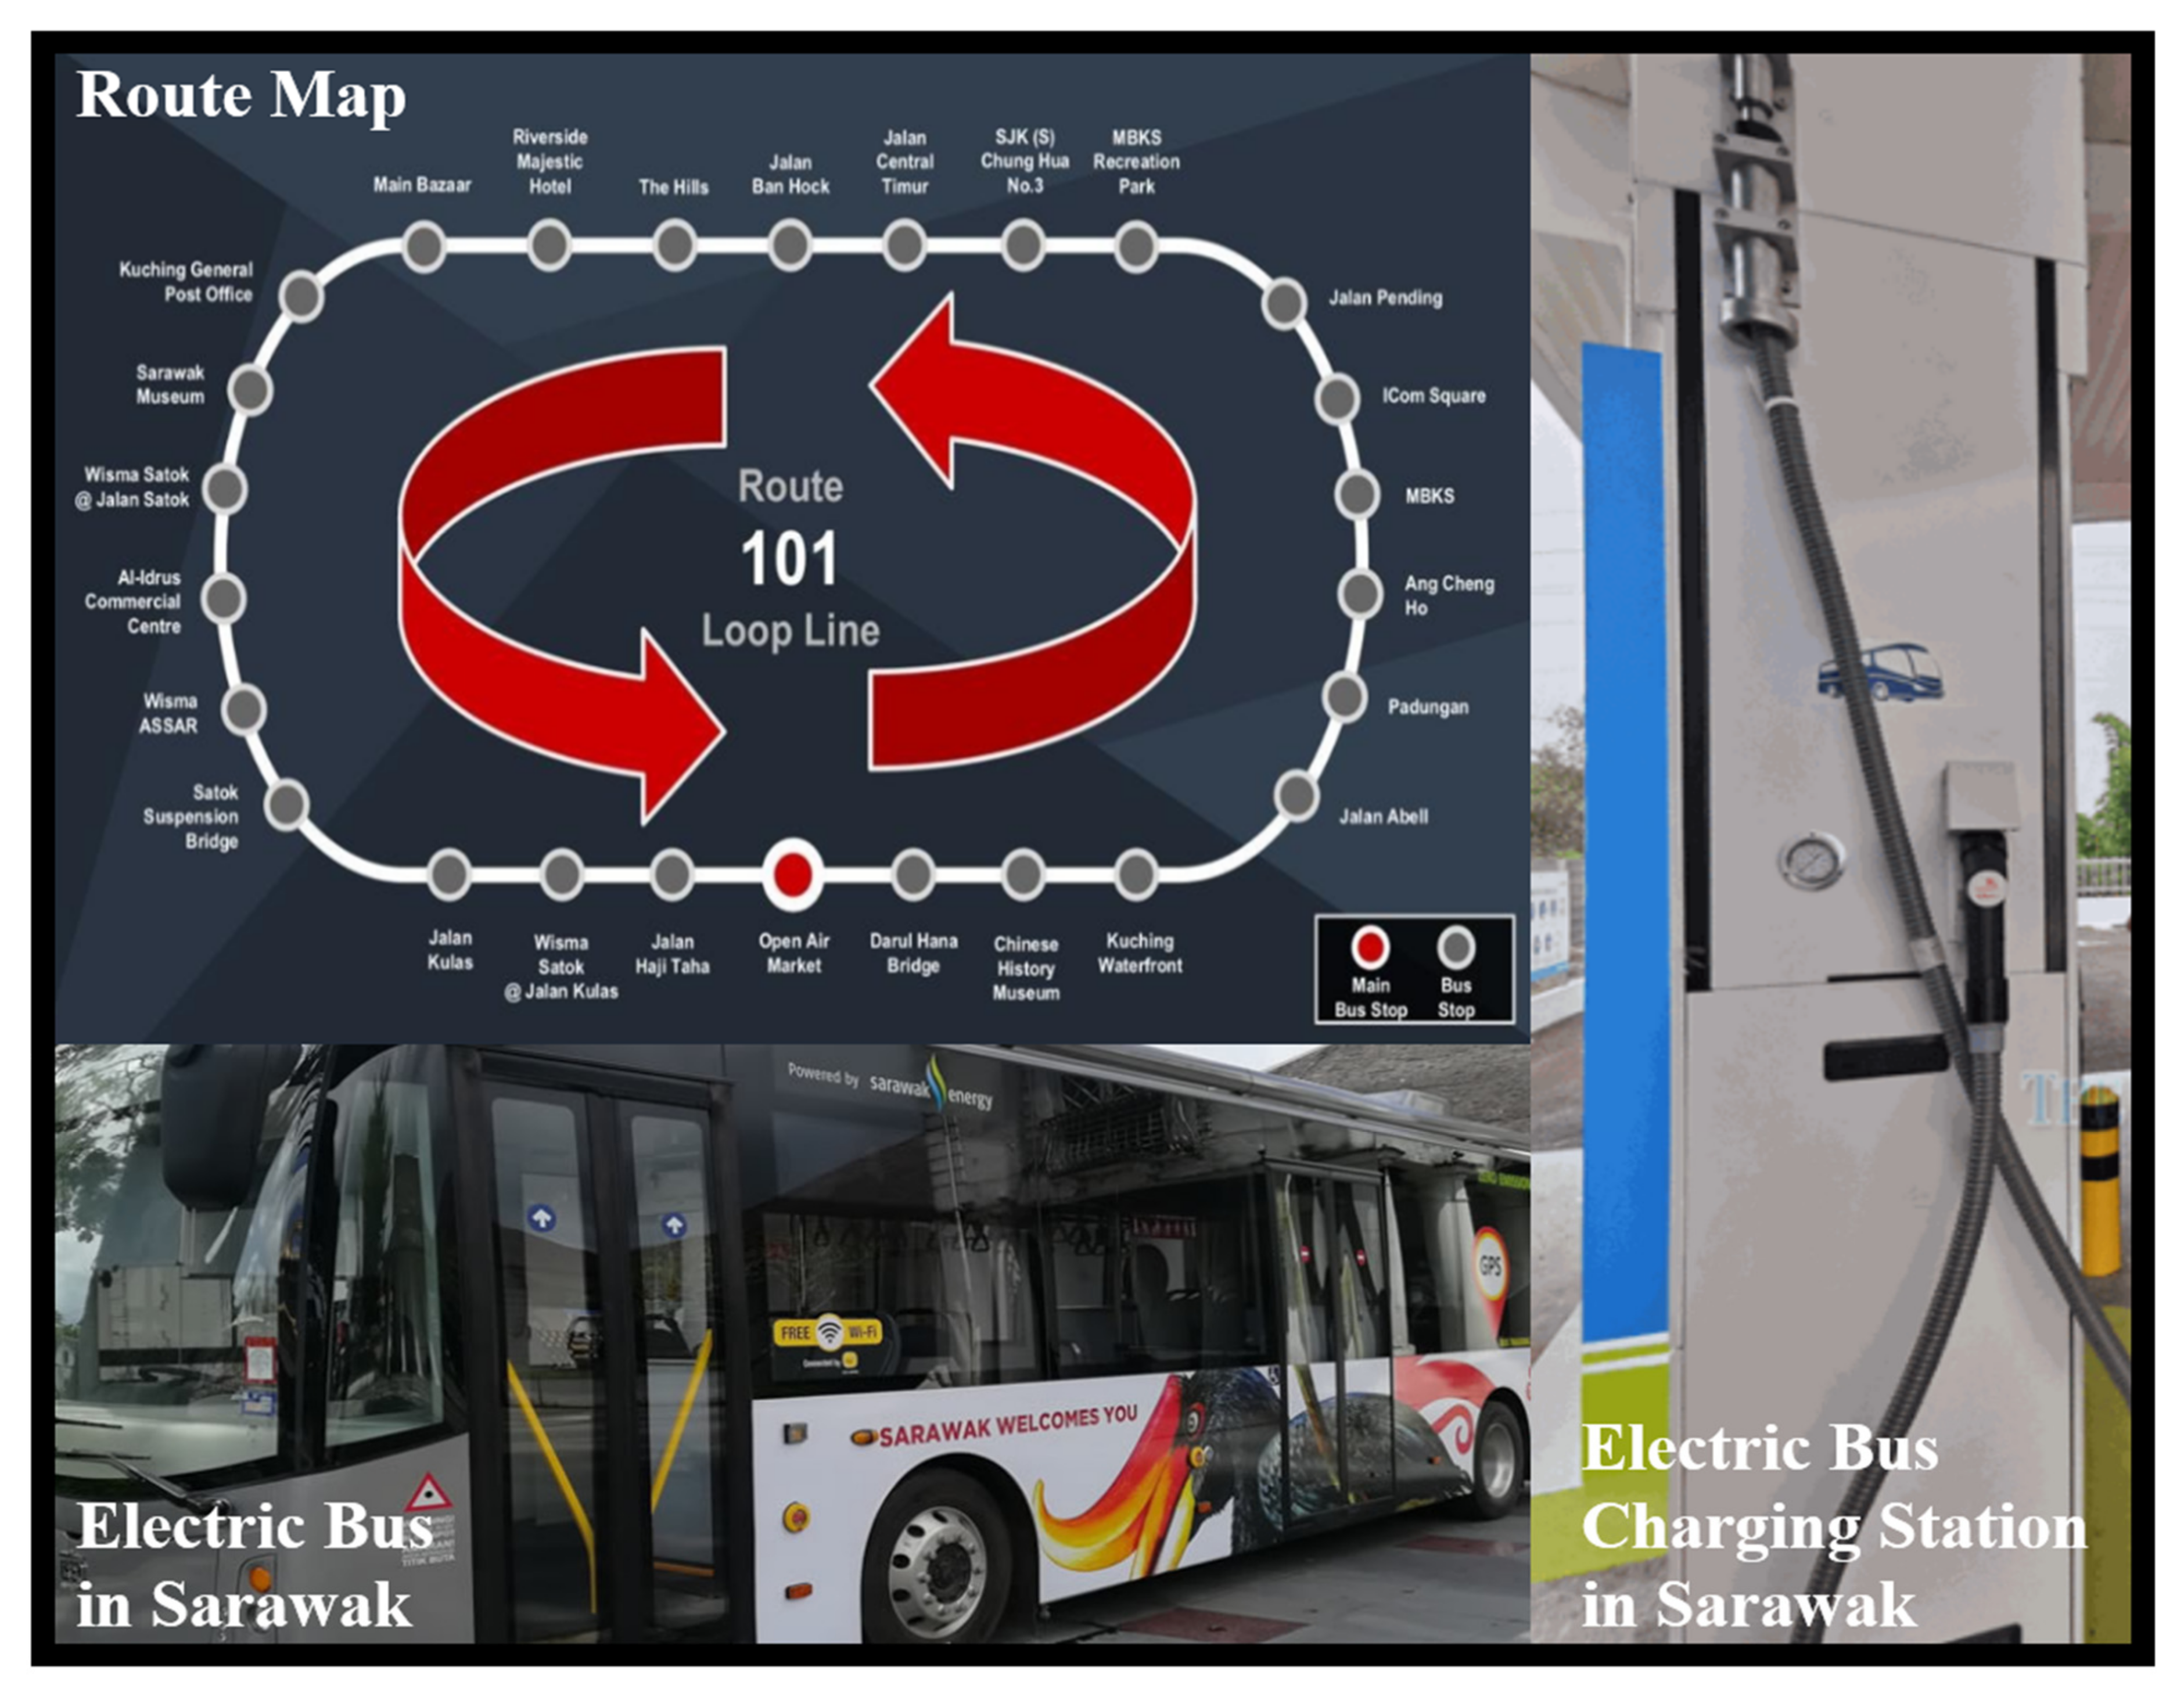
4.2. EB Technology in Sarawak

According to Sarawak’s plan to use clean energy to power all public transportation networks in the state, Kuching’s first electric bus technology was launched in 2019, as shown in Figure 8. The city of Kuching is the capital and the most populous city in the state of Sarawak in Malaysia. The bus service, which operates from 7 a.m. until 6 p.m. daily along with a loop line dubbed Route 101, can finish each loop in one hour, stopping at 20 points along the way. A total of 55 passengers can be accommodated on the bus, including 16 standing commuters and a wheelchair-bound. Along with standard city speed, the maximum bus speed is limited to 70 km/h, and it could be traveled up to 300 km with a single charge by using a fast-charging system of 300 kW. This bus is powered by dynamo battery cells, which are eco-friendly and equipped with safety features [45]. It is essential to mention that the charging infrastructure and fast-charging city electric bus service have become very important. In this regard, the primary and secondary problems are determining the fleet of electric buses and charging infrastructure and finding passenger-load balanced schedule of vehicles, as reported in [46]. However, the peak operating power of the electric grid for an electric bus fast-charging station is still a challenge. To relieve this issue, the authors in [47] proposed to install a stationary energy storage system and introduces an optimization problem for obtaining the optimal sizes of an energy buffer. The result shows that the electric grid’s operation capacity and electricity cost can be decreased significantly by installing a 325-kWh energy storage system in the case of a 99% satisfaction probability. Moreover, electric bus fleet composition and scheduling problem is introduced and modeled by [48]. In this study, multiple depots, vehicle types, and recharging technologies are jointly considered. The study concluded with valuable insights about electrification in public transit.

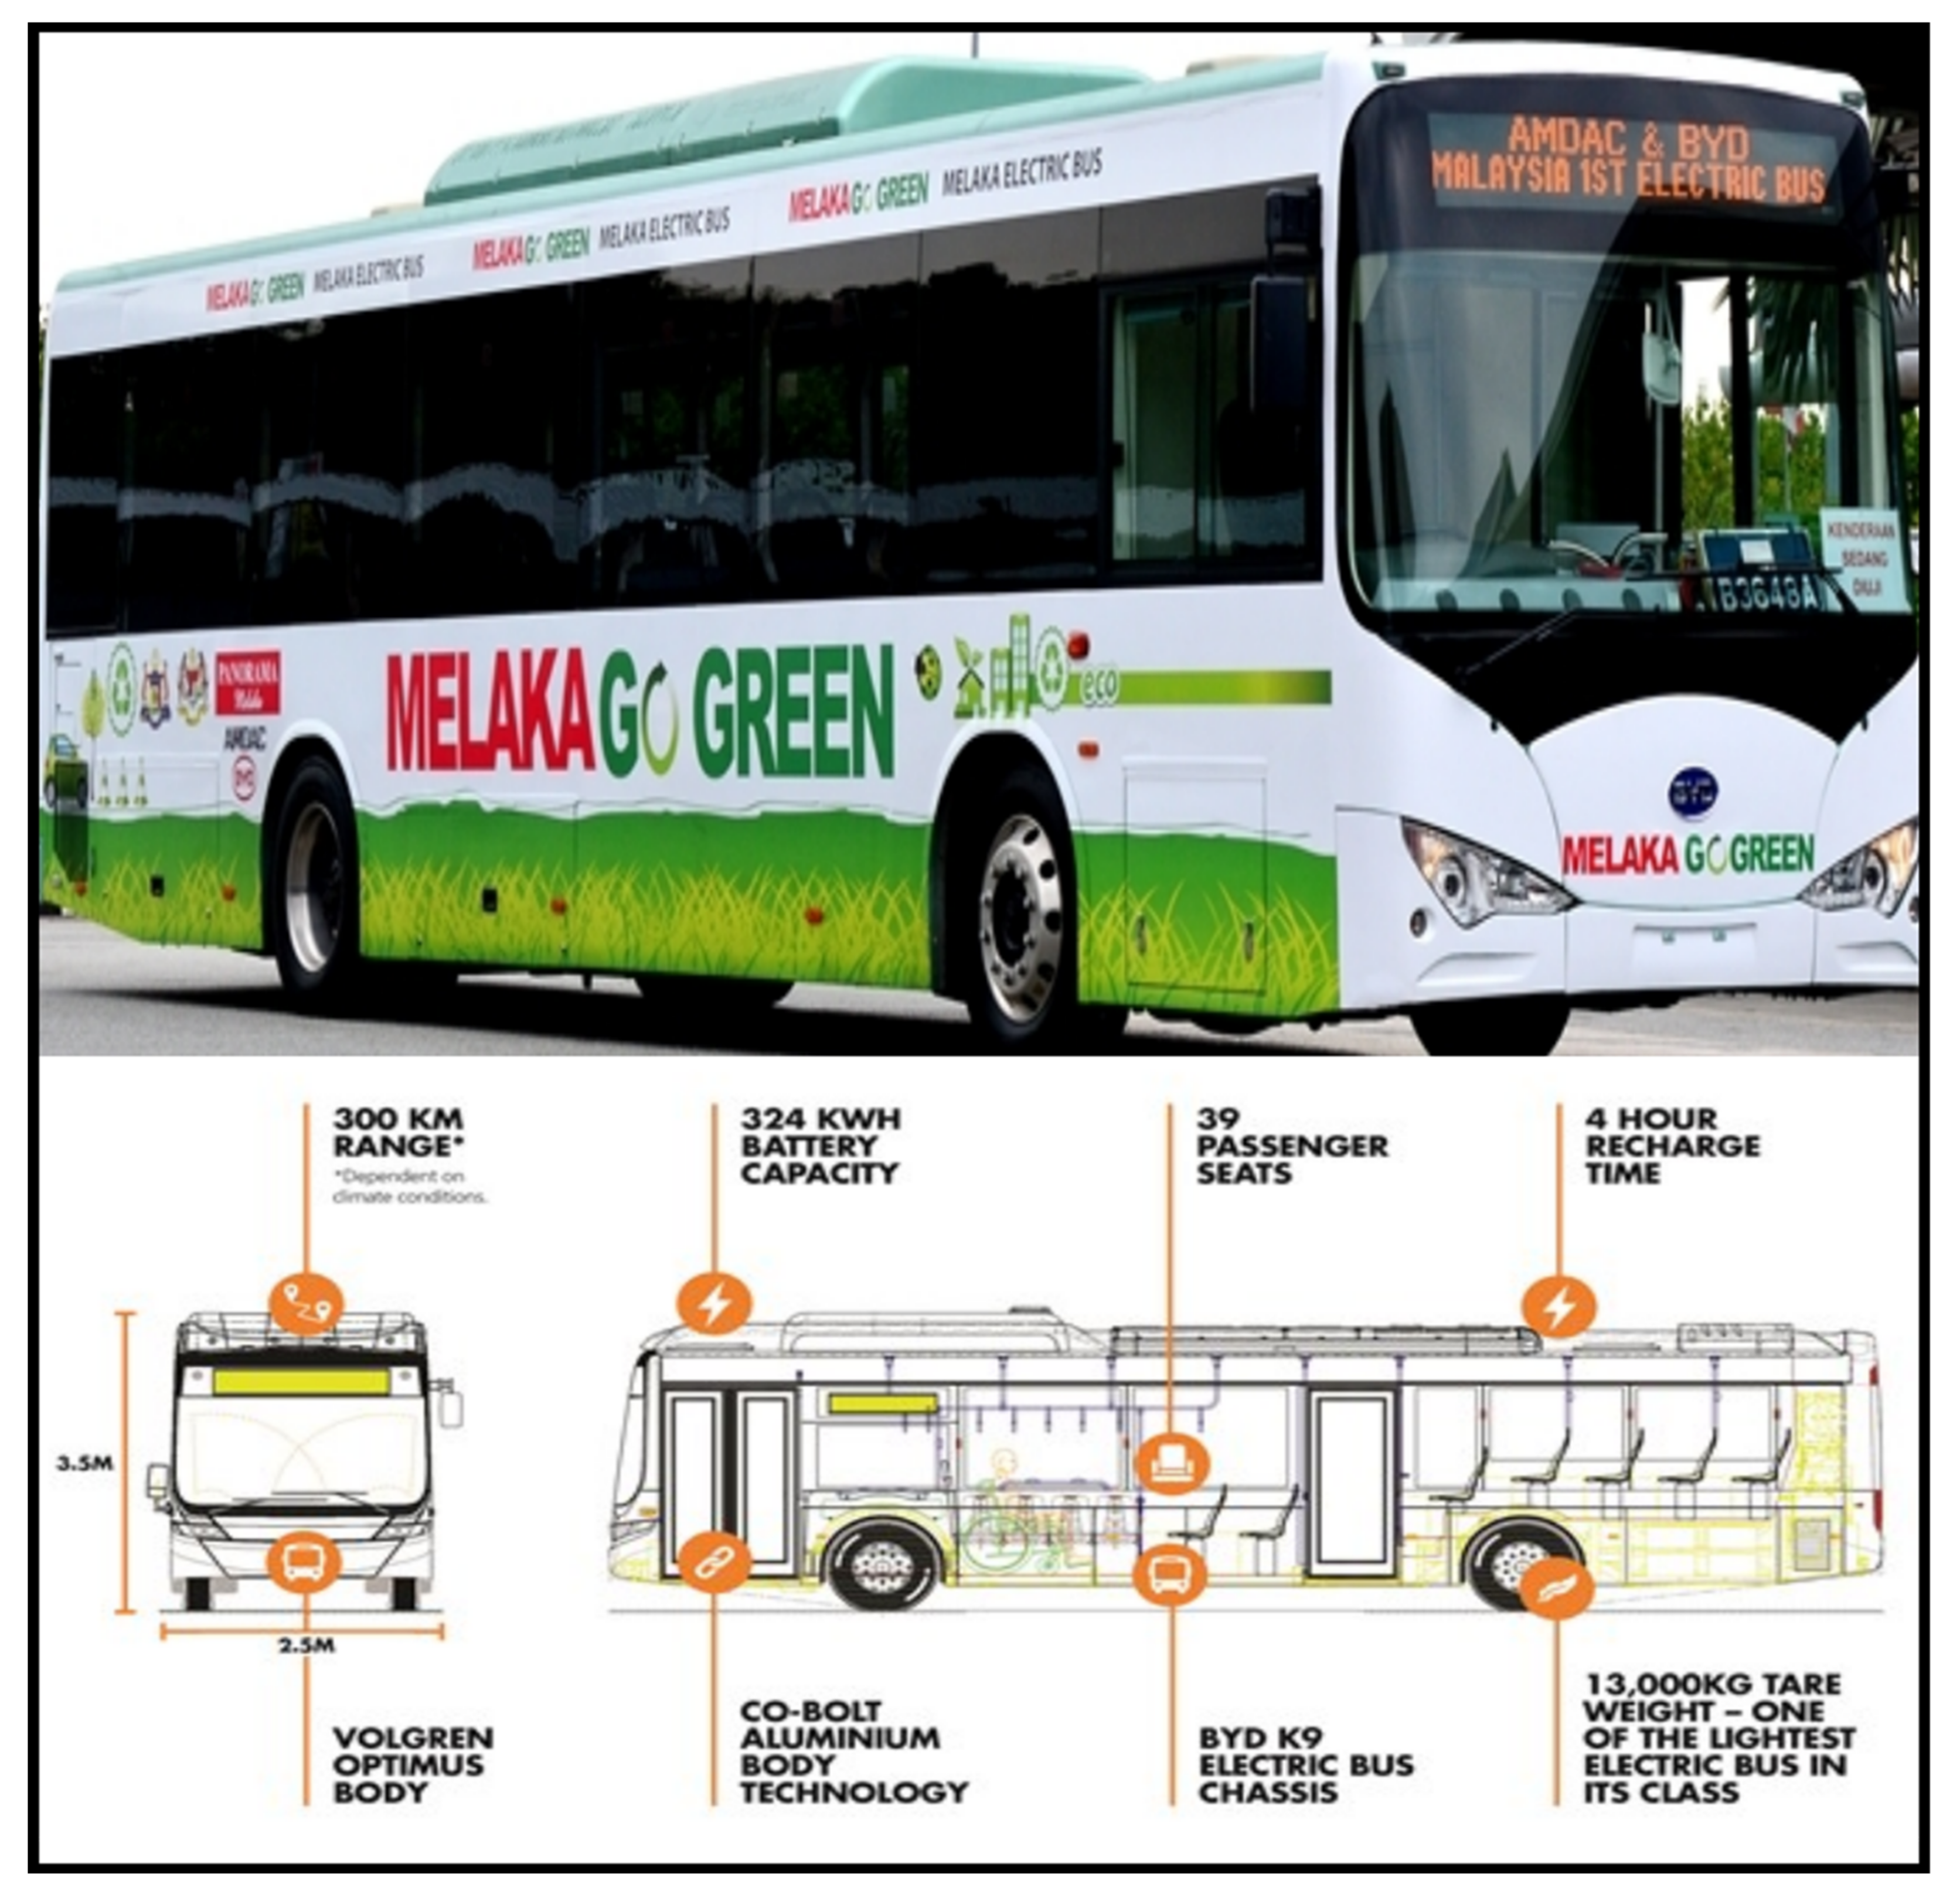
4.3. EB Technology in Melaka

The BYD K9 (also known as BYD Fe Battery or BYD eBus) is China’s new environmentally friendly technology electric bus. This bus currently operating in Melaka state uses lithium-iron phosphate batteries to power the bus, as shown in Figure 9. The bus could drive up to 250 km on a single charge of the batteries. A full charge would take roughly 5 h with a maximum power of 60 kW. Batteries rated at 324 kW produce an average of 70–80 kWh/second with an estimated of less than100 kWh/hour energy-consuming.
The batteries may be recharged about 6000 times, roughly 16 years if charged once per day. BYD’s charger is a three-phase system with a seven-pin plug and is rated at 150A. When the brakes are applied, regenerative power is generated. Nevertheless, the regenerative power is negligible in comparison to the storage capacity of the batteries. The 75 kWh permanent magnet synchronous in-wheel motor was merged with the AC synchronous brushless motor (BYDTYC90A) to improve acceleration performance. With 12 V of alternating current, the compressor may power all air tank-operated equipment such as the door, air conditioning, suspension, power steering, etc. Additionally, the Cooltech air conditioner can be used with an air conditioner. The temperature inside the bus, especially at the rear, may feel colder due to the lack of heat created. This unit (VIN: LC06S24S3D00000002) is Malaysia’s first electric bus, costing 1.35 million ringgit per unit [49].
By comparison, China has 99% of the world’s total (more than 400,000 EBs). That is because China has initiated prioritizing electrification of its public transport with subsidies and national regulations recently. Besides, several branches of the National Government that include the National Development and Reform Commission (NDRC), the Ministry of Science and Technology (MOST), the Ministry of Finance (MOF), and the Ministry of Industry and Information Technology (MIIT), are closely involved in defining the broad policy framework for EBs [50]. As a result, it is recommended to build an overall policy framework for EBs deployments and developments by employing various branches of the Malaysian Government.

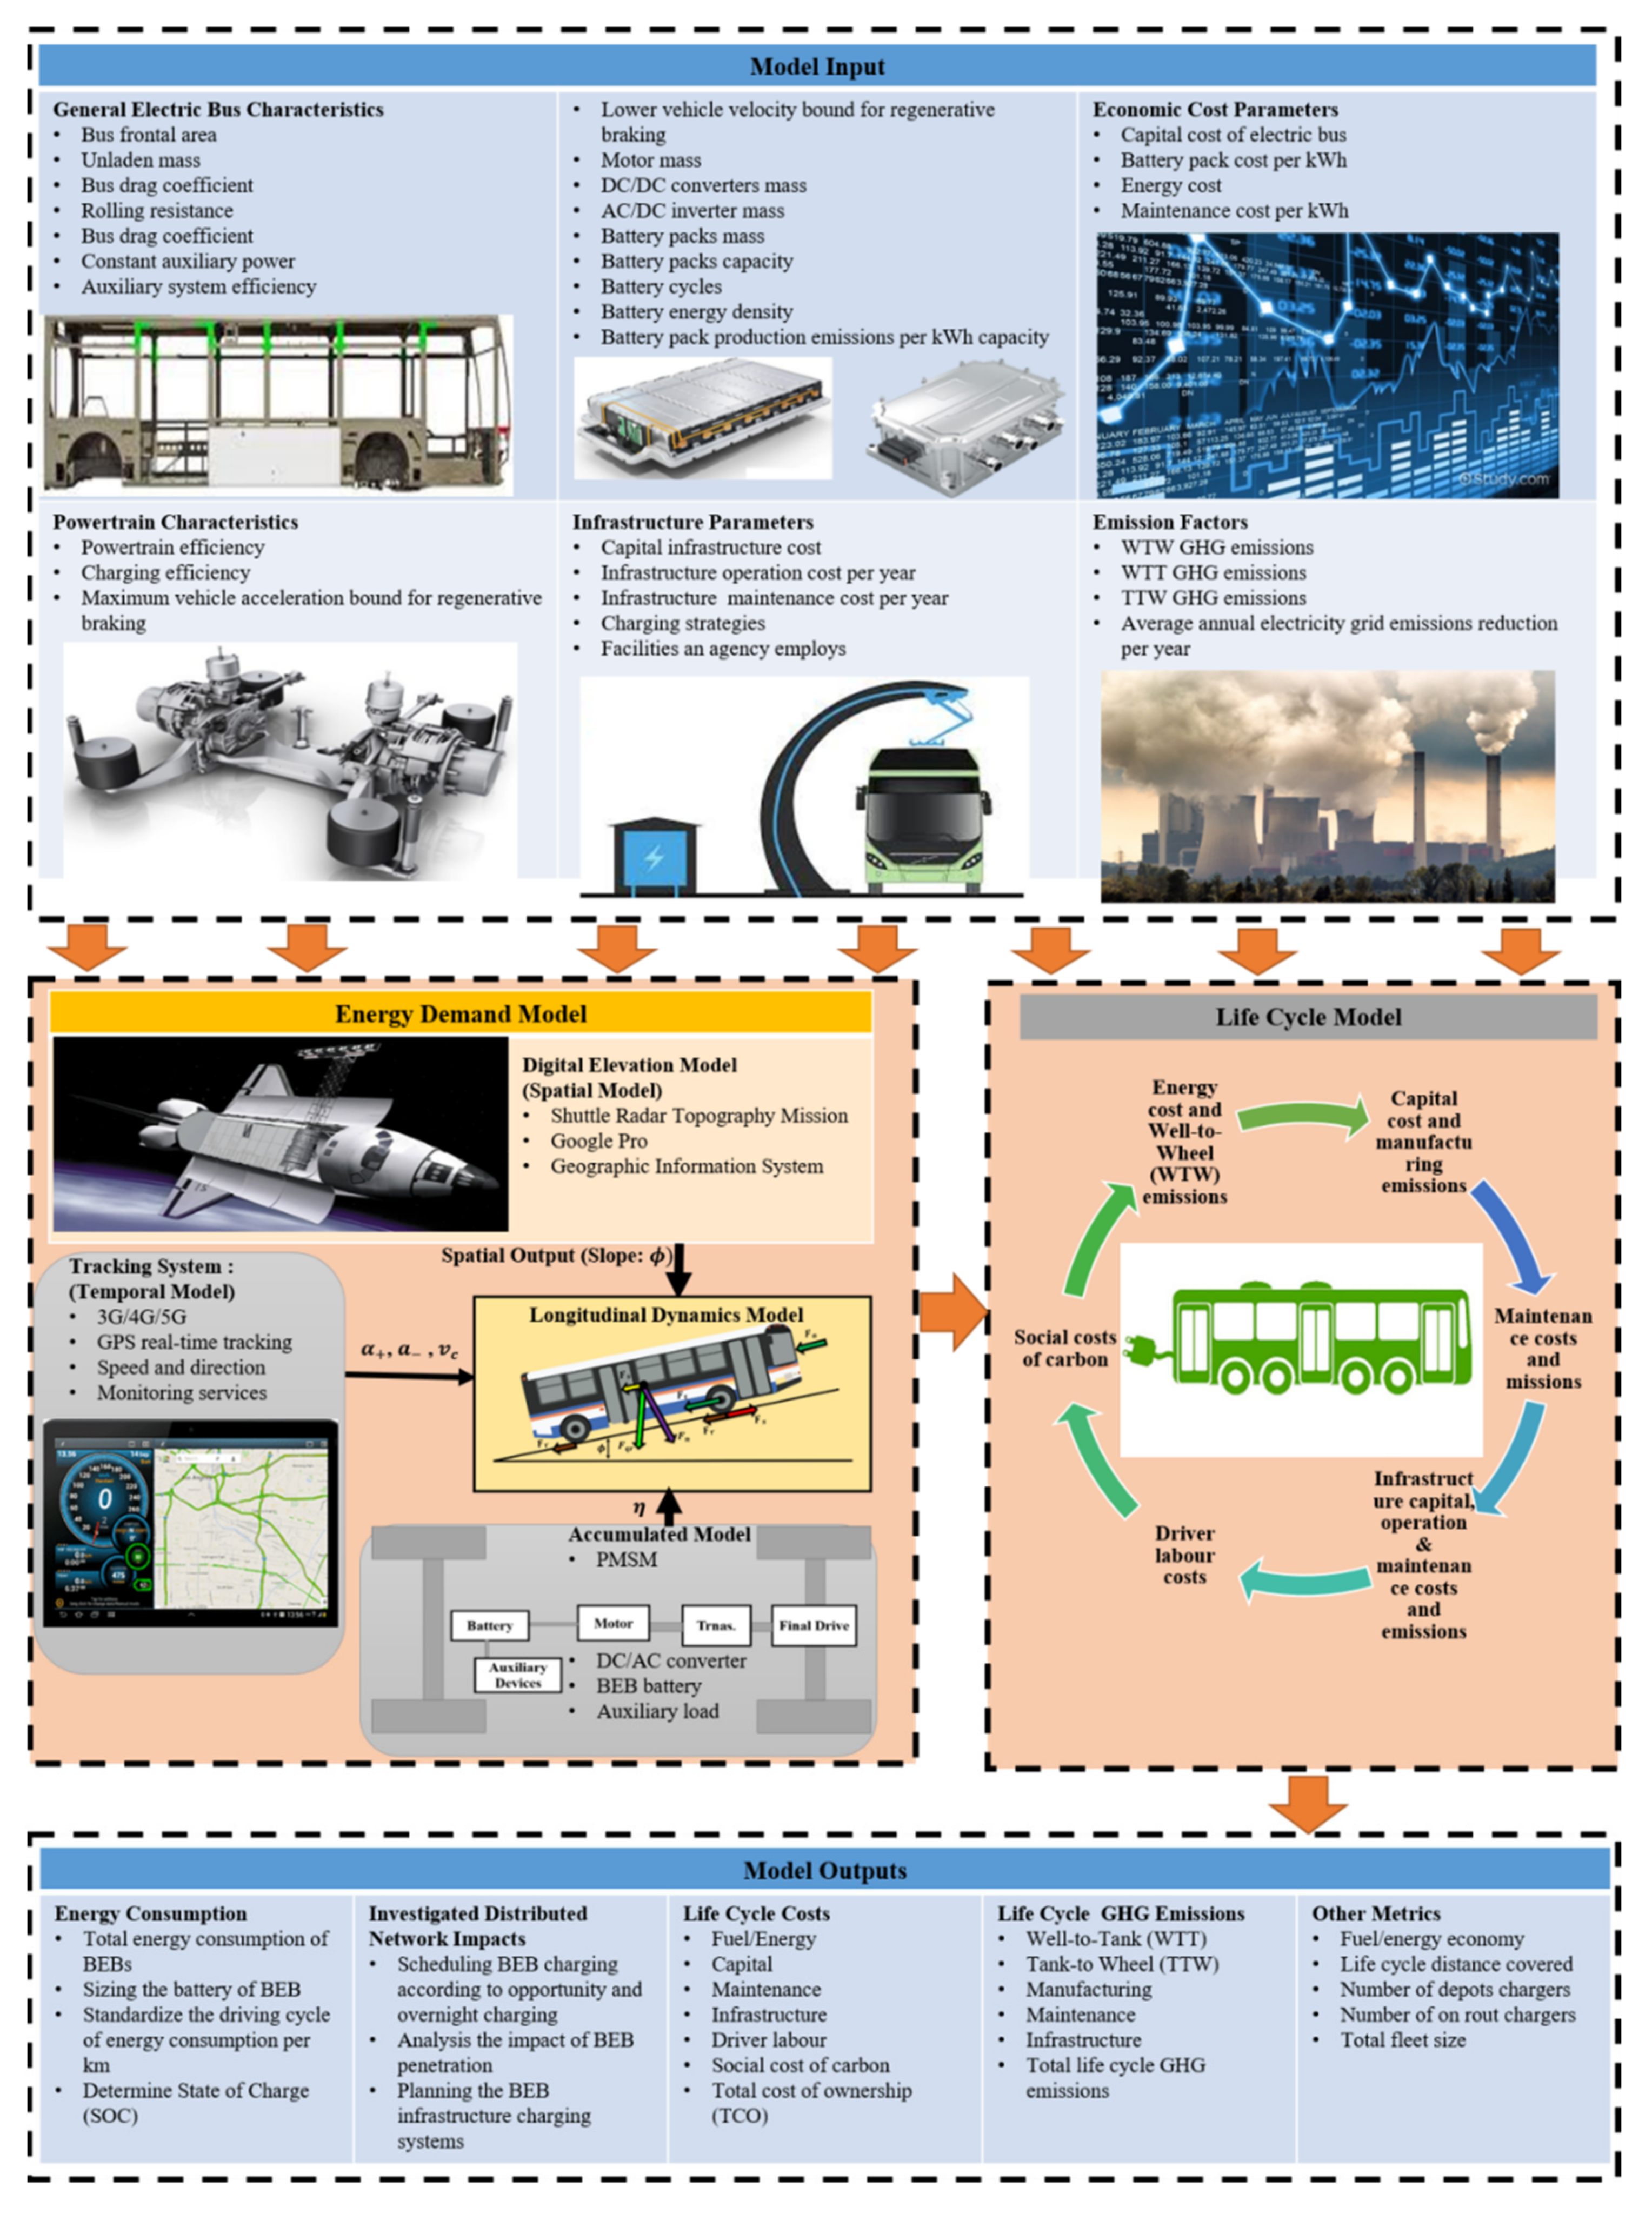
5. Life Cycle: Generic Framework

Initiating complementary EB technologies requires examination of life cycle benefits, risks, and impacts. Therefore, this study develops a generic framework of EBs life cycle by adopting the energy demand model into life cycle cost and GHG emissions, containing model inputs, processes models, and model outputs, as shown in Figure 10. In this context, the framework would be applied to further studies for investigating both economic and environmental impacts on EB deployments in Malaysia. The following overview of the key model capabilities focusing on energy demand and economic and environmental effects [51].

5.1. Model Inputs

As illustrated in Figure 10, a variety of inputs should be considered when using the framework. Thus, the model input characteristics, factors, and parameters are required, divided into five groups: general EB characteristics, powertrain characteristics, infrastructure parameters, economic cost parameters, and emission factors.

5.2. Process Model

In this section, the bus life cycle model incorporated with the bus dynamics model is discussed to estimate the energy consumption of a bus drive cycle that accounts for mass changes due to passengers or energy storage options. This estimation gives designers insights into the cycle advantages, risks, and consequences of a new EB technology at an earlier stage in the design process, enabling them to make more informed decisions.

5.2.1. Demand Model

Based on Figure 10, the total required driving force ( F x ) describes the bus movement, which can be expressed according to Newton’s second law based on four forces [24], which is as follows:
  • Aerodynamic Drag force ( F a )
The aerodynamic drag force is modeled as:
F a = 1 2 p C d A ( v w ) 2
where the aerodynamic drag coefficient   C d is a function of the relative wind direction, where the driving at high velocities reduces the influence of C d by using computational fluid dynamics (CFD). Whereas,   p is the density of air in k g m 3 , the value of p changes with variation in humidity and temperature. While A refers to the bus frontal cross-sectional area in m 2 , 𝑤 is the wind speed of the bus in the driving direction, expressed in miles per second.
  • Rolling Resistance Force ( F r )
The continuous deformation causes the rolling resistance force at the tire-road contact patch of the rolling pneumatic tire. Due to the viscous-elastic nature of the rubber in the tire, energy is lost in this process, resulting in a resistance force:
F r = C r M g cos ϕ
C r is the rolling resistance coefficient; M in k g is the total mass (passengers weights and bus mass), g is the acceleration due to gravity 9.81 m ( s 2 ) and ϕ is the angle of inclination in (rad).
  • Grade Force   F s
As illustrated in Figure 10, it can be seen that the road gradient influences the energy consumption, where the following equation can express grade force:
F s = M g sin ϕ
  • Transient Force F t
The transient force is required for accelerating or retarding the bus, which is as follows:
F t = M + m f d v d t
where m f is the fictive mass of rolling inertia in k g
  • Driving Force ( F x )
As a result, the driving force of the bus can be expressed as:
F x = F r + F s + F a + F t
or
F x = C r M g cos ϕ + M g sin ϕ 1 2 p C d A ( v w ) 2 + M + m f d v d t
The driving force of the bus can be expressed as:
F x = η P D C v
where η is the overall powertrain efficiency between battery and wheels, P D C is the electrical DC power drawn from the battery by the powertrain, and v is the vehicle velocity. Based on Equations (6) and (7), The vehicle dynamics equation gives the total mechanical energy required by the wheels as a function of the kinematic parameters governing bus movement, as follows:
E = η 3600 M g C r c o s ϕ + M g s i n ϕ + 1 2 p A C d v w 2 + M + m f d v d t d
where E is the mechanical energy needed at the wheels to drive on a distance d in   k W h , and d is the distance traveled.

5.2.2. Life Cycle Model

In this study, a hybrid n life cycle assessment (LCA) method along with life cycle costing (LCC) computations, applying process parameters (energy storage system (ESS) manufacturing factors, tank-to-wheel (TTW), and well-to-tank (WTT), emissions factors), and economic input–output (EIO)-LCA inputs (bus manufacturing, maintenance phases, and infrastructure manufacturing and operation). Based on Figure 10, the LCC models are mathematically formulated and discussed in detail for the further extension of research, as follows:
  • Capital Costs
The capital costs include the total costs of the charging equipment ( C c h g ) , the purchase costs of an EB ( C b u s ) , and the salvage value of the charging equipment and EBs ( C S V ) , which can be defined as follows [52]:
C C A P = C c h g + N b u s C b u s C S V
where   N b u s is the total number of EBs in a fleet.
  • Operational Costs
The operations costs ( C O P ) consist of maintenance, energy, and emission costs. Annually, the calculation of the operational costs can be defined as:
C O P = j = 0 T N b u s D j ( C n r j j + C m j C c o 2 _ j C c h m c h ) × ( 1 + d r a t e ) 1
where T is the total time of LCA, D j is the annual total driven distance, C n r j j is the yearly energy cost, C m j is the yearly maintenance cost, C c o 2 j is the yearly emission costs (CO2 emission), C c h is the yearly cost of charging equipment, and 1 + d r a t e is the discount rate.
  • Labor Costs
Although driver labor costs frequently constitute the majority of operational costs, wages are neglected in various previous studies that applied for calculating the total cost of ownership (TCO). However, in this framework, driver labor costs are considered to provide a potentially comparative assessment of a larger-scale fleet. In [53], the authors reported that driver labor costs dominate the EB fleet TCO, making up 56–74% of TCO.
  • Social Costs of Carbon (CCS)
In this framework, the SCC is determined to establish the incremental change of carbon emission, which can assess climate policies. More detailed descriptions of CCS evaluation can be found in [53].

5.3. Model Outputs

The key performance metrics include calculated EBs energy demand, investigated EBs charging impacts on a power grid, determining life cycle costs, computed life cycle GHG emissions, and examined other metrics that would be obtained by using the framework above, as detailed in model outputs of Figure 10.

6. Discussion

The examples presented in this paper highlight the implications of Malaysia’s policies to popularize the implementation of battery-powered mass transportation. Three highlighted implementations were mentioned: Putra-NEDO EB, the Sarawak EB project, and the BYD K9. Three prototypes were developed for future deployment, namely Sync R&D EB, MAI EB, and Go Auto-Higher EB. As highlighted in Table 1, there has been an overarching ambiguity regarding the results of deploying the implementations above of EBs in Malaysia. This ambiguity may cause hesitation regarding taking initiatives regarding setting policies in other states and territories since there have not been published outcomes regarding the financial viability of these initiatives. It is worth mentioning that most of the deployed projects are implemented on a small-scale operation, which may result in flattering feasibility of operations because the selected routes are more likely to be populous. Conversely, less populous ways may not present the best financial returns. However, the loads posed by less populated roads are likely to cause the busses to demonstrate better overall results such as reliability and charging intervals.
Furthermore, the lack of large-scale implementations suggest that the policies developed in Malaysia may not be as encouraging to private sector partners yet to take part in the transition to the electric mass transportation, a transparent approach to the results of the small-scale implementations may encourage private sector partners, therefore, democratizing the technology by making the early-stage implementation data widely available. Moreover, the manufacturing of EBs is technically challenging; thus, collaboration with international manufacturers to set up large-scale manufacturing plants may accelerate the transition process. This can be seen in the development of the (Go Auto-Higher EB) project, whereby the collaboration took place since the early stages of the project [40]. While they have been under development for a considerable amount of time, prototypes are still reliant on third-party suppliers for prototyping; therefore, when transitioning to manufacturing and deployment, they are restricted by the supply of the parts from those third-party manufacturers. While some of these parts are replaceable, others such as control chips and processing devices might be more challenging to source due to a potential global shortage in computing devices, such as the ongoing shortage in computing devices that Malaysia lacks manufacturing prowess [54,55]. Therefore, forming long-term partnerships with manufacturers of computing devices can ensure that there will not be any potential future shortages.

7. Limitations and Future Works

The present study has few limitations that need to be considered by future researchers. First, this study focuses on EB in a specific country (Malaysia). Future research is encouraged to include other countries such as Singapore, Taiwan, and Thailand in a comparative study highlighting the differences in implementations, policies, and other governmental mandates. Second, this study considers big vehicles (EB) only. Future research is encouraged to consider different transportation types. Third, the limited availability of publicly available data regarding past implementations of Malaysia’s attempts to deploy EBs meant that this paper’s findings are finite. Future researchers are encouraged to approach governmental and third-party agencies for any potential insights regarding the lessons learned of these initiatives above. Finally, although the present study provides valuable insights into the relevant area, future researchers could make enhancements to facilitate load balancing, regulate frequency and voltage, lower peak loads, and increase renewable energy usage. Therefore, an optimization method should develop to determine the optimal photovoltaic-grid-BEB charging component size.

8. Conclusion and Policy Implications

8.1. Policy Implications and Suggestions

In addition to reducing oil dependency, the electrification of the road transportation sector is widely considered a promising solution for mitigating the environmental impact of transportation systems. However, the road transportation sector’s electrification without replacing fossil-fuel power generation leads to the infelicitous outcome of increasing carbon dioxide emissions instead of meeting low-carbon targets. To date, Malaysia’s power generation is heavily dependent on coal and natural gas, where the electricity generation for Peninsular Malaysia, as reported by the Energy Commission (EC) of Malaysia, is mainly provided by 57% of coal and 34 of natural gas, as shown in Figure 11. Therefore, replacing diesel and natural gas buses with EBs will not be a beneficial solution for mitigating GHG emissions from the Malaysian transport sector until the power grid is sufficiently decarbonized. For the Government to deploy renewable energy as part of its national electricity generation, it must be highly supported by Government proper alignment incentives and Government policies, regulations, and implementations [54].

8.2. Conclusions

Bus manufacturers highly recommend the EB because of its potential replacements in reducing global warming and GHG emissions. Thus, in this study, the EB deployments in Malaysia have been comprehensively discussed, including EB roadmap policies, innovations, and technologies. This paper highlighted the main targets of NAP 2014 and NAP 2020 that guided EB deployments in Malaysia. This paper intensely reviewed current research and development companies that developed EB prototypes, including Sync R, MAI, and Go Auto-Higher. In addition, this study listed and deliberated the EB technologies that have been adopted in three Malaysian states, known as Putrajaya, Sarawak, Melaka. In this study, the researchers proposed a generic framework of LCA, which in turn could benefit the researchers interested in developing a model for EB-LCB in Malaysia and worldwide.

Author Contributions

Conceptualization: A.S.A.-O.; Investigation: M.A.A., T.S.B., Y.H., A.A., A.A.-S., and A.Q.A.-S.; Project Administration: T.S.B. and A.Q.A.-S.; Resources: A.S.A.-O., Y.H., M.A.A., and A.A.; Supervision: A.S.A.-O., A.Q.A.-S. and T.S.B.; Visualization: M.A.A. and A.S.A.-O.; Writing—Original Draft: A.S.A.-O. and A.Q.A.-S.; Writing—Review & Editing: A.S.A.-O., A.Q.A.-S., Y.H., T.S.B. and A.A.-S.; Software: A.A., and A.A.-S. All authors have read and agreed to the published version of the manuscript.

Funding

Authors have received no external funding.

Institutional Review Board Statement

Not applicable.

Informed Consent Statement

Not applicable.

Data Availability Statement

Not applicable.

Conflicts of Interest

The authors declare that they have no known competing financial interests or personal relationships that could have appeared to influence the work reported in this paper.

References

  1. IEA. Global Energy Review. 2020. Available online: https://www.iea.org/reports/global-energy-review-2020/renewables (accessed on 13 September 2020).
  2. Van Velzen, A.; Annema, J.A.; van de Kaa, G.; van Wee, B. Proposing a more comprehensive future total cost of ownership estimation framework for electric vehicles. Energy Policy 2019, 129, 1034–1046. [Google Scholar] [CrossRef]
  3. Shahid, S.; Minhans, A.; Puan, O.C. Assessment of Greenhouse Gas Emission Reduction Measures in Transportation Sector of Malaysia. J. Teknol. 2014, 70, 1–8. [Google Scholar] [CrossRef] [Green Version]
  4. Ghosh, A. Possibilities and Challenges for the Inclusion of the Electric Vehicle (EV) to Reduce the Carbon Footprint in the Transport Sector: A Review. Energies 2020, 13, 2602. [Google Scholar] [CrossRef]
  5. Hannan, M.; Al-Shetwi, A.Q.; Begum, R.; Ker, P.J.; Rahman, S.; Mansor, M.; Mia, M.; Muttaqi, K.; Dong, Z. Impact assessment of battery energy storage systems towards achieving sustainable development goals. J. Energy Storage 2021, 42, 103040. [Google Scholar] [CrossRef]
  6. Połom, M.; Wiśniewski, P. Assessment of the Emission of Pollutants from Public Transport Based on the Example of Diesel Buses and Trolleybuses in Gdynia and Sopot. Int. J. Environ. Res. Public Health 2021, 18, 8379. [Google Scholar] [CrossRef] [PubMed]
  7. Połom, M.; Wiśniewski, P. Implementing Electromobility in Public Transport in Poland in 1990–2020. A Review of Experiences and Evaluation of the Current Development Directions. Sustainability 2021, 13, 4009. [Google Scholar] [CrossRef]
  8. Połom, M. E-revolution in post-communist country? A critical review of electric public transport development in Poland. Energy Res. Soc. Sci. 2021, 80, 102227. [Google Scholar] [CrossRef]
  9. Kim, H.; Hartmann, N.; Zeller, M.; Luise, R.; Soylu, T. Comparative TCO Analysis of Battery Electric and Hydrogen Fuel Cell Buses for Public Transport System in Small to Midsize Cities. Energies 2021, 14, 4384. [Google Scholar] [CrossRef]
  10. Muratori, M. Impact of uncoordinated plug-in electric vehicle charging on residential power demand. Nat. Energy 2018, 3, 193–201. [Google Scholar] [CrossRef]
  11. Teoh, L.E.; Khoo, H.L.; Goh, S.Y.; Chong, L.M. Scenario-based electric bus operation: A case study of Putrajaya, Malaysia. Int. J. Transp. Sci. Technol. 2018, 7, 10–25. [Google Scholar] [CrossRef]
  12. Elgowainy, A.; Rousseau, A.; Wang, M.; Ruth, M.; Andress, D.; Ward, J.; Joseck, F.; Nguyen, T.; Das, S. Cost of ownership and well-to-wheels carbon emissions/oil use of alternative fuels and advanced light-duty vehicle technologies. Energy Sustain. Dev. 2013, 17, 626–641. [Google Scholar] [CrossRef]
  13. Jwa, K.; Lim, O. Comparative life cycle assessment of lithium-ion battery electric bus and Diesel bus from well to wheel. Energy Procedia 2018, 145, 223–227. [Google Scholar] [CrossRef]
  14. Bhattacharjee, A.; Mohanty, R.; Ghosh, A. Design of an Optimized Thermal Management System for Li-ion Batteries under Different Discharging Conditions. Energies 2020, 13, 5695. [Google Scholar] [CrossRef]
  15. Wang, J.; Kang, L.; Liu, Y. Optimal scheduling for electric bus fleets based on dynamic programming approach by considering battery capacity fade. Renew. Sustain. Energy Rev. 2020, 130, 109978. [Google Scholar] [CrossRef]
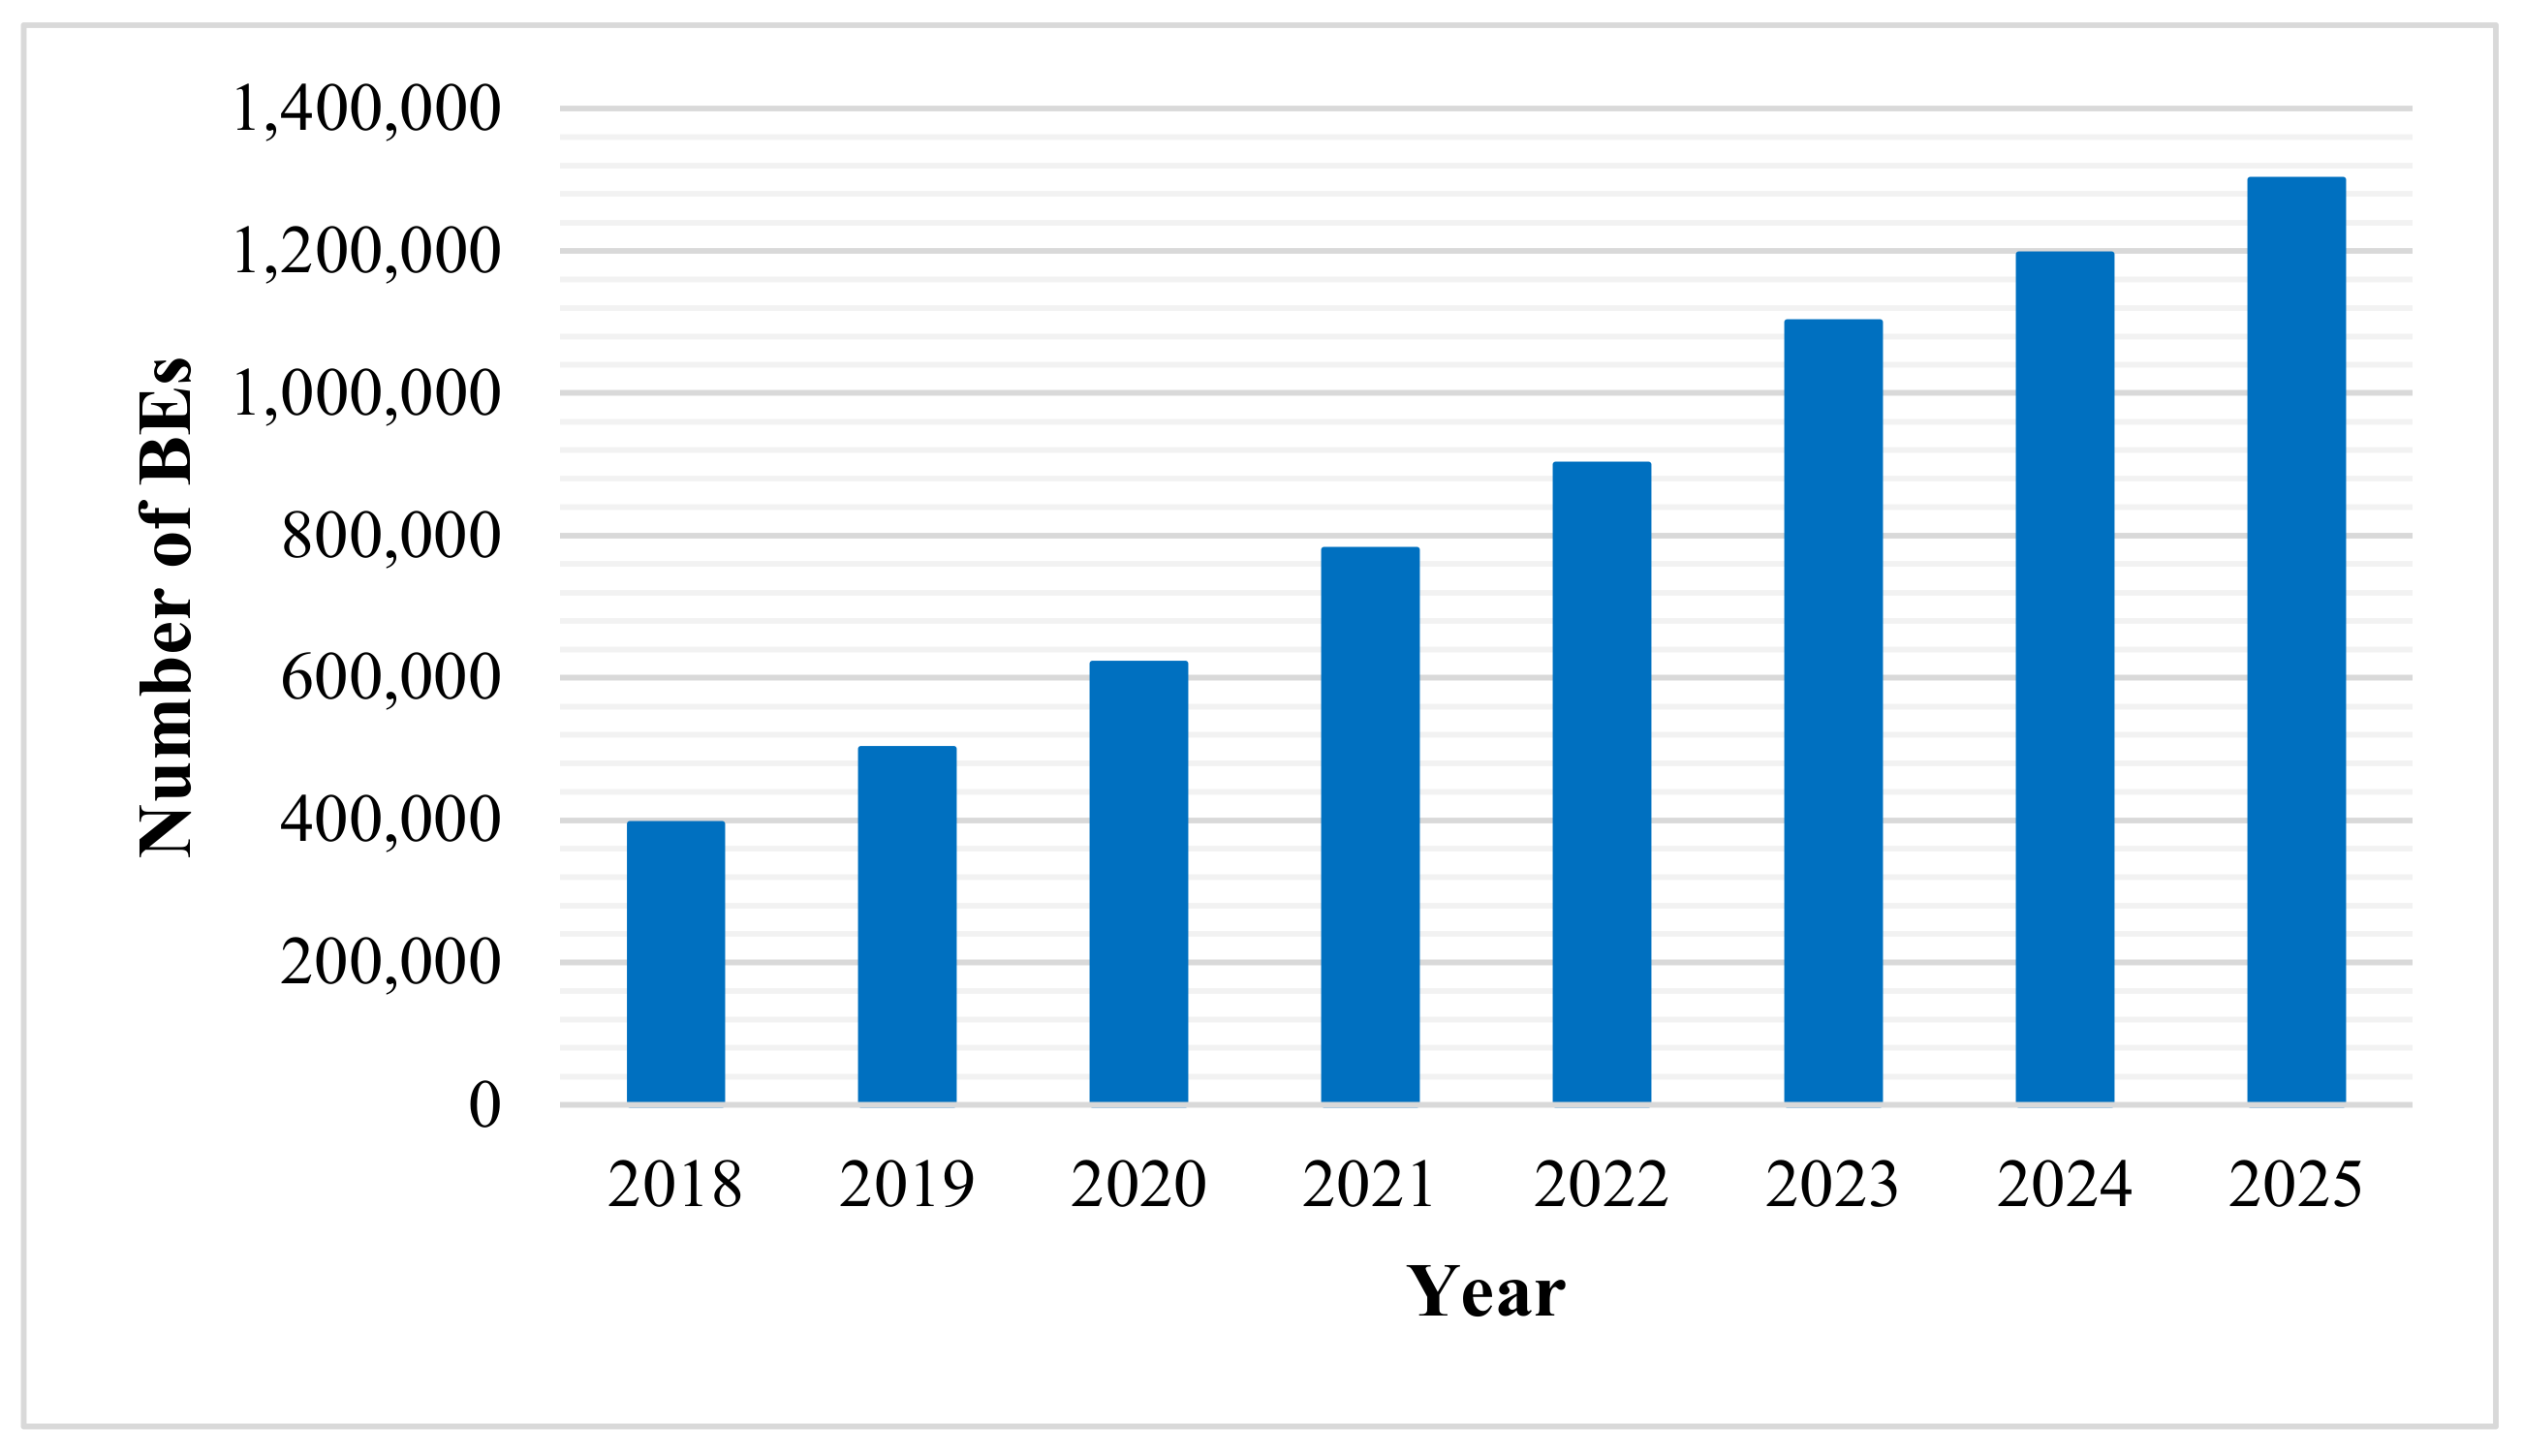
  16. Global Electric Bus Adoption. Global Electric Bus Adoption to Triple by 2025. 2019. Available online: https://www.greentechmedia.com/articles/read/global-electric-bus-adoption-is-set-to-triple-by-2025 (accessed on 6 August 2021).
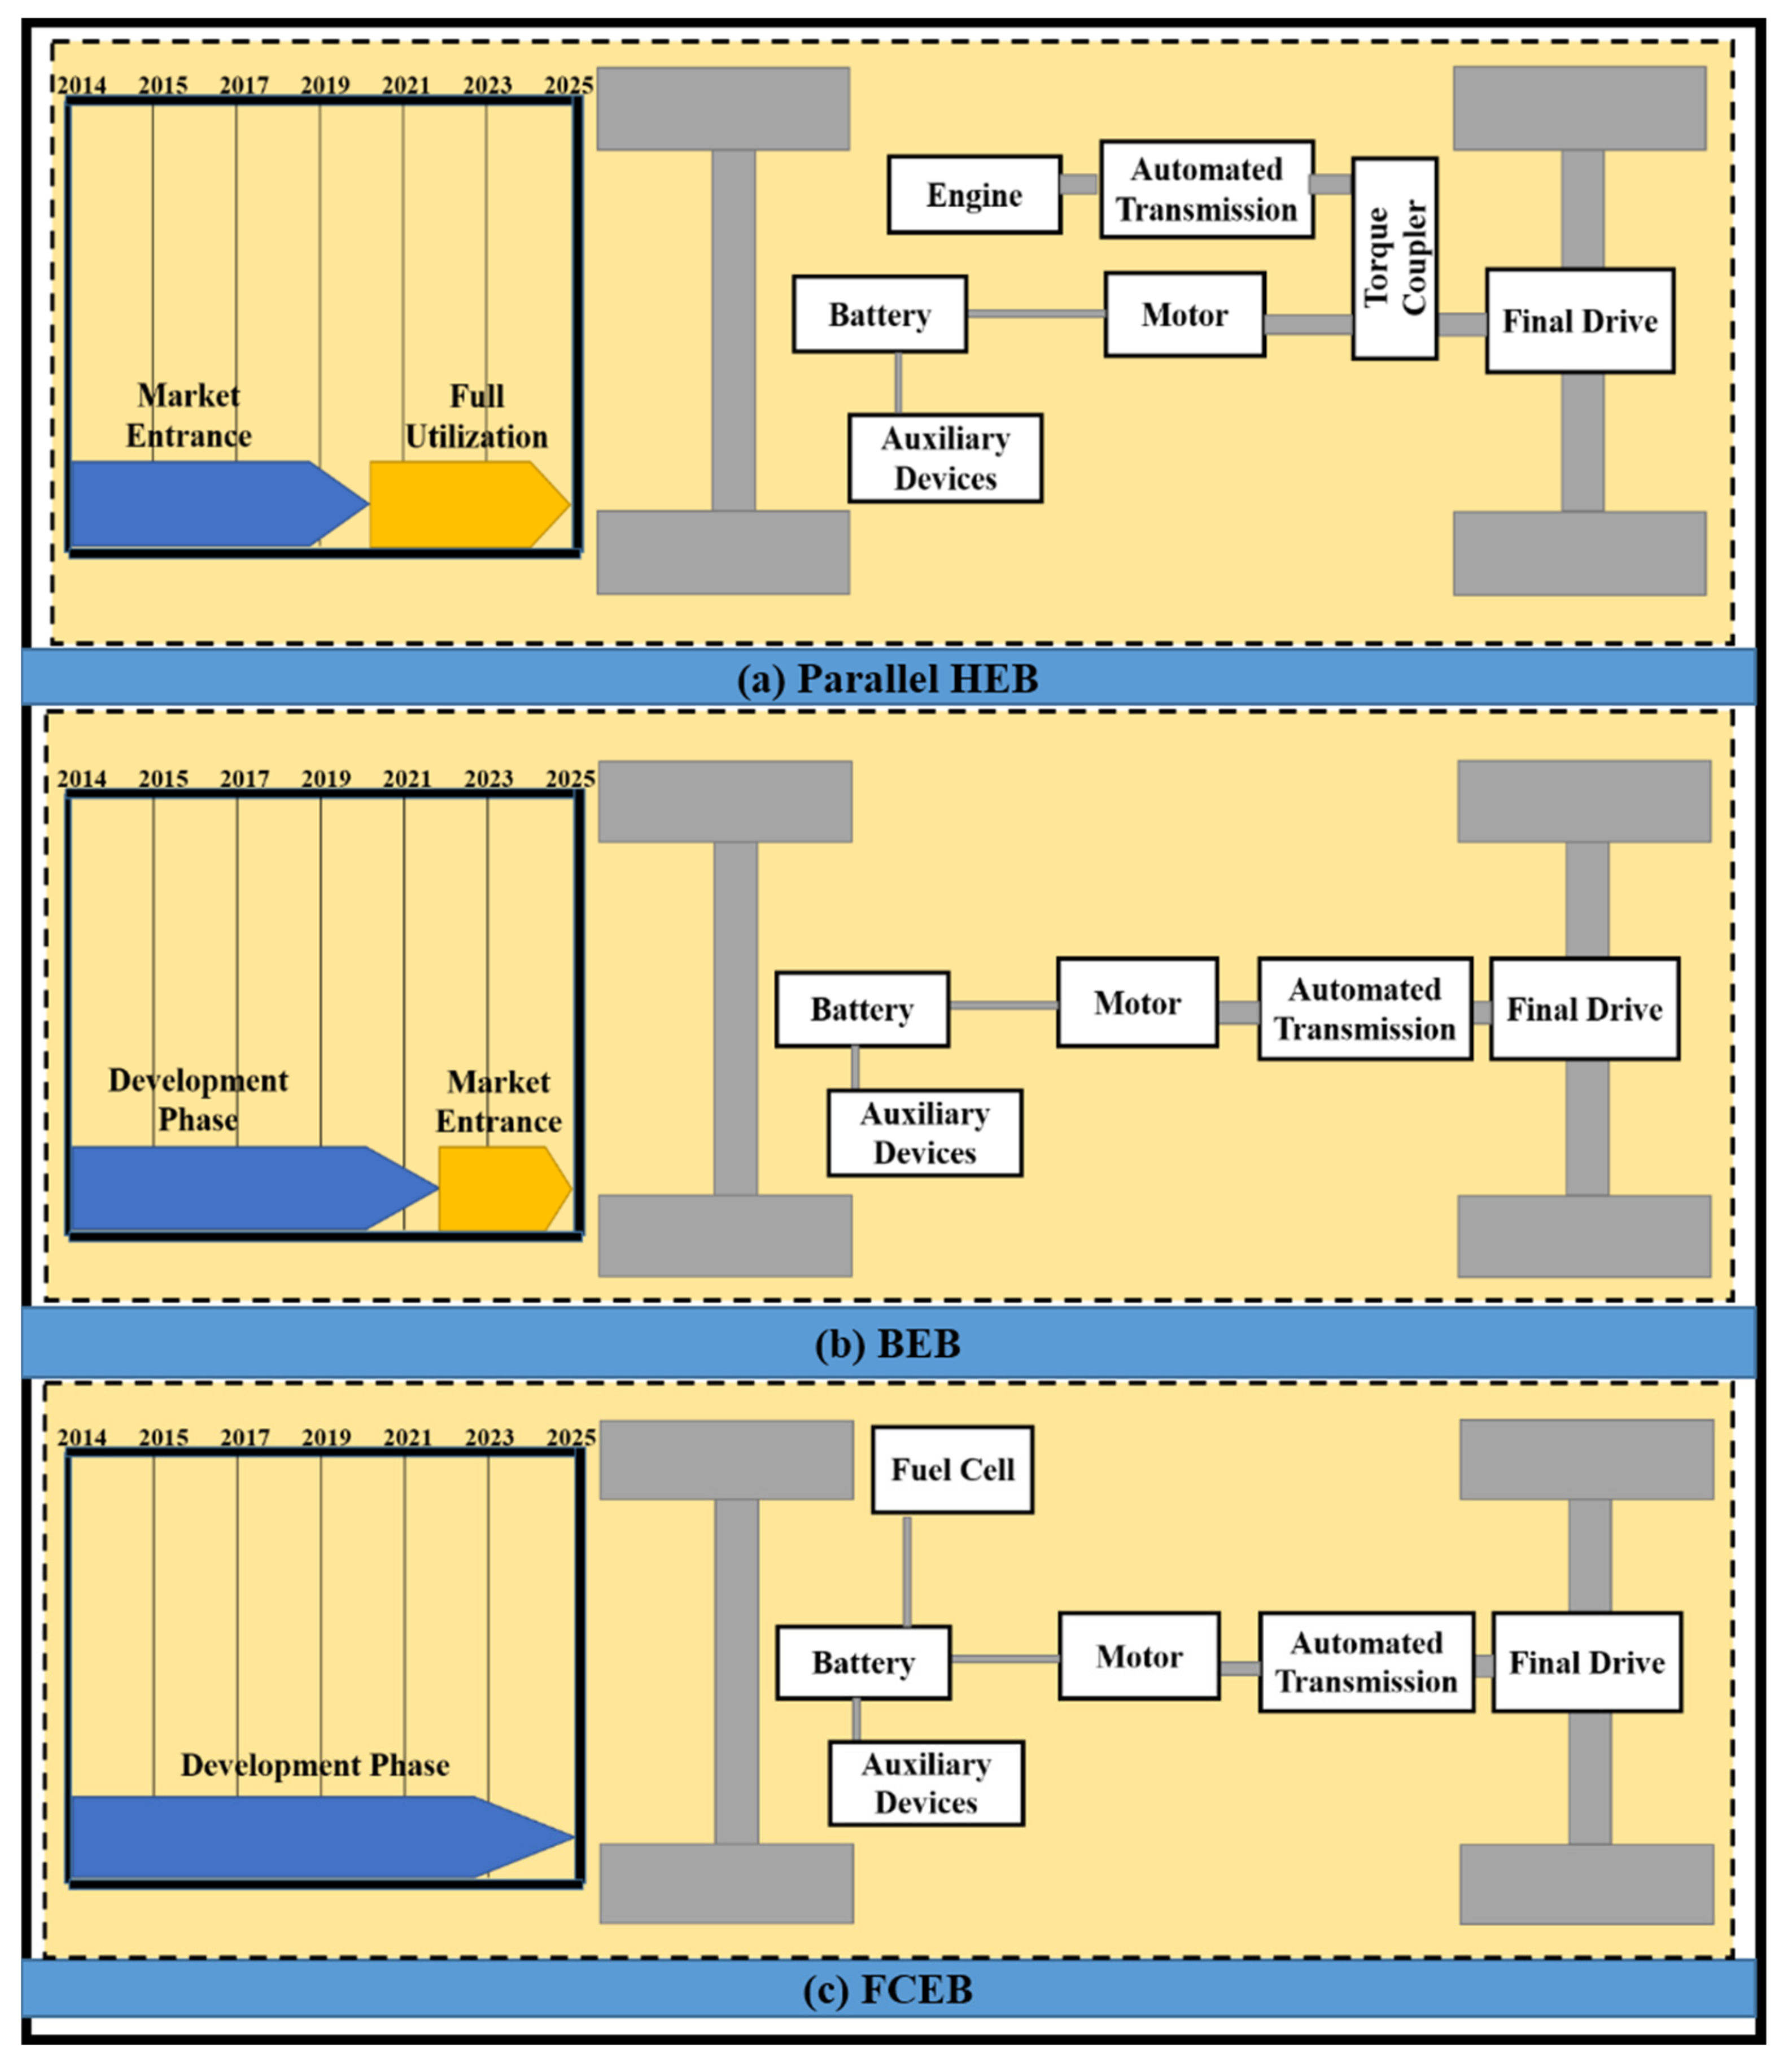
  17. Mahmoud, M.; Garnett, R.; Ferguson, M.; Kanaroglou, P. Electric buses: A review of alternative powertrains. Renew. Sustain. Energy Rev. 2016, 62, 673–684. [Google Scholar] [CrossRef]
  18. Bayindir, K.; Çağatay; Gözüküçük, M.A.; Teke, A. A comprehensive overview of hybrid electric vehicle: Powertrain configurations, powertrain control techniques and electronic control units. Energy Convers. Manag. 2011, 52, 1305–1313. [Google Scholar] [CrossRef]
  19. Ribau, J.; Silva, C.; Sousa, J.M.C. Efficiency, cost and life cycle CO2 optimization of fuel cell hybrid and plug-in hybrid urban buses. Appl. Energy 2014, 129, 320–335. [Google Scholar] [CrossRef]
  20. Yong, J.Y.; Ramachandaramurthy, V.K.; Tan, K.M.; Mithulananthan, N. A review on the state-of-the-art technologies of electric vehicle, its impacts and prospects. Renew. Sustain. Energy Rev. 2015, 49, 365–385. [Google Scholar] [CrossRef]
  21. Chan, C.C. The State of the Art of Electric, Hybrid, and Fuel Cell Vehicles. Proc. IEEE 2007, 95, 704–718. [Google Scholar] [CrossRef]
  22. Offer, G.; Howey, D.; Contestabile, M.; Clague, R.; Brandon, N. Comparative analysis of battery electric, hydrogen fuel cell and hybrid vehicles in a future sustainable road transport system. Energy Policy 2010, 38, 24–29. [Google Scholar] [CrossRef] [Green Version]
  23. Poullikkas, A. Sustainable options for electric vehicle technologies. Renew. Sustain. Energy Rev. 2015, 41, 1277–1287. [Google Scholar] [CrossRef]
  24. Al-Ogaili, A.S.; Ramasamy, A.; Hashim, T.J.T.; Al-Masri, A.N.; Hoon, Y.; Jebur, M.N.; Verayiah, R.; Marsadek, M. Estimation of the energy consumption of battery driven electric buses by integrating digital elevation and longitudinal dynamic models: Malaysia as a case study. Appl. Energy 2020, 280, 115873. [Google Scholar] [CrossRef]
  25. Kuys, J.-O., (Jo); Melles, G.; Thompson-Whiteside, S.; Kapoor, A. Scoping the Human-Centred Design Led 2020 Vision for Malaysia Electric Buses (EV). SAE Tech. Pap. Ser. 2015, 1, 01-0031. [Google Scholar] [CrossRef]
  26. Rahman, A.; Mohiuddin, A.; Ismail, A.F. Prospects and challenges of electric vehicle adaptability: An energy review Malaysia. Energy Educ. Sci. Technol. 2018, 36, 139–151. [Google Scholar]
  27. Jawi, Z.M.; Lamin, F.; Manap, A.R.A.; Abas, F.; Voon, W.S. Review of the National Automotive Policy on Car Maintenance Issues: Malaysia’s Automotive Ecosystem Explained. 1–60, Unpublished.
  28. National Automotive Policy. NAP 2014 Roadmap–Highlights of the Action Plan. 2014. Available online: https://paultan.org/2014/02/07/nap-2014-roadmap-highlights-detailed/ (accessed on 6 June 2021).
  29. Rosli, M.; Kari, F. Malaysia’s National Automotive Policy and the Performance of Proton’s Foreign and Local Vendors. Asia Pac. Bus. Rev. 2008, 14, 103–118. [Google Scholar] [CrossRef]
  30. World Resources Institute. Barriers to Adopting Electric Buses, Transportation Research Board. 2019. Available online: https://www.wri.org/publication/barriers-adopting-electric-buses (accessed on 10 June 2019).
  31. Alkatiri, W. Re-imagining Simple Living and Uncertainty: Transition to Carbon-neutral Economy in Developing Countries. Int. J. Asian Philos. Assoc. 2021, 7, 1–8. [Google Scholar]
  32. Ramachandran, Ramakrishnan, CSR and Sustainable Development—A Primer. Available online: https://ssrn.com/abstract=3904878 (accessed on 11 November 2020).
  33. Nundy, S.; Ghosh, A.; Mesloub, A.; Albaqawy, G.A.; Alnaim, M.M. Impact of COVID-19 pandemic on socio-economic, energy-environment and transport sector globally and sustainable development goal (SDG). J. Clean. Prod. 2021, 312, 127705. [Google Scholar] [CrossRef]
  34. Ghosh, A.; Nundy, S.; Mallick, T.K. How India is dealing with COVID-19 pandemic. Sensors Int. 2020, 1, 100021. [Google Scholar] [CrossRef]
  35. Ratnasingam, J.; Khoo, A.; Jegathesan, N.; Wei, L.C.; AbdLatib, H.; Thanasegaran, G.; Liat, L.C.; Yi, L.Y.; Othman, K.; Amir, M.A. How are small and medium enterprises in Malaysia’s furniture industry coping with COVID-19 pandemic? Early evidences from a survey and recommendations for policymakers. BioResources 2020, 15, 5951–5964. [Google Scholar]
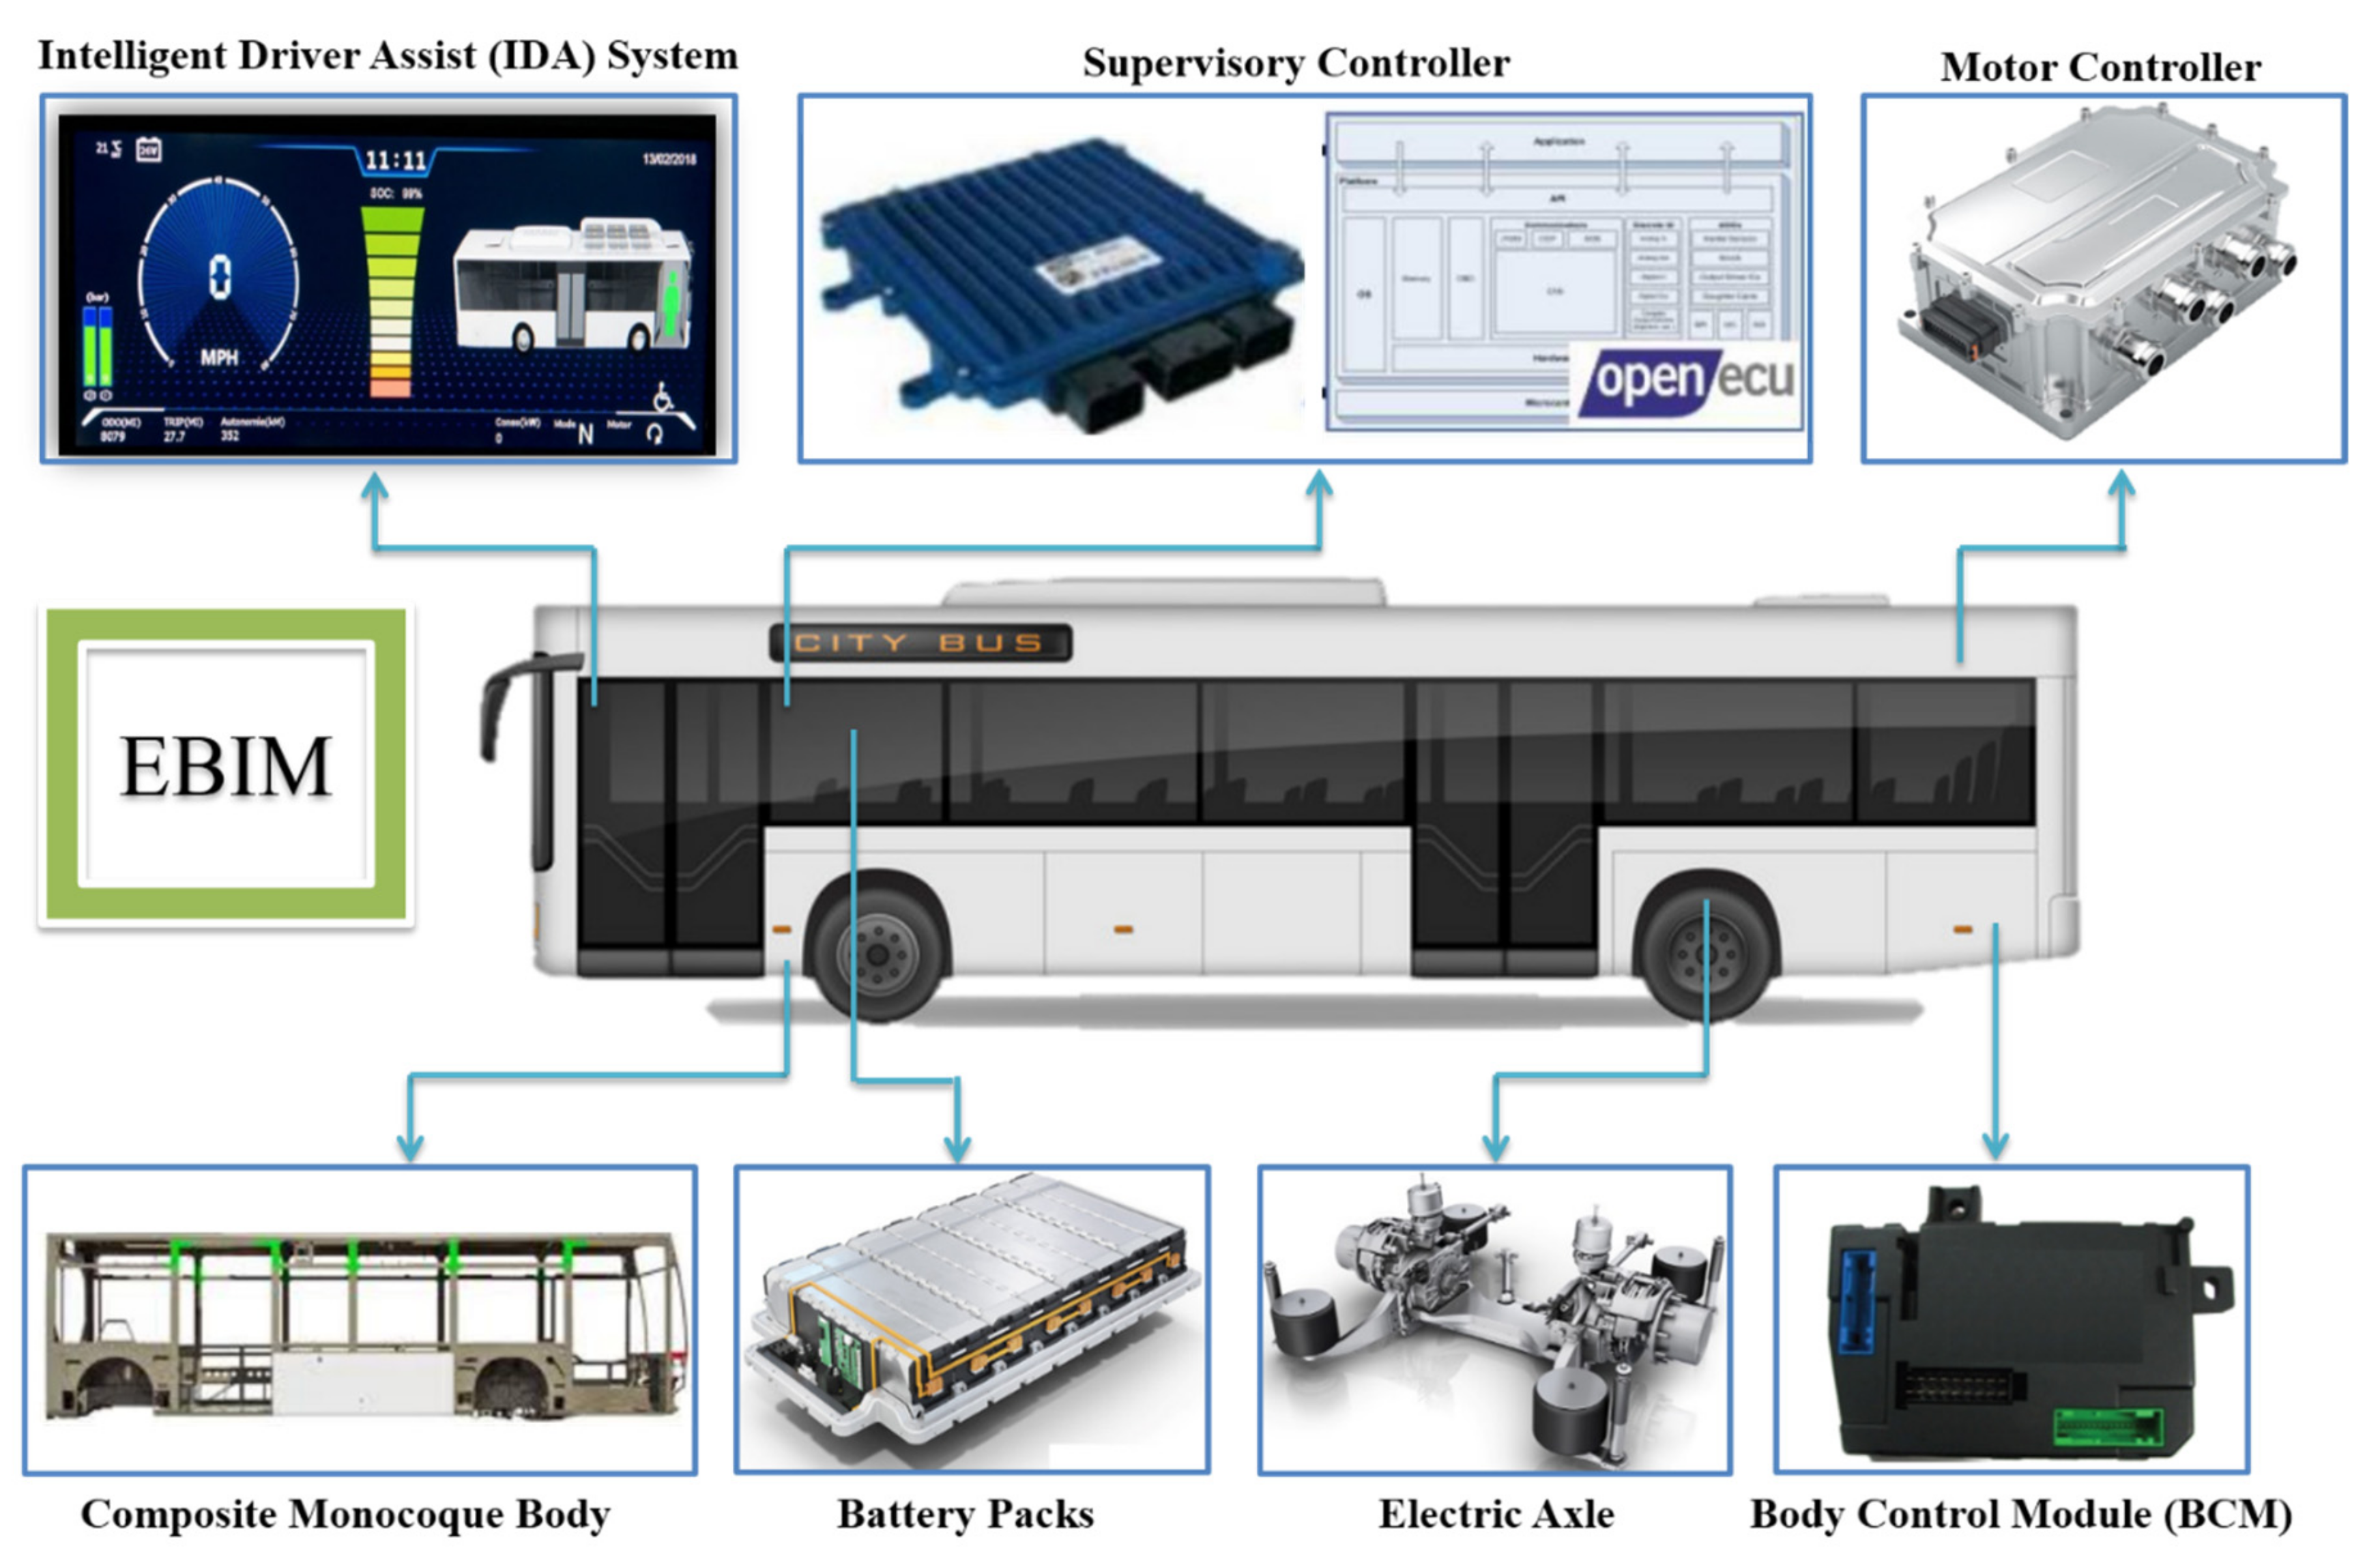
  36. EBIM. Elektrik Bas Inovasi Malaysia (EBIM) Program. Available online: http://ebim.my/ebim/ (accessed on 1 July 2021).
  37. Chandran, V.; Patil, C.; Karthick, A.; Ganeshaperumal, D.; Rahim, R.; Ghosh, A. State of Charge Estimation of Lithium-Ion Battery for Electric Vehicles Using Machine Learning Algorithms. World Electr. Veh. J. 2021, 12, 38. [Google Scholar] [CrossRef]
  38. Zoltowska, I.; Lin, J. Optimal Charging Schedule Planning for Electric Buses Using Aggregated Day-Ahead Auction Bids. Energies 2021, 14, 4727. [Google Scholar] [CrossRef]
  39. Lye, G. MAI Previews Malaysian-Funded E-Bus Prototype. 2015. Available online: https://paultan.org/2015/11/16/mai-previews-malaysian-funded-e-bus-prototype/ (accessed on 22 May 2021).
  40. Motoring-Malaysia. Buses: The Go Auto—Higer Electric Bus Spotted at Go Auto HQ in Glenmarie. Available online: https://motoring-malaysia.blogspot.com/2018/08/buses-go-auto-higer-electric-bus.html (accessed on 21 June 2019).
  41. Siemens. Electrification of Bus and Truck: An Easy Task with the Proven ELFA System. Available online: https://new.siemens.com/global/en/markets/transportation-logistics/electromobility/drive-systems-for-commercial-vehicles.html/ (accessed on 23 April 2018).
  42. Global Mass Transit Report. Malaysia Launches Putra-NEDO EV Bus Project. Available online: https://www.globalmasstransit.net/archive.php?id=27477 (accessed on 2 February 2017).
  43. Md Hanafiah, F.; Azmi, M.A.A.; Ibrahim, S.H.; Md Zan, Z. The effect of sustainable development on environmental agenda. Case study: Putrajaya Green City, Malaysia. Proceedings of The International Seminar on Regional Politics, Administration and Development 2020 (INSORPAD2020), Riau, Indonesia, 15 October 2020; 2020; pp. 728–736. [Google Scholar]
  44. Azmi, M.A.A. The Effect of Sustainable Development on Environmental Agenda. Case Study: Putrajaya Green City, Malaysia. Ph.D. Thesis, University Utara Malaysia, Sintok, Malaysia, 2015. [Google Scholar]
  45. SarawakTransport, Electric Bus Marks New Milestone in Sarawak Transport History. Available online: https://dayakdaily.com/electric-bus-marks-new-milestone-in-sarawak-transportation-history/ (accessed on 1 March 2019).
  46. Guschinsky, N.; Kovalyov, M.Y.; Rozin, B.; Brauner, N. Fleet and charging infrastructure decisions for fast-charging city electric bus service. Comput. Oper. Res. 2021, 135, 105449. [Google Scholar] [CrossRef]
  47. Ding, X.; Zhang, W.; Wei, S.; Wang, Z. Optimization of an Energy Storage System for Electric Bus Fast-Charging Station. Energies 2021, 14, 4143. [Google Scholar] [CrossRef]
  48. Yıldırım, S.; Yıldız, B. Electric bus fleet composition and scheduling. Transp. Res. Part C Emerg. Technol. 2021, 129, 103197. [Google Scholar] [CrossRef]
  49. Bus Interchange. BYD K9 Trial—Melaka—Bus Report. 2018. Available online: https://businterchange.net/busphoto/album.php?album=119 (accessed on 29 December 2020).
  50. Song, Z.; Liu, Y.; Gao, H.; Li, S. The Underlying Reasons behind the Development of Public Electric Buses in China: The Beijing Case. Sustainability 2020, 12, 688. [Google Scholar] [CrossRef] [Green Version]
  51. Comello, S.; Glenk, G.; Reichelstein, S. Transitioning to clean energy transportation services: Life-cycle cost analysis for vehicle fleets. Appl. Energy 2021, 285, 116408. [Google Scholar] [CrossRef]
  52. Harris, A.; Soban, D.; Smyth, B.M.; Best, R. Assessing life cycle impacts and the risk and uncertainty of alternative bus technologies. Renew. Sustain. Energy Rev. 2018, 97, 569–579. [Google Scholar] [CrossRef] [Green Version]
  53. Borén, S. Electric buses’ sustainability effects, noise, energy use, and costs. Int. J. Sustain. Transp. 2020, 14, 1–16. [Google Scholar] [CrossRef] [Green Version]
  54. Abdullah, W.S.W.; Osman, M.; Ab Kadir, M.Z.A.; Verayiah, R. The Potential and Status of Renewable Energy Development in Malaysia. Energies 2019, 12, 2437. [Google Scholar] [CrossRef] [Green Version]
  55. Krolikowski, P.M.; Naggert, K.N. Semiconductor Shortages and Vehicle Production and Prices. Econ. Comment. (Federal Reserv. Bank Cleveland) 2021, 1–6. [Google Scholar] [CrossRef]
Figure 1. Number of EBS in China from 2018 to 2025 [16].
Sustainability 13 11577 g001
Figure 2. Malaysia roadmap of electric buses: (a) parallel HEB (b) BEB (c) FCEB by 2014 by 2014 [28].
Sustainability 13 11577 g002
Figure 3. Global GHG emissions by country in 2020 [31,32].
Sustainability 13 11577 g003
Figure 4. Malaysian Innovation Electric Bus: The main structure.
Sustainability 13 11577 g004
Figure 5. EB prototype of Malaysian Automotive Institute.
Sustainability 13 11577 g005
Figure 6. EB prototype of Go Auto-Higer [40].
Sustainability 13 11577 g006
Figure 7. The schematic outline of the Putra-NEDO EB project [43].
Sustainability 13 11577 g007
Figure 8. Sarawak’s electric bus was manufactured by China’s Foshan Feichi Automobile Manufacturing Co, Ltd [45].
Sustainability 13 11577 g008
Figure 9. BYD K9 Bus in Melaka state [49].
Sustainability 13 11577 g009
Figure 10. The generic framework of BE life cycle.
Sustainability 13 11577 g010
Figure 11. Generation percentage mix in peninsular Malaysia from 2016 to 2025 [54].
Sustainability 13 11577 g011
Table 1. EB Adoption has been taken by the 15 case study cities [30].
StageCityPolicy/TargetImplementation
Industrial DiscussionsFormal DiscussionsPolicy EnactedPreliminary TestStructured PilotMulti-Route OperationMass Route Operation
0Addis Ababa, Ethiopiaa
1Ahmedabad, Indiab
1Quito, Ecuadorc
1Mexico City, Mexicod
1Cope Town, South Africae
1Bangalore, Indiaf
2Belo Horizonte, Brazilg
2Bogotá, Colombiah
2Singapore, Singaporei
2Putrajaya, Malaysiaj
2Madrid, Spaink
2Philadelphia, United Satesl
2Manali, Indiam
3Santiago, Chilen
4Shenzhen, China0
YELLOW: ambiguous; GREEN: implemented; RED: not implemented.
Table 2. Interior and exterior characteristics [36].
ParameterValueUnit
Weight of the bus12,000 kg
Load for each passenger 75kg
Frontal area of the vehicle (A)7.5m2
Drag coefficient of the vehicle (Cd)0.6-
Air density ( ρ ) 1.2-
Rolling resistance (Crr)0.01-
Acceleration because of thr gravity (g) 9.81 ms 2
Table 3. EBIM Tests and descriptions [26].
TestDescription
Bus Endurance Tester (BET)The bus performance is tested by using BET to determine the system working under sustained use.
Anti-Lock Braking System (ABS) To examine the function of the ABS system.
Finite Element Analysis (FEA)FEA has been used to verify the functionality of the battery.
Charging TestTo present the correlation between both temperatures rise and charging rate.
Bus DimensionsTo determine the maximum height and width of the body.
Electronically Controlled Air Suspension (ECAS) To prove that ECAS height modifications are correct and that the kneeling function operates without fail.
Acceleration testCalculate the time it takes to accelerate from 0 to 20 km/h, 0 to 50 km/h, and 0 to 60 km/h.
Table 4. MAI-EB technical specifications [39].
Feature List Description
Body type
  • A total capacity of 65 passengers and 12 ultra-low floors.
  • A completely welded 304 stainless steel chassis and integrated body, all complete with composite and alloy flooring.
  • Additional lightweight components keep the bus’s fully loaded weight within the 16,000 kg axle weight restriction and 18,000 kg gross bus weight limit.
Heating and Cooling Thermo king X1000-E electric air conditioner
Exterior Paneling One-piece side sheet all-composite fire-retardant fiberglass
Battery
  • A modular set of three battery packs 633 V DC (lithium-ion batteries), where the strings are configurable to 90, 180, and 270 kWh.
  • This represents the configuration of 1, 2, and 3-ton battery set for medium, short, and long rang bus operations.
  • The configuration of 270 kWh is designed to provide a 200 km range.
BMS
  • BMS is designed for dynamic and static charging control including safe connection and disconnection during the charging cycle.
  • State of charge and health diagnostics, including voltage and temperature monitored at the cell level.
Supervisory controller systems The modular supervisory controller system architecture includes:
  • Real-time dynamic control of ZF driveline (Semikron SKAI inverters).
  • Power management (regenerative braking).
  • Supervisory control of subsystems (BMS, charging, compressor air, power steering, DC/DC conversion, high voltage power distribution unit, cooling, and HVAC).
Rear axle ZF AVE 132 full electric axle with 4 airbag suspensions, 11,000 kg rating.
Front axle ZF RL 85 is a low-floor axle with dual airbag suspension rated at 7000 kh.
Suspension WabcoEcas controlled
Braking system Wabco system incorporating ABS.
Steering gear ZF 8089 Servacom
Tires and wheels Three satin-finished and four durable alloy rims with 270/70 low profile tires are included.
Electrical system (low voltage) 24 V (2 × 12 batteries) DC system for ancillary chassis functions, including lights, displays, and sensors.
Safety systems Safety system control redundancy, including emergency stop, ISO 26262, and SAE J1673 J1654
Publisher’s Note: MDPI stays neutral with regard to jurisdictional claims in published maps and institutional affiliations.

