Abstract
In Sub-Saharan Africa, around 80% of residential energy demand is for cooking, with over 760 million people without access to clean cooking fuels and stoves. Particulate matter smaller than 2.5 microns (PM) is a significant pollutant from biomass burning and is linked to respiratory and cardiovascular diseases, as well as adverse pregnancy outcomes. Energy poverty further reinforces gender disparities, keeps children from schools, causes environmental degradation, and interferes with social and economic development. Lack of access to and inadequate adoption of clean cooking stoves and fuels are key barriers to improved air quality. This paper presents a field experiment nested within a large-scale health efficacy trial. The aim of the experiment was to evaluate the effects of access to air quality data and dynamic feedback on indoor air pollution (IAP) and personal exposure. Ninety households in Rwanda were enrolled and provided with an air quality sensor and feedback device, which measured real-time indoor air quality as PM for sixteen weeks. After six weeks, PM levels were provided dynamically to households through a display and an auditory alarm. We examined the effects of receiving this feedback on IAP and personal exposure. While access to air quality data did not, in aggregate, improve PM levels, we did observe several promising correlations worthy of further investigation. The associations between personal exposure or rainfall and increased PM were reduced after households had access to air quality data. We hypothesized that the behavior changes required to observe these effects—opening doors and windows and moving away from cooking sources—are easy and immediate, in contrast to the costs and complex logistics of entirely eliminating biomass cooking. The types of behavior changes that would directly impact household air pollution and exposure require more than just awareness and willingness to act.
1. Introduction
In Sub-Saharan Africa, around 80% of residential energy demand is for cooking, with over 760 million people without access to clean cooking fuels and stoves [1]. Most fuel use in Sub-Saharan Africa is firewood, contributing to household air pollution. In aggregate, household air pollution from a variety of sources, including fuelwood, charcoal, fossil fuel combustion, trash burning, and hazardous cooking fuels, contributes to pneumonia and other respiratory disease being the leading causes of death among children under the age of five in LMICs, especially concentrated in Sub-Saharan Africa [2].
In Rwanda, about 89% of household rely on firewood as their primary cooking fuel [3]. Pneumonia is the leading cause of death of children under five years of age in Rwanda [4], which has been linked to cooking indoors on open-fire stoves, with fuels such as wood and charcoal [5].
In 2017, almost all air-quality-related deaths (99.8%) occurred in LMICs, 30% of these deaths were among children under the age of five [5]. Respiratory diseases, cardiovascular diseases, and adverse pregnancy outcomes are the leading causes of air quality-related mortality and morbidity burden [6,7]. These include lower respiratory infections (LRI), ischemic heart disease, stillbirths, and low-weight births, among others [5].
Further, women and school-aged children spend on average 2 h a day collecting wood fuels and an additional 4 h engaged in cooking activities, exposing themselves to dangers including wildlife attacks and harmful air pollutants generated while cooking [8]. This energy poverty reinforces gender disparities, prevents children from acquiring sustained education, and overall, hinders personal, social, and economic development [9]. Moreover, the associated deforestation—especially when the production of processed wood fuels such as charcoal is involved—contributes to further environmental stress and degradation, interferes with food production activities, and increases prices for wood-derived commodities [10,11,12,13].
In its “clean cooking for all scenario”, the International Energy Agency (IEA) identified two key factors that are crucial if clean cooking for all is to be achieved by 2030. One is the adoption of liquefied petroleum gas (LPG) and biogas fuels by an additional billion people. The other is the involvement of women at the beginning of the solutions’ design process. Progress towards increased use of these clean fuels in LMICs has primarily been due to intensive LPG expansion campaigns [9].
However, research shows that acquisition of a cleaner cooking fuel such as LPG does not necessarily result in the abandonment of biomass fuels; rather, the cleaner fuel is often used in conjunction with polluting fuels [14,15], a situation often referred to as “fuel stacking” [16]. Stacking (of stoves and fuels) and other adoption-related challenges present an important barrier to the success of clean cooking interventions in LMICs. Some of the main drivers of adoption include income, sociodemographic and cultural factors, supply chains, perception of the new cooking technology, and awareness of the risks associated with polluting cooking fuels, among others [17,18].
Therefore, reinforcing exclusive and consistent use of a clean cooking fuel is presumed necessary to realize health gains. Our experiment intended to use access to air quality data and dynamic feedback to influence better adoption and exclusive use of LPG as a cooking fuel. The metrics for the success of the experiment are reduced indoor air pollution and reduced personal exposure. Previous research has demonstrated that information on air quality can influence exposure behaviors among firefighters [19] and in homes [20]. Similarly, in Rwanda, a study demonstrated that the use of instrumentation to monitor the use of household water filters resulted in increased adoption rates, even without direct feedback [21].
Additional measures to reduce IAP exposure should be encouraged to supplement clean cooking adoption. For instance, opening multiple sources of ventilation during cooking and keeping humans away from indoor open fires have been identified as acceptable and feasible behaviors that directly impact exposure [22]. Such and similar behavior changes have been associated with a substantial reduction in exposure. A study in rural South Africa reported a 34% reduction in children’s exposure to CO, alongside a 57% reduction in indoor PM concentrations, following a community counseling behavior change intervention [23].
However, studies investigating the impact of household air pollution interventions in LMICs showed that reductions in pollution and personal exposure that are sometimes achieved remain above the WHO guidelines [24]. At the same time, behavior change barriers exist (even when the behavior in question is perceived to be acceptable and straightforward), including weather conditions, normalization of IAP, and gender inequity, among others [25]. In this regard, further incentives or interventions should be provided to address the barriers and support healthy practices, and greater focus should be put on entirely replacing polluting fuels with cleaner options. Stand-alone behavioral interventions are unlikely to drive any real positive impacts, especially in the face of poverty.
2. Hypothesis and Study Design
In this study, we present an interrupted time series experiment wherein air quality was monitored passively and then provided as active feedback to households. We hypothesized that air quality data provided as active feedback to households would reduce air pollution through triggering healthy behavior change. Figure 1 describes this experiment’s timeline and key activities.
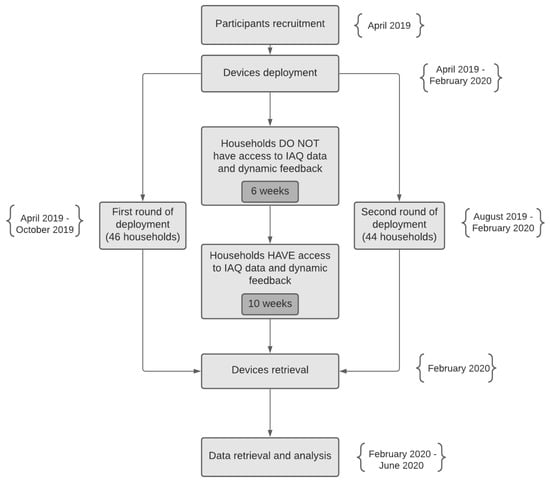
Figure 1.
Experimental timeline and key activities.
This experiment was conducted as an ancillary study within the Household Air Pollution Intervention Network (HAPIN) randomized control trial, a health efficacy study seeking to quantify health benefits from an LPG stove and fuel intervention [26]. HAPIN attempted to control for cooking associated with biomass fuels, without additional interventions for others source of HAP such as vehicles or trash burning.
Our ancillary experiment’s objective was to investigate the effects of having regular and dynamic access to air quality data on the adoption of the LPG trial intervention stoves, IAP, and personal exposure. In our study, 90 households from Kayonza District, Eastern Province, Rwanda, were enrolled through an informed consent process.
Each household received an air quality monitor and feedback device, which monitored PM and communicated that information to household members in near real-time. The device was hypothesized to be potentially useful in increasing LPG stove adoption by raising awareness of air quality from solid biomass fuels and associated health and environmental risks. This improved adoption of a clean cooking fuel would then manifest in reduced IAP and personal exposure. Section 3.1 provides a description of the air quality feedback device. The human-centered design and validation of this device were recently published [27].
3. Materials and Methods
3.1. Air Quality Monitor and Feedback System
The air quality device used in this study was designed in close collaboration with 10 women who are the primary cooks for their households, who live in the study community. The system includes a mounted miniPATS (Berkeley Air Monitoring Group, EME Systems, Berkeley, CA, USA) that monitors particulate matter pollution in the household, a visual display that shows pollution data in real-time, and an audio system that outputs an alarm to warn household members of sudden increases in pollution. The device recorded PM concentrations in the household’s designated cooking areas every 2.5 min for a period of 16 weeks. This device is shown in Figure 2 and was described in a previous publication in this journal [27].

Figure 2.
The air quality monitor and feedback device. The device includes an air quality sensor (top right), a clean cooking message in the participants’ first language (bottom left), a display of real-time air quality data, and a built-in sound system for sudden air quality change alarm.
The particle sensor is a light-scattering sensor that measures both PM and PM concentrations in the air. This sensor was specially designed and calibrated for particulate matter emissions, which are typical of biomass burning circumstances. In addition, the unit provides adjustment for environmental factors such as humidity and temperature. A detailed description and the operating mechanism of the miniPATS can be found in [28,29].
3.2. Deployment
Household installations started in April 2019. Before device installation in a household, a pre-installation survey was conducted, and participants’ informed consent was sought and obtained in writing. Devices were mounted on the wall inside the cooking area or mounted on a wooden structure in cases where wall mounting was not secure or not preferred. Figure 3 below shows an example installation. Due to the limited number of devices, deployment occurred in two rounds. Below are the inclusion criteria for household device installation:
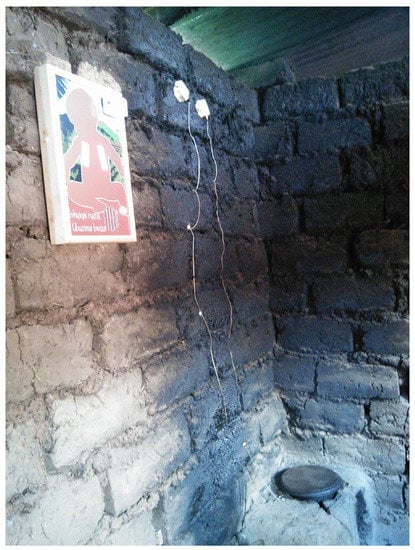
Figure 3.
An example device installation inside a household’s designated cooking area.
- Taking part in the HAPIN LPG stove and fuel intervention;
- Willingness to participate in the substudy;
- Having a designated cooking area that is located indoors.
The first cohort of deployment included 46 households enrolled before receiving the HAPIN-provided LPG stove and fuel. These households typically received their LPG stove and fuel within the first five weeks of our device installation. For these households, the first engagement was to ask households to start their baseline stove (this is the stove they cook with before receiving an LPG stove), which in all cases was a biomass stove. We then recorded PM concentrations during a use event with the biomass stove, after fire stabilization, and used this level as the household’s threshold setting for the audio alarm output. We configured the device on-site to sound an alarm every time that threshold was reached or exceeded, likely due to the presence of biomass smoke in the household. For this cohort of households, the alarm threshold was set with the intention of detecting a biomass stove cooking event and then warning the household of the subsequent high indoor air pollution.
The second round of deployment included 44 households. These households were recruited after receiving LPG stoves from HAPIN. In this case, we could not burn biomass in the household because it would have violated HAPIN’s protocol, and thus, the household’s air quality audio alarm threshold was selected by our field deployment staff based on:
- The type of fuel used for the baseline stoves (wood, charcoal, or other biomass);
- Distance from the closest neighbor’s kitchen;
- PM levels recorded in the cooking area when no cooking was happening.
For example, households that had less than 10 m between their kitchen and their neighbor’s kitchen were assigned a higher threshold. Households with PM levels above 50 µg/m, while no cooking was happening, were assigned a higher threshold as well. The exact value of the threshold depended on the actual distance between the kitchens, the actual baseline reading from the sensor, and whether the primary cook complained about the neighbor’s smoke or not. The field team took all that information into account and made an informed estimate regarding the appropriate value for the alarm threshold. For this round of deployment, households with wood as a baseline fuel had thresholds between 500 µg/m and 1000 µg/m, while households with charcoal as a baseline fuel had a threshold below 500 µg/m.
Overall, individual household thresholds ranged from 50 µg/m to 1000 µg/m with a geometric mean of 397.5 µg/m. Households whose baseline stoves were charcoal-fueled had relatively lower thresholds than those with an open fire three-stone stove.
While the alarm threshold values varied and were selected with some subjectivity by the field staff, the overall objective was to ensure that the alarms were only triggered during biomass cooking events, and not based on other factors contributing to high levels of HAP. As such, the alarm threshold values allocated were intended to be a characteristic of the level that indoor air pollution jumped to once a biomass stove was in use. The intention was to warn household members of high air pollution levels associated with biomass stove use in their particular household.
3.3. Data Collection
We collected the PM concentration in the household’s designated cooking area, in units of µg/m, at a sampling interval of 2.5 min. Stove use and personal exposure datasets presented in this paper were obtained from the HAPIN trial team. Rainfall data were derived from the CHIRPS dataset. The devices were installed for sixteen weeks in each household. For the first six weeks, the device recorded indoor PM concentration data without any feedback to the households. For the last ten weeks of the study, the device automatically displayed a proxy of real-time indoor PM concentration data for household occupants to see and ideally act on. By availing real-time air quality data to study participants, we hoped to encourage exclusive use of the cleanest cooking fuel in the household. This data were shown in the form of grey dots filling the lungs in the graphic of the baby (see Figure 2).
The more the dots in the lungs, the greater the PM pollution is. Each dot represented approximately 3.5 µg/m, while a complete row of dots represented 28 µg/m (close to WHO’s guideline for daily averaged PM exposure level, which is 25 µg/m). Furthermore, the device sounded an audio alarm, if a sudden increase in PM pollution was detected. At the end of the sixteen-week deployment period, the devices were retrieved and the data were downloaded and analyzed.
4. Results
We conducted time series analyses on PM data collected by the devices to understand the effects of access to air quality data and dynamic feedback on IAP. To control for autocorrelation in the PM data, we consolidated the 2.5 min sampling rate of the PM sensor into 24 h mean PM readings.
Further, we used individual households’ alarm thresholds and PM data to identify alarm events above the household’s alarm threshold. For this particular analysis, an alarm event was recorded if a household’s PM pollution levels were above the household’s audio alarm threshold for more than thirty consecutive minutes. If there were less than 15 min between events, those events were considered one long event. We then performed a time series analysis on these events to investigate any trends over time.
To investigate the effect of dynamic access to our air quality data, we fit a mixed-effects linear regression model to PM pollution data and accounted for the impact of LPG stove acquisition. We used the same model to investigate trends in cooking events above the household’s alarm threshold. Additionally, we performed regression analysis on personal exposure data, stove use, and rainfall data to understand how these additional factors relate to air quality data collected by the devices. The model’s variables of interest were daily averaged PM and daily cooking events, while the covariates used were:
- Study day, a continuous variable varying from Day 1 of the study to Day 112 of the study;
- Presence of an LPG stove, a binary variable indicating whether the household possessed an LPG stove on that study day. As noted above, in Round 1, the recruited households did not have access to their HAPIN-provided LPG stove during the first several weeks of our device installation;
- Access to air quality data, a binary variable indicating whether the household had access to air quality data and dynamic feedback on that day;
- Number of alarm feedback events triggered, a discrete variable indicating how many audio alarms were triggered on that day;
- Cumulative rainfall during the five previous days (derived from the CHIRPS dataset [30]).
After trimming PM outliers at 5% and 95%, our fitted linear regression on daily averaged PM2.5 levels showed a notable (p < 0.001), R2 = 0.02118) air quality improvement as the study progressed from Week 1 to Week 16. However, this reduction in PM was attributable nearly entirely to households who received LPG stoves shortly after our monitoring started. As such, our overall observed effect was most likely attributable to the HAPIN trial’s intervention stoves.
To isolate the impact of access to air quality data, we controlled for access to LPG and then examined trends in PM pollution before and after access to air quality data (see Figure 4). In this case, PM levels showed a decreasing trend in PM both before and after access to air quality data. However, mean daily PM before access to air quality data was 44.2 µg/m, and it increased to 71.6 µg/m after, suggesting an increase in pollution after access to air quality data.
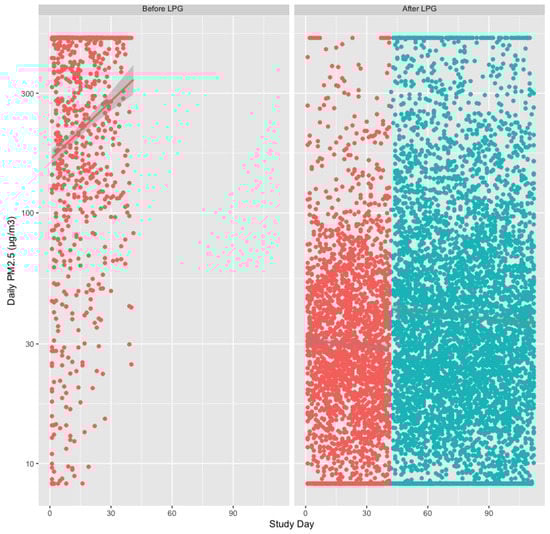
Figure 4.
Daily air pollution before access to air quality data (red) versus after (blue). The left panel shows households before receipt of the LPG stoves, and the right panel shows households all with the LPG stoves.
Cooking events above the household’s alarm threshold showed a decreasing trend both before and after access to air quality data and after controlling for LPG access (see Figure 5). Average daily cooking events before and after access to air quality data and dynamic feedback were 0.14 and 0.3 events per day, respectively.
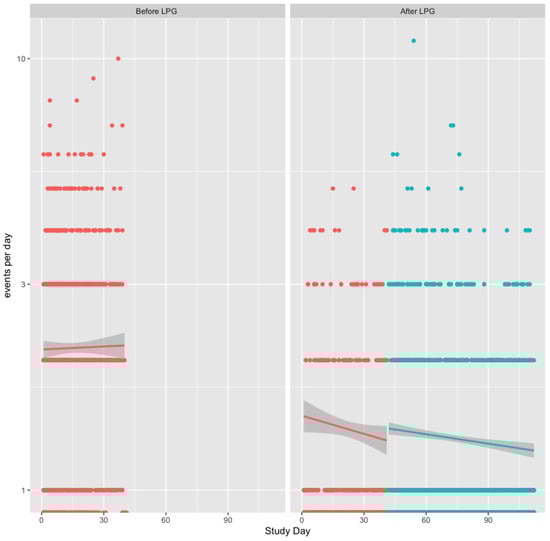
Figure 5.
Daily cooking events above the audio alarm threshold before air quality data (red) and after (blue). The left panel shows households before receipt of the LPG stoves, and the right panel shows households all with the LPG stoves.
4.1. Indoor Air Quality and Stove Use
We further examined stove use data collected by the HAPIN team with in situ sensors mounted on both biomass stoves and LPG stoves. These sensors included a thermocouple and data logger (Geocene Inc, Vallejo, CA, USA). The data were postprocessed to detect cooking events using the SUMSarizer R statistical tool [31]. We then fit a linear regression model on both biomass and LPG stove use data and indoor PM data. The model results showed a positive relationship between the number of biomass cooking events per day and daily averaged PM levels indoors (, ) before access to air quality data. After access to air quality data, this relationship appeared to have a negative relationship with and (see Figure 6 top panels). In the Discussion Section, we suggest stove relocation and other possible explanations for the negative relationship between biomass stove use events and air quality observed during the period after access to air quality data.
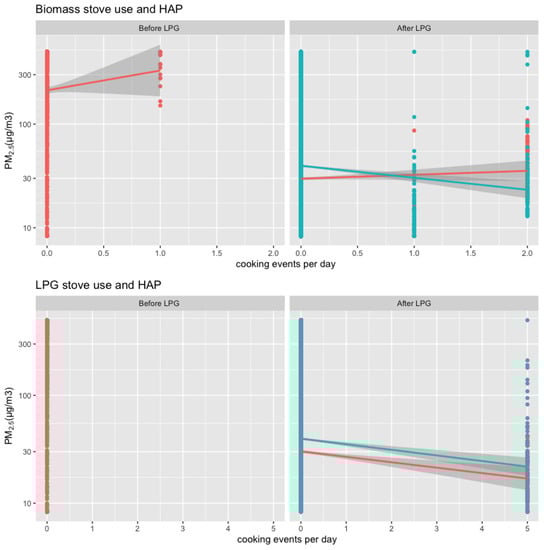
Figure 6.
Biomass stove use events (top graph) and LPG stove use events (bottom graph) before access to air quality data (red) and after (blue). The left panel shows households before receipt of the LPG stoves, and the right panel shows households all with the LPG stoves.
4.2. Indoor Air Quality and Personal Exposure
We also examined the relationship between indoor air quality and personal exposure. For this analysis, we compared PM data collected with the air quality feedback devices and personal exposure PM collected with the Enhanced Children’s MicroPEM monitors [32]. We fit a linear model on air quality and personal exposure data both before and after access to air quality data and dynamic feedback (see Figure 7). This model indicated that personal exposure was positively correlated with air quality (, ). After access to air quality data, this relationship weakened (, ).
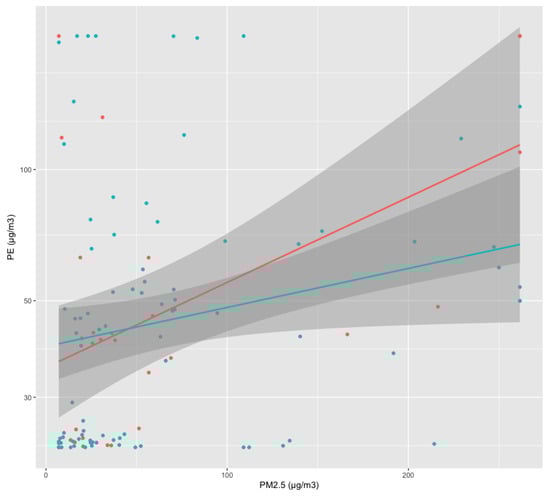
Figure 7.
Relationship between household measured air quality and personal exposure before access to air quality data (red) and after (blue).
4.3. Indoor Air Quality and Rainfall
Finally, we investigated the effects of rainfall on air quality before and after access to air quality data, hypothesizing that ventilation and outdoor cooking behaviors would be impacted by rainfall. A linear regression model fit on daily averaged PM pollution and rainfall data (see Figure 8) indicated that increased PM was positively correlated, although with a weak effect, with rainfall (, ) before access to air quality data (see Figure 8). However, after access to air quality data, rainfall did not appear to be associated with air quality (, ).
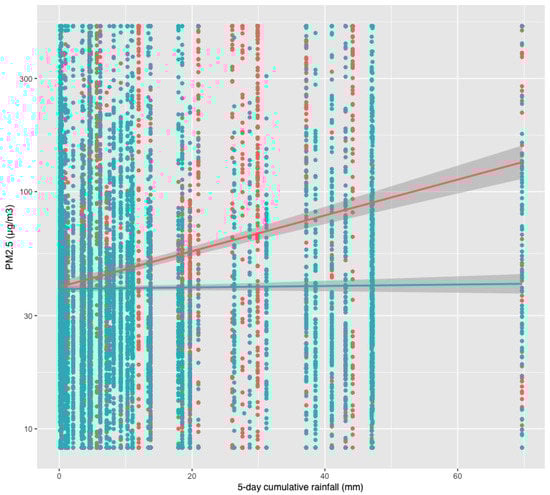
Figure 8.
Rainfall and daily PM levels indoors before (red) and after (blue) access to air quality data.
4.4. Insights from Study Exit Interviews
At the end of the sixteen-week study period, the devices were removed from the households, and semistructured study exit interviews were conducted. The main goal of the interviews was to gather more insights related to how household members interacted with the devices. Specifically, the research team asked what household members did once the devices notified them (visually or auditory) of spikes in IAP. Figure 9 and Figure 10 below present a summary of the participants’ responses.
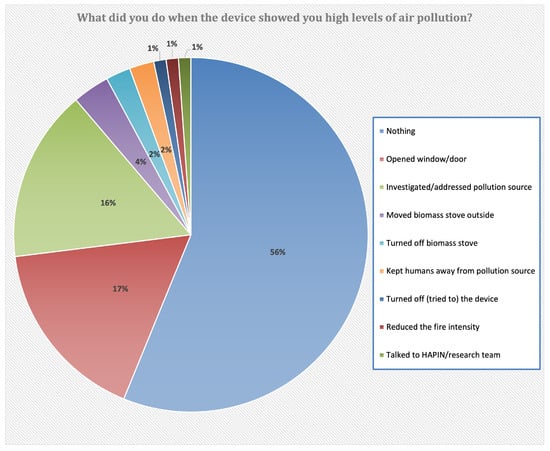
Figure 9.
Participants’ responses to the visual air quality feedback.
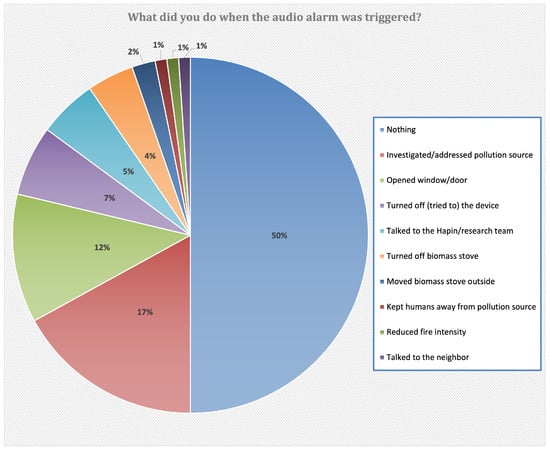
Figure 10.
Participants’ responses to the audio air quality feedback.
Overall, the majority of participants (50–56%) did nothing. The reasons behind inaction varied from household to household, but the most prevalent reason was the perceived inability to impact the pollution source. For example, one participant stated: “Often, the spikes happened when I cooked with wood, when my LPG tank was empty and I had not received refill yet. There was nothing I could do. I would just wait until I am done cooking, and then the alarm would stop.” Another participant said: “Because most of the time the alarm was set off by my neighbor’s cooking, there was nothing I could do. I waited for them to finish cooking.”
Around 12–17% of participants reported opening windows and doors when the device showed them high levels of pollution or when the alarm was triggered. Sixteen to seventeen percent reported investigating and addressing the source of pollution. This included watering the floors before continuing with sweeping, closing windows to keep the neighbor’s smoke from getting indoors, and removing burning food from the stove. Other actions taken included moving biomass stoves outside, turning off the feedback device, talking to the research team, talking to the neighbor, keeping humans away from the pollution source, and reducing the fire intensity (see Figure 9 and Figure 10).
5. Discussion
Overall, after controlling for LPG stove access, we found marginally higher PM2.5 concentrations in the homes after real-time air quality feedback was provided. Similarly, we observed an increase in average daily cooking events above the audio alarm threshold after access to air quality data. These findings are contrary to our motivating experimental hypothesis. We hypothesized that this puzzling outcome may be most closely associated with the LPG intervention. Because all enrolled households received free LPG stoves and fuel before receiving access to air quality data, it is plausible that this LPG intervention was sufficient to cause an elimination, at first, of biomass cooking.
However, as many interventions involving human behavior, behavior change fatigue may plausibly cause some households to restart the use of biomass cook stoves. A 2016 study investigating behavior change related to awareness of monitoring devices observed a similar fatigue phenomenon a few weeks into the interventions [21]. Additionally, our model indicated that both PM levels and cooking events above the audio alarm threshold increased with rainfall. We attributed this later observation to the fact that people tend to close their windows and doors more during rainy days, hindering natural ventilation and trapping high levels of air pollutants indoors.
We observed some desirable outcomes associated with access to air quality data. For instance, the positive relationship between air quality and rainfall disappeared after access to air quality data (see Figure 8). We speculated that during rainfall, household members chose to keep doors and windows open after observing poor air quality.
In addition, we observed that after households had access to air quality data, there was a decoupling of the correlation between baseline stove use and recorded air quality (see Figure 6, top graph). We hypothesized that households moved their biomass stoves outdoors or away from the air quality sensor. Furthermore, the positive and intuitive relationship between personal exposure and indoor air quality faded after access to air quality data (Figure 7). We suspected that this change was attributable to household members moving away from sources of emissions.
6. Limitations
There are a number of limitations to this study. We enumerate these here for clarity:
- This study was conducted as an interrupted time series experiment, wherein active visual and auditory air quality data were provided as feedback to households after a period of passive air quality monitoring. As a time series experiment, we were unable to control for other potentially temporally related behavior change including intervention fatigue, seasonality, weather, and importantly, other intervention-related activities;
- This study was nested within the HAPIN large-scale randomized controlled trial, wherein household were provided with LPG cookstoves and fuel. As such, our study was plausibly significantly impacted by the larger trial. These impacts included the timing of LPG cookstove and fuel provisioning and behavioral messaging;
- Inclusion criteria for our study were predicated on the HAPIN inclusion criteria, which required an indoor cooking area and did not control for socioeconomic, educational, or other demographic characteristics of households;
- We did not have the ability to identify or control for other sources of air pollution, climate, and weather conditions (besides rainfall).
7. Conclusions
In summary, while access to air quality data did not, in aggregate, improve air quality, we did observe several promising correlations worthy of further investigation. Namely, the associations between personal exposure or rainfall and increased PM were reduced after households had access to air quality data. We hypothesized that the behavior changes required to observe these effects—opening doors and windows and moving away from cooking sources—are easy and immediate, in contrast to the costs and complexities of entirely eliminating biomass cooking.
This study suggested that access to air quality data and dynamic feedback could be an effective tool against human exposure to air quality; however, additional studies are advisable. Tools such as the sensor system deployed in this study may help mitigate the stagnation of air pollutants indoors.
However, this tool might be insufficient to drive any substantial change related to the adoption of cleaner cooking fuel and the reduction of overall air quality. We recommend that tools such as these be used in circumstances where the required behavior change actions are easily adopted and effective.
Author Contributions
Conceptualization, C.I., T.S., M.J. and E.A.T.; methodology, C.I., T.S., J.C., M.J. and E.A.T.; software, C.I., T.S., J.C. and E.A.T.; validation, C.I., T.S., J.C., R.P., M.J. and E.A.T.; formal analysis, C.I., J.C. and E.A.T.; investigation, C.I., T.S. and P.N.; resources, E.A.T.; data curation, C.I. and E.A.T.; writing—original draft preparation, C.I. and E.A.T.; writing—review and editing, C.I., T.S., J.C., P.N., R.P., M.J. and E.A.T.; visualization, C.I.; supervision, E.A.T.; project administration, C.I., T.S., P.N. and E.A.T.; funding acquisition, E.A.T. All authors have read and agreed to the published version of the manuscript.
Funding
This work was funded by TRANSFORM, a partnership between Unilever and the United Kingdom Department for International Development. Additional funding support was provided by the HAPIN Trial, the National Science Foundation, and the Autodesk Foundation.
Institutional Review Board Statement
The deployment of the sensors within households and the exit surveys conducted were reviewed and approved by the University of Colorado Institutional Review Board (Record Number 18-0365, approved 9 October 2018) and the Rwanda National Ethics Committee (approved 19 October 2018).
Informed Consent Statement
Informed consent was obtained from all subjects involved in the study.
Data Availability Statement
Data are available from the corresponding author upon request and subject to the Human Subjects protocol restrictions.
Acknowledgments
The authors would like to thank Daniel Wilson, Florien Ndagijimana, Gislaine Rosa, Miles Kirby, Lance Waller, and Thomas Clasen.
Conflicts of Interest
Authors Thomas and Sharpe are compensated employees of SweetSense Inc., an affiliated company contracted for part of the work described in this paper. The funders had no role in the design of the study; in the collection, analyses, or interpretation of data; in the writing of the manuscript; nor in the decision to publish the results.
References
- International Energy Agency (IEA); The World Bank. Sustainable Energy for All 2015: Progress Toward Sustainable Energy. 2015. Available online: https://openknowledge.worldbank.org/handle/10986/22148 (accessed on 7 October 2021).
- Landrigan, P.J.; Fuller, R.; Acosta, N.J.; Adeyi, O.; Arnold, R.; Baldé, A.B.; Bertollini, R.; Bose-O’Reilly, S.; Boufford, J.I.; Breysse, P.N.; et al. The Lancet Commission on pollution and health. Lancet 2018, 391, 462–512. [Google Scholar] [CrossRef] [Green Version]
- The International Energy Agency. SDG7: Data and Projections. Access to Clean Cooking; IEA: Paris, France, 2020. [Google Scholar]
- UNICEF. Committing to Child Survival: A Promise Renewed-Progress Report 2015; National Institute of Statistics of Rwanda: Kigali, Rwanda, 2015. [Google Scholar]
- Lee, K.K.; Bing, R.; Kiang, J.; Bashir, S.; Spath, N.; Stelzle, D.; Mortimer, K.; Bularga, A.; Doudesis, D.; Joshi, S.S.; et al. Adverse health effects associated with household air pollution: A systematic review, meta-analysis, and burden estimation study. Lancet Glob. Health 2020, 8, e1427–e1434. [Google Scholar] [CrossRef]
- Kim, K.H.; Jahan, S.A.; Kabir, E. A review of diseases associated with household air pollution due to the use of biomass fuels. J. Hazard. Mater. 2011, 192, 425–431. [Google Scholar] [CrossRef] [PubMed]
- Amegah, A.K.; Quansah, R.; Jaakkola, J.J. Household air pollution from solid fuel use and risk of adverse pregnancy outcomes: A systematic review and meta-analysis of the empirical evidence. PLoS ONE 2014, 9, e113920. [Google Scholar] [CrossRef] [PubMed]
- Energy, A.R. Clean and Improved Cooking in Sub-Saharan Africa; The World Bank Group: Washington, DC, USA, 2014. [Google Scholar]
- International Energy Agency (IEA). World Energy Outlook 2017: From Poverty to Prosperity; IEA: Paris, France, 2017. [Google Scholar]
- Ajibola, A.F.; Raimi, M.; Steve-Awogbami, O.C.; Adeniji, A.O.; Adekunle, A.P. Policy Responses to Addressing the Issues of Environmental Health Impacts of Charcoal Factory in Nigeria: Necessity Today; Essentiality Tomorrow. Commun. Soc. Media 2020, 3, 2576–5388. [Google Scholar] [CrossRef]
- Ekpo, A.; Mba, E. Assessment of commercial charcoal production effect on Savannah Woodland of Nasarawa State, Nigeria. J. Geogr. Environ. Earth Sci. Int. 2020, 24, 74–82. [Google Scholar] [CrossRef]
- Vahlne, N.; Ahlgren, E.O. Energy Efficiency at the Base of the Pyramid: A System-Based Market Model for Improved Cooking Stove Adoption. Sustainability 2014, 6, 8679–8699. [Google Scholar] [CrossRef] [Green Version]
- Msuya, N.; Masanya, E.; Temu, A.K. Environmental burden of charcoal production and use in Dar es Salaam, Tanzania. J. Environ. Prot. 2011, 2, 1364–1369. [Google Scholar] [CrossRef] [Green Version]
- Adamu, M.; Adamu, H.; Ade, S.; Akeh, G. Household Energy Consumption in Nigeria: A Review on the Applicability of the Energy Ladder Model. J. Appl. Sci. Environ. Manag. 2020, 24, 237–244. [Google Scholar] [CrossRef]
- Alam, A.; Tawale, N.; Patel, A.; Dibley, M.J.; Jadhao, S.; Raynes-Greenow, C. Household air pollution intervention implications: Findings from qualitative studies and a field trial of clean cookstoves in two rural villages in India. Int. J. Environ. Res. Public Health 2016, 13, 893. [Google Scholar] [CrossRef]
- Mekonnen, A.; Köhlin, G. Determinants of Household Fuel Choice in Major Cities in Ethiopia. 2009. Available online: https://gupea.ub.gu.se/bitstream/2077/21490/1/gupea_2077_21490_1.pdf (accessed on 7 October 2021).
- Timilsina, G.R.; Malla, S. Clean Cooking: Why is Adoption Slow Despite Large Health and Environmental Benefits? Econ. Energy Environ. Policy 2021, 10, 123. [Google Scholar] [CrossRef]
- Vigolo, V.; Sallaku, R.; Testa, F. Drivers and barriers to clean cooking: A systematic literature review from a consumer behavior perspective. Sustainability 2018, 10, 4322. [Google Scholar] [CrossRef] [Green Version]
- Edwards, R.; Johnson, M.; Dunn, K.H.; Naeher, L.P. Application of real-time particle sensors to help mitigate exposures of wildland firefighters. Arch. Environ. Occup. Health 2005, 60, 40–43. [Google Scholar] [CrossRef] [PubMed]
- Klepeis, N.E.; Hughes, S.C.; Edwards, R.D.; Allen, T.; Johnson, M.; Chowdhury, Z.; Smith, K.R.; Boman-Davis, M.; Bellettiere, J.; Hovell, M.F. Promoting smoke-free homes: A novel behavioral intervention using real-time audio-visual feedback on airborne particle levels. PLoS ONE 2013, 8, e73251. [Google Scholar] [CrossRef]
- Thomas, E.A.; Tellez-Sanchez, S.; Wick, C.; Kirby, M.; Zambrano, L.; Abadie Rosa, G.; Clasen, T.F.; Nagel, C. Behavioral Reactivity Associated With Electronic Monitoring of Environmental Health Interventions: A Cluster Randomized Trial with Water Filters and Cookstoves. Environ. Sci. Technol. 2016, 50, 3773–3780. [Google Scholar] [CrossRef]
- Barnes, B.; Mathee, A.; Krieger, L.; Shafritz, L.; Favin, M.; Sherburne, L. Testing selected behaviors to reduce indoor air pollution exposure in young children. Health Educ. Res. 2004, 19, 543–550. [Google Scholar] [CrossRef] [Green Version]
- Barnes, B.; Mathee, A.; Thomas, E. The impact of health behaviour change intervention on indoor air pollution indicators in the rural North West Province, South Africa. J. Energy S. Afr. 2011, 22, 35–44. [Google Scholar] [CrossRef]
- Quansah, R.; Semple, S.; Ochieng, C.A.; Juvekar, S.; Armah, F.A.; Luginaah, I.; Emina, J. Effectiveness of interventions to reduce household air pollution and/or improve health in homes using solid fuel in low-and-middle income countries: A systematic review and meta-analysis. Environ. Int. 2017, 103, 73–90. [Google Scholar] [CrossRef] [Green Version]
- Barnes, B.R. Why do caregivers protect their children from indoor air pollution in rural South Africa? Mila J. Inst. Afr. Stud. 2010, 11, 1–16. [Google Scholar]
- Clasen, T.; Checkley, W.; Peel, J.L.; Balakrishnan, K.; McCracken, J.P.; Rosa, G.; Thompson, L.M.; Barr, D.B.; Clark, M.L.; Johnson, M.A.; et al. Design and rationale of the HAPIN study: A multicountry randomized controlled trial to assess the effect of liquefied petroleum gas stove and continuous fuel distribution. Environ. Health Perspect. 2020, 128, 047008. [Google Scholar] [CrossRef]
- Iribagiza, C.; Sharpe, T.; Wilson, D.; Thomas, E.A. User-centered design of an air quality feedback technology to promote adoption of clean cookstoves. J. Expo. Sci. Environ. Epidemiol. 2020, 30, 925–936. [Google Scholar] [CrossRef] [PubMed]
- EME Systems. Air Quality Projects. Available online: https://www.emesystems.com/projects.html (accessed on 3 March 2021).
- GitHub, Inc. Application Guide for Sharp GP2Y1014AU0F Dust Sensor. Available online: https://github.com/sharpsensoruser/sharp-sensor-demos/wiki/Application-Guide-for-Sharp-GP2Y1014AU0F-Dust-Sensor (accessed on 3 March 2021).
- Funk, C.; Peterson, P.; Landsfeld, M.; Pedreros, D.; Verdin, J.; Shukla, S.; Husak, G.; Rowland, J.; Harrison, L.; Hoell, A.; et al. The climate hazards infrared precipitation with stations—a new environmental record for monitoring extremes. Sci. Data 2015, 2, 1–21. [Google Scholar] [CrossRef] [PubMed] [Green Version]
- Wilson, D.L.; Williams, K.N.; Pillarisetti, A.; on behalf of the HAPIN Investigators. An integrated sensor data logging, survey, and analytics platform for field research and its application in HAPIN, a multi-center household energy intervention trial. Sustainability 2020, 12, 1805. [Google Scholar] [CrossRef] [Green Version]
- RTI International. MicroPEM™ Sensor for Measuring Exposure to Air Pollution. Available online: https://www.rti.org/impact/micropem-sensor-measuring-exposure-air-pollution (accessed on 4 March 2021).
Publisher’s Note: MDPI stays neutral with regard to jurisdictional claims in published maps and institutional affiliations. |
© 2021 by the authors. Licensee MDPI, Basel, Switzerland. This article is an open access article distributed under the terms and conditions of the Creative Commons Attribution (CC BY) license (https://creativecommons.org/licenses/by/4.0/).