Abstract
As public perception about the shared economy evolves, peer-to-peer ridesharing has been gaining increased attention worldwide. Both private and public sector entities have launched mobile app-based ridesharing services, while a range of methodologies and system architectures have been proposed in academia. Whereas traditional ridesharing methods match drivers and riders when their origin and destination are similar, recently proposed algorithms often feature multi-hop and multimodal properties that allow riders to be connected by multiple modes. Such algorithms can reduce travel time and/or travel cost; however, they may also add other travel impedances, such as requiring multiple transfers. Understanding user behavior toward such new ridesharing systems is essential for successful service design. For policymakers and service planners, identifying factors that impact traveler choices can lead to better design and improved services. This research involved a web-based survey to capture traveler preferences using a conjoint analysis framework. A choice-based method was adopted to identify factors for the estimation model and to analyze traveler willingness to pay. Among the proposed factors, the number-of-transfers was shown to be the most important, as was expected. When a multimodal ridesharing system provides less travel time, low travel cost, and sufficient ridesharing incentive, people are more likely to pay for the service.
1. Introduction
As a part of the newly developing shared economy, ridesharing systems (RSS) are becoming popular throughout the world, providing sustainable transportation that fills empty seats in existing vehicles. RSS can provide increased mobility in cities, which, in turn, can reduce congestion and emissions, while reducing the dependency on personal car ownership. The question is often raised as to whether RSS and more established systems (such as ride-sourcing services) are detrimental or beneficial to the existing transit systems. Our previous study [1] highlighted the potential role of multi-hop RSS as a transit system feeder. A combination of public transit and ridesharing can impact mobility; for example, one study [2] reported that 30% of shared mobility users reported driving to work less often. In line with these findings, research on mobility platforms suggests that these can lead to enhanced urban mobility, which can create a dynamic multimodal lifestyle by integrating RSS with the existing transportation services [3].
Multimodal ridesharing systems, where multiple transportation modes fulfill rider trip demands, have been the focus of the recent studies seeking to improve the matching rate and connectivity across travel modes, and thus to provide increased mobility [1,4,5,6,7]. Multimodal RSS, however, have several key questions that must be considered: (a) do RSS provide reasonable travel times? [6,8,9,10,11]; (b) do RSS properly price their services? [6,8,9,10,12,13,14]; (c) do RSS produce a reasonable number of transfers? [7,10]; (d) do RSS provide sufficient ridesharing incentives to encourage their use [6,15,16,17,18]? These four factors are significant because they are the most likely to affect traveler preferences of multimodal RSS. By adopting multimodal RSS’ services, users might improve upon travel time and travel costs, compared to their current travel option. For instance, if commuters who currently ride public transit want to use multimodal RSS to reduce travel time, they might need to pay more and, consequently, may not be willing to accept this option if they are not compensated with some type of incentive. Similarly, even with lower travel cost and travel time, a user may only be willing to accept a transfer inconvenience if there is a sufficient incentive, such as a subsidy.
Therefore, with any type of multimodal ridesharing system, it is necessary to analyze how travelers respond to the set of attributes characterizing the system. Capturing the implicit determinants of individual preference is also important. Factor analysis and conjoint analysis are commonly used as multivariate statistical techniques to capture data regarding consumer behavior through an empirical or quantitative measurement [8,19]. Kim et al. [19] analyzed the potential factors affecting the attitudes of participants in electric vehicle sharing programs (EVSPs), regarding car ownership and program participation. Unlike factor analysis, which is used to examine how underlying constructs influence responses on a number of measured variables, a conjoint analysis is used in market research to determine how people value different features that make up an individual product or service. A conjoint analysis examines which combination of a limited number of attributes is most influential on an individual’s decision making. It is also possible to analyze the relative importance of a set of attributes. While common in marketing research, conjoint analysis has not been widely used in transportation systems research, although it can be useful in providing insights into user acceptance of newly proposed systems and designs. In this study, we utilized a choice-based conjoint analysis method. Data were collected using a web-based survey system, targeting people who live in Southern California (e.g., Los Angeles, Irvine, San Diego, and Santa Barbara).
The remainder of the paper is structured as follows. In the next section, we will briefly introduce the concept of multimodal ridesharing. In Section 3, we outline the technical approach that was used for the conjoint survey design. In Section 4, we describe the data that were collected and present the conjoint analysis with a multinomial logit model. We follow this with a discussion of the impact factor results in Section 5. Lastly, we summarize the findings and conclude the paper with a discussion on future research opportunities (Section 6).
2. Multimodal Ridesharing System
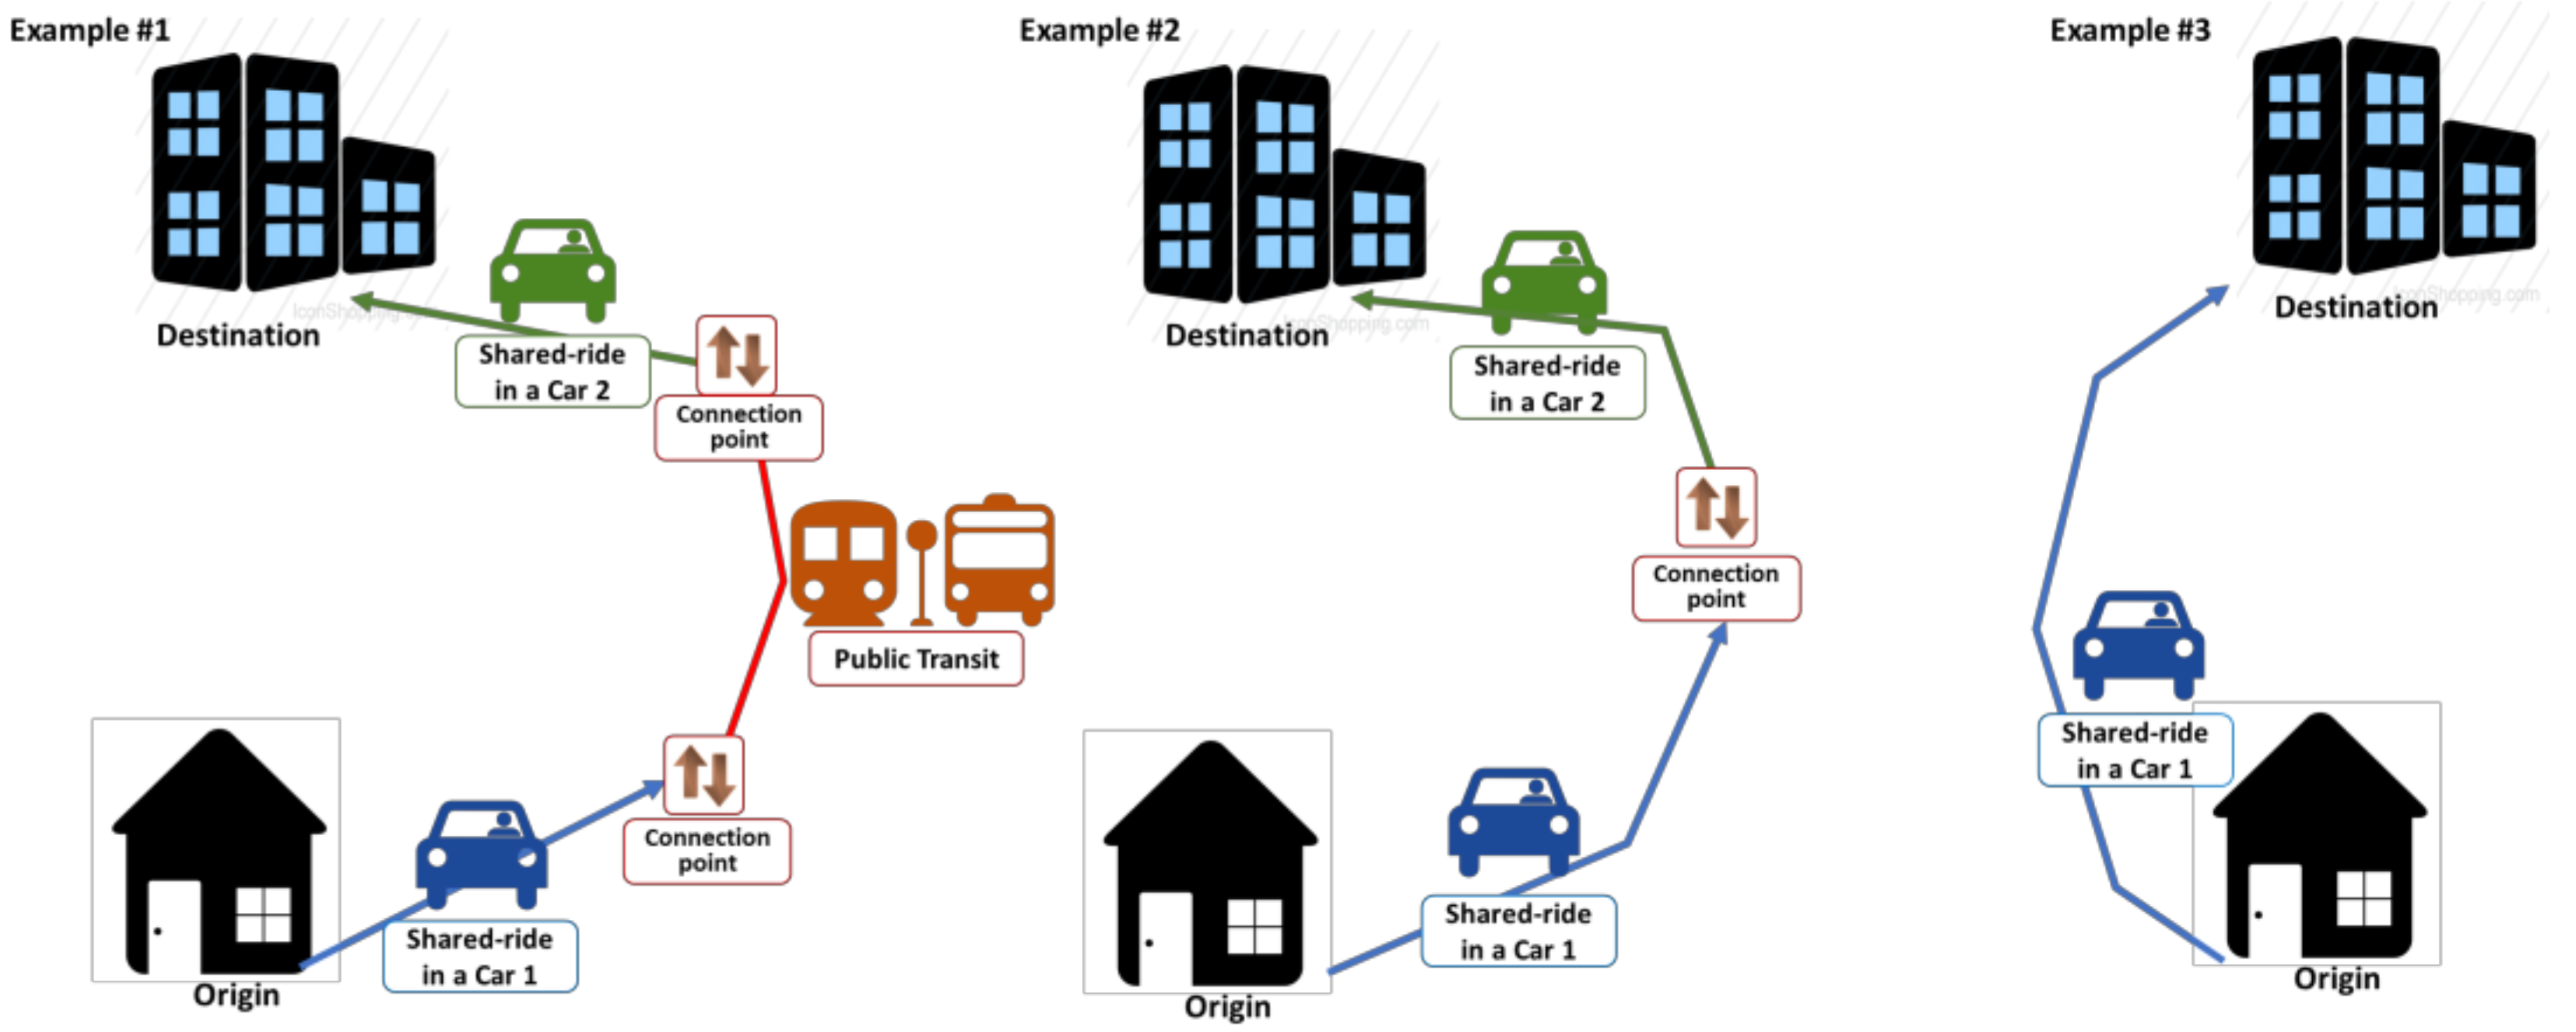
Although multimodal ridesharing systems (RSS) refer to a rather broad concept, many travelers consider ridesharing to be the same as carpooling. Perhaps the most well-known mechanism for carpooling is to match drivers and riders that have the same origin and destination (which usually limits the matching rate). Multimodal ridesharing systems extend the concept of carpooling to include multiple modal connections. In such a system, riders and drivers provide their origin/destination and desired departure/arrival time. The system can match a rider to multiple drivers to increase the matching rate and to provide a faster path. It should be noted that the term “driver” can conceptually include virtual “drivers” representing other modes of transport, such as transit or bikes. Rudnicki et al. [4] studied ridesharing with walking, where the roles of drivers and passengers were known and each driver was assigned to passengers with the same destination [4,5]. Other studies [6,20] have proposed route/hop planning schemes, such as: (a) car -> car -> car; (b) car; (c) car -> airplane -> bus; (d) foot -> car -> car -> car; (e) car -> subway -> bus; (f) bicycle -> car -> bicycle; (g) foot; (h) bicycle; (i) foot -> bus -> foot. In previous studies that were completed at UC Irvine [1,7], a multimodal ridesharing system was proposed to enhance the use of the LA Metro Red Line (a subway), allowing transfers between shared-ride cars and the LA Metro. The results were that a sizable fraction of travelers in drive-alone vehicles switched to transit [1]. Figure 1 illustrates the concept of multimodal RSS.
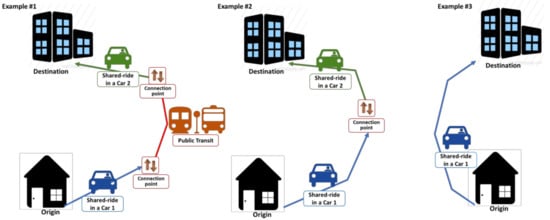
Figure 1.
Multimodal ridesharing system concepts.
3. Choice-Based Conjoint Survey Design
As part of this study, a choice-based conjoint survey was designed and executed in Southern California (Los Angeles, San Diego, Santa Barbara, and Irvine), with a sample size of 4254 choices from 401 participants. A web-based survey has several advantages: it can minimize missing data by advising respondents to respond to all questions. In addition, a well-designed survey website can help respondents to understand the purpose of the survey and, thus, can increase their participation [14].
3.1. Conjoint Survey Design
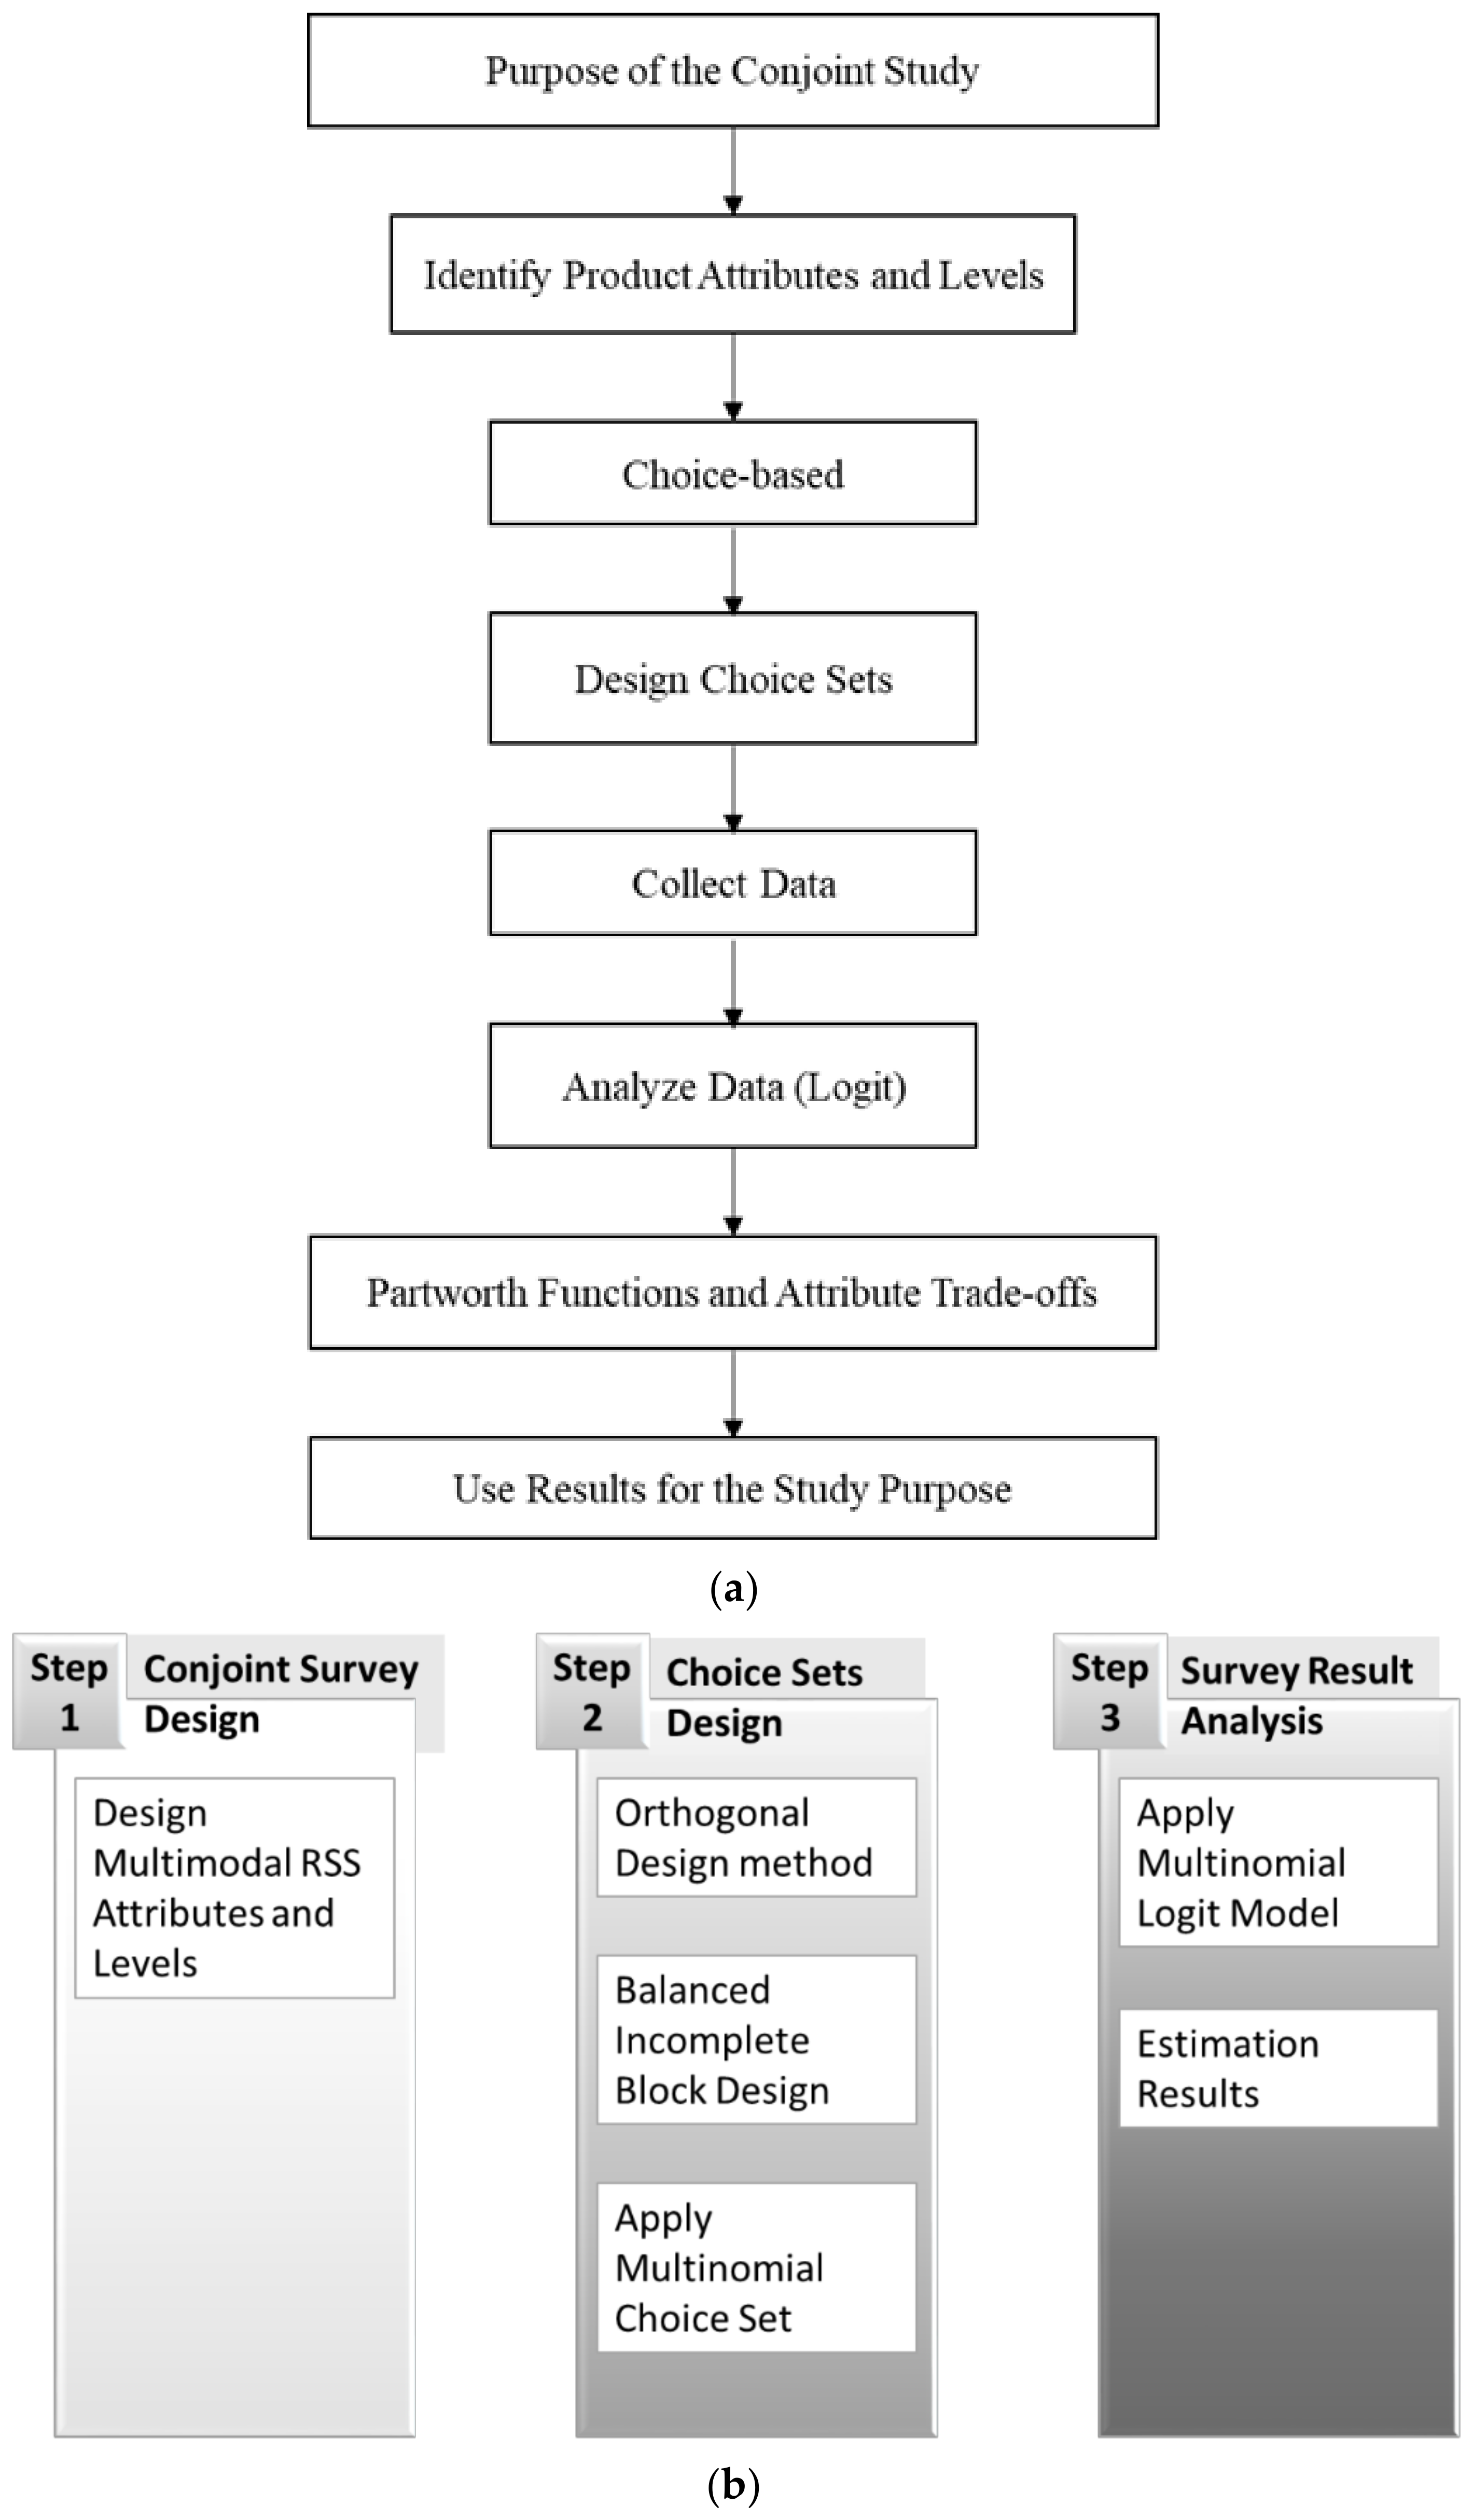
Conjoint analysis is a marketing technique used to assess the weight individuals place on different features of a given product or service. Products are represented by their attributes and respondents provide data about their preferences for hypothetical products that are defined by combinations of attributes. A range of new models and techniques for the estimation of part-worth functions have been developed. While several conjoint methods exist, two primary alternatives are the ratings-based (RB) and choice-based (CB) conjoint analyses. A significant systematic difference between these two analysis options is the compatibility effect. For example, some attributes (such as brand name) tend to be more critical in RB models, whereas some comparable attributes (such as price) are likely to be more critical in CB models [21]. Choice-based conjoint analysis has become perhaps the most widely used conjoint technique. Rao [22] described the major steps in a conjoint study, including: problem selection of attributes and design of profiles (i.e., the set of attribute levels describing a system design alternative); choice set and analysis methods; utilization of results (see Figure 2a). To analyze the impact factors of the multimodal ridesharing system, this study designed a survey questionnaire by applying choice-based conjoint analysis (see Figure 2b).
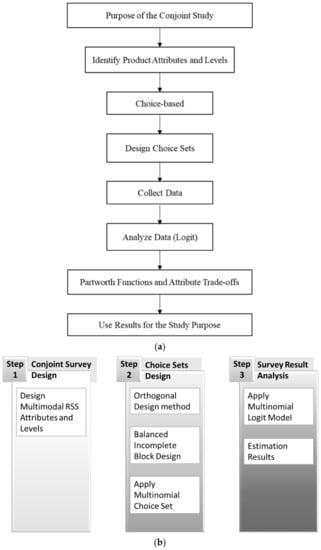
Figure 2.
Overview of analysis design: (a) major steps in conjoint study; (b) conjoint analysis steps for multimodal RSS impact factor analysis.
The selection of attributes and the design of choice sets is critical in conjoint studies because each attribute combination for hypothetical products influences the choice of an alternative. Hypothetical alternatives are presented as profiles, where a profile is defined as a set of attribute levels that defines the hypothetical system design alternative. In general, the number of levels is restricted to a relatively small number for any attribute (from as few as 2 to no more than 5 or 6) to ensure that fewer profiles are generated for data collection. Next, we describe some relevant studies that influenced our selection of attributes.
Various factors can be considered to evaluate the utility of a travel mode. Wang [10] considered system-wide travel and travel cost to optimize a dynamic ridesharing matching problem. Herbawi and Weber [23] addressed a dynamic ride-matching problem by minimizing the total travel time of both the driver and riders. Ko et al. [24] considered EVSP renting and returning hours as the survey components for an electric vehicle sharing program.
A survey conducted by the Korea Railroad Research Institute [8] considered travel time and travel cost to be the representative attributes for the proposed rail alternatives that were studied. Accordingly, travel time and travel cost were considered important factors that affect the choice of transport mode [25,26].
Multimodal ridesharing systems (RSS) technically include transferring between travel modes, and the number of transfers may be a critical factor affecting the preferences of potential multimodal RSS users. Masoud et al. [1] considered LA Metro Red Line stations as transfer points to provide a connection point between travel modes. Wang [10] stated that consistent, seamless, and efficient mode transfers will only be possible with an effective optimization technology. Furuhata et al. [25] addressed the necessity for transfer points to support high-dimensional ride-matching algorithms.
It is also possible to encourage people to use multimodal RSS by providing sustainable transportation incentives. Brownstone and Golob [15] studied the effects of incentives that are designed to promote carpool ridesharing on work trips to reduce congestion and air pollution. They proposed ordered probit discrete choice models to estimate the commuting mode choice of full-time workers in the Los Angeles area. Three types of incentives to control transportation demand were investigated: (a) reserved or other preferential parking for ride-sharers; (b) direct carpooling and/or vanpooling cost subsides by employers; (c) guaranteed rides home for ride-sharers. They found that providing all workers with these incentives would reduce drive-alone commuting between 11 and 18 percent. The effectiveness of high-occupancy vehicle (HOV) lanes in promoting ridesharing on Southern California freeways was also considered as a rideshare incentive [15,27].
Two recent programs offered some insight into the design of our survey. San Luis Obispo (California) Council of Governments (SLOCOG) launched the county-wide SLO Regional Rideshare program [16] to reduce the reliance on driving alone and to improve mobility. SLO Regional Rideshare provides the “iRideshare” service, which is a free online ride-matching system with online trip logging for rewards and prizes. Back ‘N’ Forth Club Rewards is a free program in the region that is offered to businesses and organizations that encourage employees to use sustainable transportation when commuting. Employees record their trips made by bike, carpool, vanpool, bus, telecommute, or on foot into their personal calendars at iRideshare.org and then redeem points for gift cards. This system provides carpooling reimbursements to drivers and offers discounted pricing to riders. The riders cover a share of driver costs, ranging from approximately USD 2 to USD 10, and the drivers receive reimbursements ranging from USD 3 to USD 9 per passenger per trip. Another program is a sustainable transportation incentive program at Santa Monica College (California) that is designed to reduce the use of single-occupancy vehicles. The college provided monthly incentives per usage of sustainable transportation alternatives, such as biking, walking, and carpooling. To ensure incentive compatibility, the program offers three options of ridesharing incentives, namely, USD 150, USD 200, and USD 250 per month. Based on these findings, in this study, ridesharing travel time changes (compared to the user’s current travel time), ridesharing travel cost changes (compared to the user’s current travel cost), the number of transfers, and the monetary incentives for ridesharing (as an annual reward) are considered as attributes of the multimodal RSS survey. Table 1 shows the attributes of the multimodal RSS and the option levels.

Table 1.
Multimodal RSS attributes and levels.
Once the attributes and levels are chosen, the next step is to generate the stimulus set of hypothetical profiles to be evaluated by respondents. The procedure for constructing stimulus profiles is intertwined with the particular conjoint approach used [22]. To generate profiles, a full cards method and a fractional factorial design are commonly used as statistical techniques.
In the full cards method, the profiles are generated by a full factorial design, including all combinations of the attribute levels; however, these designs are not practical when the total number of combinations is large [22]. With this method, our study would generate 81 profiles, which is too large for respondents to evaluate.
This problem can be resolved by using a fractional factorial design, which reduces the number of profiles using an orthogonal design, and which offers several advantages. First, these designs are parsimonious. Second, they enable the estimation of all of the main effects of attributes in a conjoint study. These designs can be restricted to blocks so that each individual receives a balanced subset of profiles [22]. The condition for a design to be orthogonal (which is called symmetric if each attribute in the design has the same number of levels) is that each level of one factor should occur with each level of another factor with proportional frequencies. In a symmetric orthogonal design, every level of a factor occurs an equal number of times with every level of another factor. Orthogonal arrays can either be balanced or imbalanced in terms of the levels of attributes. The property of level balance implies that every level occurs the same number of times within each attribute in the design. An imbalanced design allows for larger standard errors in the parameter (part-worth) estimates. Therefore, to reduce errors, the orthogonal design method was adopted with the balanced incomplete block design process. Detailed expositions can be found in Rao [22].
3.2. Conjoint Choice Set Design
In general, there are two types of choice-based conjoint schemes that are studied: (1) binary choice experiments where the response is binary to a stimulus profile; (2) multinomial choice experiments where the responses are to a set of three or more alternatives, including a “no choice” option, which can make a decision more realistic [22,28]. A binary choice experiment is used when each profile is presented to the respondent seeking a response of yes or no. We designed a multinomial choice experiment to determine the relative importance of each multimodal RSS attribute. Rao [22] suggested a design process for multinomial choice experiments: (a) the first step is to design the profiles of alternatives, using the attributes and their levels; (b) the second step is to scheme choice sets, with each set consisting of a subset of these profiled alternatives. Choice sets could be created manually (using a shifting method), which develops an ordered combination of attribute levels. The shifted-design choice set is shown in Table 2, where 27 profiles emerge for different sets of attribute levels. A sample from the conjoint questionnaire is shown in Table 3.
Table 2.
Shifted design for nine choice sets of three for four attributes, each at three levels.
Table 3.
A sample choice attributes and option levels from the conjoint questionnaire.
3.3. Sociodemographic and Trip Characteristics Factor
In the survey, respondents were asked about (a) sociodemographic factors, such as employment status, age, gender, and household income; and (b) trip characteristics, such as primary trip purpose, trip frequency, primary trip mode, travel time, travel distance, and the number of transfers. Willingness to use multimodal RSS was also considered.
3.4. Characteristics of Respondents
Table 4 displays the sociodemographic and trip characteristics of respondents to the web-based survey.
Table 4.
Sociodemographic and trip characteristics of the survey respondents.
As indicated in Table 4, most respondents were female (61.3%), full-time employed (46.6%), and within the 35–44 age group (53.9%). Concerning the primary travel mode, 78.8% of the respondents preferred to use personal vehicles when they made their most frequent trip (i.e., to/from work: 43.1%). Due to the high proportion of private vehicle users, almost 70 percent of respondents made zero transfers. An interesting observation is that 83.5% of respondents answered that they were willing to use a multimodal ridesharing system. This reveals that most people are willing to change their travel mode when they are offered a multimodal ridesharing system, as long as it satisfies their preferences.
Both respondents travel time and trip distance appear to be rather evenly distributed. Respondents’ household incomes were also evenly distributed, with the median group of between 50 and 75 thousand(25.2% of respondents). The most common trip frequency of more than once per week but not every day was reported by almost half (48.8%) of the respondents.
4. Choice-Based Conjoint Analysis
Conjoint analysis is a commonly applied multivariate statistical technique that is designed to support the understanding of how people make choices between products or services, so as to design new products or services that incorporate the most valued aspects. There are only a small number of transportation-related studies that use choice-based conjoint analysis based on surveys [8,29,30,31]. This study utilized a multinomial logit (MNL) model to estimate behavior based on choice-based conjoint data, which provides the preferences for each attribute of a product or service.
In conjoint analysis, each respondent must choose one alternative from each of several choice sets. These choice sets are constructed by dividing the total set of profiles across K choice sets. In this study, each choice set contained the same number of alternatives without loss of generality. The utility of alternative m in choice set s for individual i is defined as Equation (1):
where is a (1 × S) vector of variables representing the characteristics of the mth choice alternative in choice set s, is an (S × 1) vector of unknown parameters, and is an error term. The MNL model treats each observation from the same respondent as an independent observation, which falls within the standard random utility approach [28]. Under this condition, the MNL model for 400 respondents choosing from 15 choice sets is computationally equivalent to 6000 respondents choosing from one choice set.
The choice probabilities in the conjoint MNL approach can be obtained by using the straightforward generalization of Equation (2). The probability that alternative m is chosen from set s is:
The method of maximum likelihood is most suitable to estimate the logit model using data at the individual level. Assuming that choices are available for I individuals, let the choice for the i-th person be denoted by (), where is the choice set of the i-th person and each y is equal to one or zero, according to whether the corresponding alternative is chosen or not [22].
Maximum likelihood estimation determines the values of parameters so as to maximize the probability (or likelihood) of matching the observed data. For the i-th individual with choice set , the likelihood of observing the choices { is:
The joint likelihood for the sample as a whole is . Here, L is a function of the unknown parameters, . The values are determined by maximizing L with respect to the ’s using standard methods. As is common, Equation (3) is replaced in the optimization by a log function, as in Equation (4), that simplifies the optimization:
Our application used optimization algorithms in XLSTAT (19.4 Version).
5. Results
5.1. Model Fitness
The statistical significance test results for choice-based conjoint analysis with the MNL model is presented in Table 5. If the p-value is low (i.e., less than 0.05), the model is said to be statistically significant. As shown in Table 5, with 95% confidence, the p-value of the choice-based conjoint model that drew from 4254 observations is less than 0.0001, meaning we can state that this model is statistically significant and reject the null hypothesis.
Table 5.
Statistical significance test results.
The statistical significance test was also conducted for the four defined impact factors for a multimodal ridesharing system. The p-values for the number of transfers, ridesharing travel time, and ridesharing travel cost are less than 0.0001. The ridesharing incentive factor has a 0.148 p-value, as shown in Table 6.
Table 6.
Statistical significance test results of multimodal ridesharing system attributes.
5.2. Conjoint Analysis Results
To analyze the influence of the factors on the choice between alternatives within the multimodal ridesharing system, a numerical part-worth utility value was computed for each level of each attribute. Considering ridesharing travel cost as a quantitative attribute, the estimated parameters for each level of the other three attributes were computed. As shown in Table 7, the importance between attributes can be confirmed by the Wald value. Transfer level 3 has the largest Wald value, making it the most important explanatory variable, while ridesharing incentive shows the lowest importance. The reason for the negative estimated coefficient for ridesharing travel cost is that, as travel cost increases, it has a negative effect on the selection. From this table, our results reveal that the fewer the number of transfers, the shorter the travel time, and the more the incentive, the more positive the effect is on the multimodal ridesharing system.
Table 7.
Statistical impact factor parameter estimates for the multimodal ridesharing system.
5.3. Willingness to Pay for the Multimodal Ridesharing Service
In economics terms, willingness to pay (WTP) is the amount an individual would be willing to spend to receive a good or to avoid an undesirable outcome. Thus, a transaction occurs when an individual’s WTP equals or exceeds an offered price. This principle holds for the participants in the multimodal RSS being studied.
As shown in Table 8, the choice-based conjoint model suggests that people are likely to pay USD 2.24 and USD 6.45 when a multimodal RSS provides one transfer and zero transfers, compared to two or more transfers, respectively. This result reveals that a “no transfer” option is the most preferred factor for a multimodal ridesharing system.
Table 8.
Willingness to pay for each attribute.
Based on the WTP values, the second most important factor is ridesharing travel time. The WTP value of each ridesharing travel time level was calculated based on the first level of ridesharing travel time, which is “up to 10 min longer travel time compared to the participant’s current travel time”. For level two and level three of the ridesharing travel time attribute, the participants were more likely to pay USD 0.83 and USD 1.85, respectively.
Compared to the first level of ridesharing incentive, USD 150, participants were willing to pay USD 0.65 when receiving USD 250 as a ridesharing incentive. However, the results indicate that participants are not likely to pay when the incentive is only USD 200. It could be interpreted that the USD 50 variance between ridesharing incentive levels is not significant enough, meaning the p-value of “ridesharing incentive: level 2” in Table 7 is not significant. This could be addressed by increasing the variance between incentive levels. It is also possible that our design used incentive levels that were too low. It is, of course, conceivable that a sufficiently high level of monetary incentive would make any option fully attractive, and thus we only used conservative amounts in this study. Based on a complete cost–benefit analysis of such RSS options, one can calculate the plausible maximum amounts of incentives and use that in future studies.
In summary, the analysis results validate our hypotheses and behavior expectations that a multimodal ridesharing system with fewer transfers, shorter travel times, and more usage incentives will have a higher level of participation. Based on their willingness to pay, potential users value fewer transfers the most.
6. Summary and Conclusions
This paper assessed individual choice behaviors for multimodal ridesharing systems (RSS). A web-based survey provided the data to examine the relevant impact factors with conjoint analysis and discrete choice modeling. The results demonstrate the relative magnitude of multimodal RSS’ factors, and reveal which factors better encourage the use of such ridesharing systems. The results reinforce the importance and viability of factor estimation modeling, and the significance of the “number of transfer” factor in how people choose to make their trips. Future research should continue to improve the reliability of survey-based factorial analysis by incorporating current multimodal RSS’ factors, and by developing more specific attitudinal statements to expand latent factor analysis, such as safety factors. Particularly, considering the COVID-19 situation, people might place more weight on safety while using different ridesharing modes. By conducting further studies, it is expected that insights will be gained regarding the changes in the perception of ridesharing. Improving these models will promote better planning, engineering, and operations in many regions and communities across the United States, which have not yet been well studied regarding the potential of multimodal ridesharing systems.
Author Contributions
Conceptualization, S.A., D.N., M.G.M. and R.J.; methodology, S.A., D.N. and R.J.; software, S.A.; validation, S.A., D.N. and R.J.; writing—original draft preparation, S.A. and D.N; writing—review and editing, S.A., D.N., R.J., M.G.M. and S.L. All authors have read and agreed to the published version of the manuscript.
Funding
This research received no external funding.
Institutional Review Board Statement
Not applicable.
Informed Consent Statement
Not applicable.
Data Availability Statement
Not applicable.
Conflicts of Interest
The authors declare no conflict of interest.
References
- Masoud, N.; Nam, D.; Yu, J.; Jayakrishnan, R. Promoting peer-to-peer ridesharing services as transit system feeders. Transp. Res. Rec. 2017, 2650, 74–83. [Google Scholar] [CrossRef]
- Shared Mobility and the Transformation of Public Transit. Shared-Use Mobility Center (SUMC). Available online: https://trid.trb.org/view/1416012 (accessed on 18 October 2021).
- Uber and Lyft Users More Likely to Use Public Transit Frequently, Own Fewer Cars and Spend Less on Transportation. Available online: https://www.apta.com/news-publications/press-releases/releases/uber-and-lyft-users-more-likely-to-use-public-transit-frequently-own-fewer-cars-and-spend-less-on-transportation/ (accessed on 18 October 2021).
- Rudnicki, R.; Anders, K.-H.; Sester, M. Rendezvous-Problem in Local Shared-Ride Trip Planning. Available online: https://www.isprs.org/proceedings/XXXVII/congress/4_pdf/156.pdf (accessed on 18 October 2021).
- Czioska, P.; Mattfeld, D.C.; Sester, M. GIS-Based Identification and Assessment of Suitable Meeting Point Locations for Ride-Sharing. Transp. Res. Procedia 2017, 22, 314–324. [Google Scholar] [CrossRef] [Green Version]
- Gruebele, P. Interactive System for Real Time Dynamic Multi-Hop Carpooling. Global Transport Knowledge Partnership. 2008. Available online: https://www.gtkp.com/assets/uploads/20100223-182849-7581-Multi_hop_social_carpool_routing_System.pdf (accessed on 18 October 2021).
- Masoud, N.; Jayakrishnan, R. A Decomposition Algorithm to Solve the Multi-Hop Peer-to-Peer Ride-Matching Problem. Transp. Res. Part B Methodol. 2017, 99, 1–29. [Google Scholar] [CrossRef] [Green Version]
- Core Technology Development of Subsonic Capsule Train; Korea Railroad Research Institute: Uiwang-si, Korea, 2016.
- Agatz, N.; Erera, A.L.; Savelsbergh, M.W.P.; Wang, X. Dynamic Ride-Sharing: A Simulation Study in Metro Atlanta. Procedia—Soc. Behav. Sci. 2011, 17, 532–550. [Google Scholar] [CrossRef] [Green Version]
- Wang, X. Optimizing Ride Matches for Dynamic Ride-Sharing Systems. Ph.D. Dissertation, Georgia Institute of Technology, School of Industrial and Systems Engineering, Atlanta, GA, USA, 2013. [Google Scholar]
- Bilali, A.; Dandl, F.; Fastenrath, U.; Bogenberger, K. Impact of Service Quality Factors on Ride Sharing in Urban Areas. Available online: https://ieeexplore.ieee.org/abstract/document/8883364 (accessed on 18 October 2021).
- Agatz, N.; Erera, A.; Savelsbergh, M.; Wang, X. Optimization for Dynamic Ride-Sharing: A Review. Eur. J. Oper. Res. 2012, 223, 295–303. [Google Scholar] [CrossRef]
- Aissat, K.; Oulamara, A. Meeting Locations in Real-Time Ridesharing Problem: A Buckets Approach. Available online: https://link.springer.com/chapter/10.1007/978-3-319-27680-9_5 (accessed on 18 October 2021).
- Ginaviciene, J.; Sprogyu, I. Factors of service quality affecting students, as customers, satisfaction of ridesharing services in vilnius, Lithuania. Soc. Integr. Educ. Proc. Int. Sci. Conf. 2020, 6, 615–624. [Google Scholar] [CrossRef]
- Brownstone, D.; Golob, T.F. The Effectiveness of Ridesharing Incentives: Discrete-Choice Models of Commuting in Southern California. Reg. Sci. Urban Econ. 1992, 22, 5–24. [Google Scholar] [CrossRef]
- SLO Rideshare System. Available online: https://www.slocog.org/programs/system-efficiency/slo-regional-rideshare (accessed on 18 October 2021).
- SCOOP Rideshare Program. Available online: https://www.takescoop.com/ (accessed on 18 October 2021).
- Santa Monica College, Sustainable Transportation Incentive Programs. Available online: https://www.smc.edu/about/campuses/parking-transportation/sustainable-transportation-incentive-programs.php (accessed on 18 October 2021).
- Kim, D.; Ko, J.; Park, Y. Factors Affecting Electric Vehicle Sharing Program Participants’ Attitudes about Car Ownership and Program Participation. Transp. Res. Part D Transp. Environ. 2015, 36, 96–106. [Google Scholar] [CrossRef]
- Aydin, O.F.; Gokasar, I.; Kalan, O. Matching Algorithm for Improving Ridesharing by Incorporating Route Splits and Social Factors. PLoS ONE 2020, 15, e0229674. [Google Scholar] [CrossRef] [PubMed]
- Karniouchina, E.V.; Moore, W.L.; van der Rhee, B.; Verma, R. Issues in the Use of Ratings-Based versus Choice-Based Conjoint Analysis in Operations Management Research. Eur. J. Oper. Res. 2009, 197, 340–348. [Google Scholar] [CrossRef] [Green Version]
- Rao, V.R. Applied Conjoint Analysis; Springer: Berlin/Heidelberg, Germany, 2014; ISBN 978-3-662-50231-0. [Google Scholar]
- Herbawi, W.M.; Weber, M. A Genetic and Insertion Heuristic Algorithm for Solving the Dynamic Ridematching Problem with Time Windows. In Proceedings of the 14th Annual Conference on Genetic and Evolutionary Computation, Philadelphia, PA, USA, 7–11 July 2012. [Google Scholar] [CrossRef]
- Ko, J.; Kim, D.; Nam, D.; Lee, T. Determining Locations of Charging Stations for Electric Taxis Using Taxi Operation Data. Transp. Plan. Technol. 2017, 40, 1–14. [Google Scholar] [CrossRef]
- Furuhata, M.; Dessouky, M.; Ordóñez, F.; Brunet, M.-E.; Wang, X.; Koenig, S. Ridesharing: The State-of-the-Art and Future Directions. Transp. Res. Part B Methodol. 2013, 57, 28–46. [Google Scholar] [CrossRef]
- Stiglic, M.; Agatz, N.; Savelsbergh, M.; Gradisar, M. Making Dynamic Ride-Sharing Work: The Impact of Driver and Rider Flexibility. Transp. Res. Part E Logist. Transp. Rev. 2016, 91, 190–207. [Google Scholar] [CrossRef]
- Lloret-Batlle, R.; Masoud, N.; Nam, D. Peer-to-Peer Ridesharing with Ride-Back on High-Occupancy-Vehicle Lanes. Transp. Res. Rec. J. Transp. Res. Board 2017, 2668, 21–28. [Google Scholar] [CrossRef]
- Haaijer, M.E. Modeling Conjoint Choice Experiments with the Probit Model; Labyrint Publications: Capelle aan den Ijssel, The Netherlands, 1999. [Google Scholar]
- Kofteci, S.; Ergun, M.; Ay, H.S. Modeling Freight Transportation Preferences: Conjoint Analysis for Turkish Region. Sci. Res. Essays 2010, 5, 2016–2021. [Google Scholar]
- Jianrong, L.I.U.; Wei, D.; Zhang, B. Conjoint Analysis Based Transit Service Quality Research. J. Transp. Syst. Eng. Inf. Technol. 2011, 11, 97–102. [Google Scholar]
- Seok, H.E.; Kim, S.J.; Choi, J.H.; Kim, H. Consumer’s Welfare of O2O-Based Designated Driver Service. Korea Assoc. Telecommun. Polices 2016, 23, 1–28. [Google Scholar]


Publisher’s Note: MDPI stays neutral with regard to jurisdictional claims in published maps and institutional affiliations. |
© 2021 by the authors. Licensee MDPI, Basel, Switzerland. This article is an open access article distributed under the terms and conditions of the Creative Commons Attribution (CC BY) license (https://creativecommons.org/licenses/by/4.0/).