Article

Measuring Citizens-Centric Smart City: Development and Validation of Ex-Post Evaluation Framework

1
Division of Smart Cities, Korea University, Seoul 02841, Korea
2
Urban Research Division, Korea Research Institute for Human Settlements, Sejong 30147, Korea
*
Author to whom correspondence should be addressed.
Sustainability 2021, 13(20), 11497; https://doi.org/10.3390/su132011497
Submission received: 27 September 2021 / Revised: 12 October 2021 / Accepted: 13 October 2021 / Published: 18 October 2021
(This article belongs to the Special Issue Social Innovation in Sustainable Urban Development)

Abstract

:
This research aims to present a standardized evaluation system to review and further enhance users’ levels of satisfaction with technologies, facilities, and services of a modern smart city at a time when the smart city paradigm has shifted from the focus of its infrastructural features to citizens. The study also seeks to verify the standardized system, so as to explore the possibility of its future application. For the goals, this research established the Structural Equation Model (SEM) based upon the basic structure of the Customer Satisfaction Index, which is a widely used ex-post assessment model, and upon implications of related studies. To verify the SEM, this study chose two cities, which are located far away from one another and employ different business methods, and conducted a survey of 212 and 197 residents, respectively, with the results being applied to the model for analysis to ascertain if the SEM is reliable and adequate. The analysis results showed that the model secures explanatory power in statistical terms, partially proving that it can be developed into a post-evaluation system for a citizens-centric smart city down the road. However, as meaningful differences were spotted in accordance with characteristics of each urban project, this study tried to come up with the background information of and reasons for such variations, to present implications for urban planning.

1. Introduction

A smart city used to be defined in the 1990s [1] as a city that theoretically adopts newly invented technologies. However, for the past 20 years, its definition and perspectives have been diversified in line with its academic, technical and spatial applications [2] to better reflect infrastructural, economic and social changes and the subsequent needs. Despite such variation, there exists a consensus in that the smart city aims to promote a sustainable city by advancing it through the introduction and the utilization of Information Technologies (IT), and information and communication technologies (ICT) [3].
Such a consensus could have well been maintained because widely publicized projects for the smart city construction [4] have drawn attention for their introduction of large-scale advanced technology infrastructure in major countries and cities around the world. In particular, the smart city has emerged as a new alternative for resolving the side effects of sudden urbanization in such fields as transportation, water and waste, safety and security, and healthcare [5], on the back of the development of ICT, as well as the sustainable development advocated by multinational institutions [6,7].
As such, the smart city has sometimes served as a barometer of the competitiveness of a country [8] or a city in terms of its sustainability from the outset to date [9]. Accordingly, companies and multinational research institutes that lead the development and the distribution of the aforementioned technologies have devised and applied standardized indices to evaluate the smart city based on major social and economic indicators of various countries and cities [10]. This indicates that a smart city project has been a useful tool to judge the competitiveness of an entity [11] and assess its development potential, as well as its marketing means.
However, despite the overall focus on competitive factors, there have been growing calls in the academic circle for the importance of citizens, who are members of a city and the end-users of technologies [12], rather than the technology itself and its usefulness as a marketing tool. Just as many scholars have mentioned before, including [13,14,15], that the smart city has been highlighted as a means to enhance city dwellers’ quality of life, rather than for bureaucracy, who ultimately consume technology [16]. The authors of [17,18,19] and others also stressed the significance of both tangible and intangible end-products, including technology, facilities, and services (TFS) from citizens’ point of view, while shedding the competitive comparison between technologies adopted by different cities.
It is noteworthy that the first-generation smart cities, armed with new technologies, became outdated, and the time has come to determine how to maintain and manage them; for example, by improving, replacing, or deleting existing technologies. As an alternative, some have stressed opinion gathering from citizens to solve the unequal supply of infrastructures and services of a smart city. However, quantitative research in this field, just as stated before, is still confined to the distribution of technologies among states or cities, or the performance of specific technologies. In other words, the methodology that puts a focus on citizens has not achieved much progress despite the recent emphasis on the people in this discourse, which has served as a stumbling block to drawing practical alternatives to discussing the sustainability of a modern smart city.
Against this backdrop, this study aims to evaluate technology, facilities, and services of an established smart city from citizens’ perspectives and draw implications for smart city-related policy measures in the future, which is expected to be a practical alternative to a sustainable smart city. For the goal, the theoretical review on a citizens-centric ex-post evaluation system, including satisfaction levels, is carried out, and a research model is to be established so as to present a standardized evaluation system for existing smart cities. In addition, a survey is conducted involving citizens of two cities, both of which adopt smart city-related TFS but employ different ways in implementing urban planning projects.
After analyzing the results, the study explores the possibility of whether the evaluation model presented here could serve as a basis for a citizens-centric assessment model in the future. It also states the implications for urban planning policies by interpreting the differences between the two cities in line with their geopolitical locations and business methods.

2. Literature Review

2.1. Paradigm Shift in the Smart City

The smart city was defined in terms of the creation of the urban environments of a city, along with advanced information technologies, such as ICT technology and innovation [20], as well as changes in the urban paradigm of globalization [21]. Then, in the following decade, the concept expanded to include such keywords as integration, citizens, and public services. After it developed further, considering knowledge and community factors, among other things, the smart city gained a new goal of ensuring the wellbeing of citizens and the promotion of their quality of life [22].
More researchers in the field shed have light on smart cities’ socioeconomic aspects, while criticizing current studies on smart cities that have failed to consider citizens as a key factor [23,24,25,26], though they acknowledge that centering on physical infrastructure is easier to draw tangible results.
Recent studies, including [18,27,28], also highlighted the need to devise a citizens-centric smart city and services, as well as to set up separate organizations in charge of its maintenance, and to devise an evaluation system, noting that citizen-centered services cannot exist without the consideration of the citizens who reside within it.
These views contributed to defining the smart city, even in the technical circle, as a consolidated infrastructure that provides various services to citizens in both technological and social terms based on ICT technology [29,30]. Moreover, the trend also led private companies, such as [31,32], to emphasize that urban dwellers are a key element of a smart city, calling them the “smart citizen”. After a series of discussions, a “smart citizen” currently means an individual who consumes services installed in a city or via his or her individual devices, as well as a subject who evaluates and interprets those services and then directly affects the related decision making.
In this regard, the citizens-centric smart city, which is the key focus of the modern smart city discussions, is meant to supply technology, facilities and services for citizens. In addition, the public sector, as well as private firms and organizations, improve ways to produce, supply and sell related goods by monitoring citizens’ consumption patterns and analyzing their feedback. A series of such acts allows those private entities to secure sustainability. Accordingly, citizens are direct consumers of goods in a smart city and, at the same time, are those who produce important information that can be used by suppliers. This paradigm shift indicates that the smart city can be maintained by seeking changes from its top-down development strategies to its bottom-up systems, as well as through proactive communication with smart citizens [33].
Likewise, supplies of technology, facilities and services of a smart city are required to establish a fresh bottom-up system. Various studies including [23,34,35] also suggest that the need is urgent to establish a system to measure and evaluate the value of smart city goods currently used, in order to advance the city from its development and infrastructure construction stage, which is expected to ultimately generate co-creation between users, i.e., citizens and stakeholders.

2.2. Criticism and Emergence of Citizens-Centric Smart City

Over the past decade, the concept of a smart city has changed its focus on infrastructure to a focus on citizens, which brought some projects—both ongoing and completed—under criticism.
For example, Masdar of Abu Dhabi, so called Smart City 1.0, was criticized for lacking sustainability of the project itself [36], and the business model for the city of Songdo in South Korea came under criticism for its employment of the top-down methodology that is frequently used for existing ubiquitous cities, as well as for its failure to achieve stated economic and social goals [37,38]. Other cases have also been cited for their lack of educational programs and services for citizens to induce their practical participation in smart city projects [25]. Such criticism has sparked controversies as well as new implications in two perspectives:
First, such criticism is based on differences in the perception of a smart city in the past and at present. As mentioned above, recent studies see citizens as a key element of the smart city in the era of Smart City 2.0 or above, but the so-called first-generation smart cities, presented from the late 1990s to the early 2000s, were meant to be experimental cities that introduced intelligent infrastructure with a goal to improving their technological and engineering performances. The notion has since undergone changes, such as a digital city, an intelligent city, a ubiquitous city, a knowledge city, and a sustainable city, by taking into consideration both technologies and human beings [39].
Therefore, smart city-based urban development and regeneration projects of the past did not review human (or citizen) factors [40,41] and ended up missing technologies, facilities and services that citizens directly experience and use [42,43], which became a source of criticism.
Second, critics focus on incomplete smart city projects due to their “excessive” future-oriented perspectives. The authors of [44,45] claimed that current smart city projects are concentrating only on the introduction of new technologies while failing to fully consider how to contribute to making a civil society, and to guaranteeing its sustainability. However, they may have overlooked the fact that ongoing smart city projects bear high chances of being modified over the course of their execution. Especially when a project is kicked off from scratch to combine the development of a new town or city with smart city infrastructures, it will take quite a long time before the urban space is equipped with human and material resources to have it actually serve its due role. In addition, changes in financial situations, such as planned budget; urban-, architectural-, and information-related policies; and political circumstances could become a considerable stumbling block to the completion of well-organized smart cities both in internal and external terms, just as many theories and studies have pointed out. In this regard, any criticism against smart city projects should be made based on goals pursued by each city. Its focus also needs to be on whether a city is being created to meet the needs of its actual users.
Taken the above-mentioned points together, the criticism for established smart cities was due largely to different viewpoints among studies. There are limitations to fitting a wide spectrum of notions into a singular notion of an “ideal” smart city. However, those critics are on the same page in that they emphasize the lack of attention to citizens and civil societies [46,47], and call for providing appropriate technologies, facilities, and services for users [48]. In this context, it is necessary to establish evaluation criterion which fully considers citizens, and this will be a way to promote the sustainability of many smart city projects in the future [49]. Studies on citizens who reside in places where smart city projects have already been implemented can be a starting point to achieve the citizens-centric smart city in real terms.

3. Research Methodology and Materials

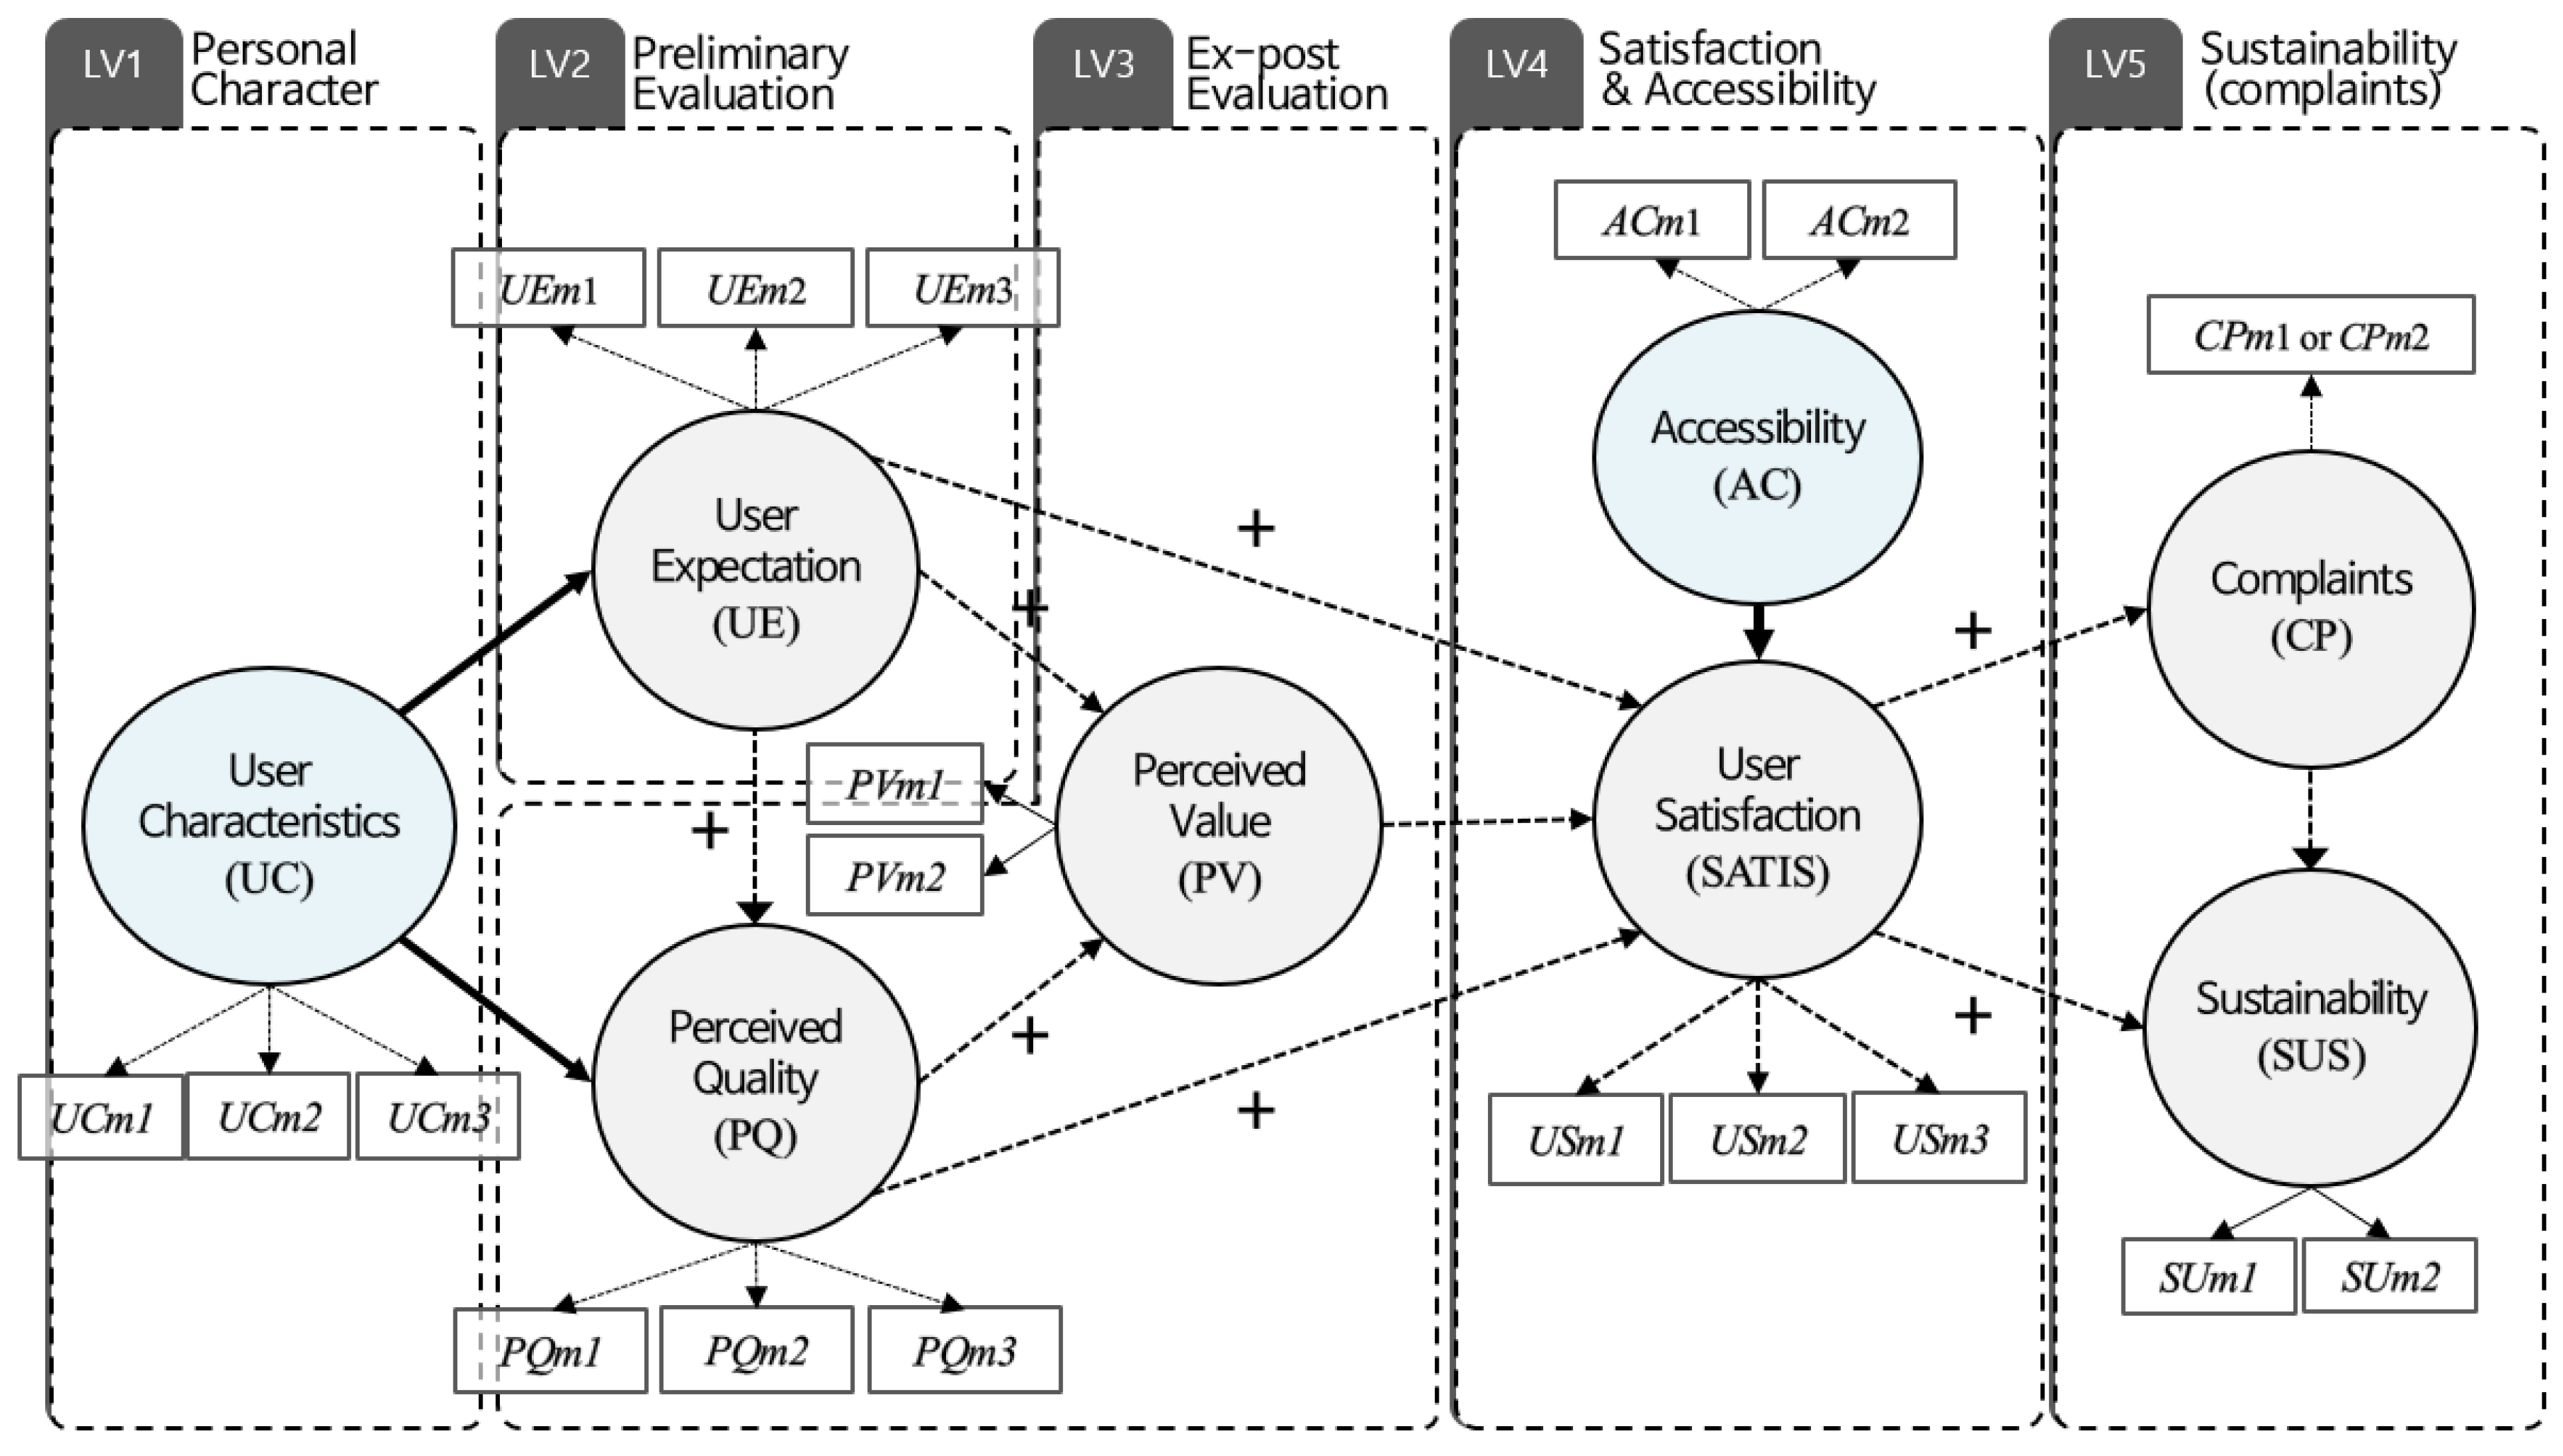
3.1. Research Framework and Model

It is necessary to listen to citizens, who are end-users of services and the subject of reproducing public information, in order to build a citizens-centric smart city. In the field of academic research, the establishment of a method to systematically perform their opinion gathering is also needed. As [50] stated, there exists a wide range of differences in interpreting a smart city in terms of system, governance, information, space, and design, and even some theories clash. However, in the area of an actual smart city project, the standardization of its technologies, facilities, and services has been called for [51,52].
As such, this study aims to present a standardized research model, which is expected to present the analysis of citizens’ use of related goods, as well as the implications for promoting their continuous utilization when related entities create, operate, and manage a smart city. It also aims to establish an evaluation model based on a widely used ex-post evaluation research model for consumers, and to lay the groundwork for standardizing tools to collect and assess citizens’ opinions on smart city infrastructures. This research will also verify the evaluation model by carrying out surveys and their quantitative analysis based on the population and samples to discuss their future applications.
In order to establish the evaluation model, this study adopted the basic structure of the Customer Satisfaction Index. The structure of this research model differs according to usages by each entity, but this has significance as it would be a tool to explore consumers’ cognition on public or private goods both in the past and at present; their experiences, and the possibility of their continuous use down the road.
Just as shown in Figure 1, major Customer Satisfaction Indexes include ACSI (American Customer Service Index), SCSB (The Swedish Customer Loyalty Barometer), ECSI (European Customer Loyalty Barometer), and NCSI (National Customer Service Index). They are based on the Structural Equation Modeling (SEM), which began to be discussed in the 1970s and was expanded to analyze service quality, or SERVQUAL, in 1980s [53].
These SEMs are used not only to measure corporate products, but also to evaluate the level of satisfaction [54] of both tangible and intangible goods provided by private and public entities as well as their brands. Despite some differences depending on countries, cities and evaluation agencies, the basic SEM structure for each index bears similarities [55].
Looking into details, the variables—“Customer Expectations” with goods, “Perceived Quality” that they evaluate after use of the goods and services, and “perceived value” of the goods for consumers’ expenses—affect the overall and comparative “satisfaction,” and those variables are defined as being interconnected. “Satisfaction” is also linked to “complaint”, which means that users’ satisfaction can be affected by suppliers’ responses when they have problems with the goods. It also indicates their expectations of the responses they receive when they have complaints. “Complaint” can then lead to sustainability, as the handling of complaints would affect consumers’ decisions on whether to continue to use the supplies and/or recommend them to others. In this regard, the SEM structure is expected to help discover the perceived advantages and disadvantages of goods, which consumers felt in the past, feel at present, and will feel in the future, and to draw implications for the improvement of the goods.
In other words, it enables a diachronic point of view in learning the formation of consumers’ cognition regarding goods in the past; their current satisfaction; and a will to use in the future. Each item of the variable is also placed on a Likert scale, which could lead to various implications through the selective analysis of items when necessary, without using the SEM. In terms of standardization, the SEM in particular could show some differences between results shown in advanced nations and in emerging nations, just as [56] pointed out. However, it is noteworthy that the very basic structure is still effectively applicable to diverse industry fields within a country or a city [57]. In this context, if the SEM structure is applied to the evaluation of a citizens-centric smart city and it could secure statistical explanatory power, the smart city can be regarded as a kind of new goods, industry, or service of a country or a city. However, the traditional SEM model was modified here, as follows, to evaluate a smart city from citizens’ point of view, just as shown in Figure 2.
First, the relationship among variable groups was re-established. The SEM for the above-mentioned Customer Satisfaction Index has already been verified through various studies. However, this study specifically considered citizens, who consume technologies, facilities and services of a smart city and produce related information. As such, “User Characteristics (UC)” was added to the modified version, just as shown in A, to see if each respondent’s demographic, economic, and social features can be well reflected to the service evaluation model. In addition, the study directly linked the ‘User Characteristics’ to “user Satisfaction” to determine if citizens’ characteristics affect their levels of satisfaction with a smart city, and if so, how much impact it would have, through which the research can draw implications for related studies on a citizens-centric smart city.
Second, evaluation items to measure the accessibility of a smart city’s TFS from the citizens’ point of view were added and verified. The insertion of these variables is based on revelations that smart city-related services provided in each country, city or region have not been frequently used, in case they are not well recognized by the people due to their low accessibility or usability [58,59]. This concept is similar to “affordance”, a behavioral psychology term, which means a way to define individuals’ behaviors through a series of experiences and knowledge. This study, however, puts a greater value on the accessibility to discuss users’ overall access to a number of goods, rather than on a single item with a clear intention. In fact, smart city-related studies have concentrated on accessibility in multiple aspects, such as its improvement in order to promote citizens’ mobility both indoors and outdoors [60]; the consideration of a greater number of populations to achieve a smart but still inclusive city [59,60]; and the public access to data collected, processed and disclosed through smart city tools.
In terms of the creation of a citizens-centric smart city, no matter how many technologies, facilities and services are adopted, they would ultimately be unsustainable if they fail to actually be utilized. So, smart city-related services are bound to be affected by their accessibility as well as being linked to citizens’ intentions to experience them, and the citizens’ satisfaction. Therefore, this study constructed the SEM by directly connecting “accessibility” with “satisfaction” and “complaint”, just as shown in Figure 2. The variables and items of each group are stated in Table 1.
Indicators here are similar or identical to those in the above-mentioned consumer satisfaction model, and they are presented in the form of questions to enhance respondents’ understanding. All the items are on the Likert 11 scale, ranging from 0 to 10, and all items are required to be answered. In case of “complaint”, however, the items are designed to assess respondents’ expectation of suppliers’ problem solving because they may not have any complaints with the TFS of a smart city.
Along with the establishment of the evaluation model, this study presented for the questionnaire comprehensive information on the technologies, facilities and services of the smart city established in the target sites, to help respondents better understand what the TFS means, as some might have not recognized them even though they have used the items. So, the list of their TFS was drawn up based upon their administrative information, related reports, and academic documents. Second, interviews were conducted with government officials, scholars, and researchers in the related fields of each city to redefine the TFS currently in operation, as is shown in Table 2 below. Third, the subjects of the survey were confined to those who have had hands-on experience with TFS, so as to increase the objectivity of this research and the verification ability of the evaluation model. In order to make sure that they have used the TFS, photos and other visual materials of the infrastructure were provided to the respondents.

3.2. Study Areas and Data Collection

In addition to the research model presented above, this study conducted a survey of residents and visitors in two cities, which have often been cited as prime examples of modern smart city projects in related studies, so as to evaluate their smart city technologies, facilities and services in a comprehensive manner.
Barcelona (A) is where the TFS projects have been gradually conducted in traditional urban spaces by local governments, while Songdo (B) is where a large-scale new city development project was implemented along with the TFS introduction at the same time. However, as this study is mainly aimed at examining and verifying the applicability of the research model based upon the analysis of citizens’ responses, the name of the cities and the detailed services, advantages and disadvantages of each smart city project, and their satisfaction level will not be described here. Instead, the description will be based on the figures needed to analyze the research model and survey results. Specific research sites in the two cities were chosen through discussions with experts and civil servants in each city in order to secure valid samples. The spatial scope for the survey was set within a 2-km radius of where major TFS projects were carried out. The center of City A is where support facilities for knowledge-based industries were established as part of smart city projects, and the center of City B is where a center for the smart city operation, management and experience is located.
This study also fixed the number of respondents through stratified sampling based on the population of each administrative district and their age. However, the population setting and sampling were limited, to involve those aged between 15 and 65 in Barcelona, and those aged between 20 and 65 for Songdo. Both represent around 65.8 percent of the total population on average. The questionnaire was translated into English and the language used in each nation. The pilot survey was carried out including 52 officials in related fields in Barcelona and 73 in Songdo, in May 2018. Following the revision and review of the questionnaire, the main and additional polls were conducted from July 2018 until January 2019. Responses from 211 out of 421 people (Barcelona) and 197 out of 522 (Songdo) people were used for analysis.

3.3. Methodology

This study adopted the Partial Least Square (PLS) to analyze the SEM. As a data modeling technique for spectral data, PLS performs ordinary least squares (OLS) regressions with the least square algorithm, and it is achieved by extracting from the predictors the latent variables. As it is meant to improve the rationale of the model based on the coefficient measurement that maximizes R2, the PLS is suitable for the development and the verification of a theoretical model and is widely used in such fields as behavioral science, marketing, and organization [61].
Given that “User Characteristic” in Figure 2 is not a reflective indicator but a formal indicator, the PLS-SEM is deemed suitable for this research. As an analysis program, SmartPLS ver.3.2 was employed, and the internal consistency, reliability, validity, and the discriminant validity, among others, were applied in a comprehensive manner for its assessment. However, the composition reliability (CR) was mainly used in evaluating the internal consistency reliability of measurement variables, and the equations are as follows.
C R ( P c ) = ( i = 1 M L i ) 2 ( i = 1 M L i ) 2 + i = 1 M v a r ( e i ) ,   ( i = 1 M L i ) 2 ( i = 1 M L i ) 2 + i = 1 M ( 1 L i 2 )
where Li is the standardized outer loadings of the latent variables, ei is the error of measurement variable I, var(ei) is the variance (1 − L i 2 ) of measurement error, and M is the number of variables.
As the PLS adopted here is mainly used for non-parametric statistics, the t-value was calculated through bootstrapping to verify the significance of each path coefficient. The evaluation criteria to verify the SEM and each variable are shown in Table 3 below.

4. Results

4.1. Overview

In order to examine smart city technologies, facilities and services in the two cities for the evaluation of the SEM, this study conducted a survey on statistically significant samples, and analyzed the results. As shown in Table 4, the target site encompassed four administrative districts within a 2-km radius, and all the respondents either resided or stayed in the area. The survey was conducted face-to-face by researchers from both countries.
Reponses made by those who had experienced smart city TFS or were currently using them were chosen for analysis: In Barcelona, 211 out of a total 421 respondents were selected, and 197 out of 522 people were chosen in Songdo. The sampling error stood at ±6.74% (Barcelona, n = 211) and ±6.98% (Songdo, n = 197), at the 95 percent confidence level for 172,780 respondents each.
When asked if they know or have ever heard of a smart city, 73% of respondents (n = 421) in Barcelona (n = 437) and 84% (n = 309) of respondents in Songdo (n = 522) said that they have heard about a smart city, including such terms as digital city and ubiquitous city. However, the number of those who actually used the technologies, facilities and services installed or distributed in a smart city came far lower, at 211 (50%) and 197 (38%), respectively. Despite the low utilization rate of smart city infrastructures in overall terms, the survey showed that each respondent has used or currently uses an average of 5.27 TFSs in Barcelona and 4.12 in Songdo. The mean values for each variable collected according to the aforementioned survey are shown in the Table 5.
Looking into the details, people in Barcelona turned out to be nearly unaware of such non-exposure services as the city’s comprehensive control centers, and energy and traffic management, despite the authorities’ PR efforts. In the case of Area B, people do not know or utilize the real-time information on air and water quality and weather provided by websites or applications, as well as media boards that provide local news and information, and the safety management service for elderly citizens living alone, according to the survey. The results could have been caused by different types of TFS introduced in each city, their arrangement, PR campaigns, differences in local culture, and citizens’ way of life. These factors also can create different results in different regions, even though the same or similar TFS are installed.

4.2. Review of Research Model

In order to evaluate technologies, facilities and services of a smart city from the citizens’ point of view, this research, using the SEM and the results of the survey on each item, was applied to the model to assess their suitability and generality. The verification of this SEM was made in two phases.
First, the entirety of the samples from Barcelona and Songdo were put to the SEM to check their suitability. Second, samples of each city were inserted for analysis. If differences are spotted between the cities, the research will analyze their causes to discuss ways for improvement. If the analysis results are similar to the modeling of the existing Customer Satisfaction Index, this SEM can be said to prove its value, at least in part, as a standardized model for a citizens-centric smart city in the future. If this model that deals with multiple technologies, facilities and services of a smart city is statistically significant, it means that it can serve as a tool to evaluate users’ satisfaction by regarding multiple TFSs as one smart city, as well as to measure their evaluation on each service or technology at the same time.

4.2.1. Review of Research Model

In this part, the survey results of all respondents (n = 408) in both cities were inputted. As mentioned above, the convergence validity of the SEM was determined based on the outer loadings (Li), the reliability of the measurement variables ( L i 2 ), and the Average Variance Extracted, or AVE.
According to the analysis of the initial model shown in Table 6, the outer loadings (Li) came below 0.5 in case of “the expectation level for reliability”, which corresponds to variable No. 3 within “user expectation.” Accordingly, this research excluded the variable from the research model, and carried out the analysis again, which led to the results that the outer loading value stood at 0.07 or higher, and therefore proved its validity and reliability. The analysis of reliability L i 2 showed the level of 0.5 or higher to guarantee its credibility, and the AVE value also comes to 0.5 or higher to secure the reliability of the individual variables and the validity of latent variables.
The internal reliability evaluation of each variable is shown in Table 7, and the Cronbach’s Alpha, rho_A and CR values came to 0.6, 0.7, and 0.6 or higher, respectively, indicating that all potential variables have internal reliability. Moreover, the results of the discriminant validity by Fornell-Larker and the Chi-square test also turned out to be suitable, though they are not presented in this research. As the cross-validity of latent variables by HTMT criteria did not include one within the 90% confidence interval, each variable can be said to secure the discriminant validity. As such, the SEM proposed in this study secured consistency, reliability and validity for each item. Then, the PLS-SEM algorithm and bootstrapping were executed to analyze the SEM and derive the outer loading (regression coefficient).
As shown in Table 8, “satisfaction” revealed the highest explanatory power (0.694) based on the modified R2 criteria, which means that this research model is best optimized for measuring the actual satisfaction level. In addition, the VIF values of all variables in this SEM came to less than five, and no inter-multicollinearity occurred. Each measuring variable included in the structural model also came to less than five, indicating that there was no inter-multicollinearity.
As shown in Table 9, all the single paths presented in this study model were found to have explanatory power within the scope of being statistically accepted. When setting the respondents’ satisfaction as a final path, the highest value (based on t-stat.) turned out to be “cognition” of technologies, facilities, and services of a smart city, which was emphasized by this study; this was followed by “Perceived Value (PV)”, “User Characteristics (UC)” and “User Expectation (UE)”.
That is, citizens’ satisfaction can be maximized by the fair level of cognition of and accessibility to the smart city elements (t = 7.505, p = 0.000). This also indicates that the value of each TFS that citizens think of for their expenditure (t = 5.373, p = 0.000), socioeconomic features such as age, gender, and income level of citizens (t = 4. 929, p = 0.000) and their overall expectation level with a smart city (t = 4.472, p = 0.000), can lead to their higher satisfaction. These results suggest that there is a need to better consider such factors as citizens’ age, gender, and income (based on questions about how much each smart city infrastructure is exposed to citizens), when drawing a plan regarding smart city elements from citizens’ perspectives. It also means that, if charging for those technologies, facilities and services are needed, and economic reviews on whether the price was affordable for the current residents are needed. It is safe to say that the level of satisfaction formed through this consideration would lead to their continuous use and utilization of smart city materials (t = 4.929, p = 0.000) based on its reliability (t = 13.419, p = 0.000).

4.2.2. Analysis of All Paths of Research Model (Barcelona and Songdo)

The individual paths are determined by the mediating effect of each variable inserted into the structural model. The path model presented by this research as well as the value and the flow of the path set by 5000 times of bootstrapping are shown below. As previously mentioned, this research model is based on the SEM that evaluates images of traditional goods, services, or their suppliers, and it involves users’ expectations for smart city elements, perceived quality and value of goods after use, and chances of their future utilization based on the level of satisfaction. In this regard, as shown in Figure 3, this research model proves that technologies, facilities and services of a smart city can be considered as traditional goods and services and they can be evaluated from the users’ viewpoint.
There exists a lot of research models, paths and analysis methods presented by bootstrapping. As the latent variable in each index group shows the generalized representation in accordance with the increase in the value, however, this study is to take the upper value of each index group and their index variables which affect the satisfaction for interpretation. First, each citizen’s characteristics affect their satisfaction with the TFS, with the impacts becoming greater according to their gender, followed by age and income level. Second, (1) user expectation, (2) perceived quality after use, and (3) perceived value based upon the perceived quality all affect their satisfaction, but the perceived value, which combines (1) and (2) turned out to have greater impacts on users’ satisfaction. That is, the perceived value, which measures how appropriate their payment for those smart city elements was, impacts on their satisfaction the most. Third, “Accessibility” to each facility and service directly affects users’ overall satisfaction. Access directly to goods when necessary contributes more to the improvement of their satisfaction than any other indirect methods, such as promotion campaigns. Fourth, users’ intention of continuing the use of the TFS can be boosted when the goods were better than what users expected. Given that the installation of smart city infrastructure is still in the early stage, and many see chances of its development further, it is crucial to improve the quality of the TFS beyond people’s expectations, rather than focusing on quantitative satisfaction.

4.3. Analysis Results of Research Model for Each City

When the analysis results of the two cities were combined and then inserted into the research model, it was identical to the initial model presented by this study. However, as mentioned in the beginning, o this structural model may reveal differences when the results of each city are separately put into the research model to consider the fact that there are differences in their business methods.
In particular, it is necessary to note that the above-mentioned various Customer Satisfaction Indexes are similar in their basic structure, but have been modified and sometimes improved to fit for each country or an institution. So, the chances are that, considering business characteristics of urban planning projects or economic and cultural differences caused by their geopolitical locations, the basic model proposed above may be different among cities. Accordingly, in this section, the two subjects were analyzed in the same way through the execution of bootstrapping based on the SEM used before.
In the analysis process, based on the evaluation results of the significance and the suitability of each path presented by the bootstrapping results, the low value among the variables within the statistically insignificant latent variable group was first removed. In case the result was not significant, the same process was repeatedly executed—after removing the latent variable group and re-executing bootstrapping—until significant results were derived. The results and differences of the two cities using this process are as follows.

4.3.1. Evaluation and Comparison of Measurement Model

Through the above-mentioned process, analysis continued by roving variables until the statistical suitability was obtained. One variable group (LV) was removed from each research model of the two cities, and the final verification results for the validity showed that both cities show higher values in the outer loading (Li), reliability ( L i 2 ) and AVE (Average Variance Extracted) than the average. In regard to the details, all measurement items in the “Perceived Quality” of Barcelona were removed as they failed to explain the path of the SEM, and all items in the “user characteristics” in Songdo were taken out due to their failure to explain the path of the structural model.
After excluding the variable group that does not match the research model as shown in Table 10, the review of the reliability and discriminant validity (HTMT) of the measurement indicators for the results of the two cities were conducted, which showed that the receptive reliability and the validity were secured in most items. In the case of Songdo, Rho_A, an item for evaluating the reliability in the Accessibility group, came below the standard value. However, it still satisfied the CR value (0.6 or more) which is the baseline of the representative reliability set by this study. It also exceeded the standard value in the calculation of Cronbach’s Alpha value (0.6 or more) and HTMT (90% confidence interval 1), which are deemed to have the strictest explanatory power, so that it was determined to be acceptable (see Table 11).
After removing groups with a low explanatory power and verifying the consistency and reliability of each city, this study conducted bootstrapping 5000 times with the results, and analyzed the structural model and then derived the outer loading (standardized regression coefficient) as follows.
Here, as shown in Table 12, the approach is a control variable of the “Satisfaction” so that it was not included in calculating the regression coefficient. The analysis results showed that the satisfaction has the highest explanatory power for both models in terms of R2 standards, proving that both research models are suitable for measuring the satisfaction of technologies, facilities and services of a smart city. In addition, the value of multicollinearity (variance inflation factor, or VIF) of all variables included in the SEM of the two cities came between 1.000 and 2.555 to hover below 5, which was an acceptable result because each variable was not highly correlated with others
The suitability of each single path is as shown in the Table 13 and Table 14, and all the paths were found to be statistically significant, and no multicollinearity problem was generated, which guarantee the explanatory power for each path. Similarities and differences drawn from the results between the two cities in terms of each independent path are as follows. First, in the single route that ends with the satisfaction, accessibility has the greatest impacts on the satisfaction in both cities, which is the same result as the analysis of their converged data. This reaffirms that the TFS of a smart city will be able to boost the satisfaction of users or consumers when they are properly placed at a location they want or appropriately guided.
Second, in the single path of Barcelona, the relations between socioeconomic characteristics of citizens (t = 11.914, p = 0.000) and their satisfaction, as well as the satisfaction and expectation for resolving complaints (t = 11.302, p = 0.000), showed quite high values. That is, given that citizens’ age, gender, and income levels affect the satisfaction level, it is crucial to introduce technologies, facilities and services that best fit for citizens’ characteristics in case of established cities. It also can be inferred that listening to users’ complaints and providing a swift resolution could enhance the sustainability of a smart city from citizens’ perspective. Therefore, smart city-related technologies, facilities and services in established cities should consider the current status of the urban space and features of citizens, such as their age, gender, and income level, and it is advised to supply fresh technologies, facilities and services, which proactively reflect the citizens’ opinions. This implies the need for the comprehensive consideration of both physical and social factors of a city, including its form, related policy measures, and unique characteristics.
Third, in the single path of Songdo, the path between user expectation and perceived quality (t = 15.035, p = 0.000) showed a particularly high value compared to others. This indicated that perceived quality, which means the level of satisfaction of individuals’ expectations, is crucial in Songdo, in contrast to Barcelona where the factor was excluded. Citizens’ personal features are important in both areas, but their current social and economic circumstances turned out to specifically affect the satisfaction in Barcelona, while users’ judgments on individual values is the decisive factor in Songdo.
In comparison to Barcelona, Songdo excludes the demographic and economic features of each citizen from the structural model. What this suggests is that a project to build a new city needs to identify a wider range of demands expected to be made by an unspecified number of people, and to prioritize advanced functions, design, and the usability of advanced smart city infrastructure.

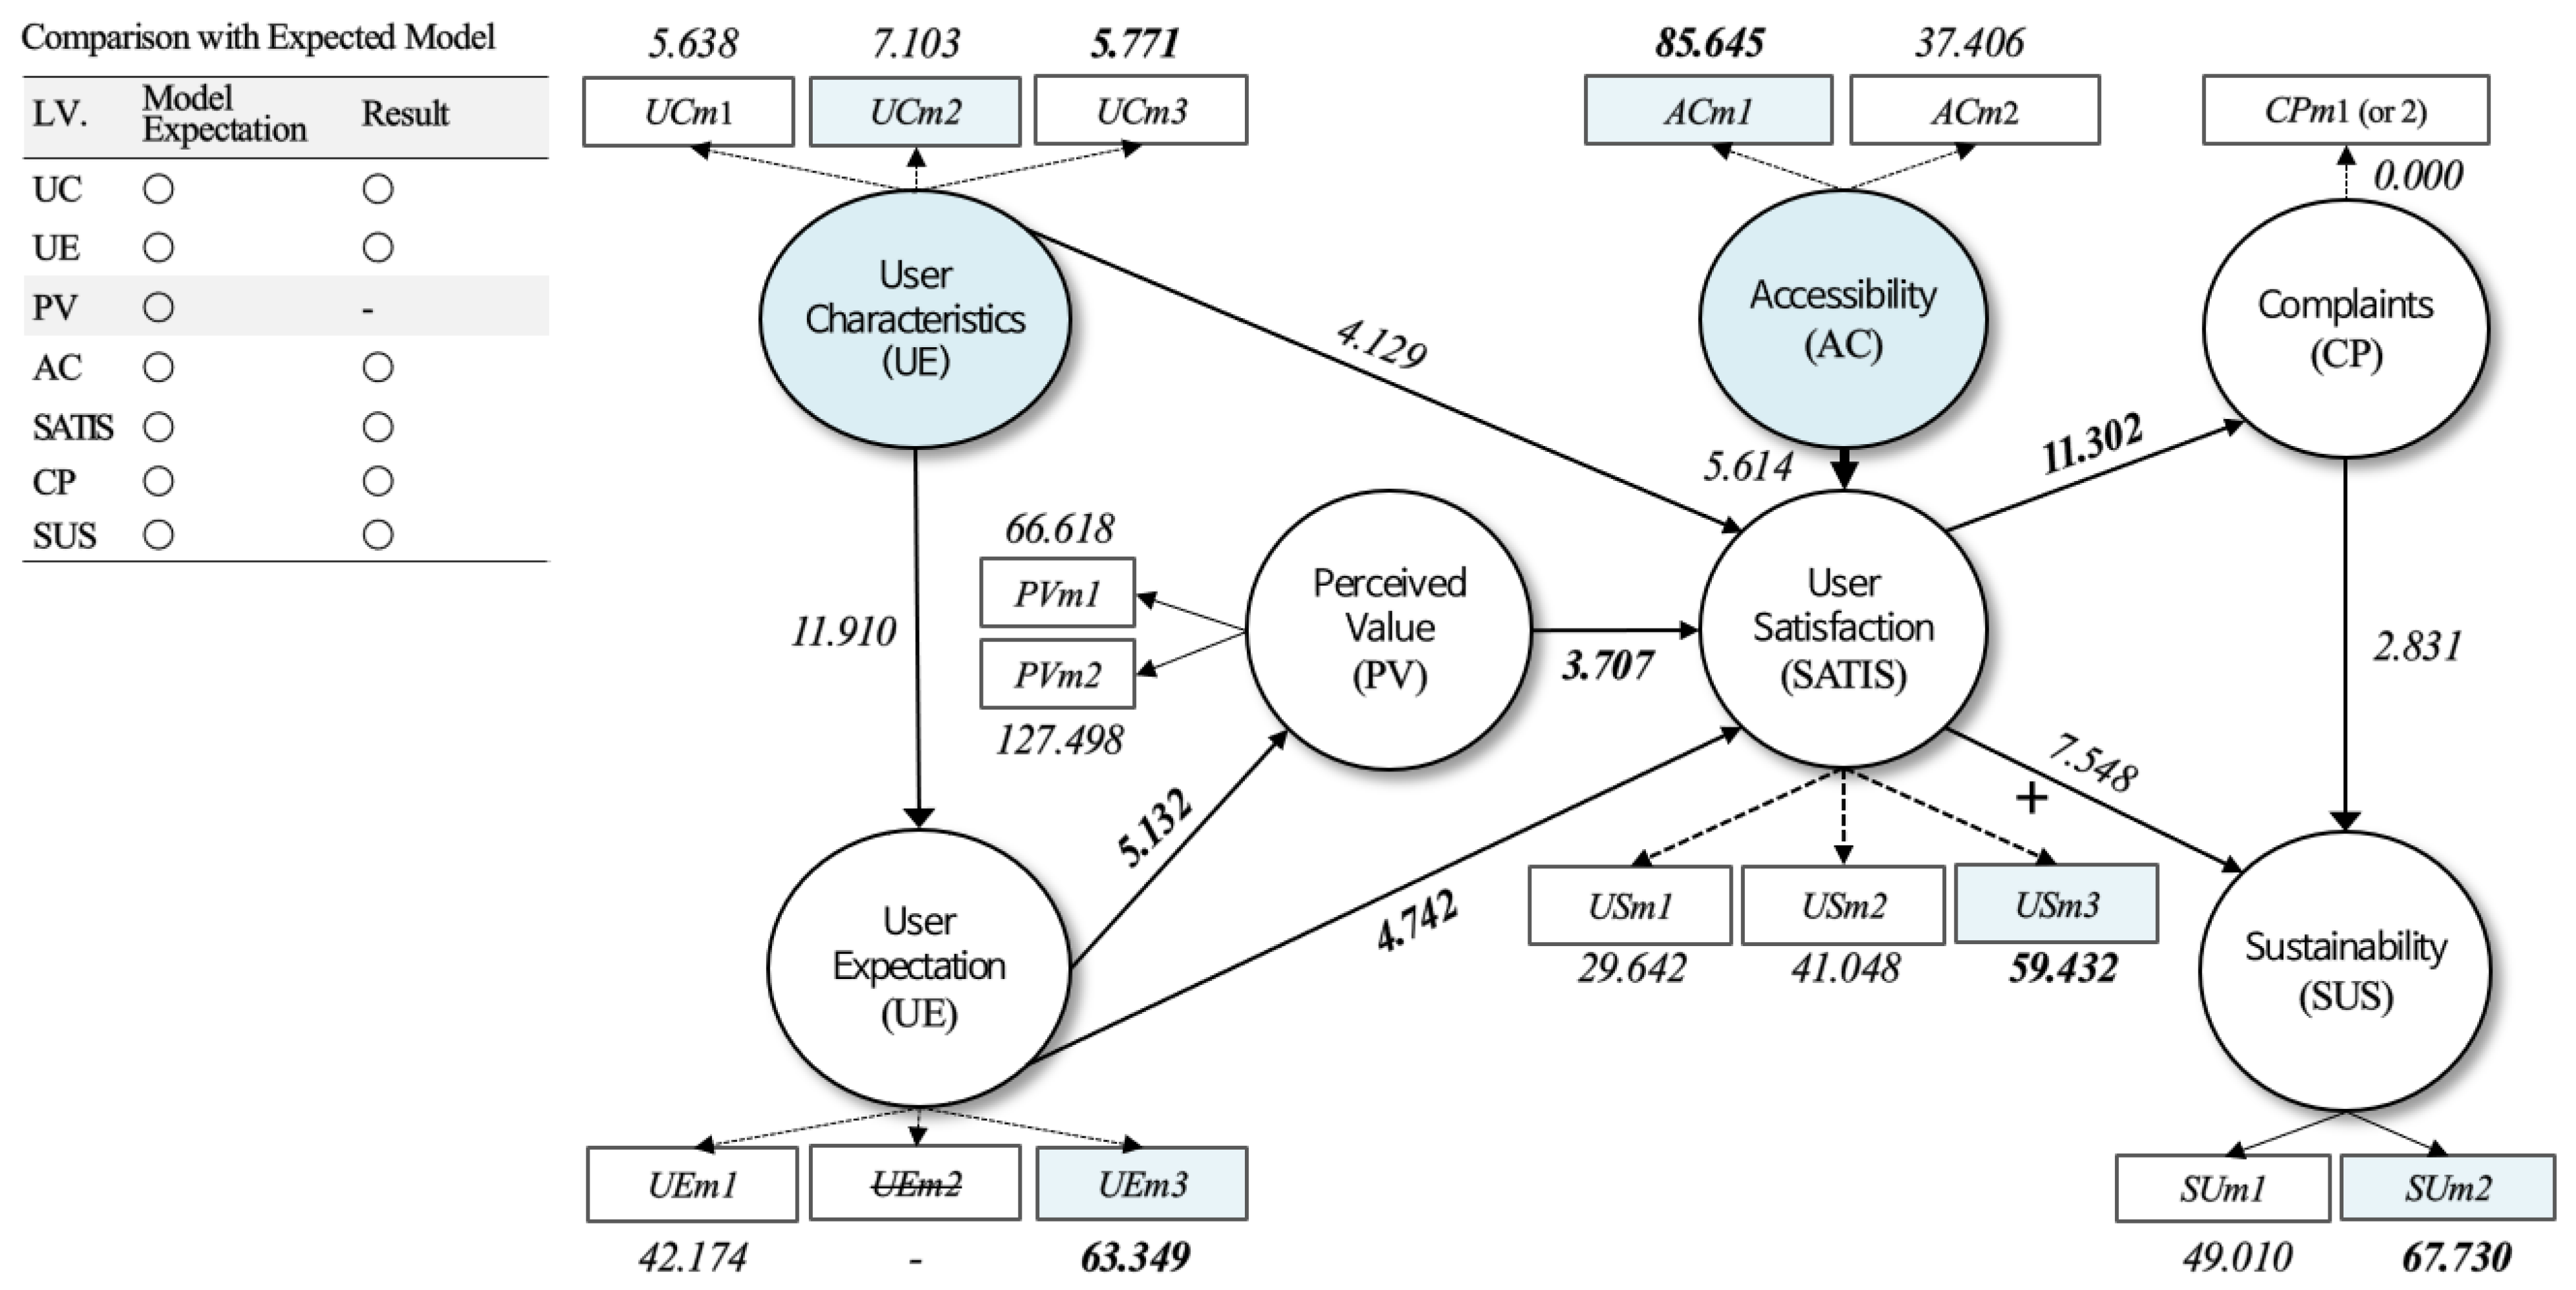
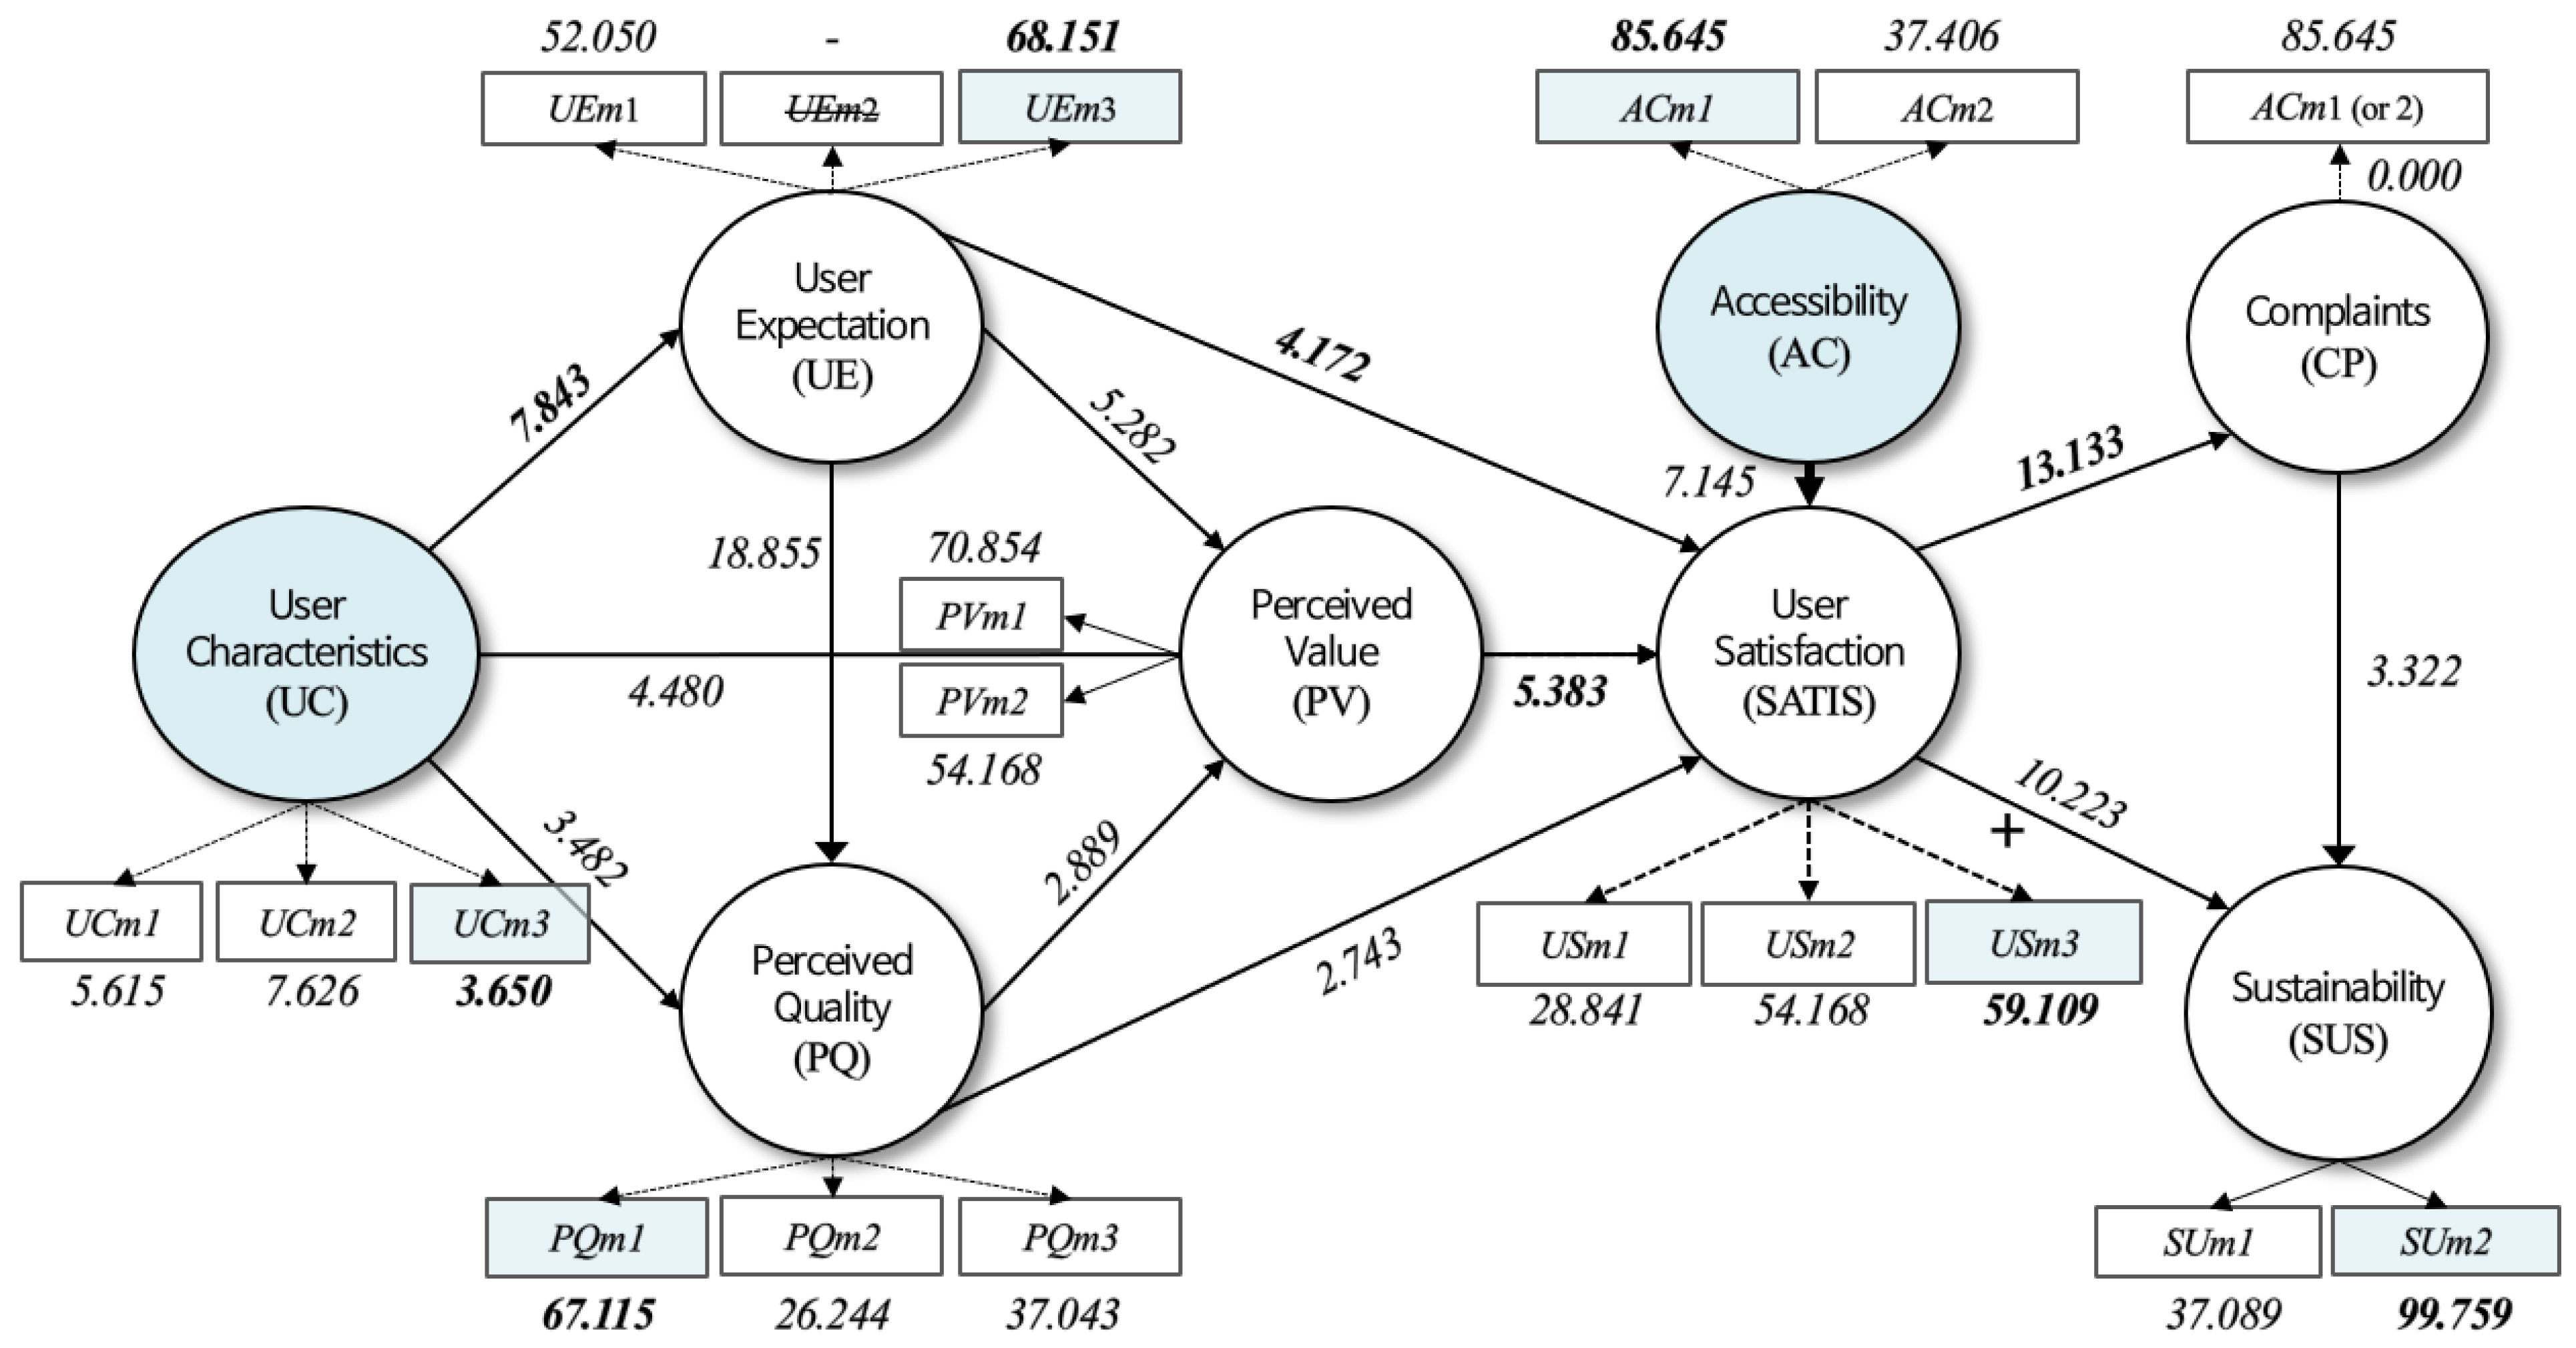
4.3.2. Analysis Results of Research Model Routes

The value of an individual path is determined by the mediating effect of each variable inserted into the structural model. The results of the two cities, as shown in Figure 4 and Figure 5, which are summarized in accordance with the path model presented here, and the value and the path flow determined by 5000 times of bootstrapping, are as follows. As explained in the survey results involving the two cities, the level of satisfaction with smart city elements in both cases is set by users’ expectations before their usage and their perceived value after the experience, based upon accessibility, and the satisfaction has a series of paths affecting the possibility of their continued use. This highlights the need for the TFS of a smart city to be considered as just the same as traditional public goods, and from the perspective of users, i.e., citizens.
However, the two cities showed structural differences. First, the satisfaction in Barcelona, where the TFS were introduced in existing urban spaces, was decided by users’ expectations before their firsthand use and their perceived value after the experience, which was affected by individual’s characteristics. In the case of Songdo, where a new city development project is under way, individual user’s characteristics are not factors to be considered, but the quality of the goods evaluated after use leads to their perceived value and satisfaction. However, given that perceived quality is not suitable for the structural model in the case of Barcelona, smart city infrastructures in an established city are needed to be chosen after taking into consideration the features of each citizen, because their expectations for the goods and their value in comparison with users’ payment could boost their satisfaction in such an established city.
Among major variables, first, in terms of users’ expectation, the importance of the reliability of smart city infrastructures was emphasized in both Barcelona and Songdo. Reliability is expected to improve their level of satisfaction with their expenditure for the goods. Second, the perceived value, which is decided after their experiences, was significantly higher in both cities in terms of “the appropriateness of the price set for facilities” than “the appropriateness of facilities compared to costs.” This could indicate that individuals may drop their intention to use the smart city facilities and services in case the price set is higher than the amount they are willing to pay. So, any decision to charge goods or to add additional charges would be required to be made carefully, in order that they do not incur the improvement of the goods.
Third, “overall satisfaction” is the most important factor, among its three items, for technologies, facilities, and services for a smart city to be introduced to existing urban spaces, such as Barcelona. However, in the case of newly built cities, such as Songdo, their satisfaction “compared to the best level of the goods” was higher than their overall level of satisfaction or previous expectations. This result implies that if this research model is verified through further studies as a tool to compare a new city with an established one, the quality improvement in the form, design, and service of the smart city elements could enhance users’ satisfaction, as it will better reflect citizens’ expectations.

5. Implication and Discussion

This study aims to monitor users’ level of satisfaction with the technologies, facilities, and services of a smart city at a time when the paradigm and the focus of a modern smart city has been changing from technology to citizens. It also aims to present a standardized evaluation system and verify it, so as to explore the possibility of its application down the road. For this purpose, the Structural Equation Model was established based on the basic structural model of the Customer Satisfaction Index, which has been widely used across the world, as well as on recent theories. A survey was also conducted involving citizens in two cities to compare their results. In order to draw implications in terms of urban planning, analysis results of the two cities were compared: one is where a smart city infrastructure was established in an existing urban space, and the other is where a smart city project was implemented in a newly built town.
As a result, the combined results of the examination of Songdo and Barcelona showed the identical structure to the prediction model based on the Customer Satisfaction Index. In other words, from citizens’ point of view, the level of satisfaction with a smart city is affected by users’ expectations for its technologies, facilities, and services before having first-hand experiences, their perceived quality after use, cost of the goods, and the accessibility to each facility. Those factors, as well as individuals’ socio-economic characteristics, were found to have guaranteed the possibility of their continuous use. The results indicate that it is important to prioritize the introduction of facilities that residents want in order to achieve a citizens-centric smart city, just as highlighted in many studies. Such a phased introduction is advised in accordance with each city’s demographic, social and economic features, rather than applying advanced technology-based platforms competitively in a drastic manner, as was called for by some previous studies and companies.
Second, the results of the analysis of each city through the research model revealed differences from the basic model, just as forecasted, but their structural features bore similarities. In Barcelona, each citizen’s socio-economic characteristics well explained their satisfaction with smart city infrastructures and their sustainability, while “Perceived Quality” was not suitable for the model. This means that characteristics of each dweller and their expectations can affect satisfaction. In the case of Songdo, where a new city development and construction project takes place, city members’ socio-economic features do not fit for the model. Instead, the reliability of the goods, and moves to meet their personal expectations, were found to boost their satisfaction. From urban planning perspectives, these results indicate that that it is important to adopt credible and high-quality technologies, facilities, and services for a smart city, given the influx of unspecified people, while affordability for existing residents is key to effectively enhancing their overall satisfaction, just as many studies, such as [62,63], pointed out.
This study, however, has limitations in that the comparison of two cities, rather than multiple ones, could not ensure cited academic implications, so follow-up studies are deemed required by involving more entities of a similar scale, form, and conditions to expand this discourse. Many previous studies point to differences among smart cities in accordance with different urban spaces and business methods. At a time when discussions on the establishment of a citizens-centric smart city have expanded, it is crucial to spot differences among the technologies, facilities, and services of a smart city over the course of urban regeneration, redevelopment, and restoration projects, and to make suggestions to come up with proper policy measures suitable for each project [64]. Further requirements are the establishment and/or the revision of related legislation and systems in public sector, such as an opinion gathering system for planning, a monitoring and ex-post evaluation system focusing on citizens, and a certification and evaluation mechanism to maximize the application of those results to wider projects such as a national land planning. In order to create and manage a ‘Sustainable Smart City’, it is also necessary to extend financial support for the private companies or organizations which produce and distribute the smart city technologies, facilities, and services, as well as the expansion of partnerships between public and private entities, among other things [65]. This is the way to Smart City 2.0 and above, where citizens can actively participate and experience, going beyond Smart City 1.0, where citizens were limited to passive participation by technocracy.
In this regard, the research carries significance as it examined the standardized framework to evaluate smart cities from the citizens’ point of view and carried out their basic verification to highlight that smart city infrastructures can be seen as a new commodity of a city and, at the same time, a means of improving the quality of citizens’ lives. Moreover, this study has shed light on the point that a smart city would not be a matter of international competition but a useful way of improving the sustainability of a city or a region, which could be further examined by additional studies down the road.

Author Contributions

Conceptualization, J.O.; methodology, J.O.; software, J.O.; validation, J.O. and M.S.; formal analysis, J.O.; investigation, M.S.; resources, J.O.; data curation, M.S.; writing—original draft preparation, J.O.; writing—review and editing, M.S.; visualization, J.O.; supervision, M.S.; project administration, J.O.; funding acquisition, M.S. All authors have read and agreed to the published version of the manuscript.

Funding

This research was funded by a research entitled “A Study on Urban Green New Deal Implementation Using the Third Sector” to be published by the Korea Research Institute for Human Settlements in October 2021.

Informed Consent Statement

Informed consent was obtained from all subjects of survey involved in the study.

Data Availability Statement

Not applicable.

Acknowledgments

The research model and the result in this study are based on the research results of the first author’s thesis ‘Analysis of Smart City Service Evaluation Model in Citizen-friendly Aspect’ (Department of Architecture, Korea University, 2019).

Conflicts of Interest

The authors declare no conflict of interest.

References

  1. Mora, L.; Bolici, R.; Deakin, M. The First Two Decades of Smart-City Research: A Bibliometric Analysis. J. Urban Technol. 2017, 24, 3–27. [Google Scholar] [CrossRef]
  2. Alawadhi, S.; Scholl, H.J. Smart Governance: A Cross-Case Analysis of Smart City Initiatives. In Proceedings of the 2016 49th Hawaii International Conference on System Sciences (HICSS), Koloa, HI, USA, 5–8 January 2016; pp. 2953–2963. [Google Scholar]
  3. ISO 37122:2019(en) Sustainable Cities and Communities—Indicators for Smart Cities. Available online: https://www.iso.org/obp/ui/#iso:std:iso:37122:ed-1:v1:en (accessed on 8 August 2021).
  4. Yigitcanlar, T.; Han, H.; Kamruzzaman, M.; Ioppolo, G.; Sabatini-Marques, J. The making of smart cities: Are Songdo, Masdar, Amsterdam, San Francisco and Brisbane the best we could build? Land Use Policy 2019, 88, 104187. [Google Scholar] [CrossRef]
  5. Nam, T.; Pardo, T.A. Smart city as urban innovation: Focusing on management, policy, and context. In Proceedings of the 5th International Conference on Theory and Practice of Electronic Governance, Tallinn, Estonia, 26–28 September 2011; pp. 185–194. [Google Scholar]
  6. Angelidou, M.; Psaltoglou, A.; Komninos, N.; Kakderi, C.; Tsarchopoulos, P.; Panori, A. Enhancing sustainable urban development through smart city applications. J. Sci. Technol. Policy Manag. 2018, 9, 146–169. [Google Scholar] [CrossRef]
  7. Bifulco, F.; Tregua, M.; Amitrano, C.C.; D’Auria, A. ICT and sustainability in smart cities management. Int. J. Public Sect. Manag. 2016, 29, 132–147. [Google Scholar] [CrossRef]
  8. Szpilko, D. Foresight as a Tool for the Planning and Implementation of Visions for Smart City Development. Energies 2020, 13, 1782. [Google Scholar] [CrossRef] [Green Version]
  9. Haarstad, H. Constructing the sustainable city: Examining the role of sustainability in the ‘smart city’ discourse. J. Environ. Policy Plan. 2017, 19, 423–437. [Google Scholar] [CrossRef]
  10. Sharifi, A. A critical review of selected smart city assessment tools and indicator sets. J. Clean. Prod. 2019, 233, 1269–1283. [Google Scholar] [CrossRef]
  11. Zadeh, T.M.; Berardi, U. Beneath the smart city: Dichotomy between sustainability and competitiveness. Int. J. Sustain. Build. Technol. Urban Dev. 2015, 6, 140–156. [Google Scholar] [CrossRef]
  12. Han, M.J.N.; Kim, M.J. A critical review of the smart city in relation to citizen adoption towards sustainable smart living. Habitat Int. 2021, 108, 102312. [Google Scholar] [CrossRef]
  13. Paskaleva, K.A. Enabling the smart city: The progress of city e-governance in Europe. Int. J. Innov. Reg. Dev. 2009, 1, 405. [Google Scholar] [CrossRef]
  14. Ruhlandt, R.W.S. The governance of smart cities: A systematic literature review. Cities 2018, 81, 1–23. [Google Scholar] [CrossRef]
  15. Hollands, R.G. Critical interventions into the corporate smart city. Camb. J. Reg. Econ. Soc. 2015, 8, 61–77. [Google Scholar] [CrossRef]
  16. Paulin, A. Controlling Citizens or Controlling the State? In Smart City Governance; ScienceDirect: Amsterdam, The Netherlands, 2019; pp. 61–79. [Google Scholar] [CrossRef]
  17. Aldama-Nalda, A.; Chourabi, H.; Pardo, T.A.; Gil-Garcia, J.R.; Mellouli, S.; Scholl, H.J.; Alawadhi, S.; Nam, T.; Walker, S. Smart cities and service integration initiatives in North American cities: A status report. In Proceedings of the 13th Annual International Conference on Digital Government Research, College Park, MD, USA, 4–7 June 2012; pp. 289–290. [Google Scholar]
  18. Yeh, H. The effects of successful ICT-based smart city services: From citizens’ perspectives. Gov. Inf. Q. 2017, 34, 556–565. [Google Scholar] [CrossRef]
  19. Alam, M.T.; Porras, J. Architecting and designing sustainable smart city services in a living lab environment. Technologies 2018, 6, 99. [Google Scholar] [CrossRef] [Green Version]
  20. Vishnivetskaya, A.; Alexandrova, E. “Smart city” concept. Implementation practice. In IOP Conference Series: Materials Science and Engineering; IOP Publishing: Bristol, UK, 2019; p. 012019. [Google Scholar]
  21. Chumakova, O. Features of “smart city” concept in urban paradigm of globalization. In MATEC Web of Conferences; EDP Sciences: Les Ulis, France, 2017; p. 01030. [Google Scholar]
  22. Macke, J.; Casagrande, R.M.; Sarate, J.A.R.; Silva, K. Smart city and quality of life: Citizens’ perception in a Brazilian case study. J. Clean. Prod. 2018, 182, 717–726. [Google Scholar] [CrossRef]
  23. Wataya, E.; Shaw, R. Measuring the value and the role of soft assets in smart city development. Cities 2019, 94, 106–115. [Google Scholar] [CrossRef]
  24. Capra, C.F. The Smart City and its citizens: Governance and citizen participation in Amsterdam Smart City. Int. J. E-Plan. Res. 2016, 5, 20–38. [Google Scholar] [CrossRef]
  25. Manchester, H.; Cope, G. Learning to be a smart citizen. Oxf. Rev. Educ. 2019, 45, 224–241. [Google Scholar] [CrossRef]
  26. Vanolo, A. Is there anybody out there? The place and role of citizens in tomorrow’s smart cities. Futures 2016, 82, 26–36. [Google Scholar] [CrossRef]
  27. Liu, N.; Gavino, A.; Purao, S. A method for designing value-infused citizen services in smart cities. In Proceedings of the 15th Annual International Conference on Digital Government Research, Aguascalientes, Mexico, 18–21 June 2014; pp. 34–43. [Google Scholar]
  28. Sánchez-Teba, E.M.; Bermúdez-González, G.J. Are Smart-City Projects Citizen-Centered? Soc. Sci. 2019, 8, 309. [Google Scholar] [CrossRef] [Green Version]
  29. Pouryazdan, M.; Kantarci, B. The Smart Citizen Factor in Trustworthy Smart City Crowdsensing. IT Prof. 2016, 18, 26–33. [Google Scholar] [CrossRef]
  30. Naphade, M.; Banavar, G.; Harrison, C.; Paraszczak, J.; Morris, R. Smarter Cities and Their Innovation Challenges. Computer 2011, 44, 32–39. [Google Scholar] [CrossRef]
  31. IBM. The Digital Era Demands Modern Government Technology. Available online: www.ibm.com/industries/government (accessed on 12 August 2021).
  32. Ericsson ConsumerLab: Smart Citizens. Available online: https://www.ericsson.com/en/blog/2014/12/smart-citizens-make-smart-cities (accessed on 25 September 2021).
  33. Capdevila, I.; Zarlenga, M. Smart city or smart citizens? The Barcelona case. J. Strat. Manag. 2015, 8, 266–282. [Google Scholar] [CrossRef]
  34. Deloitte. Smart City Development Stage. Available online: https://www2.deloitte.com/content/dam/Deloitte/tr/Documents/public-sector/deloitte-nl-ps-smart-cities-report.pdf (accessed on 10 September 2021).
  35. Castelnovo, W.; Misuraca, G.; Savoldelli, A. Smart cities governance: The need for a holistic approach to assessing urban participatory policy making. Soc. Sci. Comput. Rev. 2016, 34, 724–739. [Google Scholar] [CrossRef]
  36. Cugurullo, F. How to Build a Sandcastle: An Analysis of the Genesis and Development of Masdar City. J. Urban Technol. 2013, 20, 23–37. [Google Scholar] [CrossRef]
  37. Yigitcanlar, T.; Lee, S.H. Korean ubiquitous-eco-city: A smart-sustainable urban form or a branding hoax? Technol. Forecast. Soc. Chang. 2014, 89, 100–114. [Google Scholar] [CrossRef] [Green Version]
  38. Shwayri, S.T. A Model Korean Ubiquitous Eco-City? The Politics of Making Songdo. J. Urban Technol. 2013, 20, 39–55. [Google Scholar] [CrossRef]
  39. Cocchia, A. Smart and Digital City: A Systematic Literature Review. In Smart City; Springer: Cham, Switzerland, 2014; pp. 13–43. [Google Scholar] [CrossRef]
  40. Cardullo, P.; Kitchin, R. Being a ‘Citizen’in the Smart City: Up and down the Scaffold of Smart Citizen Participation: The Programmable City Working Paper 30; Center for Open Science: Charlottesville, VA, USA, 2017. [Google Scholar]
  41. Bano, M.; Zowghi, D. Citizen Engagement in Smart Cities: Theoretical Dreams vs Practical Reality; IEEE Software Blog; IEEE: Piscataway, NJ, USA, 2019. [Google Scholar]
  42. Angelidou, M. Smart city planning and development shortcomings. TeMA-J. Land Use Mobil. Environ. 2017, 10, 77–94. [Google Scholar]
  43. Shelton, T.; Lodato, T. Actually existing smart citizens: Expertise and (non) participation in the making of the smart city. City 2019, 23, 35–52. [Google Scholar] [CrossRef]
  44. Lim, Y.; Edelenbos, J.; Gianoli, A. Identifying the results of smart city development: Findings from systematic literature review. Cities 2019, 95, 102397. [Google Scholar] [CrossRef]
  45. Trencher, G. Towards the smart city 2.0: Empirical evidence of using smartness as a tool for tackling social challenges. Technol. Forecast. Soc. Chang. 2019, 142, 117–128. [Google Scholar] [CrossRef]
  46. Hollands, R.G. Will the real smart city please stand up? Intelligent, progressive or entrepreneurial? City 2008, 12, 303–320. [Google Scholar] [CrossRef]
  47. Lee, J.; Lee, H. Developing and validating a citizen-centric typology for smart city services. Gov. Inf. Q. 2014, 31, S93–S105. [Google Scholar] [CrossRef]
  48. Hashem, I.A.T.; Chang, V.; Anuar, N.B.; Adewole, K.; Yaqoob, I.; Gani, A.; Ahmed, E.; Chiroma, H. The role of big data in smart city. Int. J. Inf. Manag. 2016, 36, 748–758. [Google Scholar] [CrossRef] [Green Version]
  49. Simonofski, A.; Asensio, E.S.; De Smedt, J.; Snoeck, M. Citizen Participation in Smart Cities: Evaluation Framework Proposal. In Proceedings of the 2017 IEEE 19th Conference on Business Informatics (CBI), Thessaloniki, Greece, 24–27 July 2017; pp. 227–236. [Google Scholar]
  50. Calzada, I.; Cobo, C. Unplugging: Deconstructing the Smart City. J. Urban Technol. 2015, 22, 23–43. [Google Scholar] [CrossRef]
  51. Anthopoulos, L.; Janssen, M.; Weerakkody, V. Smart service portfolios: Do the cities follow standards? In Proceedings of the 25th International Conference Companion on World Wide Web, Montreal, QC, Canada, 11–15 April 2016; pp. 357–362. [Google Scholar]
  52. Huovila, A.; Bosch, P.; Airaksinen, M. Comparative analysis of standardized indicators for Smart sustainable cities: What indicators and standards to use and when? Cities 2019, 89, 141–153. [Google Scholar] [CrossRef]
  53. Parasuraman, A.; Zeithaml, V.A.; Berry, L. SERVQUAL: A multiple-item scale for measuring consumer perceptions of service quality. J. Retail. 1988, 64, 12–40. [Google Scholar]
  54. Wisniewski, M. Measuring service quality in the public sector: The potential for SERVQUAL. Total Qual. Manag. 1996, 7, 357–366. [Google Scholar] [CrossRef]
  55. Ladhari, R. A review of twenty years of SERVQUAL research. Int. J. Qual. Serv. Sci. 2009, 1, 172–198. [Google Scholar] [CrossRef]
  56. Morgeson, F.V.; Sharma, P.N.; Hult, G.T.M. Cross-National Differences in Consumer Satisfaction: Mobile Services in Emerging and Developed Markets. J. Int. Mark. 2015, 23, 1–24. [Google Scholar] [CrossRef] [Green Version]
  57. Angelova, B.; Zekiri, J. Measuring Customer Satisfaction with Service Quality Using American Customer Satisfaction Model (ACSI Model). Int. J. Acad. Res. Bus. Soc. Sci. 2011, 1, 27. [Google Scholar] [CrossRef]
  58. Rashid, Z.; Melià-Seguí, J.; Pous, R.; Peig, E. Using Augmented Reality and Internet of Things to improve accessibility of people with motor disabilities in the context of Smart Cities. Futur. Gener. Comput. Syst. 2017, 76, 248–261. [Google Scholar] [CrossRef] [Green Version]
  59. de Oliveira Neto, J.S.; Kofuji, S.T. Inclusive smart city: An exploratory study. In Proceedings of the International Conference on Universal Access in Human-Computer Interaction, Toronto, ON, Canada, 17–22 July 2016; pp. 456–465. [Google Scholar]
  60. Prandi, C.; Mirri, S.; Ferretti, S.; Salomoni, P. On the Need of Trustworthy Sensing and Crowdsourcing for Urban Accessibility in Smart City. ACM Trans. Internet Technol. 2017, 18, 1–21. [Google Scholar] [CrossRef]
  61. Wong, K.K.-K. Partial least squares structural equation modeling (PLS-SEM) techniques using SmartPLS. Mark. Bull. 2013, 24, 1–32. [Google Scholar]
  62. Giyenko, A.; Cho, Y.I. Intelligent UAV in smart cities using IoT. In Proceedings of the 2016 16th International Conference on Control, Automation and Systems (ICCAS), Gyeongju, Korea, 16–19 October 2016; pp. 207–210. [Google Scholar]
  63. Viitanen, J.; Kingston, R. Smart Cities and Green Growth: Outsourcing Democratic and Environmental Resilience to the Global Technology Sector. Environ. Plan. A Econ. Space 2014, 46, 803–819. [Google Scholar] [CrossRef] [Green Version]
  64. Anthopoulos, L. Defining Smart City Architecture for Sustainability. In Proceedings of the 14th Electronic Government and 7th Electronic Participation Conference (IFIP2015), Thessaloniki, Greece, 30 August–2 September 2015; pp. 140–147. [Google Scholar]
  65. Dupont, L.; Morel, L.; Guidat, C. Innovative public-private partnership to support Smart City: The case of “Chaire REVES”. J. Strategy Manag. 2015, 8, 245–265. [Google Scholar] [CrossRef]
Figure 1. Expected research model and directions of the paths; (a) United States (ACSI); (b) Singapore (CSISG); (c) EU(ECSI); (d) Republic of Korea (NCSI); (e) Sweden SCSB; (f) Norway (NCSB).
Sustainability 13 11497 g001
Figure 2. Expected research model and directions of the paths.
Sustainability 13 11497 g002
Figure 3. Overall result of SEM based on Expected Research Model (n = 408, based on T-stats. and bootstrapping).
Sustainability 13 11497 g003
Figure 4. Overall result of SEM (Barcelona, n = 212, based on values of T-stats. and bootstrapping).
Sustainability 13 11497 g004
Figure 5. Overall result of SEM (Songdo, n = 197, based on values of T-stats. and bootstrapping).
Sustainability 13 11497 g005
Table 1. List of Evaluation Criteria.
L.V.IndexItemsClass.
User Characteristics
(UC)
UCm1Respondents’ genderMale/Female
UCm2Respondents’ ageAge
UCm3Respondents’ income levelIncome level
User Expectations
(UE)
UEm1Overall expectations for SCLikert 11pts.
UEm2Expectations for SC demand satisfaction Likert 11pts.
UEm3Expectations for SC service reliability Likert 11pts.
Perceived Quality
(PQ)
PQm1Satisfaction for overall expectationsLikert 11pts.
PQm2Satisfaction of overall demandsLikert 11pts.
PQm3Satisfaction of overall reliabilityLikert 11pts.
Perceived Value
(PV)
PVm1Price appropriateness compared to SC facilitiesLikert 11pts.
PVm2Facility appropriateness compared to costsLikert 11pts.
Accessibility
(AC)
Am1Accessibility to SC’s TFSLikert 11pts.
Am2Readability of SC-TFS guide, signsLikert 11pts.
Satisfaction
(SATIS)
USm1Overall satisfaction with SC-TFSLikert 11pts.
USm2Satisfaction compared to SC-TFS expectationsLikert 11pts.
USm3Satisfaction compared to highest SC-TFS expectation levelLikert 11pts.
Complaint
(CP)
SCm1Dissatisfaction or satisfaction with SC problem solvingLikert 11pts.
SCm1-2Dissatisfaction or expectations for SC problem solvingLikert 11pts.
Sustainability
(SUS)
SUm1Reuse intention of SC-TFSLikert 11pts.
SUm2Recommendation intension of SC-TFSLikert 11pts.
Table 2. List of Smart City Technology, Facility, and Service (TFS) of Barcelona and Songdo.
L.V.ItemsList of Smart City Technology, Facility, and Service
Barcelona
(A)
Disclosure of public information;
Smart education and tourism;Exchanges/Promotion;
Urban planning projects;
Life/community;
Ambulation/traffic monitoring.
Visualization of city operating system and solution energy use/costs;
General civil petition/administrative computer processing; CCTV for crime prevention; AWCS (Automated Waste Collecting); smart trash can; smart street light; public WiFi; smart-tech education program; smart city conference; public relations center; smart city tourism; tour guide app; R&D and support center; protection/management of elderly people; location-based local information sharing; public bicycle; car sharing; smart traffic management; real-time bus guide signboard.
Songdo
(B)
Data collection and Provision; Smart street furniture;
Urban development and construction projects;
Safety-, health-, traffic-, environmental-monitoring system.
e-General civil petition/administrative computer processing; integrated living info (parking, medical institutions, tourism, restaurants, and educational institutions, etc.); real-time air quality, water quality, and weather info (traffic/environment/safety/disaster); real-time air quality/weather information; real-time traffic/public transportation info; information-providing kiosks and media boards; public WiFi; real-time CCTV web camera; CCTV for crime prevention; public relations center; R&D and support center; integrated control; emergency care for the elderly living alone; public and shared bicycles; real-time traffic violation control and traffic safety services.
Table 3. List of Criteria for Measuring SEM’s Reliability and Validity.
CriteriaItemsEvaluation Criteria
ReliabilityCronbach’s AlphaCronbach’s Alpha ≥ 0.65
Dijkstra-Henseler’s rho_A (pA)pA ≥ 0.7
CR (composite reliability, pc)pc ≥ 0.6
Convergent ValidityOuter Loading Relevance (L)L ≥ 0.4 accepted (0.4 ≤ L < 0.7 judgment required)
Average Variance Extracted (AVE)AVE ≥ 0.70 (variable removal when falling short)
Discriminant ValidityFornell-Larcker Criterion (FLC)Adopted when AVE is higher than the greatest value of correlation
HTMT (Hetorotrait-Monotrait Ratio)HTMT ≥ 1 abandonment (lack of Discriminant Validity)
Inner VIFCollinearity StatisticVIF ≤ 5 adoption (no Variance Inflation Factor in variables)
Outer VIFCollinearity StatisticVIF ≤ 5 adoption (no Variance Inflation Factor in variables)
BootstrappingPp ≤ 0.05 (95%)
Tt ≥ 1.96 (95%)
Coefficient of determination (R2)R2 ≥ 0.50 (moderate)
Q2Q2 ≥ 0.00 (cross-validated redundancy)
Table 4. Overview of Descriptive Statistics of Respondents in Barcelona and Songdo (n = 408).
Class. 1.Class. 2.Barcelona (n = 211/172,780)Songdo (n = 197/121,988)
GenderMale10851.00%10252.00%
Female10349.00%9548.00%
Age Group(15, Barcelona) 20–294421.00%4523.00%
30–396531.00%5327.00%
40–495124.00%4724.00%
50–594019.00%3518.00%
60–65115.00%168.00%
Income Levels
(monthly)
Under 150 USD2512.00%168.00%
150–250 USD3215.00%3015.00%
250–300 USD6330.00%3317.00%
300–400 USD5325.00%8342.00%
Over 400 USD3818.00%3518.00%
Administrative Districts of SampleDistrict 17133.82%3718.83%
District 24621.82%6131.09%
District 35526.00%4925.09%
District 43818.00%4925.00%
Table 5. Comparison of Mean Values by the Indicators (n = 408).
L.V.M.VBarcelonaSongdo
User Expectations
(UE)
UEm1Overall expectation for SC7.697.43
UEm2Expectations for SC demand satisfaction7.637.58
UEm3Expectations for SC service reliability 7.407.66
Perceived
Quality (PQ)
PQm1Satisfaction for overall expectations7.846.78
PQm2Satisfaction of overall demands8.067.33
PQm3Satisfaction of overall reliability7.906.94
Perceived Value
(PV)
PVm1Price appropriateness compared to SC facilities6.196.77
PVm2Facility appropriateness compared to costs6.877.96
Satisfaction
(SATIS)
USm1Overall satisfaction with SC-TFS8.037.68
USm2Satisfaction compared to SC-TFS expectations7.236.92
USm3Satisfaction compared to highest expectation 6.846.21
Accessibility
(AC)
Am1SC-TFS accessibility8.017.04
Am2Readability of SC-TFS guides, signs7.646.36
Complaint
(CP)
SCm1-2Expectations for problem solving7.187.11
Sustainability
(SUS)
SUm1SC-TFS reuse intention7.426.60
SUm2SC-TFS recommendation intention7.307.30
Table 6. Convergent Validity Result of Barcelona and Songdo (n = 408).
L.V.M.VOuter LoadingReliabilityAve
Over 0.70Over 0.50Over 0.50
UserCharacteristics
(UC)
UCm1Gender of respondent0.7560.5720.775
UCm2Age of respondent0.7740.599
UCm3Income level of respondent0.7890.547
User Expectations
(UE)
UEm1Overall expectation for SC0.8800.7740.789
UEm2Expectations for SC demand satisfaction0.8960.803
Perceived Quality
(PQ)
PQm1Satisfaction for overall expectations0.8700.7570.695
PQm2Satisfaction of overall demands0.7990.638
PQm3Satisfaction of overall reliability0.8300.689
Perceived Value
(PV)
PVm1Price appropriateness compared to SC facilities0.9170.8410.864
PVm2Facility appropriateness compared to costs0.9420.887
Satisfaction
(SATIS)
USm1Overall satisfaction with SC-TFS0.7780.6050.684
USm2Satisfaction compared to SC-TFS expectations0.8530.728
USm3Satisfaction compared to highest expectation 0.8480.719
Accessibility
(AC)
Am1SC-TFS accessibility0.8990.8080.758
Am2Readability of SC-TFS guide, signs0.8410.707
Complaint
(CP)
SCm1-2Expectations for problem solving1.0001.0001.000
Sustainability
(SUS)
SUm1SC-TFS reuse intention0.8630.7450.795
SUm2SC-TFS recommendation intention0.9190.845
Table 7. Result of Reliability-Validity of SEM’s Latent Variables (Barcelona and Songdo, n = 408).
L.V.Cronbach’s AlphaDijkstra-Henseler’s rho_A(pA)CRHeterotrait-Monotrait Ratio (HTMT) 1
(Over 0.60)(Over 0.70)(Over 0.60)(Not Includes 1)
User Characteristics-0.7050.915Y
User Expectation0.7320.7340.911Y
Perceived Quality0.7800.7890.881Y
Perceived Value0.8440.8630.937Y
Satisfaction0.7700.7810.869Y
Accessibility0.6840.7050.766Y
Complaint0.9970.9910.996Y
Sustainability0.7450.8660.915Y
1 Not includes 1 in Confidence Interval.
Table 8. Result of Coefficient of Determination on Latent Variables (based on R2 and Adj. R2).
L.V.R2Adjusted R2
User Expectation0.1420.14
Perceived Quality0.5310.529
Perceived Value0.2610.258
Satisfaction0.6970.694
Complaint0.3090.307
Sustainability0.4140.411
Table 9. Result of Paths on a Pair of Latent Variables (Barcelona and Songdo, n = 408).
PathOriginal Sample Mean.STD.EVt Stat.pVIF
Cognition→Satisfaction0.3240.3240.0437.5050.000 **1.924
Complaint→Sustainability0.1390.1390.0423.3330.001 *1.000
Perceived Quality→Perceived Value0.2030.2030.0692.9490.003 *2.071
Perceived Quality→Satisfaction0.1310.1320.0482.7500.006 **2.559
Perceived Value→Satisfaction0.2620.2630.0495.3730.000 **1.363
User Characteristics→Perceived Quality0.1280.130.0373.5000.000 **1.165
User Characteristics→Satisfaction0.1730.1710.0354.9290.000 **1.223
User Characteristics→User Expectation0.3770.3810.0478.0770.000 **1.002
Satisfaction→Complaint0.5560.5560.04113.4190.000 **1.000
Satisfaction→Sustainability0.5560.5570.05410.2350.000 **1.447
User Expectation→Perceived Quality0.6710.6710.03618.890.000 **1.165
User Expectation→Perceived Value0.3450.3460.0655.3350.000 **2.071
User Expectation→Satisfaction0.2120.2110.0514.1720.000 **2.381
** p < 0.000, * p < 0.05.
Table 10. Convergent Validity Result of Barcelona and Songdo (n = 408).
L.V.BarcelonaArea B
Outer
Loading (Li)
Reliability
( L i 2 )
Ave.Outer
Loading (Li)
Reliability
( L i 2 )
Ave
>0.70>0.50>0.50>0.70>0.50>0.50
User Characteristics
(UC)
−0.7190.5170.991---
0.7480.560--
0.7000.490--
User Expectations
(UE)
0.8790.7730.8020.8760.7670.782
0.9120.8320.8920.796
Perceived Quality
(PQ)
---0.8620.7430.681
--0.7910.626
--0.8220.676
Perceived Value
(PV)
0.9320.8690.8890.8980.8060.837
0.9540.9100.9310.867
Satisfaction
(SATIS)
0.8380.7020.7310.6750.4560.619
0.8620.7430.8380.702
0.8640.7460.8350.697
Accessibility
(AC)
0.8970.8050.7280.8960.8030.720
0.8260.6820.7980.637
Complaint
(CP)
1.0001.000-1.0001.0001.000
Sustainability
(SUS)
0.8380.7020.8320.7970.6350.743
0.8620.7430.9220.850
Table 11. Result of Reliability and Validity of SEM’s Latent Variables.
AreaCriteriaStd.UCUEPQPVSATISACCPSU
BarcelonaCronbach’s α>0.60.6620.754-0.8770.8170.6291.0000.798
rho_A(pA)>0.700.7100.766-0.8770.8260.6401.0000.807
CR>0.600.7660.823-0.9690.8910.6891.0000.861
HTMTNot include 1YY-YYYYY
SongdoCronbach’s α >0.6-0.7220.7660.8080.6920.6191.0000.668
rho_A(pA)>0.70-0.7240.7770.8280.7190.7031.0000.724
CR>0.60-0.710.8230.9130.7670.7591.0000.796
HTMTNot include 1-YYYYYYY
Table 12. Results of Each Model’s Coefficient of Determination on Latent Variables (based on R2 and Adj. R2).
L.V.BarcelonaSongdo
R2Adjusted R2R2Adjusted R2
User Expectation (UE)--0.5050.503
Perceived Value (PV)0.2740.2700.3670.361
Perceived Quality (PQ)0.1860.182--
Satisfaction (SATIS)0.7500.7450.6270.620
Complaint (CP)0.3730.3700.2620.258
Sustainability (SUS)0.4530.4480.4140.411
Table 13. Results of Paths on a Pair of Latent Variables (Barcelona).
PathOriginal Sample Mean.STD.EVt Stat.PVIF
Cognition→Satisfaction0.321 0.325 0.057 5.614 0.000 ** 1.957
Complaint→Sustainability0.136 0.134 0.048 2.831 0.005 *1.595
Perceived Value→Satisfaction0.238 0.240 0.064 3.707 0.000 ** 1.279
User Characteristics→Satisfaction0.212 0.212 0.050 4.219 0.000 **1.538
User Characteristics→User Expectation0.523 0.529 0.044 11.914 0.000 **1.000
Satisfaction→Complaint0.611 0.608 0.054 11.302 0.000 **-
Satisfaction→Sustainability0.582 0.584 0.077 7.548 0.000 **2.179
User Expectation→Perceived Value0.432 0.433 0.084 5.132 0.000 **1.000
User Expectation→Satisfaction0.325 0.319 0.069 4.742 0.000 **1.934
** p < 0.000, * p < 0.05.
Table 14. Results of Paths on a Pair of Latent Variables (Songdo).
PathOriginal Sample Mean.STD.EVt Stat.PVIF
Cognition→Satisfaction0.3160.3180.0734.2970.000 **2.072
Complaint→Sustainability0.1610.1610.0712.2720.023 *1.355
Perceived Quality→Perceived Value0.3380.3370.093.7520.000 **2.021
Perceived Quality→Satisfaction0.1620.1660.0762.1230.034 *2.338
Perceived Value→Satisfaction0.2940.2970.0793.7140.000 **1.589
Satisfaction→Complaint0.5120.5110.068.4770.000 **-
Satisfaction→Sustainability0.4970.50.0776.4920.000 **1.355
User Expectation→Perceived Quality0.7110.7140.04715.0350.000 **1.000
User Expectation→Perceived Value0.3180.3190.0943.3950.001 *2.021
User Expectation→Satisfaction0.1790.1720.0901.9900.047 *2.645
** p < 0.000, * p < 0.05.
Publisher’s Note: MDPI stays neutral with regard to jurisdictional claims in published maps and institutional affiliations.

