Article

Shifts in Bacterial Community Associated with Green Manure Soybean Intercropping and Edaphic Properties in a Tea Plantation

1
Department of Soil and Environmental Sciences, College of Agriculture and Natural Resources, National Chung Hsing University, Taichung 40227, Taiwan
2
Innovation and Development Center of Sustainable Agriculture (IDCSA), National Chung Hsing University, Taichung 40227, Taiwan
*
Author to whom correspondence should be addressed.
Sustainability 2021, 13(20), 11478; https://doi.org/10.3390/su132011478
Submission received: 21 September 2021 / Revised: 14 October 2021 / Accepted: 14 October 2021 / Published: 17 October 2021

Abstract

:
The continuous cultivation with excessive application of agrochemicals has led to the deterioration of soils. Incorporating leguminous green manure (GM) was found to improve the physicochemical and biological properties of soils. However, the influence of GM soybean intercropping on the temporal distribution of bacterial communities in strongly acidic soils is less explored. In this study, a nine-month field trial of soybean intercropping was conducted in a deteriorated tea plantation. This was used to test the hypothesis that GM treatment ameliorates tea-cultivated environments through changing bacterial communities as well as edaphic properties. GM treatment was demonstrated to increase both functional and population diversity during all the months that were considered. An alteration of life strategies exhibited by bacterial communities in GM treatment was observed, which shifted from oligotrophy (Acidobacteria, Chloroflexi, and the candidate phylum WPS-2) to copiotrophy (Bacteroidetes and Proteobacteria). This also contributed to the remarkable increase in metabolic potential of bacterial communities toward all six carbon source categories. The potentially versatile organic matter decomposers and/or plant growth-promoting bacteria, such as Burkholderiaceae, Chitinophagaceae, Sphingobacteriaceae, and Sphingomonadaceae bacteria, were identified as the most effective biomarkers in GM treatment. These bacterial groups showed strong correlation with soil pH; organic matter; and available K, Ca, and Mg. The increased diversity, metabolic potential, and copiotrophic taxa provided insight into the benefits brought by soybean intercropping, with enhanced community stability, facilitated nutrient cycling, and microbe–plant interactions in the strongly acidic tea plantation.

1. Introduction

The microbes associated with plant roots is enormously diverse, and studies on plant–microbe interactions revealed that plants are able to shape their rhizosphere microbiome [1,2,3]. Several strategies have been highlighted to enrich microorganisms beneficial to plant growth and health [4,5,6]. These included changing the quantity and/or quality of root exudates via plant breeding or genetic engineering, or introducing and stimulating beneficial microorganisms by soil or crop management. Among various agricultural manipulations, the application of leguminous green manure (GM) has been found to restore soils through improving not only physicochemical but biological properties of soil [7,8]. This agricultural practice was also demonstrated to maintain microbial diversity, as well as increase the abundance of biologically and agronomically relevant groups and soil enzyme activities involved in N and P cycling [9,10].
The tea plant (Camellia sinensis L.) is a popular beverage and cash crop widely cultivated in Asian areas. In tea plantation soils, the most commonly found bacterial taxa at the phylum level were Acidobacteria, Actinobacteria, Chloroflexi, and Proteobacteria [11,12,13,14,15]. The dynamics of bacterial communities in the chronosequence of tea plantations have been studied, and beneficial bacteria were found to decrease after long-term tea cultivation [11,12]. Wang et al. [14] also indicated that the age of tea plantations served as an important factor changing the composition of soil aggregates, which further influenced bacterial metabolic activity and diversity. The tea plantation soil-associated bacterial community showed higher metabolic potential and diversity compared with other rhizo-compartments [15]. Besides, organic amendment was observed to improve microbial diversity, enhance community multi-functionality, and positively correlate with soil quality index [16,17].
The main purpose of microbial ecology studies within the rhizosphere is to facilitate the development of agricultural systems that deliver high levels of food security while reducing the environmental impacts [18]. Investigation on bacterial communities shaped by roots as well as soil properties helps to unravel microbe–plant interactions and develop more effective soil management strategies to sustain plant health. In Taiwan, there are 12,266 ha of tea plantation manipulated with conventional farming [19]. The continuous cultivation with excessive application of agrochemicals has led to the deterioration of soils such as the increase in acidity and decrease in organic matter content. Adopting soybean intercropping in the tea plantation may help to improve soil quality, which also serves as an alternative practice to suppress weed growth instead of using herbicides. However, the influence of GM treatment on bacterial communities in strongly acidic soils is still unclear. In this study, a field trial was conducted to investigate the effects of soybean intercropping on bacterial communities in a deteriorated tea plantation. Community-level physiological profiling and 16S rDNA amplicon sequencing were performed to determine the temporal distribution of bacterial community during a nine-month study period. These were used to test the hypothesis that GM treatment ameliorates tea-cultivated environments through changing bacterial communities as well as edaphic properties.

2. Materials and Methods

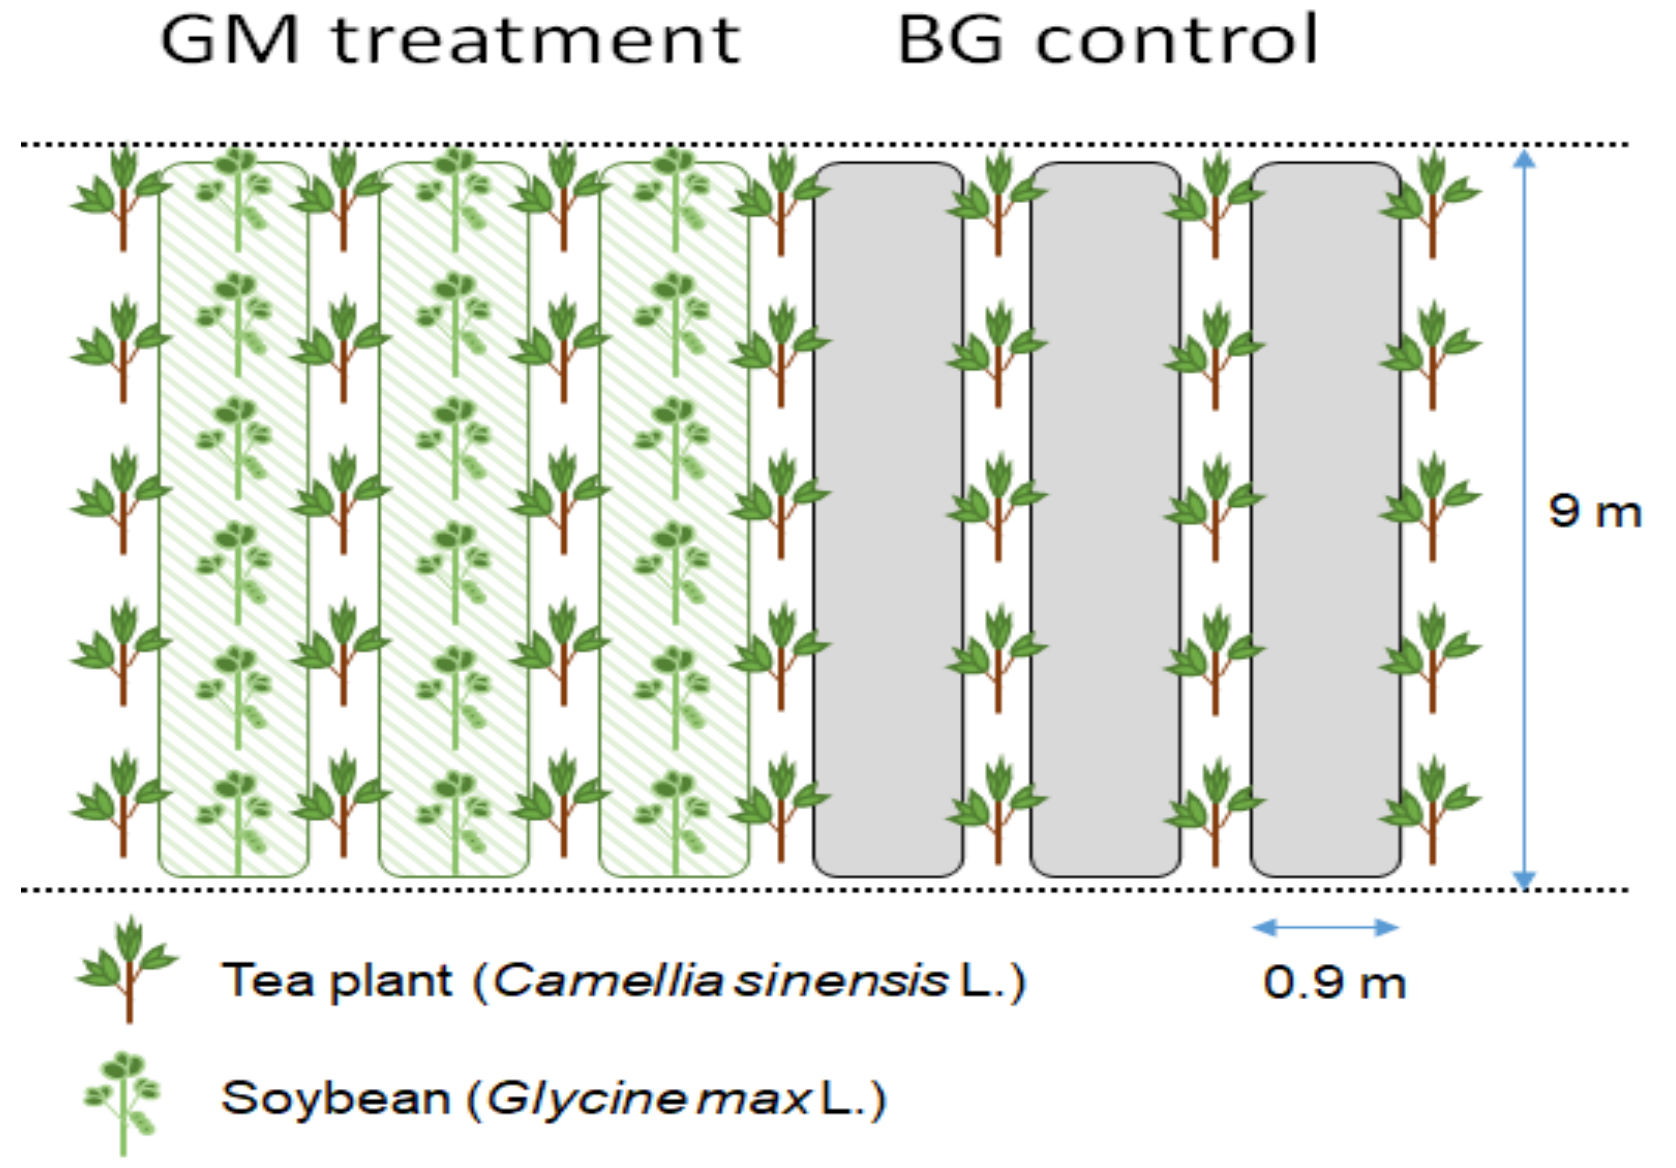
2.1. Site Descriptions and Sampling

This study was conducted during June 2020 and March 2021 in a tea plantation located in Mingchien (23°50′30.0′′ N, 120°38′33.5′′ E, elevation 369 m), Nantou, i.e., a county which occupied more than half of the tea-cultivated areas in Taiwan. The soil at the study site was classified as loam (Typic Paleudults) under the USDA soil classification system [20]. The tea cultivar grown in this field is Sijichun, a commonly found cultivar grown in this area and with an age of almost three years. The plant used in GM treatment is soybean (Glycine max L.) cultivar Tainan no. 7, a fast-growing variety with high biomass and superior drought and cold resistance [21]. During the study period, in November 2020, a total of 20 kg of vegetative meals (castor meal, peanut meal, and rapeseed meal) (N-P2O5-K2O: 6–2.1–2.1, pH 6.1) (consisting of 90% organic matter) was applied in the field with 0.1 ha in size (ca. 600 plants). Chemical pesticides, such as diafenthiuron and λ-cyhalothrin, were used in pest control.
As for GM treatment, the inter-row was manually sown with soybean seeds on 9 June 2020 at a seed rate of 30 kg ha−1. A bare ground (BG) control which was mulched with polyethylene plastic film and without soybean intercropping was used for comparison. The experiment was set up on 6 experimental plots (both treatments in triplicates), and the size of the individual plots was 9 m × 0.9 m (Figure 1). After GM treatment, the soybean rhizosphere samples were collected with a trowel from 0–20-cm-deep soils within 30 cm from the base of the soybean plant. The BG control samples were collected in parallel from the same depth of soils. Three random sampling points within each experimental plot were mixed into one sample, and six samples were obtained from six experimental plots for each sampling time point. The collected samples were placed in ice boxes, brought back to the laboratory, and stored at 4 °C. For soil chemical properties analyses, a total of 18 samples which represent three sampling time points (after three-, six-, and nine-month soybean intercropping) were collected. Soils were immediately air-dried and sieved (20 mesh for pH, EC, and nutrients determination; 35 mesh for organic matter determination) before analyses. For bacterial community analyses, a total of 30 samples which represent five sampling time points (after one-, two-, three-, six-, and nine-month soybean intercropping) were collected and used immediately. During the study period, the monthly average temperature ranged from 15.4–28.7 °C and the monthly precipitation ranged from 0–210.5 mm (Supplementary Materials Figure S1). The average daily precipitation of 3 days before the sampling dates (2 July 2020; 13 August 2020; 15 September 2020; 8 December 2020; 29 March 2021) was 0, 21, 1, 0, and 0 mm, respectively.

2.2. Analyses of Soil Chemical Properties

The pH and EC were measured as described in [22]. The Walkley–Black wet oxidation method was used to determine organic matter content [23]. Total N was determined by the Kjeldahl digestion method [24], as described in [25]. Available P, K, Ca, Mg, Fe, Mn, Cu, and Zn were analyzed by the Mehlich No. 3 procedure [26], as described in [22].

2.3. Determination of Functional Diversity and Metabolic Potential of Bacterial Communities

Community-level physiological profiling was performed based on the carbon source utilization patterns determined by Biolog EcoPlateTM (Biolog Inc., Hayward, CA, USA). Soil suspensions were prepared, 1000-fold diluted, and inoculated into each microplate well, as described in [22]. The optical density at both 590 and 750 nm was read on a microplate reader at 0, 24, 48, 72, and 96 h. The final values used to denote activity in each well were calculated, as described in [27]. Substrate richness (S) was calculated by counting total number of carbon substrates oxidized by individual treatment on Biolog EcoPlateTM (wells with OD higher than 0.25). The average well color development; substrate average well color development; and diversity parameters, including Shannon’s diversity index (H) and evenness (E), were calculated, as described in [28].

2.4. Determination of Population Diversity and Structure of Bacterial Communities

Total DNAs of soils were isolated using a DNeasy PowerSoil Pro Kit (Qiagen Inc., Germantown, MD, USA) following the manufacturer’s recommendations. Primer set 341F-805R with a barcode was used to amplify the V3-V4 region of 16S rDNA, which was further purified and used in sequencing libraries generation, as described in [22]. The libraries were sequenced on an Illumina Miseq platform and 300-bp paired-end reads were generated at Genomics BioSci&Tech Ltd., Taiwan. Raw sequence reads were submitted to the NCBI SRA database under BioProject PRJNA716948. Paired-end reads were trimmed using the Cutadapt program, merged using FLASH v1.2.11, and analyzed by FastQC v0.11.5 and MultiQC v0.9 for quality control. Operational taxonomic unit (OTU) picking was performed using mothur v.1.39.5 with 97% identity. Chimera sequences were identified using UCHIME v4.2 with Gold database, as reference data. The sequences derived from different OTU were used to perform species annotation after compared with representative sequences from the SILVA database [29]. According to species annotation, the statistical amount of sequences of every sample in each classification level was calculated. The relative abundance (percentage of each OTU in total OTUs) of dominant bacterial taxa (>2%) at the phylum and the family level was expressed. In order to evaluate bacterial diversity within a community from each treatment (alpha diversity), the Chao1, Shannon index, and InvSimpson index were calculated with QIIME software [30].

2.5. Statistical Analysis

All the analyses were performed in triplicates for the BG control and GM treatment during the study period, and the results were presented as mean values. One-way ANOVA (analysis of variance) and the Tukey HSD test (p < 0.05) were used to evaluate the significant differences between treatments using XLSTAT statistical software (New York, NY, USA). Canonical correspondence analysis (CCA) and Pearson correlation analysis were used to elucidate the relationships between dominant bacterial taxa and soil properties or metabolic potential. A hierarchically clustered hea -map was generated based on Euclidean dissimilarity metrics using the TBtools software [31]. Principal component analysis (PCA) based on Pearson correlation matrix was performed to determine the relationships between treatments and other variables, such as dominant bacterial phyla, dominant bacterial families, and color response data, based on substrate utilization. Substrate utilization assay data were analyzed after substrates were divided into six groups and the average absorbance per category was calculated [32]. All meaningful loadings (>0.5) were included and considered significant in the interpretation of principal components [33]. Biplots were constructed to interpret the analysis, with the original variables drawn as vectors to summarize the correlation between the variable and both illustrated axes [34]. Weighted UniFrac distance metric [35] was used on beta diversity analysis, to compare bacterial communities presenting in each treatment through principal coordinates analysis (PCoA) and non-metric multidimensional scaling (NMDS) with QIIME software. Linear discriminant analysis effect size (LEfSe) was determined to find biomarkers between treatments using relative abundances, and the graph which has bars representing the effect size (LDA) for particular taxa was generated. For analysis of similarities (ANOSIM), an ANOVA-like non-parametric statistic test which operates on a ranked dissimilarity matrix was performed using R packages.

3. Results

3.1. Soil Chemical Properties

The effects of GM treatment on soil chemical properties were evaluated during the nine-month study period. In comparison with the BG control, soil pH was significantly (p < 0.05) higher in GM treatment after six months of soybean intercropping (Table 1). The contents of available K, Ca, and Mg were 95%, 45%, and 103% higher in GM treatment than in the BG control. GM treatment was found to decrease EC and available Fe to a significant level after nine months. Organic matter content was slightly higher in GM treatment (1.40–2.43%) relative to the BG control (0.87–1.92%) during all the months that were considered. A higher amount of available P (256.65–331.97 mg kg−1) and low amount of Mn (6.83–9.42 mg kg−1) and Zn (1.21–2.59 mg kg−1) were observed in both treatments during the nine-month study period.

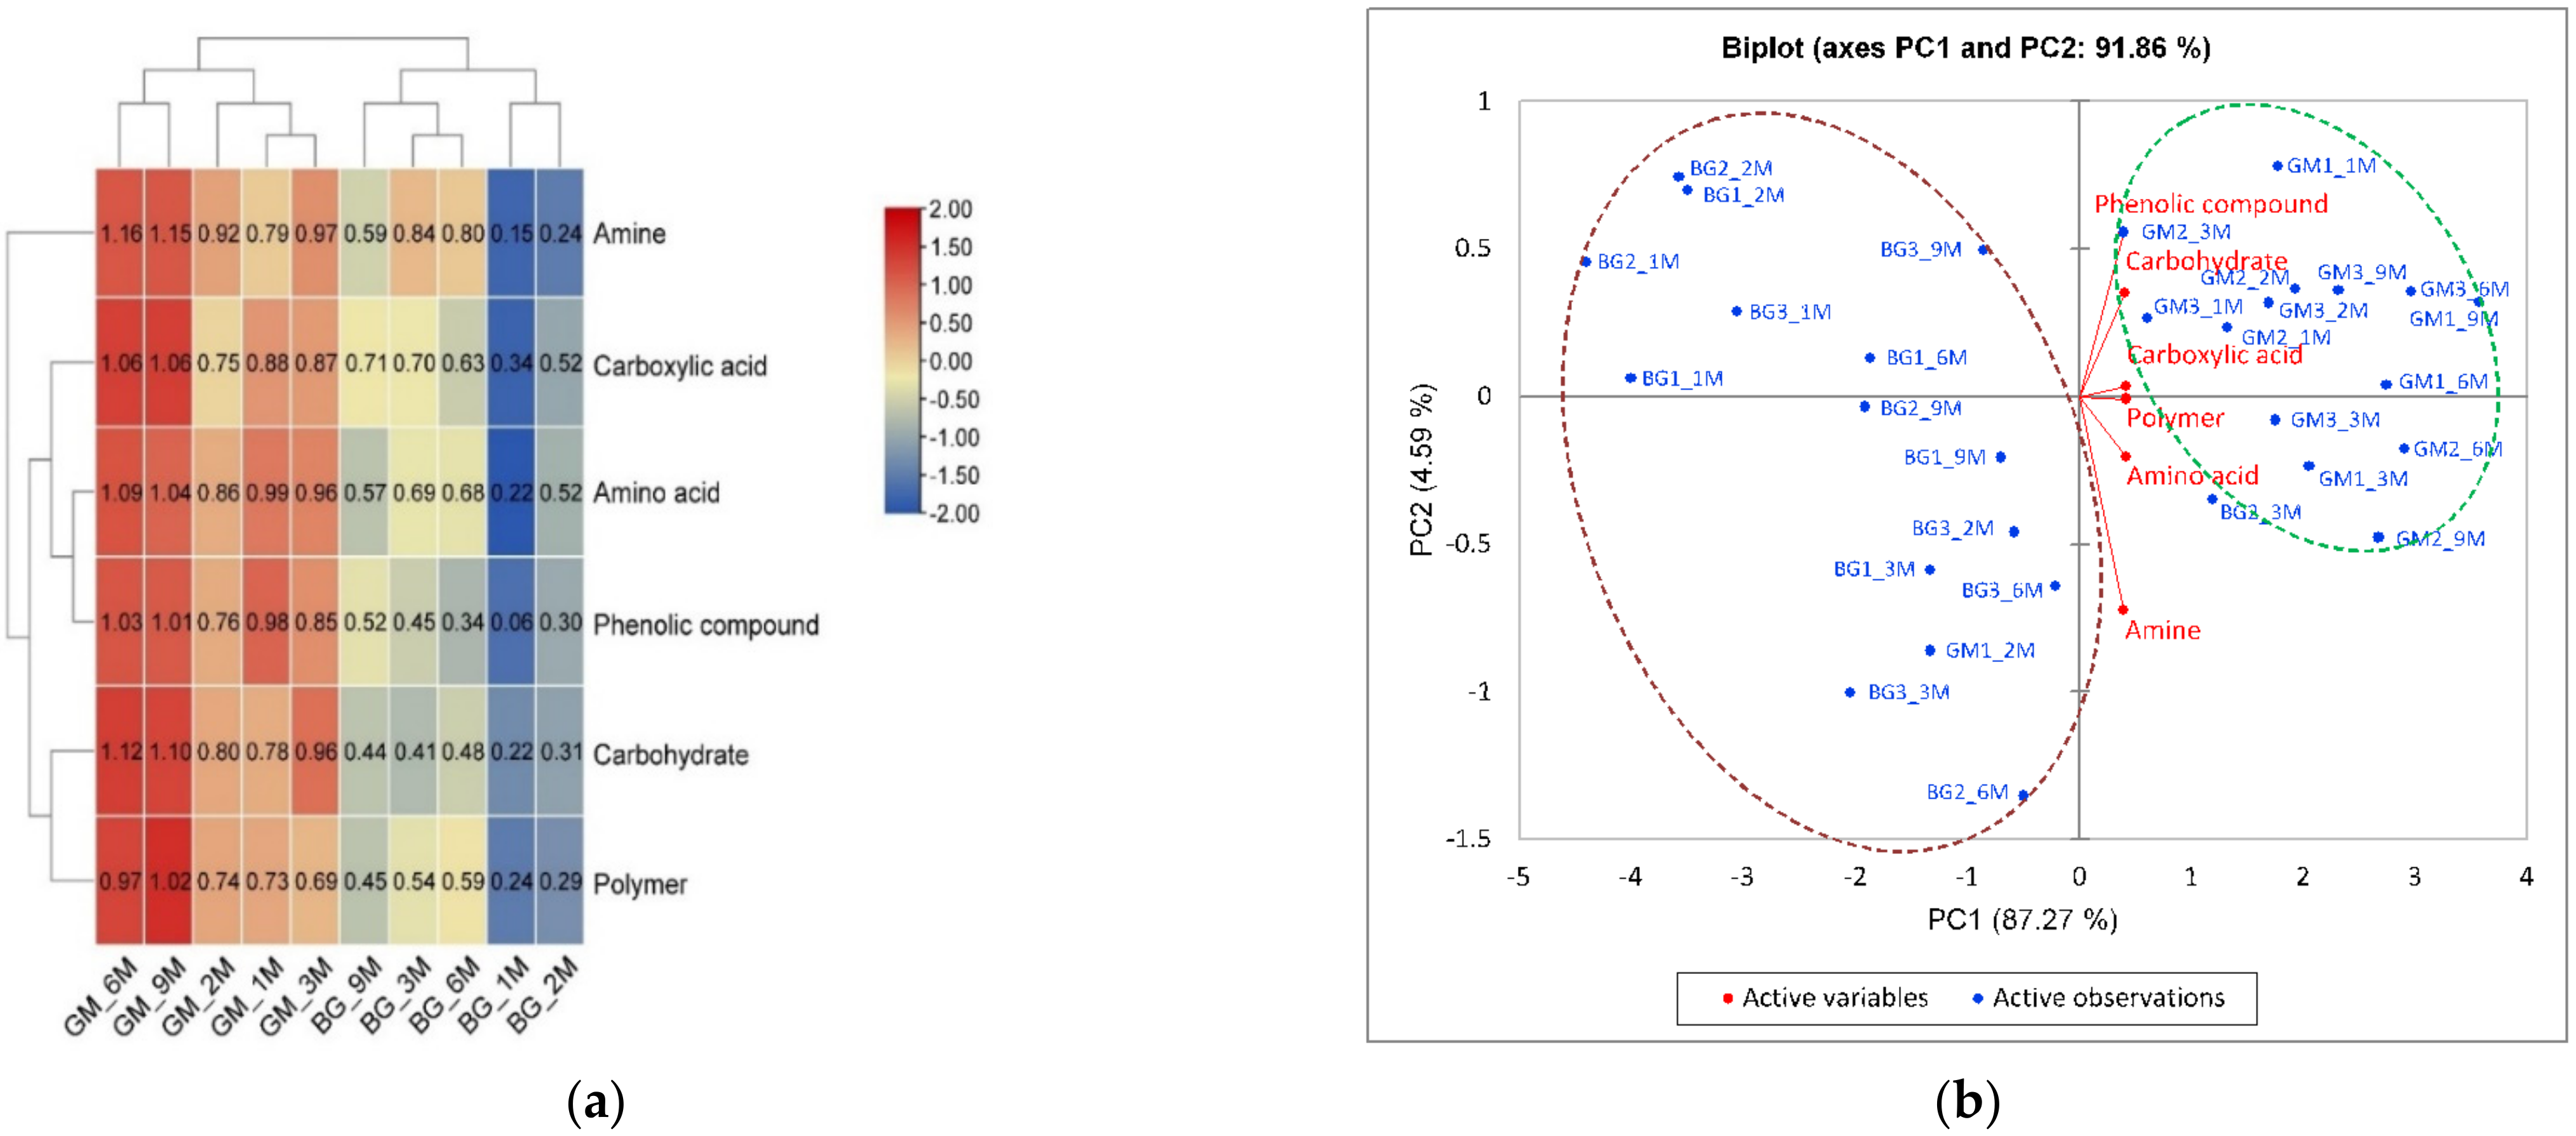
3.2. Functional Diversity and Metabolic Potential of Bacterial Communities

The carbon source utilization of bacterial communities was determined in several incubation time, and the largest difference appeared at 96 h between treatments was demonstrated. During all the months that were considered, the substrate richness and H-index were significantly (p < 0.05) higher in GM treatment than in the BG control (Table 2). GM treatment also increased the metabolic potential of bacterial communities, as revealed by the remarkably higher average well color development values (0.796–1.077) comparing with that (0.231–0.58) in BG treatment. Higher utilization of all six carbon source categories was observed in GM treatment than in the BG control, regardless of the month used for comparison (Figure 2a). PCA showed distinct differences in carbon source utilization patterns among bacterial communities in the GM treatment and BG control samples (Figure 2b). The proportion of variation explained by PC1 was 87.27%, while, by PC2, it was 4.59% in samples collected during nine months. Samples collected from GM treatment and BG control were widely separated from each other on the PC1 axis. Utilization of all six carbon source categories showed a significantly (p < 0.05) positive correlation with GM treatment while negatively correlated with the BG control (Supplementary Materials Table S1).

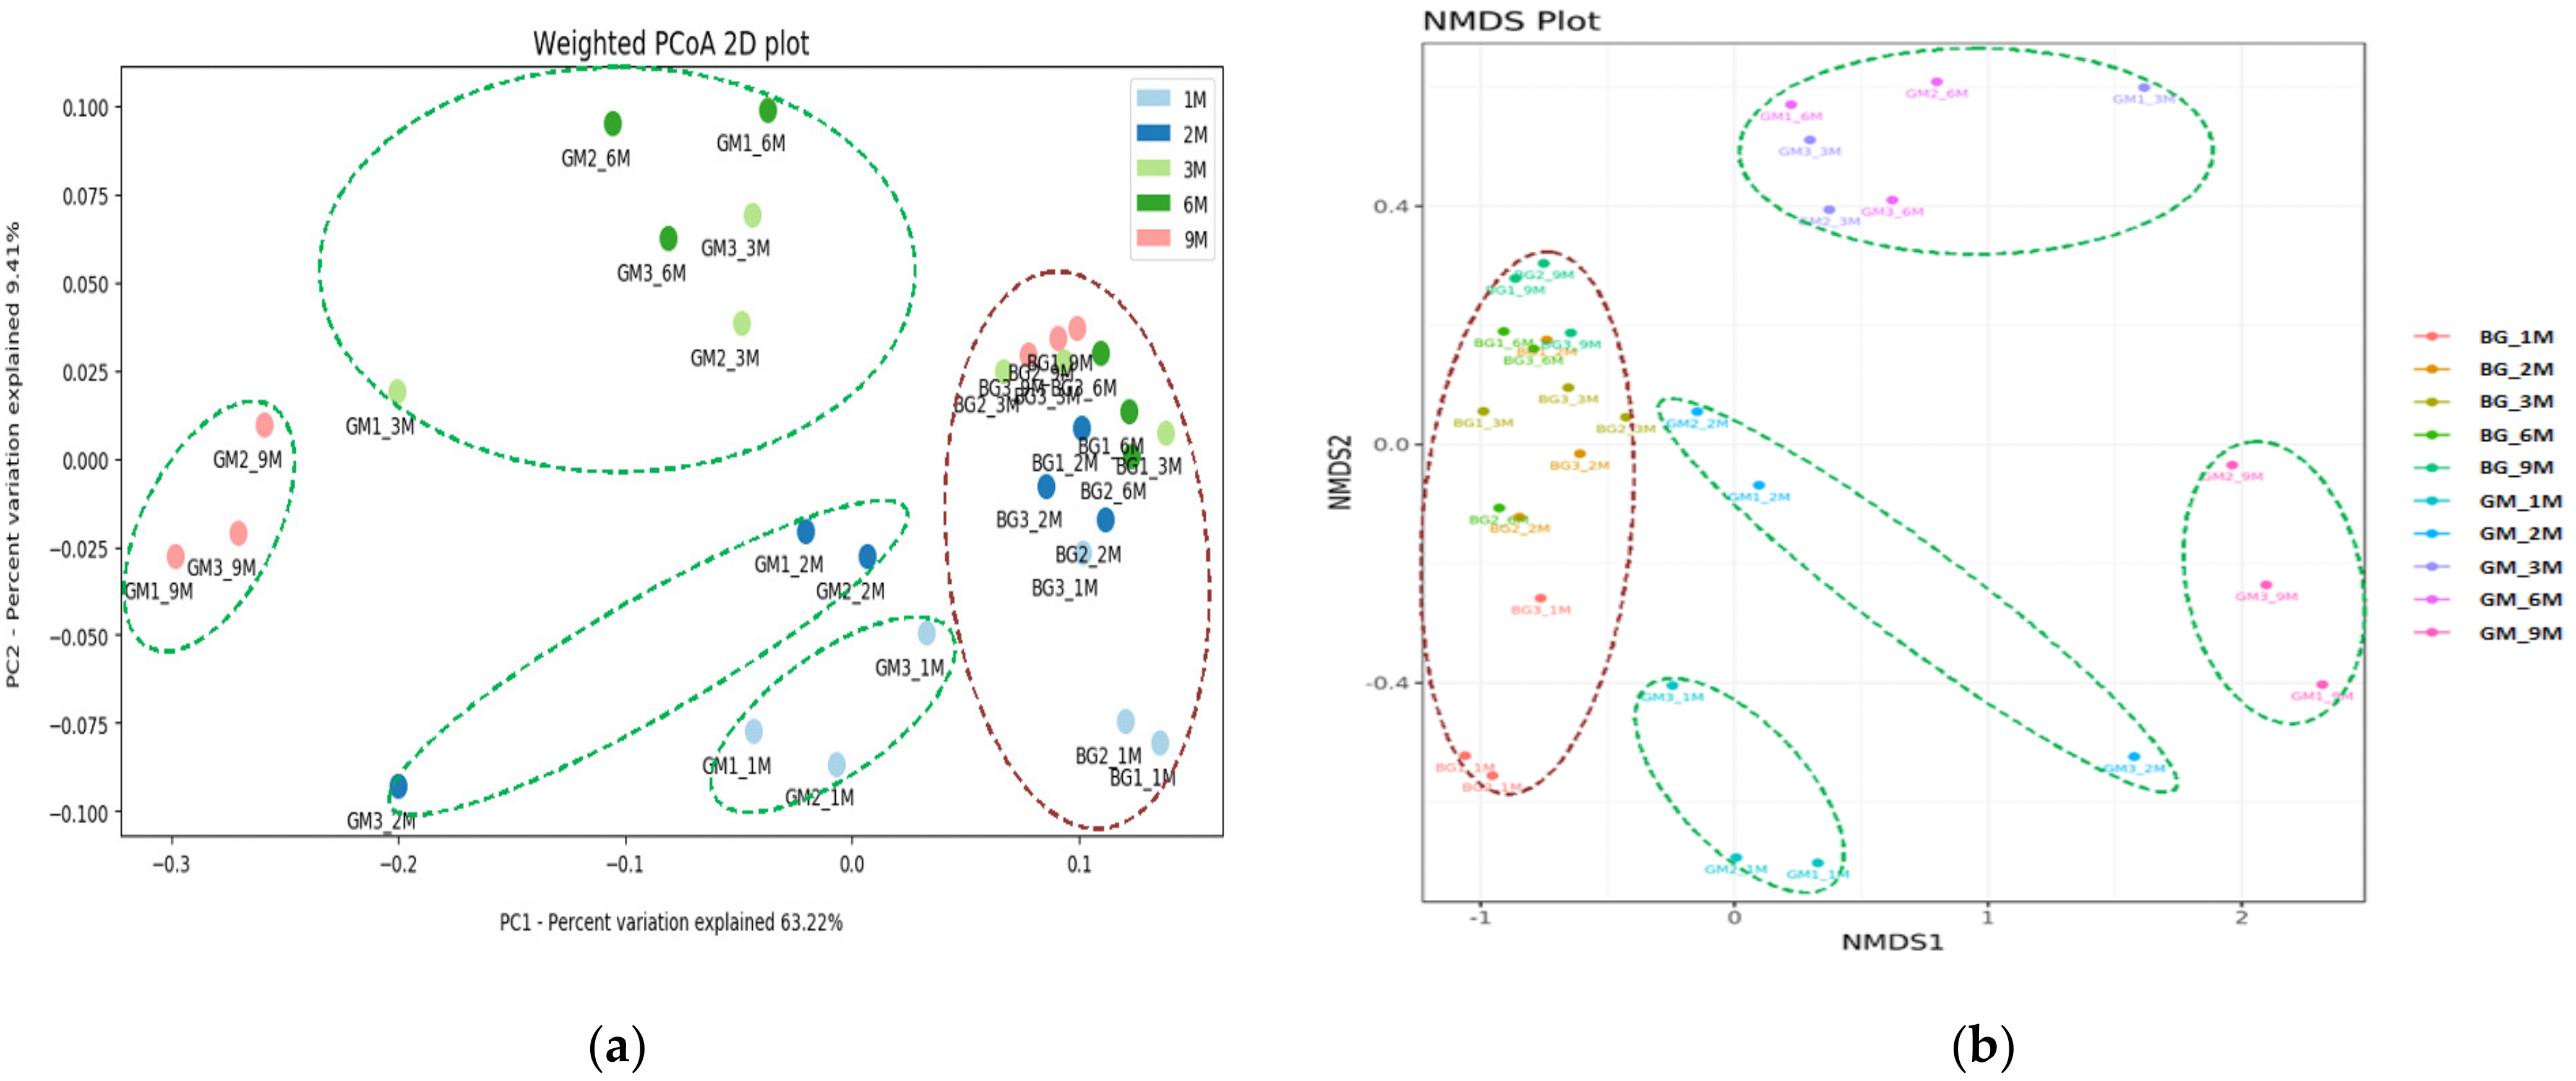
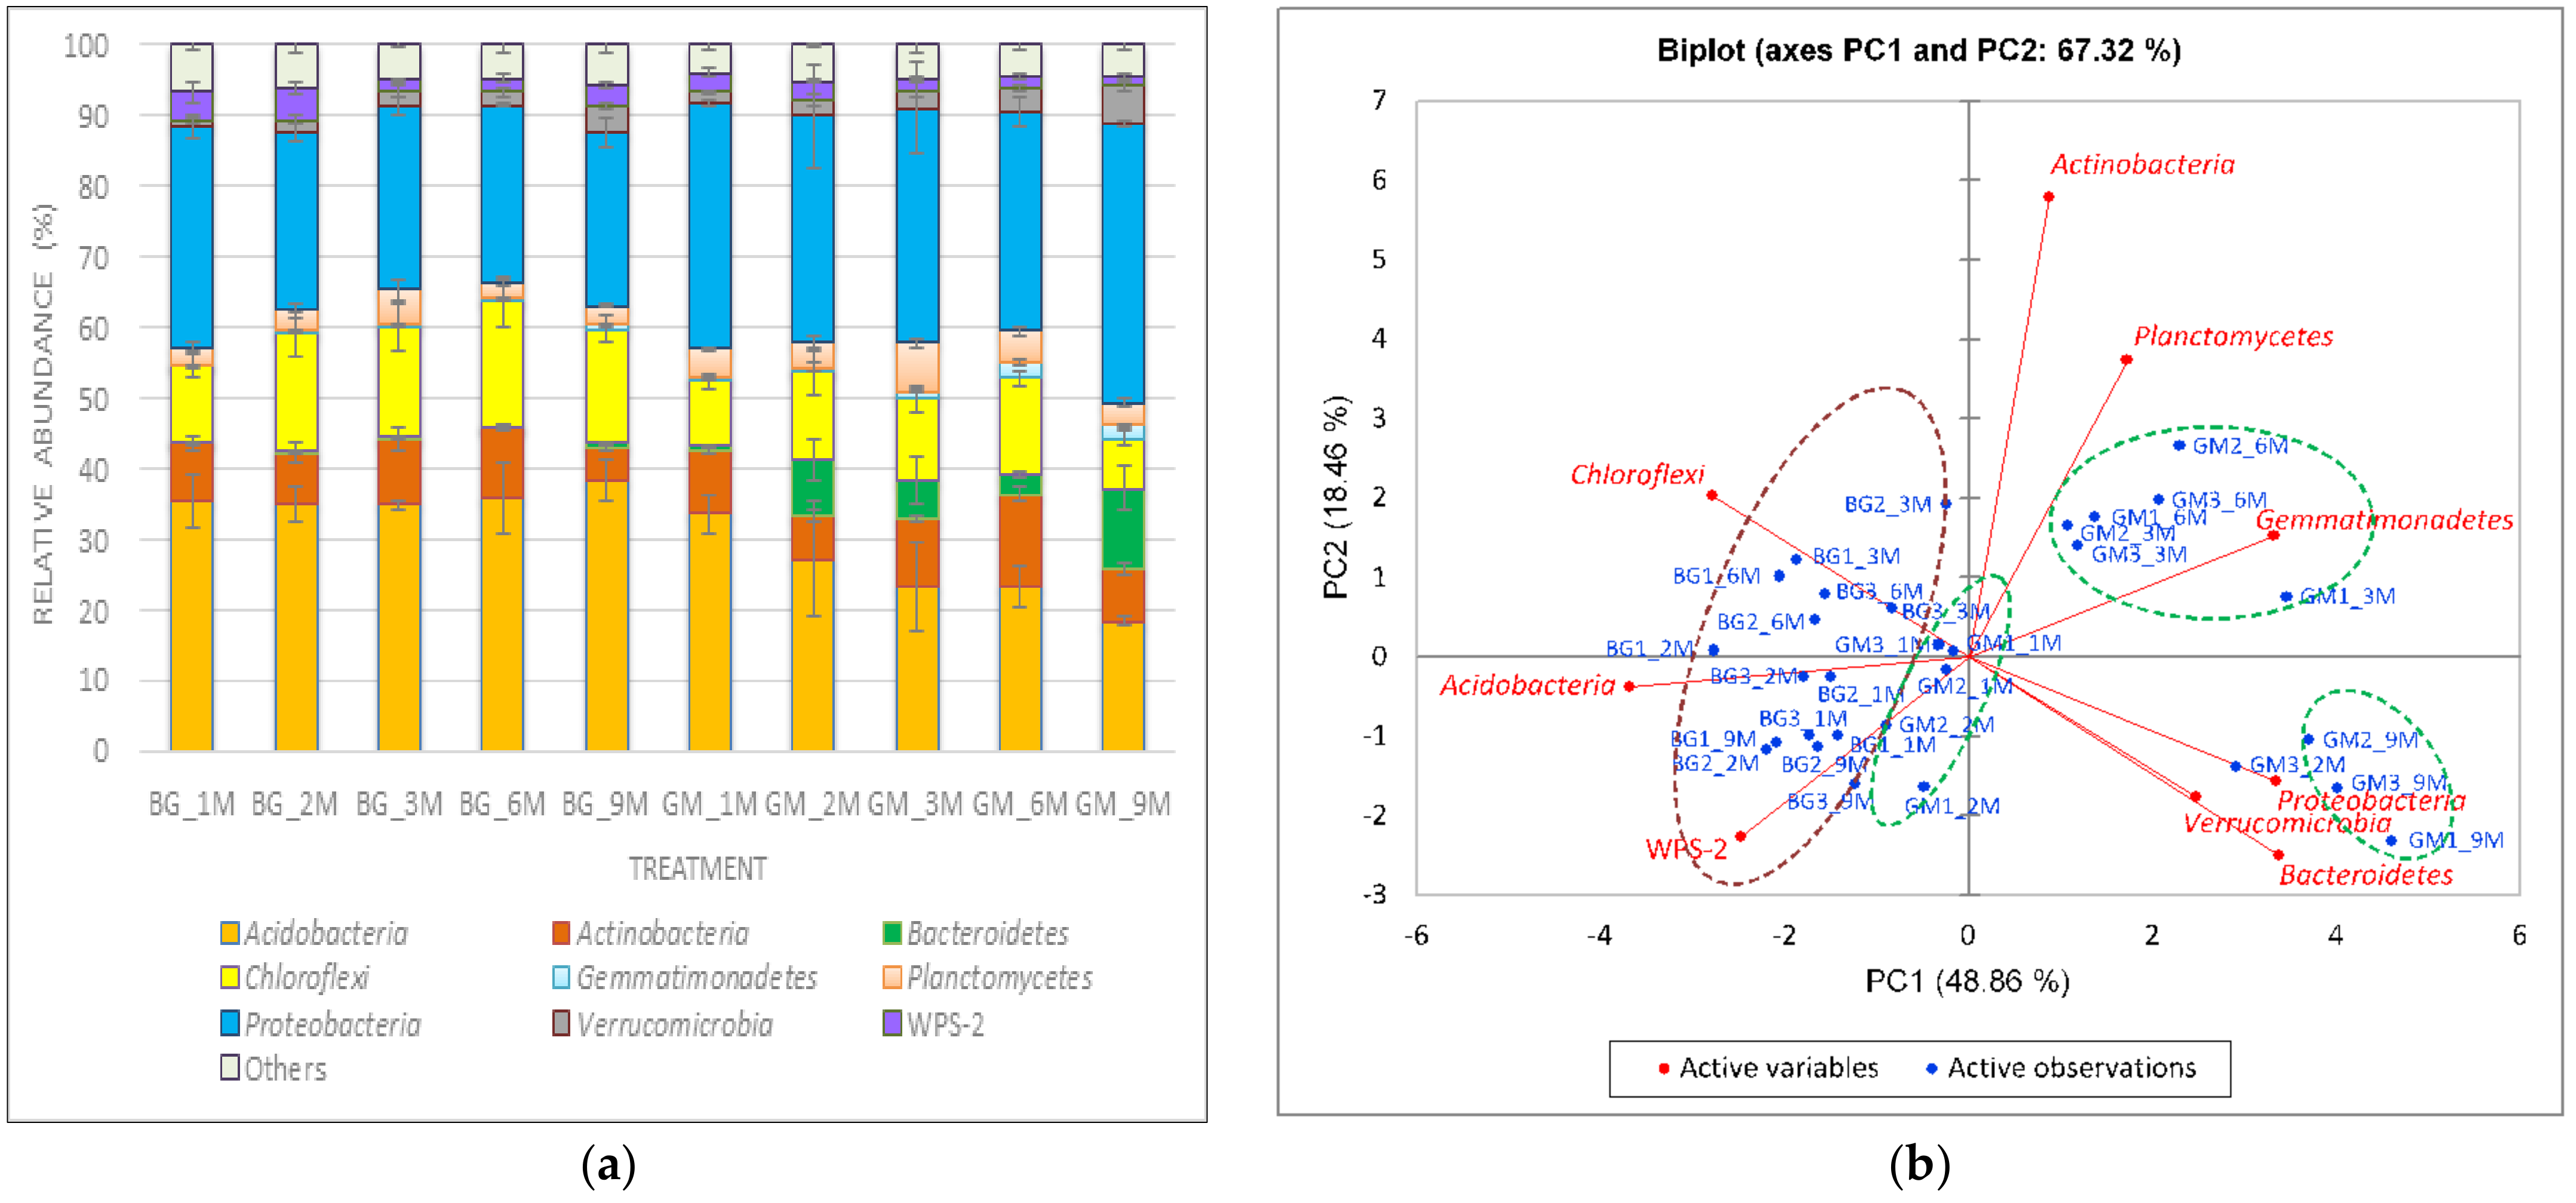
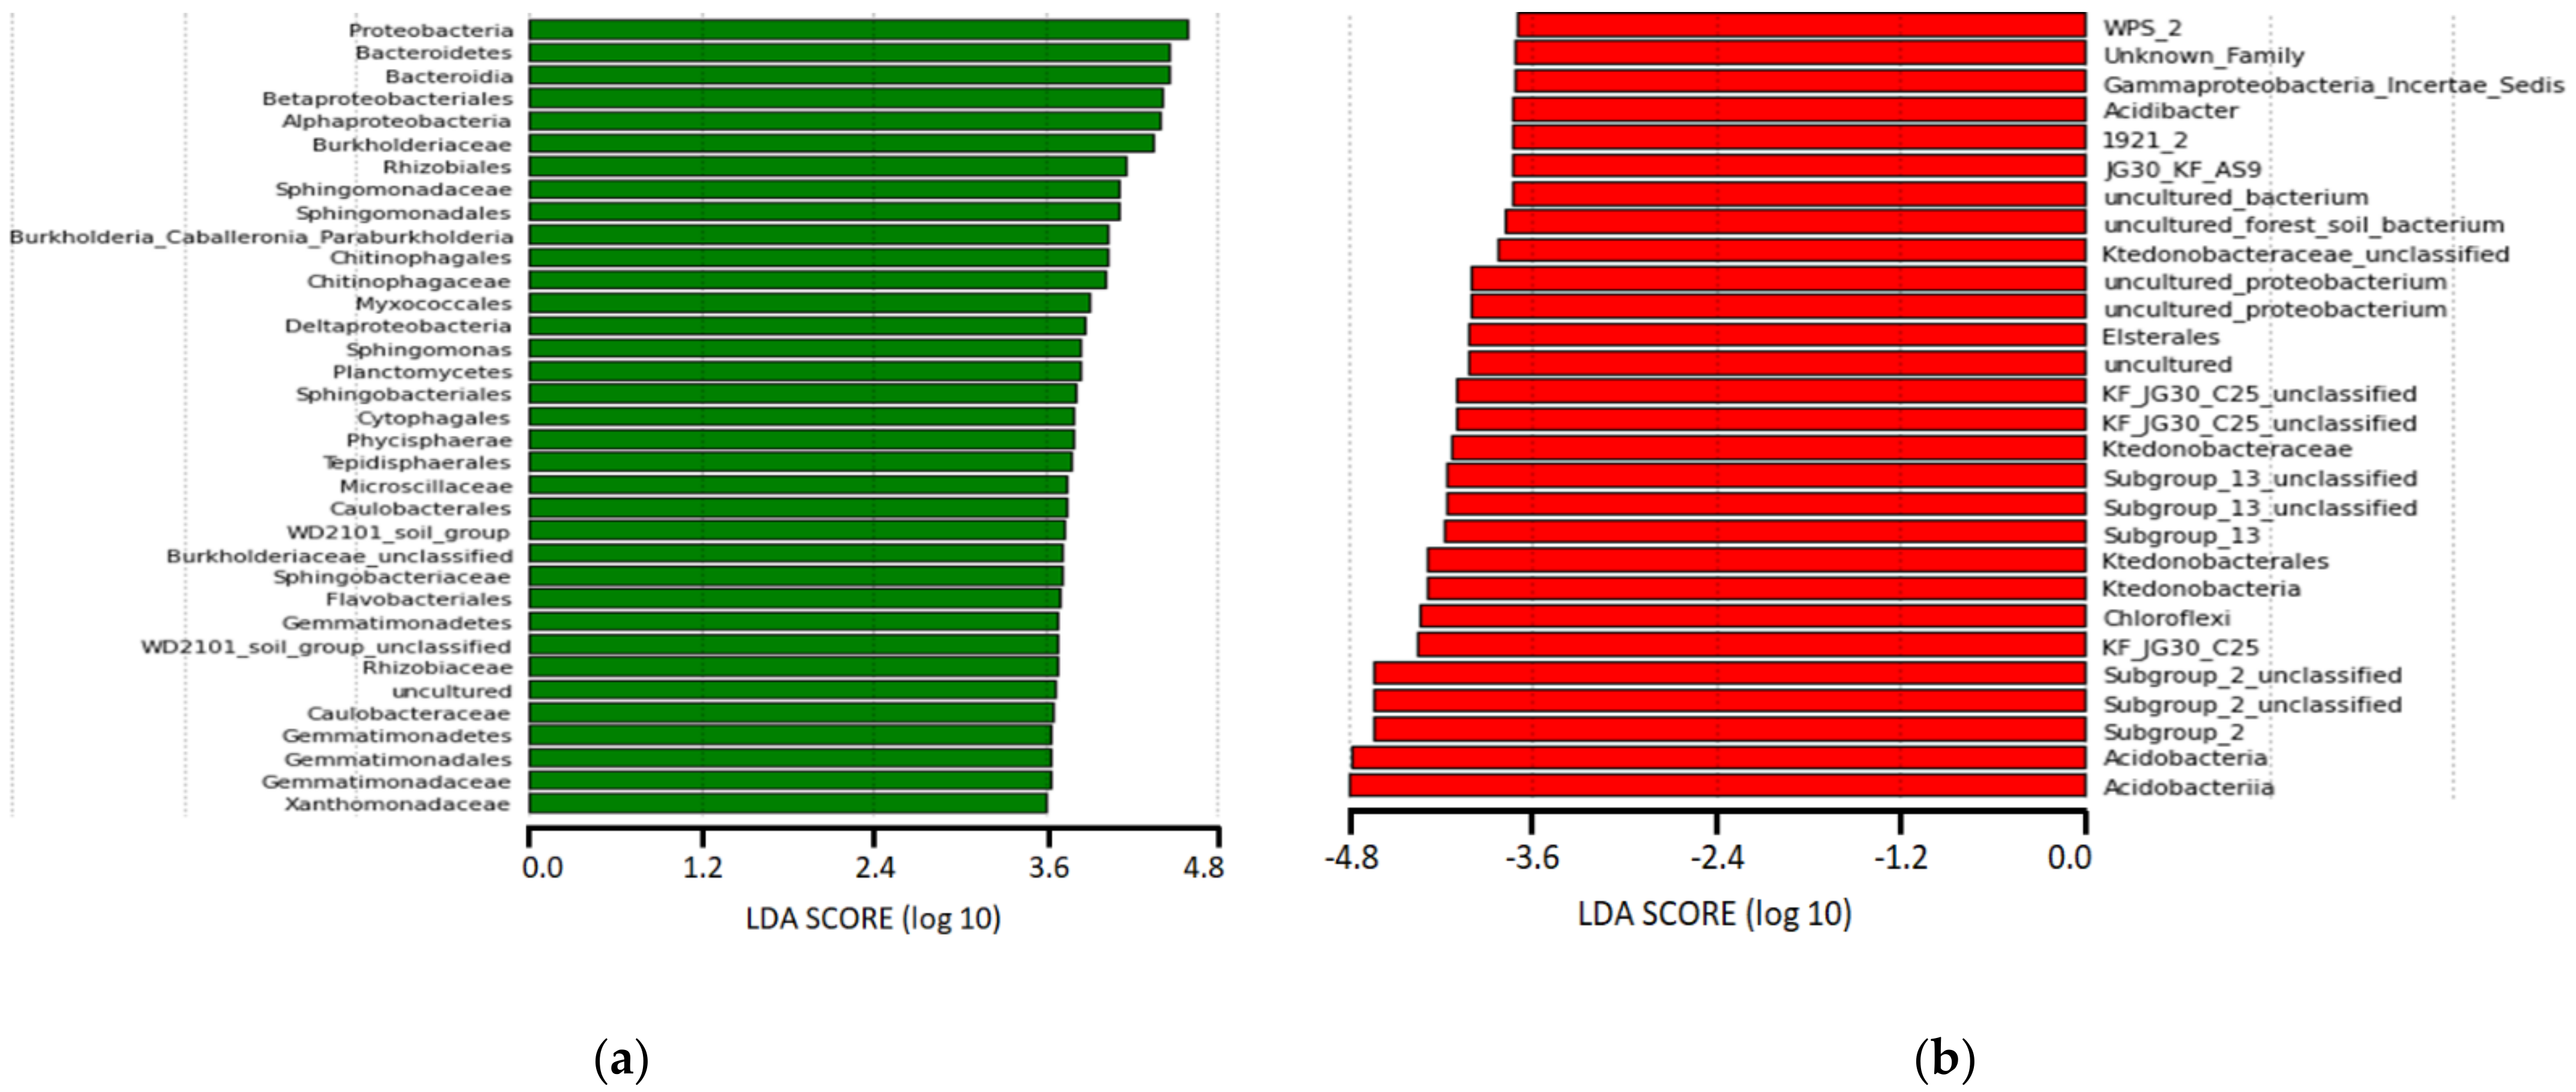
3.3. Population Diversity and Structure of Bacterial Communities

Considering all the sampling periods, the Chao1 value and Shannon diversity index revealed in GM treatment ranged from 201 to 574 and 5.516 to 7.158, respectively (Table 3). Both these values were significantly (p < 0.05) higher than that (165–277 for Chao1 and 5.125–5.422 for Shannon diversity index) observed in the BG control. After three-month soybean intercropping, the InvSimpson diversity index was also significantly higher in GM treatment (45.450) relative to the BG control (19.357). GM treatment tended to increase the Chao1 values, Shannon, and InvSimpson diversity indices as the cultivation periods increased. Shifts in the bacterial community structure in relation to GM treatment was visualized through PCoA (Figure 3a). The proportion of variation explained by PC1 was 63.22%, while, by PC2, it was 9.41% in samples collected during nine months. The distribution of samples from the BG control was closer to each other, which was far from samples collected from GM treatment. Ordination by NMDS showed that overall variation in the bacterial community structure among samples was associated with GM treatment and the sampling periods (Figure 3b). GM treatment samples collected from five sampling periods plotted further from each other, whereas samples from the BG control were closer to each other. ANOSIM also revealed a significant (p < 0.005) difference between bacterial communities in the BG control and GM treatment samples.
Dominant bacterial phyla which had higher relative abundance (>2%) in either BG control or GM treatment samples were selected and used for comparison. A total of nine phyla dominating in the BG control or GM treatment were displayed, which accounted for 93.32–95.35% or 94.92–96.18% of the relative abundance in the whole bacterial community, respectively (Figure 4a). During all the months that were considered, the relative abundances of Acidobacteria, Chloroflexi, and the candidate phylum WPS-2 revealed in the BG control were 34.83–38.26%, 10.83–17.62%, and 1.72–4.39%, respectively, which were higher than in GM treatment (18.44–33.54%, 7.23–13.82%, and 1.36–2.86%). GM treatment was demonstrated to enrich Bacteroidetes, Gemmatimonadetes, Planctomycetes, Proteobacteria, and Verrucomicrobia regardless of the month used for comparison.
PCA showed distinct differences in bacterial phyla dominating in the BG control and GM treatment (Figure 4b). The proportion of variation explained by PC1 was 48.86%, while, by PC2, it was 18.46% in samples collected during nine months. In general, the distribution of samples from the BG control was closer to that from one-month and two-month GM treatments. Furthermore, they were widely separated from three-, six-, and nine-month GM treatment samples on the PC1 axis. In most of the cases, samples collected from the BG control showed a significantly (p < 0.05) positive correlation with Acidobacteria, Chloroflexi, and the candidate phylum WPS-2, while they significantly negatively correlated with Bacteroidetes, Gemmatimonadetes, Proteobacteria, and Verrucomicrobia (Supplementary Materials Table S2). Samples collected from three- and six-month GM treatments were widely separated from nine-month GM treatment on the PC2 axis, and they showed significantly positive correlation with Actinobacteria and Planctomycetes. Besides, it was observed that nine-month GM treatment samples positively correlated with Bacteroidetes, Proteobacteria, and Verrucomicrobia.
Dominant bacterial families which had higher relative abundance (>2%) in either BG control or GM treatment samples were compared. Considering all the sampling periods, the relative abundances of Burkholderiaceae, Chitinophagaceae, Microscillaceae, Sphingobacteriaceae, and Sphingomonadaceae were higher in GM treatment (2.12–8.45%, 0.41–4.1%, 0–2.85%, 0.20–2.12%, 1.52–5%) relative to the BG control (0.09–0.39%, 0.06–0.41%, 0–0.09%, 0–0.05%, 0.31–1.27%) (Figure 5a). The higher relative abundance of Acetobacteraceae, Acidothermaceae and Ktedonobacteraceae was recorded in the BG control (1.28–3.16%, 2.01–4.64%, 4.97–8.02%) than in GM treatment (0.8–2.99%, 1.26–4.03%, 2.25–4.63%) regardless of the month used for comparison. In the PCA biplot, distribution of samples collected from one-month GM treatment was closer to the BG control samples, while they were widely separated from other GM treatment samples on the PC1 axis (Figure 5b). The BG control samples showed a significantly (p < 0.05) positive correlation with Acetobacteraceae, Acidobacteriaceae, Acidothermaceae, Ktedonobacteraceae, and Solibacteraceae (Supplementary Materials Table S2). In addition to one-month GM treatment samples, most of the samples collected from GM treatment showed a significantly positive correlation with Burkholderiaceae, Chitinophagaceae, Microscillaceae, Sphingobacteriaceae, and Sphingomonadaceae. LEfSe was used to find biomarkers in the BG control and GM treatment, and the LDA scores for particular taxa were given. The most effective biomarkers (LDA score > 3.6) identified in GM treatment included the phylum Bacteroidetes, Gemmatimonadetes, Planctomycetes, and Proteobacteria; and the family Burkholderiaceae, Caulobacteraceae, Chitinophagaceae, Gemmatimonadaceae, Microscillaceae, Rhizobiaceae, Sphingobacteriaceae, Sphingomonadaceae, and Xanthomonadaceae (Figure 6a). The most effective biomarkers (LDA score < −3.6) found in the BG control included the phylum Acidobacteria and Chloroflexi, the candidate phylum WPS-2, and the family Ktedonobacteraceae (Figure 6b).

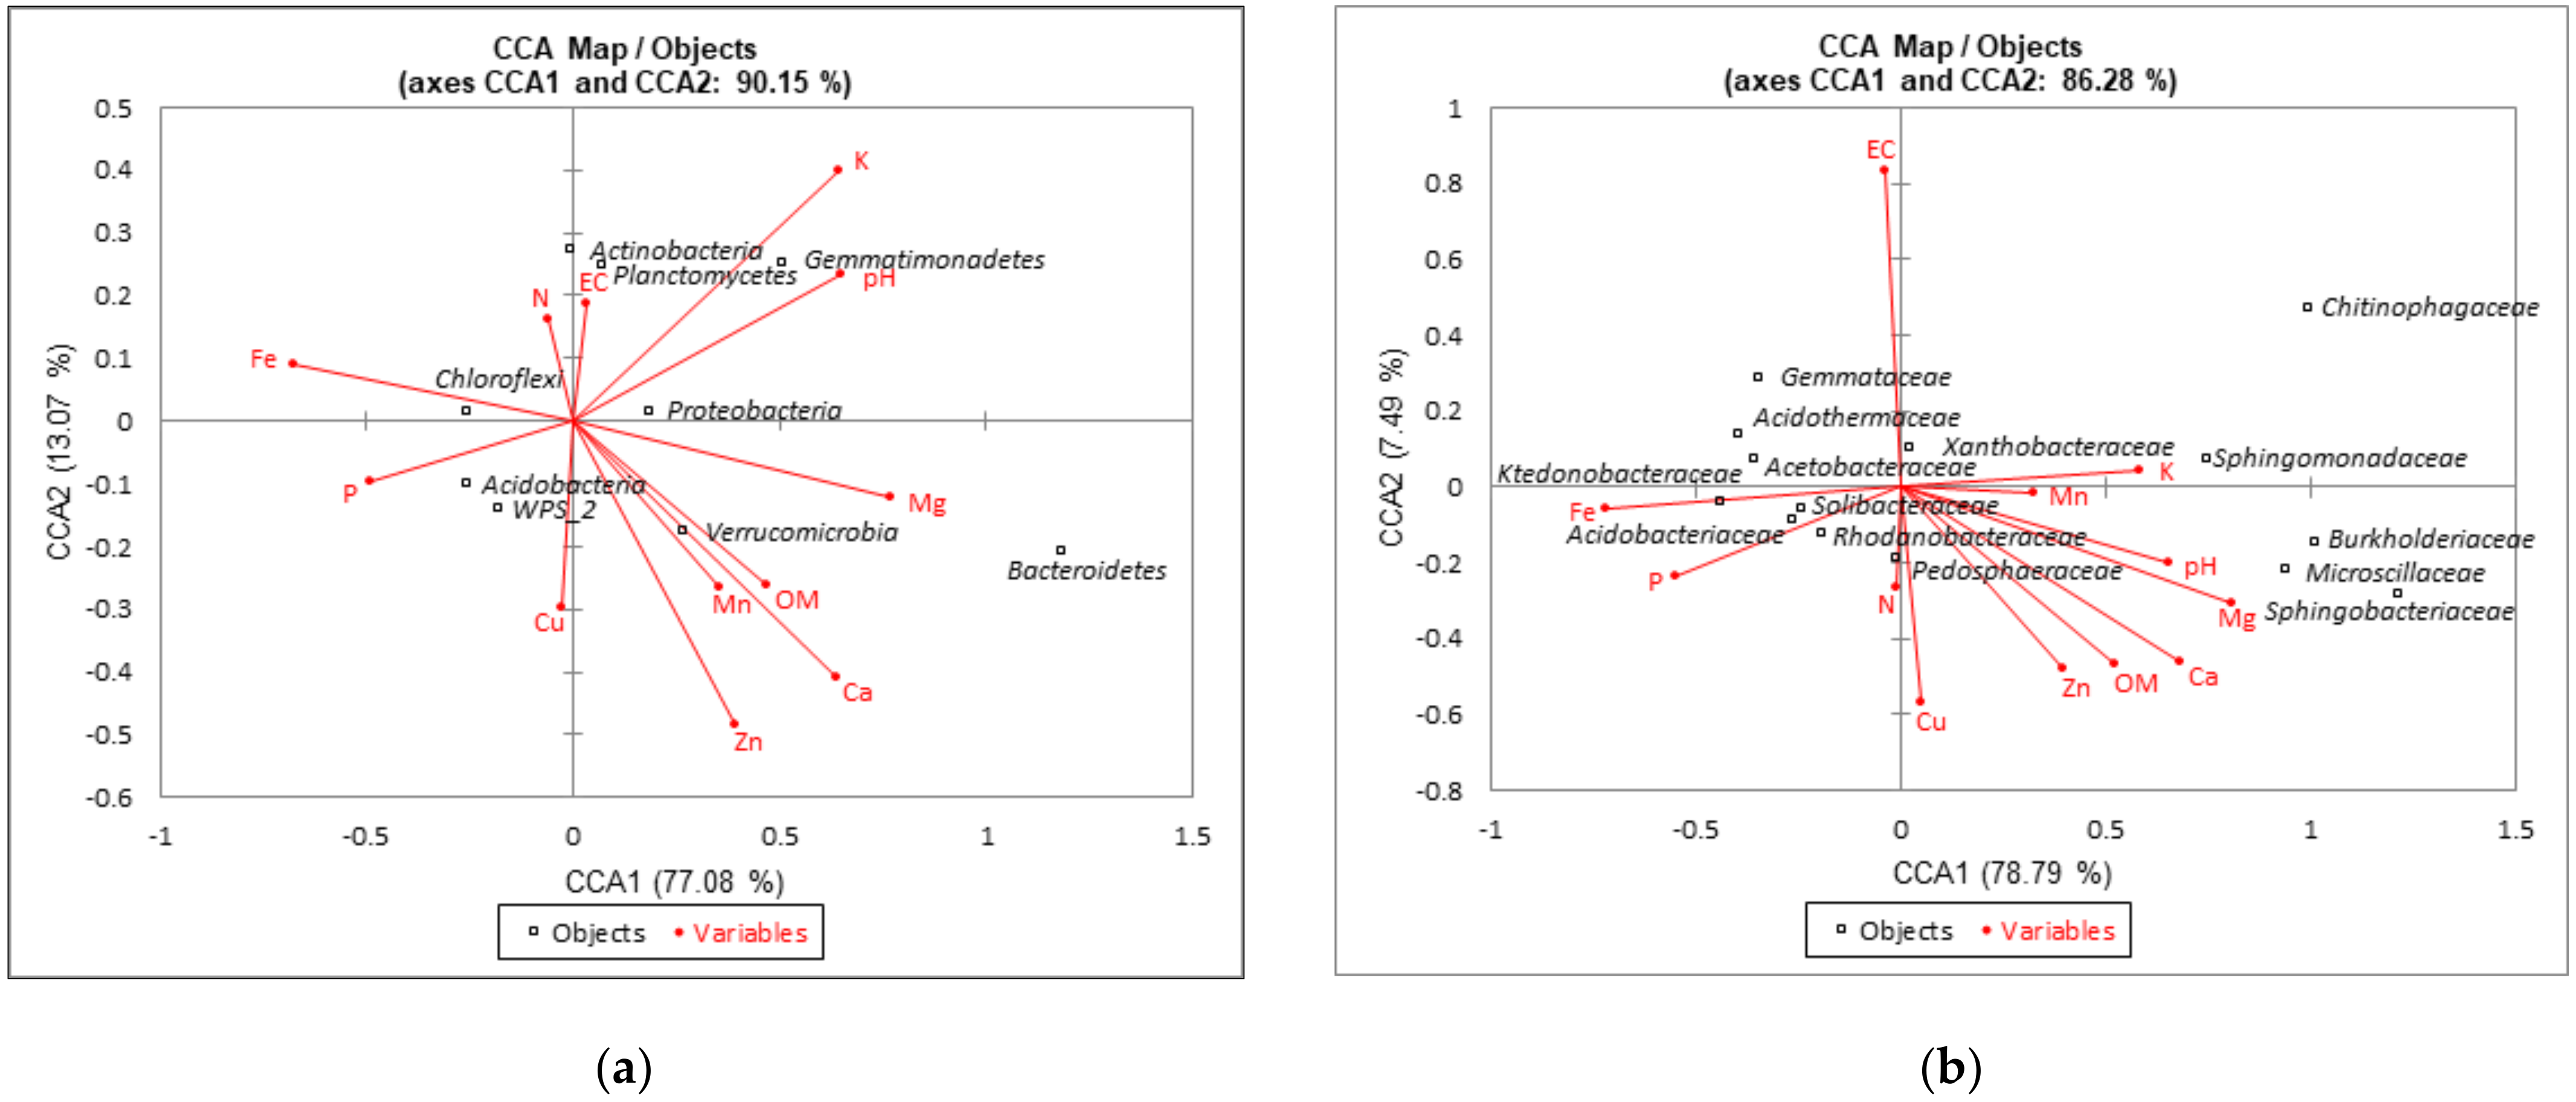
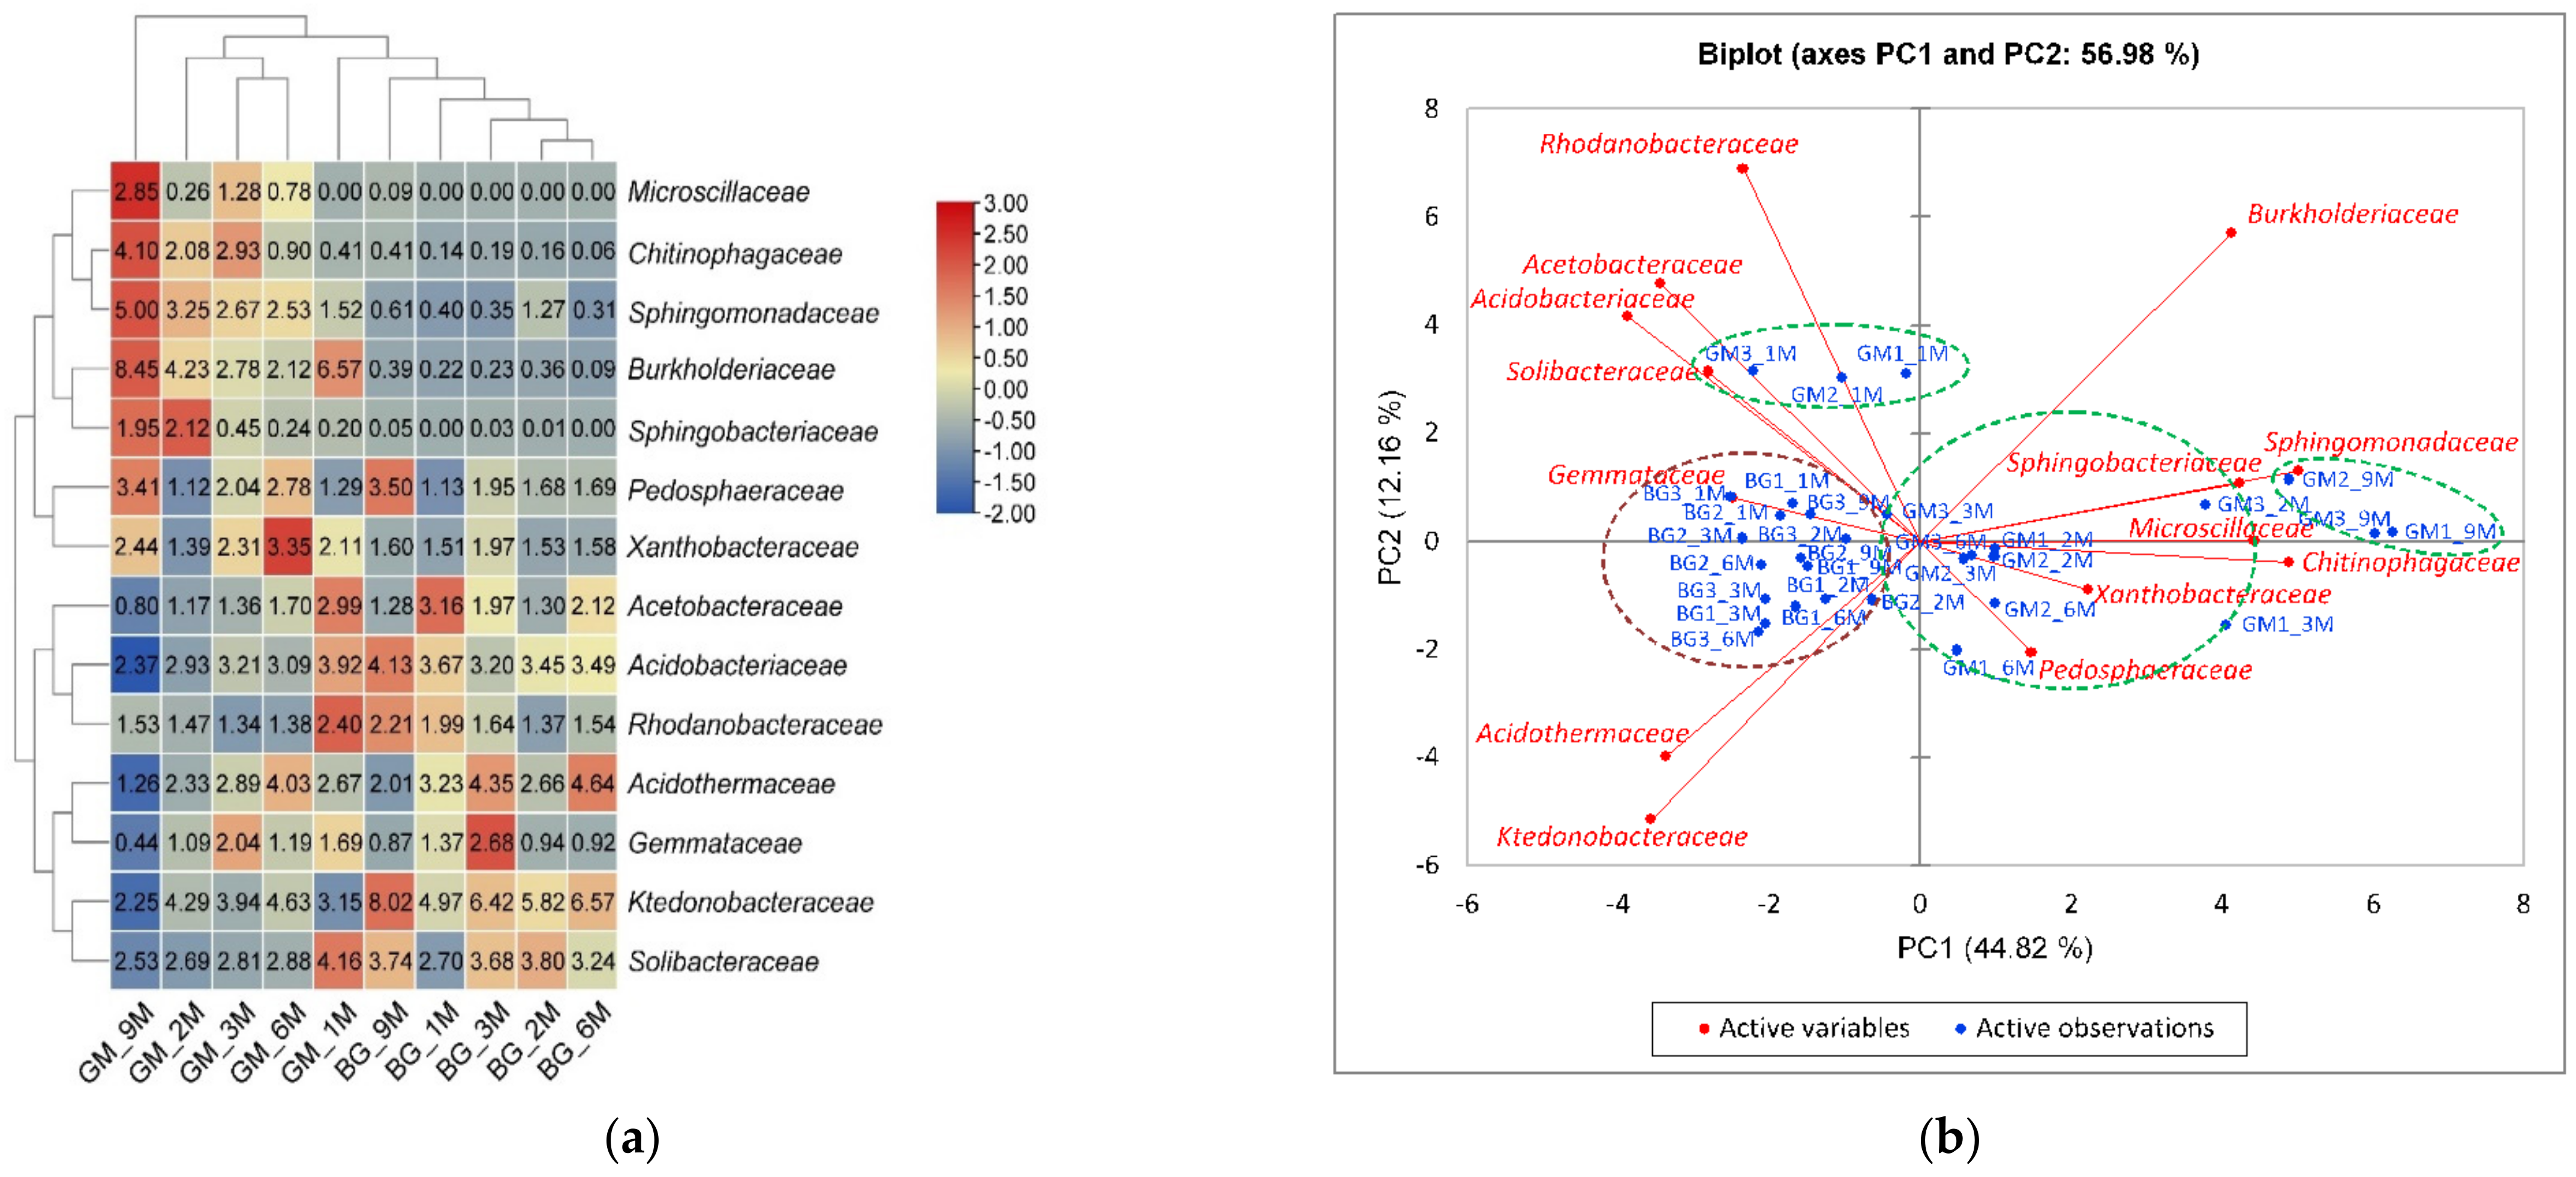
3.4. Relationships between Dominant Bacterial Taxa and Soil Properties or Metabolic Potential of Bacterial Communities

Among all the measured soil properties, pH has a profound influence on the relative abundance of dominant bacterial taxa, as revealed by CCA and Pearson correlation analysis (Figure 7 and Supplementary Materials Table S3). Acidobacteria, Chloroflexi, Gemmataceae, Ktedonobacteraceae, and Solibacteraceae showed a significantly (p < 0.05) negative correlation with soil pH, while Bacteroidetes, Burkholderiaceae, Gemmatimonadetes, Microscillaceae, Proteobacteria, Sphingobacteriaceae, Sphingomonadaceae, Verrucomicrobia, and Xanthobacteraceae positively correlated. Available K, Ca, and Mg showed the similar trends as pH did on these bacterial taxa. Organic matter contents significantly positively correlated with Burkholderiaceae, Gemmatimonadetes, Pedosphaeraceae, Sphingobacteriaceae, Sphingomonadaceae, and Verrucomicrobia. Both Planctomycetes and its affiliated family Gemmataceae showed a significantly negative correlation with total N, as well as available Cu and Zn, and the latter also negatively correlated with organic matter content, as well as available Ca and Mg. Available P and Fe significantly positively correlated with Acetobacteraceae, Chloroflexi, and Ktedonobacteraceae, while they showed a negative correlation with Burkholderiaceae, Chitinophagaceae, Proteobacteria, and Sphingomonadaceae.
The utilization of all six carbon source categories showed a significantly (p < 0.05) positive correlation with the Bacteroidetes, Gemmatimonadetes, Planctomycetes, Proteobacteria, and Verrucomicrobia phyla, as well as the Burkholderiaceae, Chitinophagaceae, Microscillaceae, Sphingobacteriaceae, Sphingomonadaceae, and Xanthobacteraceae families (Supplementary Materials Table S4). The relative abundances of Acidobacteria, Chloroflexi, Ktedonobacteraceae, and the candidate phylum WPS-2 significantly negatively correlated with the metabolic potential of bacterial communities toward most of the carbon source categories.

4. Discussion

In this study, the potential of soybean intercropping to modify soil chemical properties and bacterial community, which further restored the deteriorated soil, was demonstrated. Numerous studies have clearly shown that both the plant genotype and the soil type drive the rhizosphere microbial community [36,37,38]. The exudates, such as sugars and organic acids derived from soybean root [39,40], may serve as alternative carbon sources, which changed bacterial community within the inter-row of the tea plantation. The soil pH is considered as the best predictor of community composition [41,42,43] may also play a crucial role affecting bacterial community in this study. In addition to soil pH, organic carbon and available K were found as the key characteristics significantly correlated with the variation of the soil fungal community in a tea plantation [17]. We also demonstrated that available K, Ca, and Mg significantly positively correlated with the most effective biomarkers identified in GM treatment. In this tea plantation, the ecological benefit brought by GM treatment was addressed, since the increase in biodiversity facilitated the stability of microbial communities against biotic and abiotic environmental perturbations [44]. The soybean intercropping was assumed to enrich nitrogen-fixing taxa in the tea plantation. As expected, the Rhizobiaceae family was identified as one of the most effective biomarkers in GM treatment, which accounted for higher relative abundance (0.08–1.54%) than in the BG control (0–0.02%). Within Rhizobiaceae, the relative abundances of two rhizobial taxa identified at the genus level (Allorhizobium_Neorhizobium_Pararhizobium_Rhizobium and Mesorhizobium) also increased in response to GM treatment (Supplementary Materials Figure S2). Besides, soybean intercropping was demonstrated to increase the relative abundance of Bradyrhizobium, a genus which is commonly found in soybean nodules [45]. However, no symbiotic nitrogen fixation occurred in this strongly acidic soil during the study period. This may be overcome after conducting agricultural manipulations, such as liming and inoculating effective rhizobia, which have been used to increase nodulation and nitrogen fixation of soybeans grown in strongly acidic soils [46].
Smit et al. [47] hypothesized that the ratio between Proteobacteria and Acidobacteria (P/A) may provide insight into the general nutrient status of soils. Low P/A ratios would be indicative of oligotrophic soils, while high ratios were displayed under copiotrophic conditions. In this study, the average P/A ratio in the BG control and GM treatment was 0.74 and 1.36, respectively, which suggested an increase in the nutritional level of soils after soybean intercropping. Based on the experimental and meta-analytical results, Fierer et al. [48] further proposed that bacteria belonging to the phylum Acidobacteria were categorized as oligotrophs, while Bacteroidetes and β-Proteobacteria exhibited copiotrophic attributes. The life strategy concepts regarding copiotrophy-oligotrophy continuum [49] and the competitor–stress tolerator–ruderal (C-S-R) framework [50] were considered in this study to explain the prevalence and distribution of bacterial communities affected by GM treatment. Samples collected from the BG control showed a significantly (P < 0.05) positive correlation with Acidobacteria, a phylum associated with oligotrophy or stress tolerator, while they were negatively correlated with Bacteroidetes and Proteobacteria, which were associated with copiotrophy or competitor [51]. Based on the concept of three potential life history strategies further interpreted by Ramin and Allison [52], we demonstrated that bacterial taxa dominating in the tea plantation shifted from maintenance strategists (Acidobacteria) to growth strategists (Proteobacteria) in response to soybean intercropping. In addition, bacterial phyla Actinobacteria and Bacteroidetes, which were referred to as maintenance and resource acquisition strategists, also increased after GM treatment.
During all the months that were considered, higher relative abundances of Acidobacteria, Chloroflexi, and the candidate phylum WPS-2 were observed in the BG control than in GM treatment. Acidobacteria and Chloroflexi were abundant among very slow-growing and mini-colony-forming soil bacteria, and both of them have been found to increase continuously with increasing age of tea plantations [14,53]. The relative abundance of Acidobacteria was shown to increase toward lower soil pH [54,55,56]. Members belonging to this phylum can metabolize nutrient-poor and recalcitrant carbon substrates, and the abundance was generally higher in soils with very low resource availability [48,57]. Chloroflexi was demonstrated to account for 33–54% of the bacterial sequences in low-pH soils in a study of chemoautotrophic carbon dioxide fixation in drained paddy soils [58]. Members of this phylum are likely oligotrophic taxa adapted to survive under the resource-limited conditions found in deeper horizons, and they have been shown to decrease upon soil fertilization [57,59]. The candidate phylum WPS-2 (Eremiobacteraeota) was observed as a dominant bacterial group in oligotrophic Antarctic soils, which might proliferate through chemosynthetic carbon fixation [60]. A metagenomic study also revealed that members belonging to this phylum are likely anoxygenic phototrophs capable of carbon fixation [61]. The strongly acidic and low nutritional status of this tea plantation soils led to the higher relative abundances of these oligotrophic taxa as well as the lower metabolic potential of bacterial communities toward six carbon source categories.
In comparison with the BG control, notable increases in relative abundances of phyla Bacteroidetes, Gemmatimonadetes, and Proteobacteria were observed in GM treatment. Both Bacteroidetes and Proteobacteria were considered as copiotrophic taxa that exhibited relatively rapid growth rates in elevated C, N, or S conditions [48,57,62]. The life strategy of Gemmatimonadetes has not been clarified in soils, with only a few studies dealing with their response to re-wetting and thawing events [63,64].
In this study, GM treatment was demonstrated to enrich Bacteroidetes members, such as Chitinophagaceae, Microscillaceae, and Sphingobacteriaceae families. Chitinophagaceae have been found to positively correlate with β-glucosidase activity and organic matter degradation indicators [65,66]. Members belonging to this family were inhabitants of rhizosphere or roots. They possess the abilities to solubilize tricalcium phosphate; produce indole-3-acetic acid, 1-aminocyclopropane, and 1-carboxylate deaminase; and stimulate plant growth [67,68]. The Microscillaceae family is less explored, and currently only two chemoorganotrophic genera showing gliding motility and gelatin-degrading ability were reported [69]. Members belonging to Sphingobacteriaceae possessed very divergent genome fractions responsible for secondary metabolism, dormancy and sporulation, and metabolism of aromatic compounds under different environmental pressures [70]. In this study, Mucilaginibacter was found as the most dominant genus affiliated with Sphingobacteriaceae, whose relative abundance accounted for 31–100% of Sphingobacteriaceae in GM treatment samples collected from five sampling periods. This genus was demonstrated to degrade a variety of plant residues, such as cellulose, hemicellulose, pectin, and xylan through its highly diverse carbohydrate-active enzymes [71,72].
Within Proteobacteria, members belonging to families Burkholderiaceae and Sphingomonadaceae were identified as the most effective biomarkers in GM treatment. The genus Burkholderia affiliated with Burkholderiaceae was proposed as the most diverse and environmentally adaptable plant-associated bacteria [73]. They display genomic and metabolic plasticity, showing a broad range of host and possess a variety of plant growth promoting traits [74,75]. Our previous study also indicated that Burkholderiaceae dominated not only the root surface but root interior, which might form intimate associations with its host tea plants [15]. The family Sphingomonadaceae has been intensively studied, owing to its extraordinary catabolic flexibility to degrade natural and xenobiotic compounds [76]. The abilities of this family to induce innate plant growth promoting traits have been investigated, which include the formation of phytohormones, siderophores, and chelators [77]. In this study, the genus Sphingomonas affiliated with Sphingomonadaceae accounted for higher average relative abundance in GM treatment (1.83%) than in the BG control (0.5%). Members belonging to this genus have been noted to improve plant growth during stress conditions, such as drought, salinity, and heavy metals in agricultural soil [78].
Ho et al. [51] suggested that tracking microorganisms at finer phylogenetic and taxonomic resolution (e.g. family level or lower) may be more effective to capture changes in community response. At the family level, we demonstrated that GM treatment decreased the relative abundances of oligotrophic taxa, such as Acidobacteriaceae and Solibacteraceae (belonging to the phylum Acidobacteria), and Ktedonobacteraceae (belonging to the phylum Chloroflexi). In contrast, the relative abundances of families, such as Burkholderiaceae, Chitinophagaceae, Microscillaceae, Sphingobacteriaceae, and Sphingomonadaceae, increased in response to soybean intercropping. The potential copiotrophic attributes were displayed in these families, since they showed significantly positive correlation with the metabolic potential toward all six carbon source categories. Many bacterial families, such as Acidothermaceae, Ktedonobacteraceae, Microscillaceae, Pedosphaeraceae, and Solibacteraceae, have not been extensively studied owing to their rare cultured representatives. They might be obtained using diluted media or through a long period of incubation instead of conventional cultivation methods [48,79]. Efforts should be made to obtain more representatives to clarify their eco-physiological roles, especially in nutrient cycling and plant growth promotion in a near future.

5. Conclusions

In this study, the temporal distribution of bacterial communities in response to soybean intercropping in strongly acidic soils was revealed. GM treatment was observed to boost both functional and population diversity, which helps to enhance the stability of bacterial communities within the tea-cultivated ecosystem. The inter-row habitats stimulated by soybean intercropping further serve as hot spots for copiotrophs-mediated nutrient cycling and microbe–plant interactions. Besides, the dominant bacterial taxa provide opportunities to study their eco-physiological roles in the tea plantation.

Supplementary Materials

The following are available online at https://www.mdpi.com/article/10.3390/su132011478/s1, Figure S1: Monthly average temperature and monthly precipitation of the experimental site during June 2020 and March 2021. (CWB Observation Data Inquire System, https://e-service.cwb.gov.tw/HistoryDataQuery/ (accessed on 20 September 2021)), Figure S2: Hierarchically clustered heat-map of relative abundances of rhizobial taxa in the bare ground (BG) control and green manure (GM) treatment samples collected after one month (_1M), two months (_2M), three months (_3M), six months (_6M), and nine months (_9M) of treatments. Heat-map was generated based on Euclidean dissimilarity metrics, normalized from −1 to 2.5 and color scale represented from blue to red through yellow, Table S1: Principal component loadings (correlation between original loading variable and principal component) as a measure of influence of a loading variable on treatment differences, Table S2: Principal component loadings (correlation between original loading variable and principal component) as a measure of influence of a loading variable on treatment differences, Table S3: Pearson correlation between dominant bacterial taxa and soil properties, Table S4: Pearson correlation between dominant bacterial taxa and metabolic potential of bacterial community toward six carbon source categories.

Author Contributions

Conceptualization, F.-T.S.; methodology, F.-T.S. and S.-H.L.; software, F.-T.S.; validation, F.-T.S.; formal analysis, S.-H.L.; investigation, F.-T.S. and S.-H.L.; resources, F.-T.S.; data curation, F.-T.S.; writing—original draft preparation, F.-T.S.; writing—review and editing, F.-T.S.; supervision, F.-T.S.; project administration, F.-T.S.; funding acquisition, F.-T.S. All authors have read and agreed to the published version of the manuscript.

Funding

This research work was funded by the Ministry of Science and Technology and in part by the Ministry of Education, Taiwan, R.O.C. under the Higher Education Sprout Project.

Institutional Review Board Statement

Not applicable.

Informed Consent Statement

Not applicable.

Data Availability Statement

The raw sequence reads obtained in this study have been submitted to the NCBI SRA database under BioProject PRJNA716948.

Acknowledgments

We gratefully acknowledge J.B. Xu for the facilitation of our fieldwork, Y.W. Lin and M.H. Hung for the technical assistance in soil property analyses, and the anonymous reviewers for their valuable comments on the manuscript.

Conflicts of Interest

The authors declare no conflict of interest.

References

  1. Berendsen, R.L.; Pieterse, C.M.J.; Bakker, P.A.H.M. The rhizosphere microbiome and plant health. Trends Plant Sci. 2012, 17, 478–486. [Google Scholar] [CrossRef] [PubMed]
  2. Pii, Y.; Mimmo, T.; Tomasi, N.; Terzano, R.; Cesco, S.; Crecchio, C. Microbial interactions in the rhizosphere: Beneficial influences of plant growth-promoting rhizobacteria on nutrient acquisition process—A review. Biol. Fertil. Soils 2015, 51, 403–415. [Google Scholar] [CrossRef]
  3. Heo, Y.-M.; Lee, H.; Kwon, S.-L.; Yoo, Y.; Kim, D.; Han, S.-I.; Lee, A.-H.; Kim, C.; Kim, G.-H.; Kim, J.-J. Influence of tree vegetation on soil microbial communities in temperate forests and their potential as a proactive indicator of vegetation shift due to climate change. Sustainability 2020, 12, 10591. [Google Scholar] [CrossRef]
  4. Mendes, R.; Garbeva, P.; Raaijmakers, J.M. The rhizosphere microbiome: Significance of plant beneficial, plant pathogenic, and human pathogenic microorganisms. FEMS Microbiol. Rev. 2013, 37, 634–663. [Google Scholar] [CrossRef]
  5. Qiao, C.; Penton, C.R.; Xiong, W.; Liu, C.; Wang, R.; Liu, Z.; Xu, X.; Li, R.; Shen, Q. Reshaping the rhizosphere microbiome by bio-organic amendment to enhance crop yield in a maize-cabbage rotation system. Appl. Soil Ecol. 2019, 142, 136–146. [Google Scholar] [CrossRef]
  6. Liu, Z.; Guo, Q.; Feng, Z.; Liu, Z.; Li, H.; Sun, Y.; Liu, C.; Lai, H. Long-term organic fertilization improves the productivity of kiwifruit (Actinidia chinensis Planch.) through increasing rhizosphere microbial diversity and network complexity. Appl. Soil Ecol. 2020, 147, 103426. [Google Scholar] [CrossRef]
  7. Tejada, M.; Gonzalez, J.L.; García-Martínez, A.M.; Parrado, J. Application of a green manure and green manure composted with beet vinasse on soil restoration: Effects on soil properties. Bioresour. Technol. 2008, 99, 4949–4957. [Google Scholar] [CrossRef]
  8. Jiang, Y.-H.; Arafat, Y.; Letuma, P.; Ali, L.; Tayyab, M.; Waqas, M.; Li, Y.-C.; Lin, W.-W.; Lin, S.; Lin, W.-X. Restoration of long-term monoculture degraded tea orchard by green and goat manures application system. Sustainability 2019, 11, 1011. [Google Scholar] [CrossRef] [Green Version]
  9. Longa, C.M.O.; Nicola, L.; Antonielli, L.; Mescalchin, E.; Zanzotti, R.; Turco, E.; Pertot, I. Soil microbiota respond to green manure in organic vineyards. J. Appl. Microbiol. 2017, 123, 1547–1560. [Google Scholar] [CrossRef]
  10. Khan, M.I.; Gwon, H.S.; Alam, M.A.; Song, H.J.; Das, S.; Kim, P.J. Short term effects of different green manure amendments on the composition of main microbial groups and microbial activity of a submerged rice cropping system. Appl. Soil Ecol. 2020, 147, 103400. [Google Scholar] [CrossRef]
  11. Li, Y.C.; Li, Z.; Li, Z.W.; Jiang, Y.H.; Weng, B.Q.; Lin, W.X. Variations of rhizosphere bacterial communities in tea (Camellia sinensis L.) continuous cropping soil by high-throughput pyrosequencing approach. J. Appl. Microbiol. 2016, 121, 787–799. [Google Scholar] [CrossRef]
  12. Arafat, Y.; Wei, X.-Y.; Jiang, Y.-H.; Chen, T.; Saqib, H.S.A.; Lin, S.; Lin, W.-X. Spatial distribution patterns of root-associated bacterial communities mediated by root exudates in different aged ratooning tea monoculture systems. Int. J. Mol. Sci. 2017, 18, 1727. [Google Scholar] [CrossRef] [Green Version]
  13. Lynn, T.M.; Liu, Q.; Hu, Y.; Yuan, H.; Wu, X.; Khai, A.A.; Wu, J.; Ge, T. Influence of land use on bacterial and archaeal diversity and community structures in three natural ecosystems and one agricultural soil. Arch. Microbiol. 2017, 199, 711–721. [Google Scholar] [CrossRef] [PubMed]
  14. Wang, S.; Li, T.; Zheng, Z.; Chen, H.Y.H. Soil aggregate-associated bacterial metabolic activity and community structure in different aged tea plantations. Sci. Total Environ. 2019, 654, 1023–1032. [Google Scholar] [CrossRef]
  15. Chen, W.C.; Ko, C.H.; Su, Y.S.; Lai, W.A.; Shen, F.T. Metabolic potential and community structure of bacteria in an organic tea plantation. Appl. Soil Ecol. 2021, 157, 103762. [Google Scholar] [CrossRef]
  16. Tan, L.; Gu, S.; Li, S.; Ren, Z.; Deng, Y.; Liu, Z.; Gong, Z.; Xiao, W.; Hu, Q. Responses of microbial communities and interaction networks to different management practices in tea plantation soils. Sustainability 2019, 11, 4428. [Google Scholar] [CrossRef] [Green Version]
  17. Ji, L.; Ni, K.; Wu, Z.; Zhang, J.; Yi, X.; Yang, X.; Ling, N.; You, Z.; Guo, S.; Ruan, J. Effect of organic substitution rates on soil quality and fungal community composition in a tea plantation with long-term fertilization. Biol. Fertil. Soils 2020, 56, 633–646. [Google Scholar] [CrossRef]
  18. Dennis, P.G.; Miller, A.J.; Hirsch, P.R. Are root exudates more important than other sources of rhizodeposits in structuring rhizosphere bacterial communities? FEMS Microbiol. Ecol. 2010, 72, 313–327. [Google Scholar] [CrossRef] [PubMed] [Green Version]
  19. Council of Agriculture. Available online: https://agrstat.coa.gov.tw/sdweb/public/inquiry/InquireAdvance.aspx (accessed on 20 September 2021).
  20. Soil Survey Staff. Keys to Soil Taxonomy, 12th ed.; USDA-Natural Resources Conservation Service: Washington, DC, USA, 2014.
  21. Wu, C.H.; Lien, T.J. The development of a new soybean variety, Tainan No. 7, for covering and green manure. Tainan Dist. Agric. Res. Ext. Stn. Bull. 2003, 42, 22. (In Chinese) [Google Scholar]
  22. Shen, F.T.; Lin, S.H. Priming effects of cover cropping on bacterial community in a tea plantation. Sustainability 2021, 13, 4345. [Google Scholar] [CrossRef]
  23. Nelson, D.W.; Sommers, L.E. Total carbon, organic carbon and organic matter. In Methods of Soil Analysis, Part 2: Chemical and Microbiological Properties, 2nd ed.; Page, A.L., Miller, R.H., Keeney, D.R., Eds.; ASA-SSSA: Madison, WI, USA, 1982; pp. 539–580. [Google Scholar]
  24. Kjeldahl, J. A new method for the determination of nitrogen in organic matter. Z. Anal. Chem. 1883, 22, 366–382. [Google Scholar] [CrossRef] [Green Version]
  25. Bremner, J.M. Nitrogen total. In Methods of Soil Analysis, Part 3: Chemical Methods; Sparks, D.L., Page, A.L., Helmke, P.A., Loeppert, R.H., Soltanpour, P.N., Tabatabai, M.A., Johnston, C.T., Sumner, M.E., Eds.; Soil Science Society of America Inc.: Madison, WI, USA, 1996; pp. 1085–1121. [Google Scholar]
  26. Mehlich, A. Mehlich 3 soil test extractant: A modification of Mehlich 2. Comm. Soil Sci. Plant. Anal. 1984, 15, 1409–1416. [Google Scholar] [CrossRef]
  27. Classen, A.T.; Boyle, S.I.; Haskins, K.E.; Overby, S.T.; Hart, S.C. Community-level physiological profiles of bacteria and fungi: Plate type and incubation temperature influences on contrasting soils. FEMS Microbiol. Ecol. 2003, 44, 319–328. [Google Scholar] [CrossRef] [Green Version]
  28. Chou, Y.M.; Shen, F.T.; Chiang, S.C.; Chang, C.M. Functional diversity and dominant populations of bacteria in banana plantation soils as influenced by long-term organic and conventional farming. Appl. Soil Ecol. 2017, 110, 21–33. [Google Scholar] [CrossRef]
  29. Quast, C.; Pruesse, E.; Yilmaz, P.; Gerken, J.; Schweer, T.; Yarza, P.; Peplies, J.; Glöckner, F.O. The SILVA ribosomal RNA gene database project: Improved data processing and web-based tools. Nucleic Acids Res. 2013, 41, D590–D596. [Google Scholar] [CrossRef]
  30. Caporaso, J.G.; Kuczynski, J.; Stombaugh, J.; Bittinger, K.; Bushman, F.D.; Costello, E.K.; Fierer, N.; Peña, A.G.; Goodrich, J.K.; Gordon, J.I. QIIME allows analysis of high-throughput community sequencing data. Nat. Methods 2010, 7, 335–336. [Google Scholar] [CrossRef] [Green Version]
  31. Chen, C.; Chen, H.; Zhang, Y.; Thomas, H.R.; Frank, M.H.; He, Y.; Xia, R. TBtools: An integrative toolkit developed for interactive analyses of big biological data. Mol. Plant. 2020, 13, 1194–1202. [Google Scholar] [CrossRef]
  32. Zak, J.C.; Willig, M.R.; Moorhead, D.L.; Wildmand, H.G. Functional diversity of microbial communities: A quantitative approach. Soil Biol. Biochem. 1994, 26, 1101–1108. [Google Scholar] [CrossRef]
  33. Manly, B.F.J. Multivariate Statistical Methods: A Primer, 2nd ed.; Chapman and Hall: London, UK, 1994. [Google Scholar]
  34. Nair, A.; Ngouajio, M. Soil microbial biomass, functional microbial diversity, and nematode community structure as affected by cover crops and compost in an organic vegetable production system. Appl. Soil Ecol. 2012, 58, 45–55. [Google Scholar] [CrossRef]
  35. Lozupone, C.; Lladser, M.E.; Knights, D.; Stombaugh, J.; Knight, R. UniFrac: An effective distance metric for microbial community comparison. ISME J. 2011, 5, 169–172. [Google Scholar] [CrossRef] [Green Version]
  36. Garbeva, P.; van Elsas, J.D.; van Veen, J.A. Rhizosphere microbial community and its response to plant species and soil history. Plant. Soil 2008, 302, 19–32. [Google Scholar] [CrossRef] [Green Version]
  37. Berg, G.; Smalla, K. Plant species and soil type cooperatively shape the structure and function of microbial communities in the rhizosphere. FEMS Microbiol. Ecol. 2009, 68, 1–13. [Google Scholar] [CrossRef] [Green Version]
  38. Xu, Y.; Ge, Y.; Song, J.; Rensing, C. Assembly of root-associated microbial community of typical rice cultivars in different soil types. Biol. Fertil. Soils 2020, 56, 249–260. [Google Scholar] [CrossRef]
  39. Timotiwu, P.B.; Sakurai, N. Identification of mono-, oligo-, and polysaccharides secreted from soybean roots. J. Plant. Res. 2002, 115, 77–85. [Google Scholar] [CrossRef]
  40. Tawaraya, K.; Horie, R.; Shinano, T.; Wagatsuma, T.; Saito, K.; Oikawa, A. Metabolite profiling of soybean root exudates under phosphorus deficiency. Soil Sci. Plant. Nutr. 2014, 60, 679–694. [Google Scholar] [CrossRef]
  41. Lauber, C.L.; Strickland, M.S.; Bradford, M.A.; Fierer, N. The influence of soil properties on the structure of bacterial and fungal communities across land-use types. Soil Biol. Biochem. 2008, 40, 2407–2415. [Google Scholar] [CrossRef]
  42. Lauber, C.L.; Hamady, M.; Knight, R.; Fierer, N. Pyrosequencing-based assessment of soil pH as a predictor of soil bacterial community structure at the continental scale. Appl. Environ. Microbiol. 2009, 75, 5111–5120. [Google Scholar] [CrossRef] [PubMed] [Green Version]
  43. Rousk, J.; Bååth, E.; Brookes, P.C.; Lauber, C.L.; Lozupone, C.; Caporaso, J.G.; Knight, R.; Fierer, N. Soil bacterial and fungal communities across a pH gradient in an arable soil. ISME J. 2010, 4, 1340–1351. [Google Scholar] [CrossRef] [PubMed]
  44. Eisenhauer, N.; Scheu, S.; Jousset, A. Bacterial diversity stabilizes community productivity. PLoS ONE 2012, 7, e34517. [Google Scholar] [CrossRef] [Green Version]
  45. Sharaf, H.; Rodrigues, R.R.; Moon, J.; Zhang, B.; Mills, K.; Williams, M.A. Unprecedented bacterial community richness in soybean nodules vary with cultivar and water status. Microbiome 2019, 7, 63. [Google Scholar] [CrossRef]
  46. Bakari, R.; Mungai, N.; Thuita, M.; Masso, C. Impact of soil acidity and liming on soybean (Glycine max) nodulation and nitrogen fixation in Kenyan soils. Acta Agric. Scand. Sect. B Soil Plant. Sci. 2020, 70, 667–678. [Google Scholar]
  47. Smit, E.; Leeflang, P.; Gommans, S.; van den Broek, J.; van Mil, S.; Wernars, K. Diversity and seasonal fluctuations of the dominant members of the bacterial soil community in a wheat field as determined by cultivation and molecular methods. Appl. Environ. Microbiol. 2001, 67, 2284–2291. [Google Scholar] [CrossRef] [PubMed] [Green Version]
  48. Fierer, N.; Bradford, M.A.; Jackson, R.B. Toward an ecological classification of soil bacteria. Ecology 2007, 88, 1354–1364. [Google Scholar] [CrossRef] [PubMed]
  49. Andrews, J.H.; Harris, R.F. r-selection and K-selection and microbial ecology. Adv. Microb. Ecol. 1986, 9, 99–147. [Google Scholar]
  50. Grime, J.P.; Pierce, S. The Evolutionary Strategies That Shape Ecosystems; John Wiley & Sons: Oxford, UK, 2012. [Google Scholar]
  51. Ho, A.; Di Lonardo, D.P.; Bodelier, P.L.E. Revisiting life strategy concepts in environmental microbial ecology. FEMS Microbiol. Ecol. 2017, 93, fix006. [Google Scholar] [CrossRef] [PubMed] [Green Version]
  52. Ramin, K.I.; Allison, S.D. Bacterial tradeoffs in growth rate and extracellular enzymes. Front. Microbiol. 2019, 10, 2956. [Google Scholar] [CrossRef]
  53. Davis, K.E.R.; Sangwan, P.; Janssen, P.H. Acidobacteria, Rubrobacteridae and Chloroflexi are abundant among very slow-growing and mini-colony-forming soil bacteria. Environ. Microbiol. 2011, 13, 798–805. [Google Scholar] [CrossRef]
  54. Kim, H.M.; Jung, J.Y.; Yergeau, E.; Hwang, C.Y.; Hinzman, L.; Nam, S.; Hong, S.G.; Kim, O.S.; Chun, J.; Lee, Y.K. Bacterial community structure and soil properties of a subarctic tundra soil in Council, Alaska. FEMS Microbiol. Ecol. 2014, 89, 465–475. [Google Scholar] [CrossRef]
  55. Sun, L.; Xun, W.; Huang, T.; Zhang, G.; Gao, J.; Ran, W.; Li, D.; Shen, Q.; Zhang, R. Alteration of the soil bacterial community during parent material maturation driven by different fertilization treatments. Soil Biol. Biochem. 2016, 96, 207–215. [Google Scholar] [CrossRef]
  56. Ivanova, A.A.; Zhelezova, A.D.; Chernov, T.I.; Dedysh, S.N. Linking ecology and systematics of Acidobacteria: Distinct habitat preferences of the Acidobacteriia and Blastocatellia in tundra soils. PLoS ONE 2020, 15, e0230157. [Google Scholar] [CrossRef] [Green Version]
  57. Fierer, N.; Lauber, C.L.; Ramirez, K.S.; Zaneveld, J.; Bradford, M.A.; Knight, R. Comparative metagenomic, phylogenetic and physiological analyses of soil microbial communities across nitrogen gradients. ISME J. 2012, 6, 1007–1017. [Google Scholar] [CrossRef] [Green Version]
  58. Long, X.E.; Yao, H.; Wang, J.; Huang, Y.; Singh, B.K.; Zhu, Y.G. Community structure and soil pH determine chemoautotrophic carbon dioxide fixation in drained paddy soils. Environ. Sci. Technol. 2015, 49, 7152–7160. [Google Scholar] [CrossRef]
  59. Brewer, T.E.; Aronson, E.L.; Arogyaswamy, K.; Billings, S.A.; Botthoff, J.K.; Campbell, A.N.; Dove, N.C.; Fairbanks, D.; Gallery, R.E.; Hart, S.C.; et al. Ecological and genomic attributes of novel bacterial taxa that thrive in subsurface soil horizons. mBio 2019, 10, e01318-19. [Google Scholar] [CrossRef] [Green Version]
  60. Ji, M.; Greening, C.; Vanwonterghem, I.; Carere, C.R.; Bay, S.K.; Steen, J.A.; Montgomery, K.; Lines, T.; Beardall, J.; van Dorst, J.; et al. Atmospheric trace gases support primary production in Antarctic desert surface soil. Nature 2017, 552, 400–403. [Google Scholar] [CrossRef]
  61. Holland-Moritz, H.; Stuart, J.; Lewis, L.R.; Miller, S.; Mack, M.C.; McDaniel, S.F.; Fierer, N. Novel bacterial lineages associated with boreal moss species. Environ. Microbiol. 2018, 20, 2625–2638. [Google Scholar] [CrossRef]
  62. Wakelin, S.A.; Condron, L.M.; Gerard, E.; Dignam, B.E.A.; Black, A.; O’Callaghan, M. Long-term P fertilization of pasture soil did not increase soil organic matter stocks but increased microbial biomass and activity. Biol. Fertil. Soils 2017, 53, 511–521. [Google Scholar] [CrossRef]
  63. Aanderud, Z.T.; Lennon, J.T. Validation of heavy-water stable isotope probing for the characterization of rapidly responding soil bacteria. Appl. Environ. Microbiol. 2011, 77, 4589–4596. [Google Scholar] [CrossRef] [PubMed] [Green Version]
  64. Schostag, M.; Priemé, A.; Jacquiod, S.; Russel, J.; Ekelund, F.; Jacobsen, C.S. Bacterial and protozoan dynamics upon thawing and freezing of an active layer permafrost soil. ISME J. 2019, 13, 1345–1359. [Google Scholar] [CrossRef] [PubMed]
  65. Bailey, V.L.; Fansler, S.J.; Stegen, J.C.; McCue, L.A. Linking microbial community structure to β-glucosidic function in soil aggregates. ISME J. 2013, 7, 2044–2053. [Google Scholar] [CrossRef] [PubMed]
  66. Hou, Y.; Li, B.; Feng, G.; Zhang, C.; He, J.; Li, H.; Zhu, J. Responses of bacterial communities and organic matter degradation in surface sediment to Macrobrachium nipponense bioturbation. Sci. Total Environ. 2021, 759, 143534. [Google Scholar] [CrossRef]
  67. Chung, E.J.; Park, T.S.; Jeon, C.O.; Chung, Y.R. Chitinophaga oryziterrae sp. nov., isolated from the rhizosphere soil of rice (Oryza sativa L.). Int. J. Syst. Evol. Microbiol. 2012, 62, 3030–3035. [Google Scholar] [CrossRef] [Green Version]
  68. Madhaiyan, M.; Poonguzhali, S.; Senthilkumar, M.; Pragatheswari, D.; Lee, J.S.; Lee, K.C. Arachidicoccus rhizosphaerae gen. nov., sp. nov., a plant-growth-promoting bacterium in the family Chitinophagaceae isolated from rhizosphere soil. Int. J. Syst. Evol. Microbiol. 2015, 65, 578–586. [Google Scholar] [CrossRef]
  69. Hahnke, R.L.; Meier-Kolthoff, J.P.; García-López, M.; Mukherjee, S.; Huntemann, M.; Ivanova, N.N.; Woyke, T.; Kyrpides, N.C.; Klenk, H.P.; Göker, M. Genome-based taxonomic classification of Bacteroidetes. Front. Microbiol. 2016, 7, 2003. [Google Scholar] [CrossRef] [PubMed] [Green Version]
  70. Shen, L.; Liu, Y.; Xu, B.; Wang, N.; Zhao, H.; Liu, X.; Liu, F. Comparative genomic analysis reveals the environmental impacts on two Arcticibacter strains including sixteen Sphingobacteriaceae species. Sci. Rep. 2017, 7, 2055. [Google Scholar] [CrossRef] [PubMed] [Green Version]
  71. Pankratov, T.A.; Tindall, B.J.; Liesack, W.; Dedysh, S.N. Mucilaginibacter paludism gen. nov., sp. nov. and Mucilaginibacter gracilis sp. nov., pectin-, xylan- and laminarin-degrading members of the family Sphingobacteriaceae from acidic Sphagnum peat bog. Int. J. Syst. Evol. Microbiol. 2007, 57, 2349–2354. [Google Scholar] [CrossRef] [PubMed]
  72. López-Mondéjar, R.; Zühlke, D.; Becher, D.; Riedel, K.; Baldrian, P. Cellulose and hemicellulose decomposition by forest soil bacteria proceeds by the action of structurally variable enzymatic systems. Sci. Rep. 2016, 6, 25279. [Google Scholar] [CrossRef] [PubMed]
  73. Compant, S.; Nowak, J.; Coenye, T.; Clément, C.; Ait Barka, E. Diversity and occurrence of Burkholderia spp. in the natural environment. FEMS Microbiol. Rev. 2008, 32, 607–626. [Google Scholar] [CrossRef] [Green Version]
  74. Afzal, I.; Shinwari, Z.K.; Sikandar, S.; Shahzad, S. Plant beneficial endophytic bacteria: Mechanisms, diversity, host range and genetic determinants. Microbiol. Res. 2019, 221, 36–49. [Google Scholar] [CrossRef]
  75. Mannaa, M.; Park, I.; Seo, Y.S. Genomic features and insights into the taxonomy, virulence, and benevolence of plant-associated Burkholderia species. Int. J. Mol. Sci. 2019, 20, 121. [Google Scholar] [CrossRef] [Green Version]
  76. Stolz, A. Degradative plasmids from sphingomonads. FEMS Microbiol. Lett. 2014, 350, 9–19. [Google Scholar] [CrossRef]
  77. Gatheru Waigi, M.; Sun, K.; Gao, Y. Sphingomonads in microbe-assisted phytoremediation: Tackling soil pollution. Trends Biotechnol. 2017, 35, 883–899. [Google Scholar] [CrossRef] [PubMed]
  78. Asaf, S.; Numan, M.; Khan, A.L.; Al-Harrasi, A. Sphingomonas: From diversity and genomics to functional role in environmental remediation and plant growth. Crit. Rev. Biotechnol. 2020, 40, 138–152. [Google Scholar] [CrossRef] [PubMed]
  79. Huang, Y.S.; Shen, F.T. Bioprospecting of facultatively oligotrophic bacteria from non-rhizospheric soils. Appl. Soil Ecol. 2016, 108, 315–324. [Google Scholar] [CrossRef]
Figure 1. Schematic diagram of the experimental plots representing green manure (GM) treatment and bare ground (BG) control in a tea plantation.
Sustainability 13 11478 g001
Figure 2. (a) Hierarchically clustered heat-map of substrate average well color development of bacterial communities in bare ground (BG) control and green manure (GM) treatment samples collected after one month (_1M), two months (_2M), three months (_3M), six months (_6M), and nine months (_9M) of treatments. The heat map was generated based on Euclidean dissimilarity metrics, normalized from -2 to 2, and color scale represented from blue to red through yellow. (b) Principal component analysis (PCA) of the absorbance data from Biolog EcoPlate. Bare ground (BG) control and green manure (GM) treatment samples collected after one month (_1M), two months (_2M), three months (_3M), six months (_6M), and nine months (_9M) of treatments were compared. The first and second principal components are shown, which explained 87.27% and 4.59% of the total variance, respectively. PCA was performed based on Pearson correlation matrix. Loading variables (six carbon source categories) explaining variation in different treatments.
Sustainability 13 11478 g002
Figure 3. Ordination diagrams of (a) principal coordinates analysis (PCoA) and (b) non-metric multidimensional scaling (NMDS) of the relative abundance data from next generation sequencing. Bare ground (BG) control and green manure (GM) treatment samples collected after one month (_1M), two months (_2M), three months (_3M), six months (_6M), and nine months (_9M) of treatments were compared. PCoA and NMDS were performed based on weighted UniFrac distance metric. Loading variables (whole bacterial community) explaining variation in different treatments.
Sustainability 13 11478 g003
Figure 4. (a) Relative abundances of dominant bacterial phyla (>2%) in the bare ground (BG) control and green manure (GM) treatment samples collected after one month (_1M), two months (_2M), three months (_3M), six months (_6M), and nine months (_9M) of treatments. Relative abundances of nine phyla were displayed in different colors. The ‘Others’ comprise the unclassified and low abundance phyla. Error bar, mean (n = 3) ± standard deviation. (b) PCA of the relative abundance data from next generation sequencing. Bare ground (BG) control and green manure (GM) treatment samples collected after one month (_1M), two months (_2M), three months (_3M), six months (_6M), and nine months (_9M) of treatments were compared. The first and second principal components are shown, which explained 48.86% and 18.46% of the total variance, respectively. PCA was performed based on Pearson correlation matrix. Loading variables (dominant bacterial phyla) explained variation in different treatments.
Sustainability 13 11478 g004
Figure 5. (a) Hierarchically clustered heat map of relative abundances of dominant bacterial families in the bare ground (BG) control and green manure (GM) treatment samples collected after one month (_1M), two months (_2M), three months (_3M), six months (_6M), and nine months (_9M) of treatments. The heat map was generated based on Euclidean dissimilarity metrics, normalized from -2 to 3 and the color scale represented from blue to red through yellow. (b) PCA of the relative abundance data from next generation sequencing. Bare ground (BG) control and green manure (GM) treatment samples collected after one month (_1M), two months (_2M), three months (_3M), six months (_6M), and nine months (_9M) of treatments were compared. The first and second principal components are shown, which explained 44.82% and 12.16% of the total variance, respectively. PCA was performed based on Pearson correlation matrix. Loading variables (dominant bacterial families) explain the variation in different treatments.
Sustainability 13 11478 g005
Figure 6. Linear discriminant analysis effect size (LEfSe) analysis showing the bacterial taxa enriched in (a) green manure treatment and (b) bare ground control. The bars which represent the effect size (LDA) for particular taxa are given. The most effective biomarkers with an LDA score (log 10) higher than 3.6 or lower than −3.6 were shown.
Sustainability 13 11478 g006
Figure 7. Canonical correspondence analysis of the relative abundance of (a) dominant bacterial phyla (b) dominant bacterial families and soil properties. The bare ground control and green manure treatment samples collected after three months, six months, and nine months of treatments were considered. The percentage of variation explained by each axis was shown.
Sustainability 13 11478 g007
Table 1. Properties of soils collected from bare ground control and green manure treatment during the study period.
3 Months6 Months9 Months
Bare Ground ControlGreen Manure TreatmentBare Ground ControlGreen Manure TreatmentBare Ground ControlGreen Manure Treatment
pH3.72 ± 0.13 a 3.95 ± 0.07 a3.99 ± 0.02 b4.62 ± 0.08 a3.86 ± 0.10 b4.50 ± 0.06 a
EC (μS cm−1)156.5 ± 26.1 a141.0 ± 12.2 a122.6 ± 8.2 a108.6 ± 5.5 a148.2 ± 33.5 a86.0 ± 9.6 b
Organic matter (%)0.87 ± 0.41 a1.40 ± 0.08 a1.92 ± 0.27 a2.11 ± 0.21 a1.88 ± 0.36 a2.43 ± 0.39 a
Total N (%)0.16 ± 0.03 a0.15 ± 0.02 a0.22 ± 0.02 a0.21 ± 0.02 a0.15 ± 0.01 b0.19 ± 0.00 a
P (mg kg−1)294.2 ± 40.9 a256.7 ± 23.7 a332.0 ± 22.7 a309.4 ± 31.1 a304.9 ± 19.9 a268.3 ± 47.8 a
K (mg kg−1)92.8 ± 1.9 b154.2 ± 30.4 a106.5 ± 6.2 b207.5 ± 44.1 a104.4 ± 17.9 a173.0 ± 49.5 a
Ca (mg kg−1)76.4 ± 27.9 a79.3 ± 32.7 a147.0 ± 19.6 b212.7 ± 28.8 a181.8 ± 65.5 a336.6 ± 77.9 a
Mg (mg kg−1)39.3 ± 8.2 a56.5 ± 14.2 a53.5 ± 6.2 b108.5 ± 22.1 a65.4 ± 31.2 b143.9 ± 13.7 a
Fe (mg kg−1)416.0 ± 3.2 a389.4 ± 6.6 b494.5 ± 16.8 a448.6 ± 24.1 a432.2 ± 14.2 a380.1 ± 18.9 b
Mn (mg kg−1)8.0 ± 2.0 a7.1 ± 1.0 a6.8 ± 1.4 a7.0 ± 2.2 a6.8 ± 3.3 a9.4 ± 4.2 a
Cu (mg kg−1)1.0 ± 0.1 b1.3 ± 0.1 a3.4 ± 0.1 a3.4 ± 0.2 a3.4 ± 0.3 a3.0 ± 0.1 a
Zn (mg kg−1)1.5 ± 0.2 a1.2 ± 0.1 a1.7 ± 0.0 a2.1 ± 0.7 a2.1 ± 0.1 a2.6 ± 1.1 a
Values (mean ± standard deviation, n = 3) indicate the absolute amount of each characteristic. Different letters in the same row within the same sampling period indicate significant differences (p < 0.05) in one-way ANOVA.
Table 2. Functional diversity of bacterial communities in samples collected from the bare ground control and green manure treatment during the study period.
Bare Ground ControlGreen Manure Treatment
SEHAWCDSEHAWCD
1 month7 ± 3 b 1.275 ± 0.214 a2.314 ± 0.231 b0.231 ± 0.083 b25 ± 3 a1.000 ± 0.015 b3.198 ± 0.096 a0.851 ± 0.103 a
2 months13 ± 6 b1.090 ± 0.064 a2.621 ± 0.439 b0.389 ± 0.187 b26 ± 7 a0.999 ± 0.015 b3.220 ± 0.299 a0.796 ± 0.204 a
3 months18 ± 6 b1.023 ± 0.050 a2.901 ± 0.273 b0.574 ± 0.189 b28 ± 2 a0.997 ± 0.007 a3.304 ± 0.049 a0.900 ± 0.113 a
6 months17 ± 2 b1.014 ± 0.015 a2.884 ± 0.111 b0.580 ± 0.083 b30 ± 1 a0.996 ± 0.005 b3.378 ± 0.022 a1.077 ± 0.037 a
9 months18 ± 1 b1.374 ± 0.048 a3.967 ± 0.066 b0.545 ± 0.077 b30 ± 1 a1.316 ± 0.007 a4.477 ± 0.024 a1.068 ± 0.074 a
S: Substrate richness; E: Evenness; H: Shannon’s diversity index; AWCD: Average well color development. Values (mean ± standard deviation, n = 3) indicate each index. Different letters in the same row indicate significant differences (p < 0.05) in one-way ANOVA.
Table 3. Population diversity of bacterial communities in samples collected from the bare ground control and green manure treatment during the study period.
Bare Ground ControlGreen Manure Treatment
Chao1 ShannonInvSimpsonChao1ShannonInvSimpson
1 month165 ± 12 b5.13 ± 0.21 b15.82 ± 4.02 a201 ± 12 a5.52 ± 0.07 a21.10 ± 1.78 a
2 months205 ± 12 b5.35 ± 0.09 b19.55 ± 2.59 a361 ± 41 a6.27 ± 0.53 a36.06 ± 20.96 a
3 months226 ± 37 b5.42 ± 0.24 b19.36 ± 2.84 b382 ± 32 a6.56 ± 0.31 a45.45 ± 13.05 a
6 months224 ± 23 b5.23 ± 0.16 b16.53 ± 2.75 b483 ± 51 a6.65 ± 0.27 a45.03 ± 12.61 a
9 months277 ± 7 b5.38 ± 0.11 b18.45 ± 1.73 b574 ± 33 a7.16 ± 0.13 a68.96 ± 6.43 a
Chao1: Richness estimate for species; Shannon: Non-parametric Shannon diversity index; InvSimpson: The inverse Simpson index. Different letters in the same row indicate significant differences (p < 0.05) in one-way ANOVA.
Publisher’s Note: MDPI stays neutral with regard to jurisdictional claims in published maps and institutional affiliations.

