Article

Dynamic Absorptive Capability and Innovation Performance: Evidence from Chinese Cities

1
Institute for Global Innovation and Development, East China Normal University, Shanghai 200062, China
2
School of Urban and Regional Science, East China Normal University, Shanghai 200062, China
3
Department of Hospitality Management, Shanghai Business School, Shanghai 200235, China
*
Author to whom correspondence should be addressed.
Sustainability 2021, 13(20), 11460; https://doi.org/10.3390/su132011460
Submission received: 31 July 2021 / Revised: 21 September 2021 / Accepted: 13 October 2021 / Published: 17 October 2021

Abstract

:
Absorptive capability is the capability of actors to acquire, assimilate and exploit external knowledge. In this paper, we consider absorptive capability to be multi-dimensional and to have three dimensions. Although a sufficient amount of work in the literature discusses dynamic absorptive capability, empirical studies are relatively rare. At the urban or regional levels, related empirical studies are even fewer. In this paper, we build a framework of the dynamic absorptive capability at the urban level by using 339 Chinese cities at the prefecture level and above as our sample. In order to take the geographical distance into consideration, we use a Spatial Durbin Model to measure the effects of the acquirement, assimilation, and exploitation of absorptive capability. The results show that all of the core variables (acquirement, assimilation, and exploitation) have significant positive impacts on innovation performance. Additionally, the two control variables (R&D personnel and R&D investment) have significant positive impacts on innovation performance. In this way, the role performed by multidimensional absorptive capability in fostering innovation performance is highlighted, and some policy recommendations are provided.

1. Introduction

Absorptive capability (ACAP) has been a topic that has garnered much interest since it was first proposed. Generally, ACAP refers to the ability to take advantage of external knowledge for commercial profits, which intercedes with the common need for innovation and economic development [1]. A flourishing body of literature has expanded knowledge mainly on firm-level ACAPs and has further extended to the urban and regional levels [2,3]. China is the second largest economy in the world. However, efforts must be mounted by China to maintain its economic growth. Additionally, China has encountered a decrease in its GDP growth rate in the last decade. Therefore, the objective is to develop the economy urgently but sustainably. Innovation is pivotal to achieving regional and national economic growth. Cities are the main platform for innovative activities as they attract resources for innovation such as creative firms and talents. Cities with stronger ACAPs are capable of accelerating the learning process and of increasing their innovative capability. Accordingly, the Chinese government has taken initiatives to build the “Sci-tech Innovation Centers with Global or National Influence” to stimulate urban innovation performance. The science and technology here are used in a problem-oriented approach, addressing the most urgent and pressing problems, starting with the urgent needs and long-term demands of the country. Although the goal is to promote urban innovation performance comprehensively, resources for innovation are distributed disproportionately and are more polarized than population and economic development [4]. In China, the most prestigious universities, institutions, and large companies are located in a few urban areas, which leads to the differentiation of innovative production [5]. China launched The Development of the Western Region in China project to minimize the increasingly developing gap between the western regions and the relatively rich eastern regions. For example, in the leading city of western region—Chengdu, the capital of Sichuan province—has implemented special policies to reallocate talents, technology, land, capital and other innovation resources. To enhance the commercialization of research findings, the government built the application scenarios, for example the “Urban Future Scenarios Laboratory”, for major scientific and technological innovations. An appropriate cognitive similarity is the premise of learning processes, and diverse knowledge bases provide cities with more opportunities to absorb external knowledge [6,7]. The differentiation among cities and regions causes a differentiation in the knowledge bases and, therefore, a differentiation in their ACAP.
The objective of this study was to combine multiple dimensions of ACAP through the lens of a patent applied to The State Intellectual Property Office (SIPO). We divide the ACAP of cities into three dimensions, i.e., acquiring capability, assimilating capability, and exploiting capability. The three capabilities represent the stages of a learning process, which are the input, internalization, and output stages. To measure the three capabilities, we build a database from the bulk data including patent citation, application, and transaction information. We believe that the network capital is a resource for cities and that it composes part of the dynamic ACAP of cities. Therefore, the citation and the transaction are used to measure the acquiring and exploiting capabilities. For the assimilating capability, we use the technological diversity of urban knowledge bases to describe the ability to internalize knowledge. The technological diversity is based on the IPC categories of urban patent applications. In this paper, 339 Chinese cities at the prefecture level and above are used as our sample.
The main contribution of this paper is the enrichment of the literature on dynamic ACAPs through the provision of empirical evidence. Additionally, the framework of this paper is organized as follows: the Literature Review section presents the main literature related to ACAP; the Data and Methodology section introduces the data sources and the Spatial Durbin Model for measuring ACAP; then, in the Empirical Investigation section, detailed visualization of the dynamic ACAP and regression results are presented; and the conclusions and a discussion are provided in the last section.

2. Literature Review

2.1. The Concept of ACAP

Knowledge is crucial in learning processes. External knowledge has more potential to contribute to innovation, especially when internal knowledge is limited or insufficient [8]. Mere exposure to knowledge is not enough since the effectiveness of learning hinges on the ability to absorb knowledge [9]. Therefore, an absorptive capability is the prerequisite for innovation. In order to evaluate the ability of absorbing and utilizing external knowledge, Cohen and Levinthal proposed that the absorptive capability of a firm is defined as the ability to acquire, assimilate, and apply external knowledge for commercial purposes [1]. Giuliani extended the spatial scope of ACAP from the firm level to the cluster level: cluster ACAP is considered the capacity of clusters to absorb, diffuse, and exploit external knowledge [8]. Significant research efforts have been expended on the interaction between firms and their milieu [10,11,12]. To extend the conception to an even greater extent, Mowery and Oxley found that economies with a strong national absorptive capability benefit most from external knowledge [13]. By creating an analogy on the firm-level ACAP, Roper and Love considered regional ACAP to be the capacity of a region to evaluate, assimilate, and commercially apply knowledge [14]. In this extension, at least two facets are presupposed. Firstly, in a specific spatial area, except for firms, other organizations such as universities and institutes are considered actors in the framework. In fact, other agents make great contributions to local innovation by both self-production and cooperation with firms [15]. Secondly, the institutional context should be taken into consideration [16]. Governments play their role by adopting relevant policies or by financially supporting R&D activities [17]. Similarly, Schillaci and Nicotra coined the term ‘territory’s ACAP’ and outlined that R&D activities, human skills, and organization structure are determinants of territorial ACAP [18].
In this paper, we study ACAP at the city level or, in other words, the secondary administrative region level. At least two facets that are not considered on the firm-level are included: one is that, based on the Triple Helix dynamics, three actors (government, the industry, and academia), are considered in the functioning of the urban system for learning and innovation. The government includes national, regional, and local governmental departments; the industry represents a series of high-tech companies, large-scale corporations, and multinational firms; and academia consists of prestigious universities, colleges, and institutes [19]. Therefore, for ACAP at the city level, actors are not only firms but also governments and research organizations such as universities, colleges, and institutes. Regional ACAP is not the simple sum of organizational interactions; instead, the institutional factors also need to be considered in the overall framework [20]. The Triple Helix Model is extensively used at the urban-level or secondary administrative regions to measure R&D activities [21]. The second facet is that the institutional context is contained in each city. Although cities are directed by provinces and may share the same general policies, cities within the same province still develop their own policies.
Due to the flourishing of telecommunications, cities are better connected through the flow of information. This type of flow enables intertwined and advanced service activities including finance, insurance, real estate, etc., and also R&D and scientific innovation. Hence, cities are perceived as the “space of flows” by Castelle [22]. Meijers highlights the paradigm shift from a central-place model to the network model and provides empirical evidence on it [23]. Therefore, the type, magnitude, and frequency of flows greatly affect sustainable economic development [24,25]. These kinds of flows can be understood as resources for cities, also known as “network capital” [26]. Network capital is defined as the set of relations wherein actors access knowledge or technologies and provides the resources embedded in intercity networks. The strong network position allows cities to build more channels to access external knowledge and therefore to attain stronger ACAP [27].

2.2. Multi-Dimensional ACAP

In the proposition of Cohen and Lavinthal [1], ACAP is a function of prior knowledge. Prior knowledge contains the basic skills and knowledge of science and technology. Diverse sources of knowledge contribute to the development of ACAP [7]. The reliance on prior knowledge may lead to path dependence or lock-in [28,29]. Teece (1997) proposed the concept of dynamic capability. In this view, dynamic capability is the ability to respond to an uncertain environment by acquiring, integrating, and reconfiguring organizational skills, resources, and functions [30,31]. The word ‘dynamic’ stresses the capacity of renewing competence in order to respond to a changing environment [32].
Meaningful attempts are conducted to build ACAP from a dynamic perspective. Zahra and George reconstructed the conception of ACAP through a resource-based perspective, suggesting that ACAP includes four dimensions that can be represented by four capabilities: acquirement, assimilation, transformation, and exploration [31]. The former two dimensions are summarized as a potential ACAP, which focuses on the input process of external knowledge. The latter two are summarized as realized ACAP, which focuses on the output process. By extensively analyzing the existing literature, Lane and Pathak considered ACAP as comprising of three dimensions or sequential steps: exploratory learning, assimilating learning, and transformative learning [33]. The difference between the inclusion of three dimensions or four dimensions is the decision on whether to divide the internalization of knowledge into two dimensions, i.e., one for the acquired knowledge and the other for knowledge prepared to be exploited. In this paper, we believe the knowledge bases of cities act both for acquired knowledge and exploited knowledge, so we divide ACAP into three sequential processes, or phases, where external knowledge is acquired, internalized and commercially transferred.

2.3. ACAP and Innovation Performance

A substantial body of literature explores how ACAP impacts innovation. Regions with more ACAP present better innovation capabilities and thus gain further levels of competitiveness. Inspired by this idea, some literature has emerged to explore the mechanism whereby dynamic ACAP impacts innovation performance. Researchers have engaged in meaningful attempts to describe the multidimensional ACAP by introducing surveys and scale methods into empirical studies [20,34,35]. However, it is inevitable that a subjective bias is present to some extent. To reduce the subjective bias, alternative proxy variables are introduced for multi-dimensional ACAP [36]. By dividing regional ACAP into two types of capabilities—cognitive capability and technical capability—Qian and Jung argued that ACAP can assist in resolving the barriers of knowledge commercialization [37]. There is an increasing amount of literature on dynamic ACAP as measured by proxy variables, but relevant studies are still insufficient. The results of these empirical studies reveal that different dimensions of ACA affect innovation performance in different ways [38,39]. During the innovative process, the recognizing capability allows cities to discount any unnecessary knowledge and select that which is considered valuable. In doing so, cities can decide their future direction of technology development [40]. The assimilating capability determines the extent to which cities can understand and internalize the acquired knowledge. As a result, knowledge stocks can be updated for reducing the risk [41]. The exploiting capability is the final stage of knowledge absorption. The exploiting capability transfers internalized knowledge into economic benefits, which guides policy makers to continue or raise their level of R&D investment to maintain the learning activities. Using this positive feedback, virtuous circle can be formed. As a result, innovation performance can be improved.
In this paper, we consider ACAP to be the capability of a city to acquire, assimilate, and exploit external knowledge for commercial purposes. We propose the hypothesis that all three dimensions of a regional ACAP can stimulate the regional innovation performance. To test this hypothesis, we use 339 Chinese cities at the prefecture level and above as our sample. From the resource-based perspective, the interaction among actors (firms, universities, public agencies, etc.) within an urban context generates innovation. The relationship represented by the network capital provides the channels necessary for a city to access external knowledge [42]. On the other hand, diverse knowledge bases play a fundamental role for regions to assimilate and transfer knowledge [43]. Hence, we assume that the more diverse the knowledge bases are, the greater the possibility that cities have common knowledge to share, so the city has a stronger ACAP. However, ACAP is not the simple sum of actors. It comprises the interaction between actors and the context. The actors perform different roles when introducing knowledge to the city. Therefore, we take the R&D investment and R&D personnel of cities as control variables to describe the influence of the milieu.

3. Materials and Methods

3.1. Research Design

In this paper, three capabilities are measured to capture the dimensions of ACAP, i.e., acquiring capability, assimilating capability, and exploiting capability. We assume that all three capabilities have positive impacts on innovation performance. To test our hypothesis, we built the framework of the ACAP. Understanding the ACAP is clearer through the lens of a learning process (Figure 1). External knowledge is acquired by a city through the innovative actors, i.e., gatekeepers, including actors such as firms, universities, institutes, etc. Then, the knowledge base plays its role by selecting what type and the amount of knowledge can be internalized. After a series of interactions between actors and the institutional environment, cities transfer external knowledge into commercial products. Mancusi constructs an ACAP through knowledge spillovers, showing that ACAP increases the flexibility of innovation of countries that have fallen behind [44]. So, we use the flow data to describe the capabilities of ACAP. Mukherji uses self-citation to measure ACAP [45]. From a resource-based perspective of ACAP, external knowledge is the resource of cities. Cities with higher ACAPs tend to demonstrate stronger abilities to build channels for knowledge exchange and for managing knowledge gained from the outside. For this reason, we use patent citation data to measure the acquiring capability of cities, and we use the patent transaction of cities as the exploiting capability. The assimilating capability determines the extent to which external knowledge can be internalized and then utilized. We consider the technological diversity to be the indicator of assimilating capability. We measured the assimilating capability by calculating the diversity in technologies. There are eight main classes (one digit) of technology containing 645 (four digit) subclasses of technology in the IPC system.
R&D activities are disproportionately distributed among cities. Typically, cities also differ in both the absolute and comparative advantages of ACAP. To map the differentiation of the multidimensional capabilities, we use 339 Chinese cities at the prefecture level and above as our empirical sample. The innovation policies in China are more often sustained through the intervention of policy agenda. However, in other industrialized countries, self-organization plays a central role in innovation policies [17]. Unlike most cities around the world that are defined by their functional area or morphological area, Chinese cities are defined by the explicit administrative boundary, which does not limit researchers from re-clarifying or re-delineating urban boundaries. In this sample of 339 cities at the prefecture level and above, four municipalities are directly under the central government (Beijing, Shanghai, Tianjin, and Chongqing), two are Special Administrative Regions (Hong Kong and Macao), and 333 are prefecture-level cities. Generally, prefecture cities, municipalities directly under the central government, and Special Administrative Regions are all considered “cities” in Chinese studies. Noticeably, Taiwanese cities are not included in our sample. Three time periods (T1: 2004–2008, T2: 2009–2013, and T3: 2014–2018) are chosen to describe the spatial distribution of a dynamic ACAP.
We consider the main actors within the urban context to be organizations, so the effects of individuals in cities are not included. To locate the organizations, we extract all Chinese organizations that appear in the patent application data from 1990 to 2018 to build the organization database. Unsurprisingly, firms constitute most of the database because firms conduct most of the technical innovation activities. To avoid any ambiguity in situations where a firm has multiple names, we reviewed our data on the Aiqicha platform (https://aiqicha.baidu.com/, accessed on 11 January 2021). Aiqicha is the provider of firm business registration information. We located firms using their registration cities. The remaining organizations were mainly universities, colleges, and institutes that usually have fixed and unique addresses. Therefore, we connected to the open Application Programming Interface (API) platform Amap (https://lbs.amap.com, accessed on 15 January 2021), which is one of the leading LBS (location based services) providers in China, to locate these organizations at the urban level.
To account for spillover effects, we constructed a Spatial Durbin Model (SDM). We used panel data to detect the temporal effects. The panel SDM requires well-balanced data. After assessing the data availability of the socioeconomic data of cities, we selected the panel data from 2004 to 2017 for the regression model. In accordance with the existing literature, the empirical model was constructed as follows:
y i , t = λ Wy i , t + X β + WX δ + ε
where y i , t is the innovation performance of city i in year t, which is indicated by the number of patent applications of city i in the year t. The values of patent applications were checked from the China City Statistical Yearbook from 2005 to 2018 for each city. W is the spatial weighted matrix that is calculated by the reciprocal of the spherical distance between cities. X represents the explanatory variables of regional ACAP and control variables.

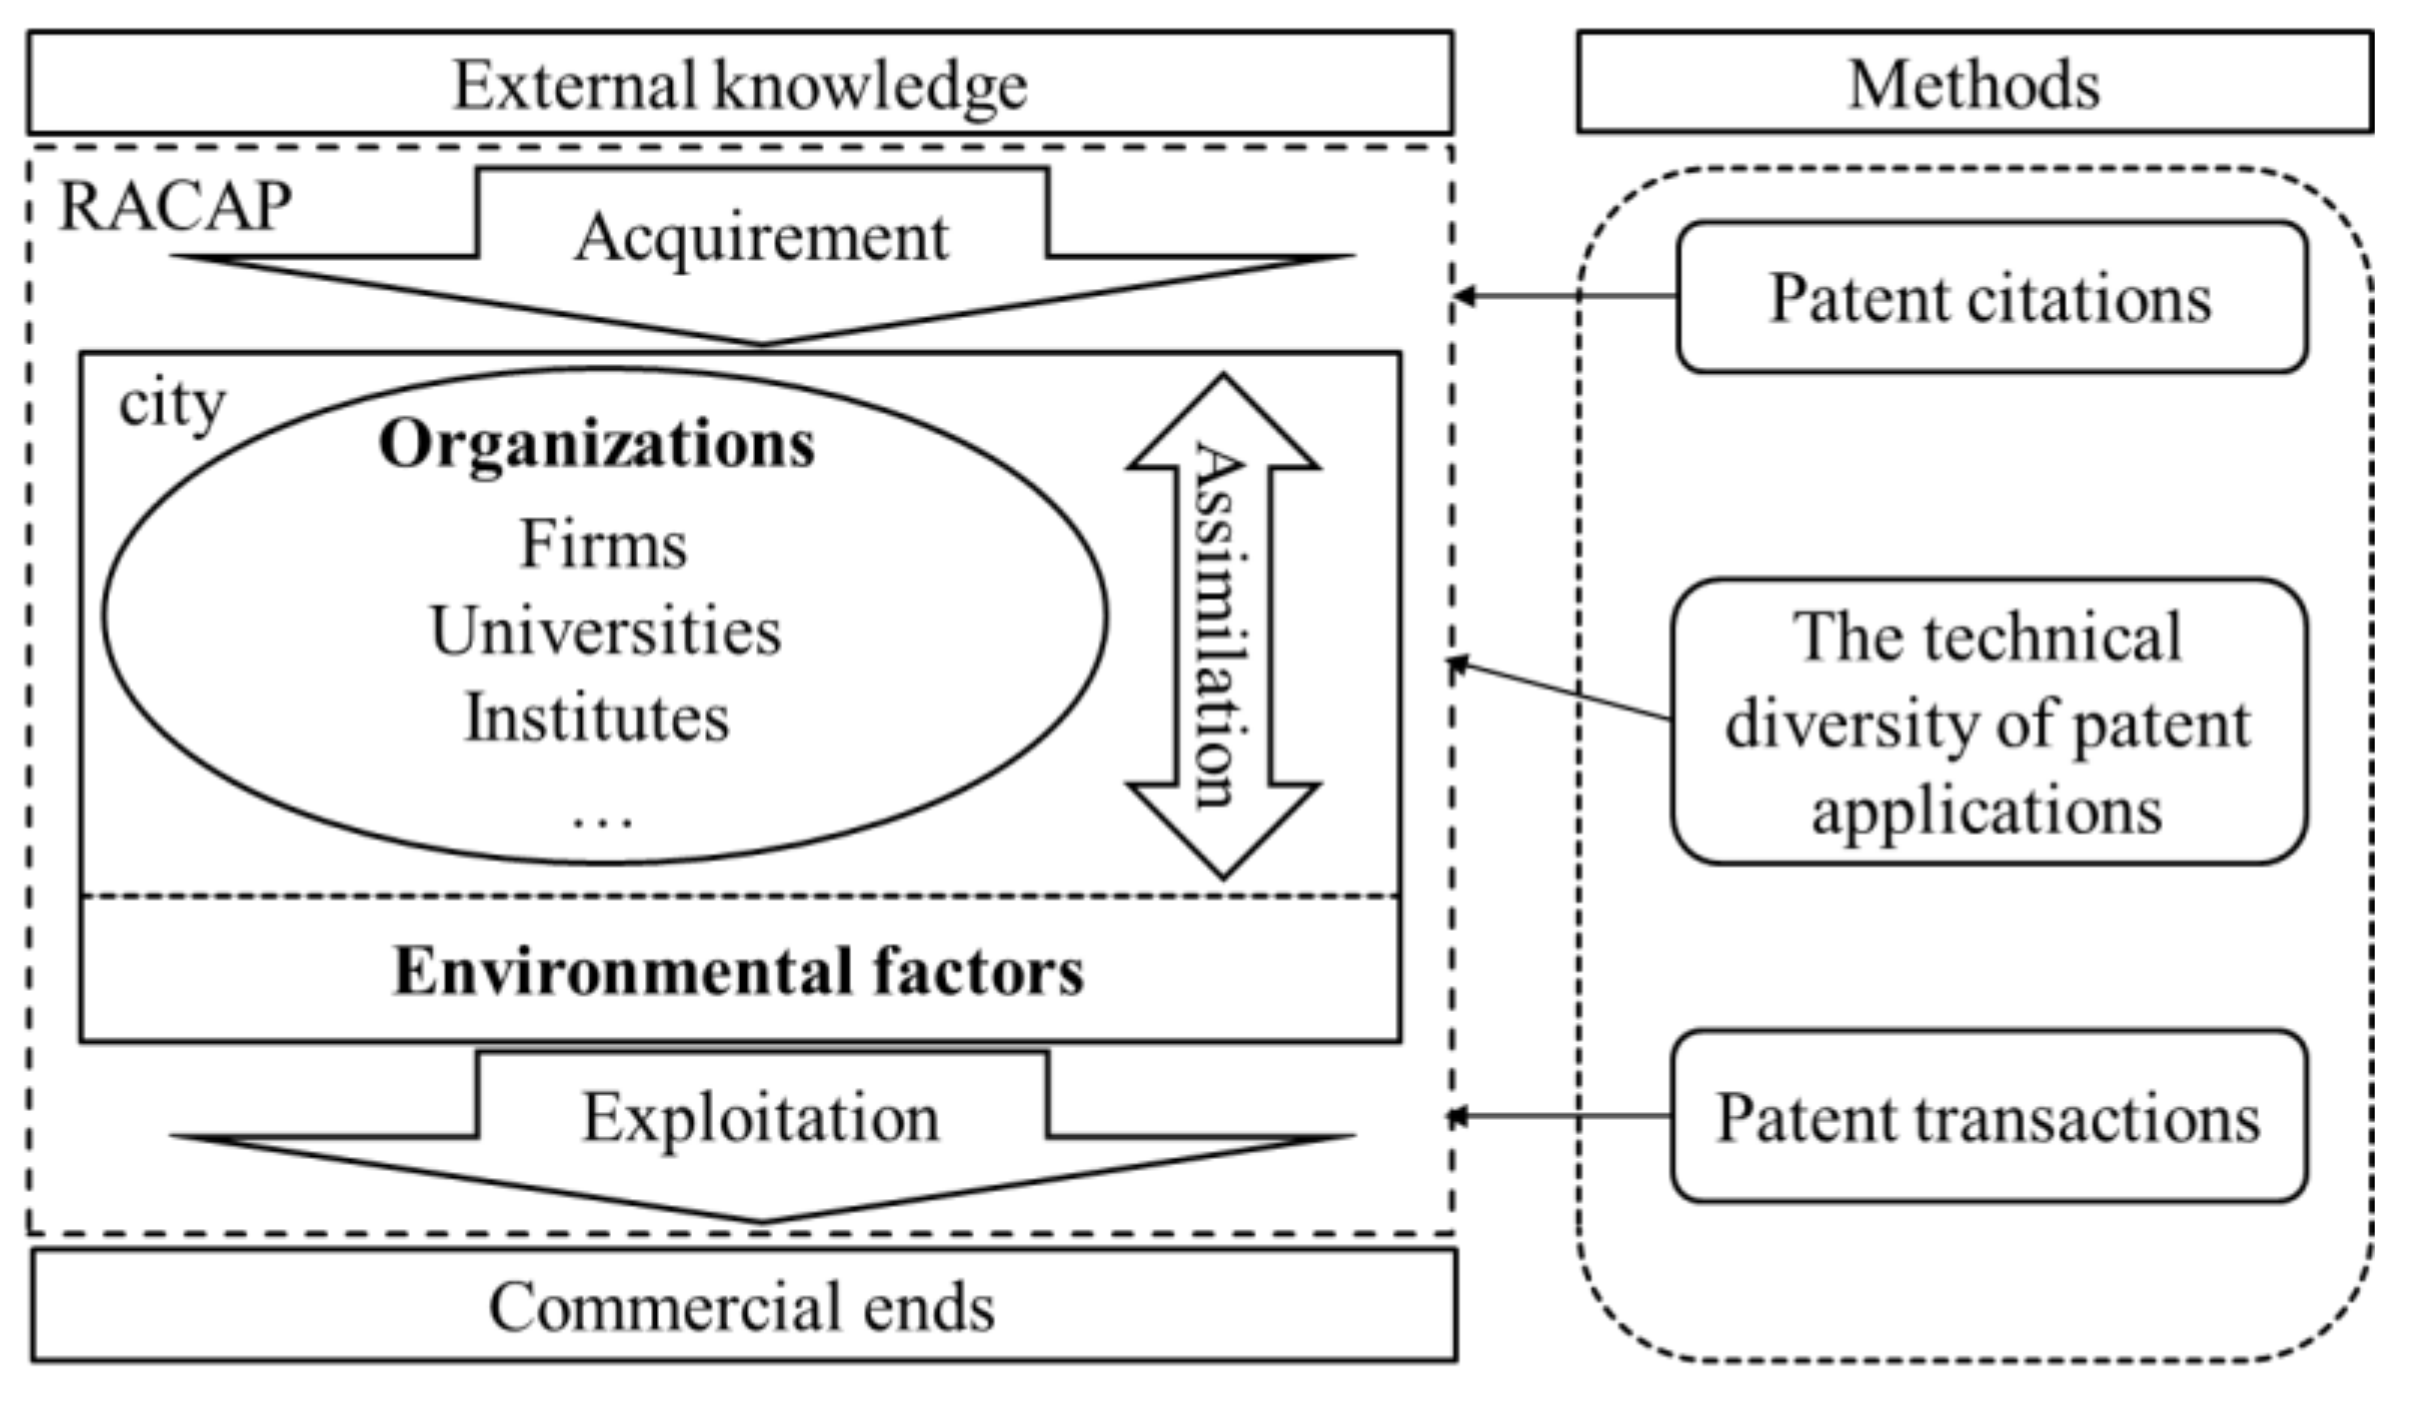
3.2. Measure of Regional ACAP

In our empirical model, three explanatory variables are introduced to represent the capabilities of ACAP. We built the acquiring capability and exploiting capability based on the flows of knowledge. Specifically, we chose the variable acquirement i , t for the acquiring capability. The value of acquirement i , t is the number of citing patents for city i in year t. The variable exploition i , t is the exploiting capability, and its value is the total number of patents sold by city i in year t. Two main differences exist between the citation dataset and the transaction dataset. Firstly, the direction of the knowledge flows are opposite to one another in the two datasets, which means that the city is the receiver in a citation while it is the provider in a transaction. Secondly, although the behaviors of both citations and transactions are spontaneous rather than passive, a transaction involves monetary activities, which is in accordance with the core of exploiting capability. According to the conceptual framework for the assimilating capability, a consensus between the knowledge bases of “teacher” and “student” cities is the prerequisite for knowledge assimilation [46]. Therefore, in order to describe the assimilation capability of a city, we selected the variable assimilation i , t , which represents the diverse technologies owned by city i in year t. An IPC classification (four digits) is used to represent the different types of technology.
For data consistency and integrity, patent citation, publication, and transaction datasets have all been retrieved from the public patent databases of The State Intellectual Property Office (SIPO), which is the official intellectual property office in China. Noticeably, transaction data are contained in the legal status of patents, so we discount of irrelevant information such as the publication date or authorization date of patents in the original documents. Generally speaking, a patent takes around 18 months from its application to publication. Therefore, in Equation (1), a possible endogeneity is avoided resulting from the time lag between y i , t , represented by patent applications and core variables calculated from patent publication data.

3.3. Control Variables

R&D personnel and R&D investment are selected as control variables. Human resource factors are widely proven to have a positive impact on ACAP both at the firm and regional levels [37,47]. Therefore, based on the data availability, we decided to use the variable R & D _ P i , t to represent a human capital factor for R&D personnel. We select Personnel of Independent Research and Development Institutions as the indicator of R&D personnel. In the China City Statistical Yearbook, Personnel of Independent Research and Development Institutions refers to people working in and receiving payment from research and development institutions. It includes regular full-time and temporary staff, and workers and employees working on contracts, but excludes retirees and people who take a leave from work without payment but still retain their posts, and are therefore not on the employee record.
Meanwhile, to control the financial investment into R&D activities, we introduce the variable R & D _ I i , t , which is represented by the Total Expenditure on Research and Development. The data of this indicator are extracted from the China City Statistical Yearbook. In its official definition, Total Expenditure on Research and Development refers to all actual expenditures made for R&D (basic research, applied research, and experimental development) in the reference period. It includes direct expenditures on R&D and indirect expenditures on R&D (including management and necessary administrative expenses of research institutes, and investment in capital construction relating to R&D). The variables and further relevant information are shown in Table 1.

4. Results

4.1. Explanatory Variables

In SIPO, three types of patent applications can be filed, i.e., patents for invention, patents for utility models, and design patents. Patents for invention include obtaining knowledge-intensive products and technology. Patents for utility models are also called “little patents” because they have more utility values but less creativeness and technical innovation. Design patents are required for industrial designs regarding a product appearance. It is acknowledged that patents for invention can best represent the innovation outputs [5]. In this paper, we select patents for invention to measure innovation performance.
The spatial distribution of patent applications in the years 2004, 2011, and 2018 are displayed in Figure 2. The panels display clear, spatially evolving trends for the patent output in Chinese cities. In 2004, innovation applications are distributed equally and sparsely among cities. All cities are at the primitive stage, and the innovation performance is relatively low. Later in 2011, three locations (Beijing, Shanghai, and Shenzhen) with relatively high patent outputs emerged. As the political center and economic center, Beijing displays the highest innovation performance, far surpassing all other cities. In the Yangtze River Delta Economic Development Zone, Shanghai leads in innovation performance alongside Suzhou, Jiangsu province. Shanghai attracts a great number of multinational corporations (MNCs) with foreign direct investment (FDI) to locate their Chinese headquarters through its international and modern environment. Suzhou has close connections with Shanghai. Due to the geographical proximity, most of these MNCs erect their factories in suburb areas like Kunshan, the county-level city governed by Suzhou. Later, local actors improve their innovation abilities through the knowledge spillover so that urban innovation performance is elevated. Shenzhen becomes the core of the Pearl River Delta region. Shenzhen is close to the gate city, Hong Kong, which means Shenzhen gains better access to cutting-edge technology and accesses a greater number of FDIs. In the latest data from 2018, it is found that more cities have become innovation centers. Unlike Shanghai and Shenzhen, Beijing distinguishes itself as being the only center with no strong neighbors. Whereas in the Yangtze River Delta Economic Development Zone, Shanghai and other cities like Suzhou (Jiangsu province), Hangzhou, Nanjing, Hefei and Wuhu exist alongside each other. The zonal distribution of patent application generally coincides with the zonal urban economic development. In the Pearl River Delta region, Shenzhen, Guangzhou and Foshan are cities with a high level of patent applications. With the supporting policies of the large-scale development of China’s western region, Chengdu grows to the innovative center of Southwest China. From 2017 to 2019, the R&D spending of Chengdu increased from 28.91 billion to 39.23 billion.

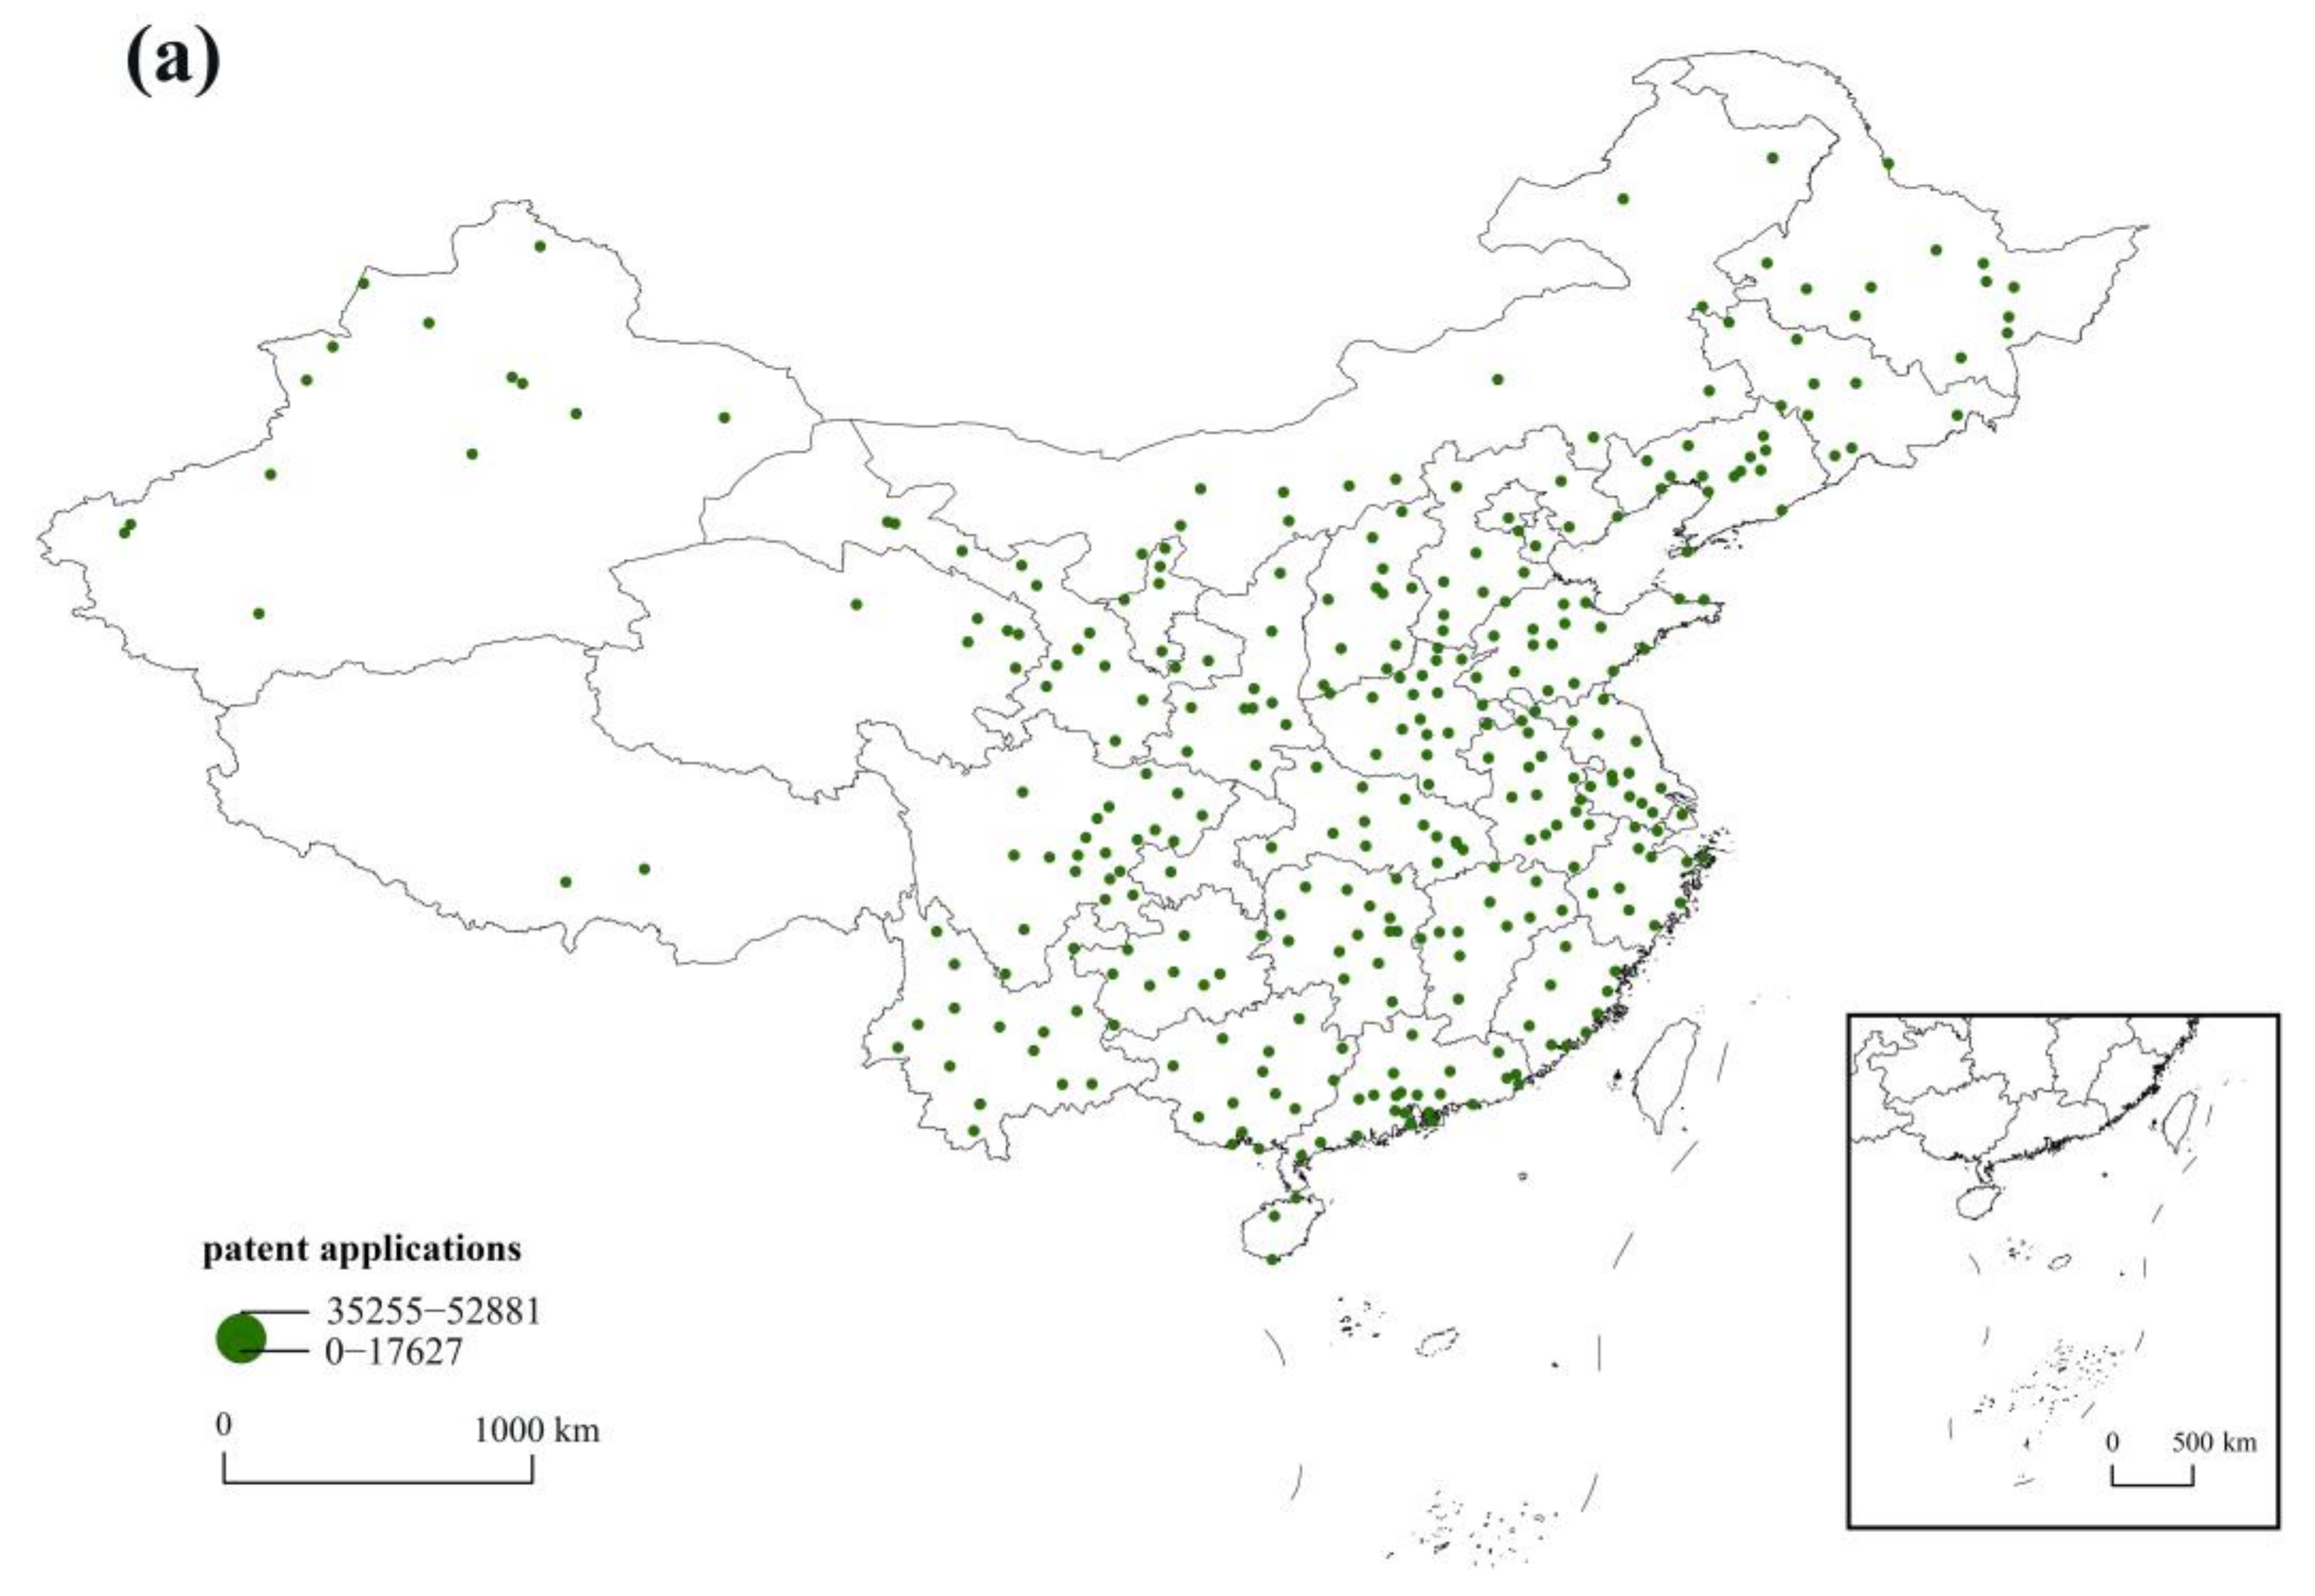
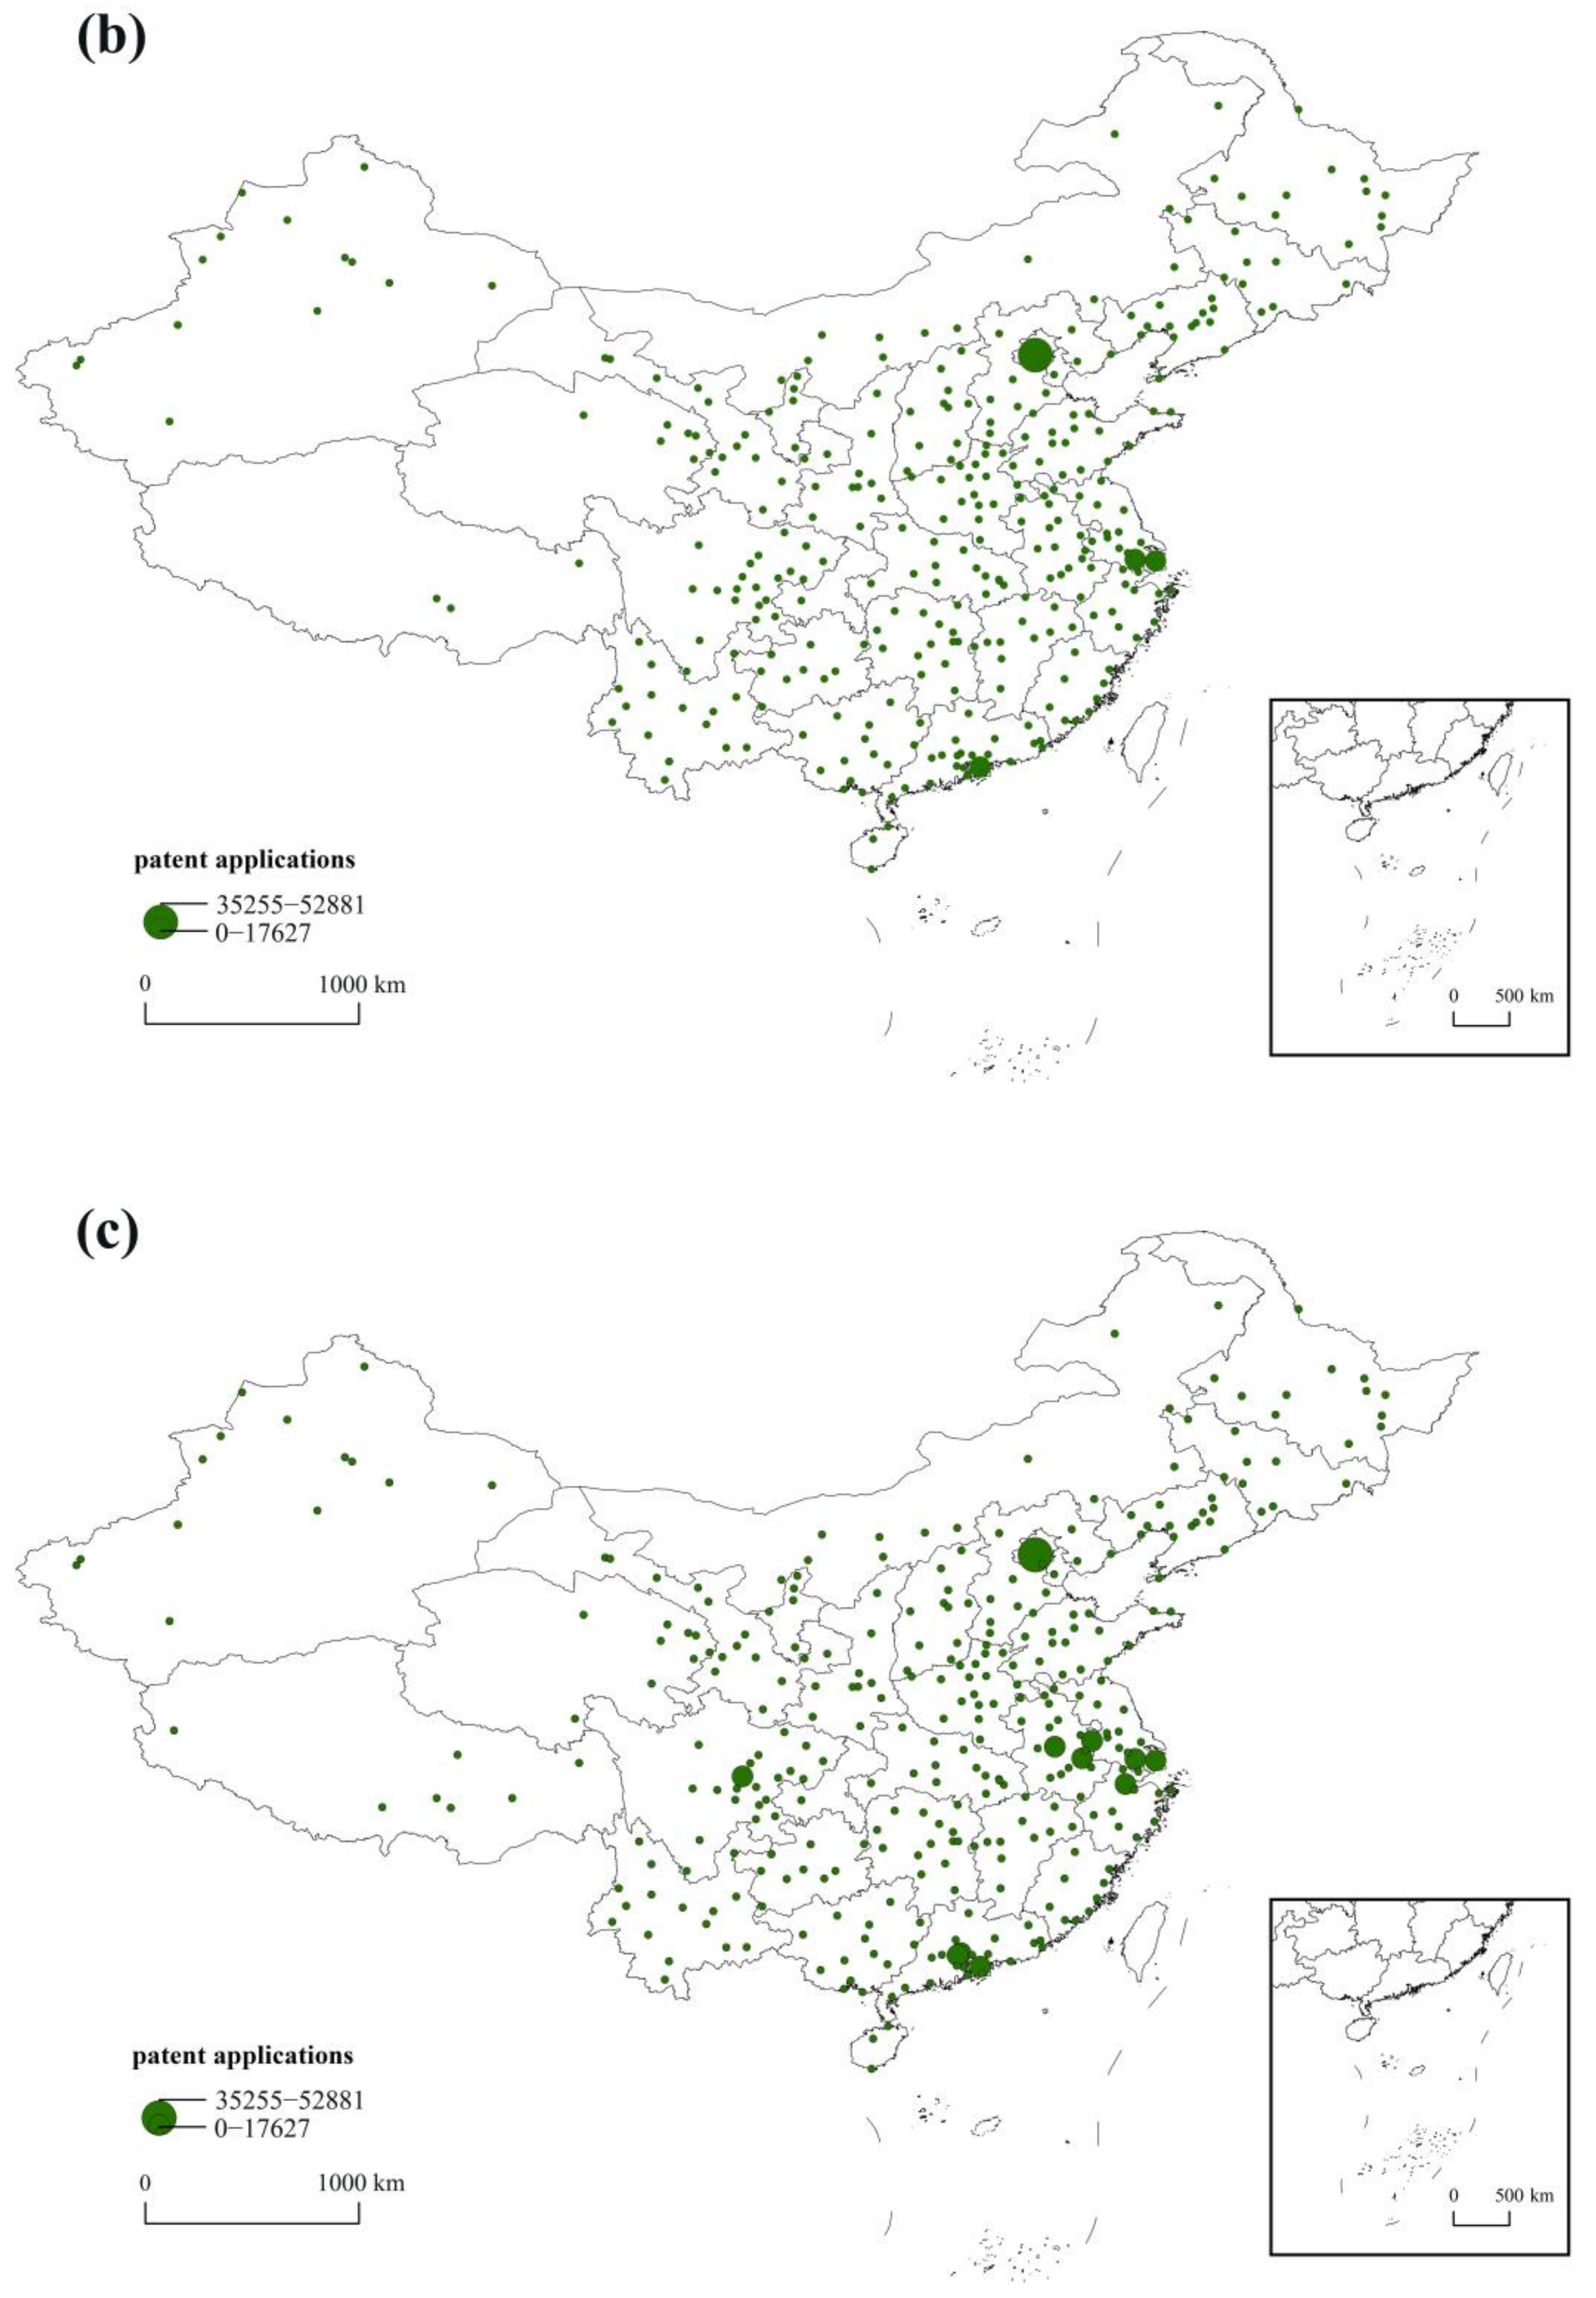
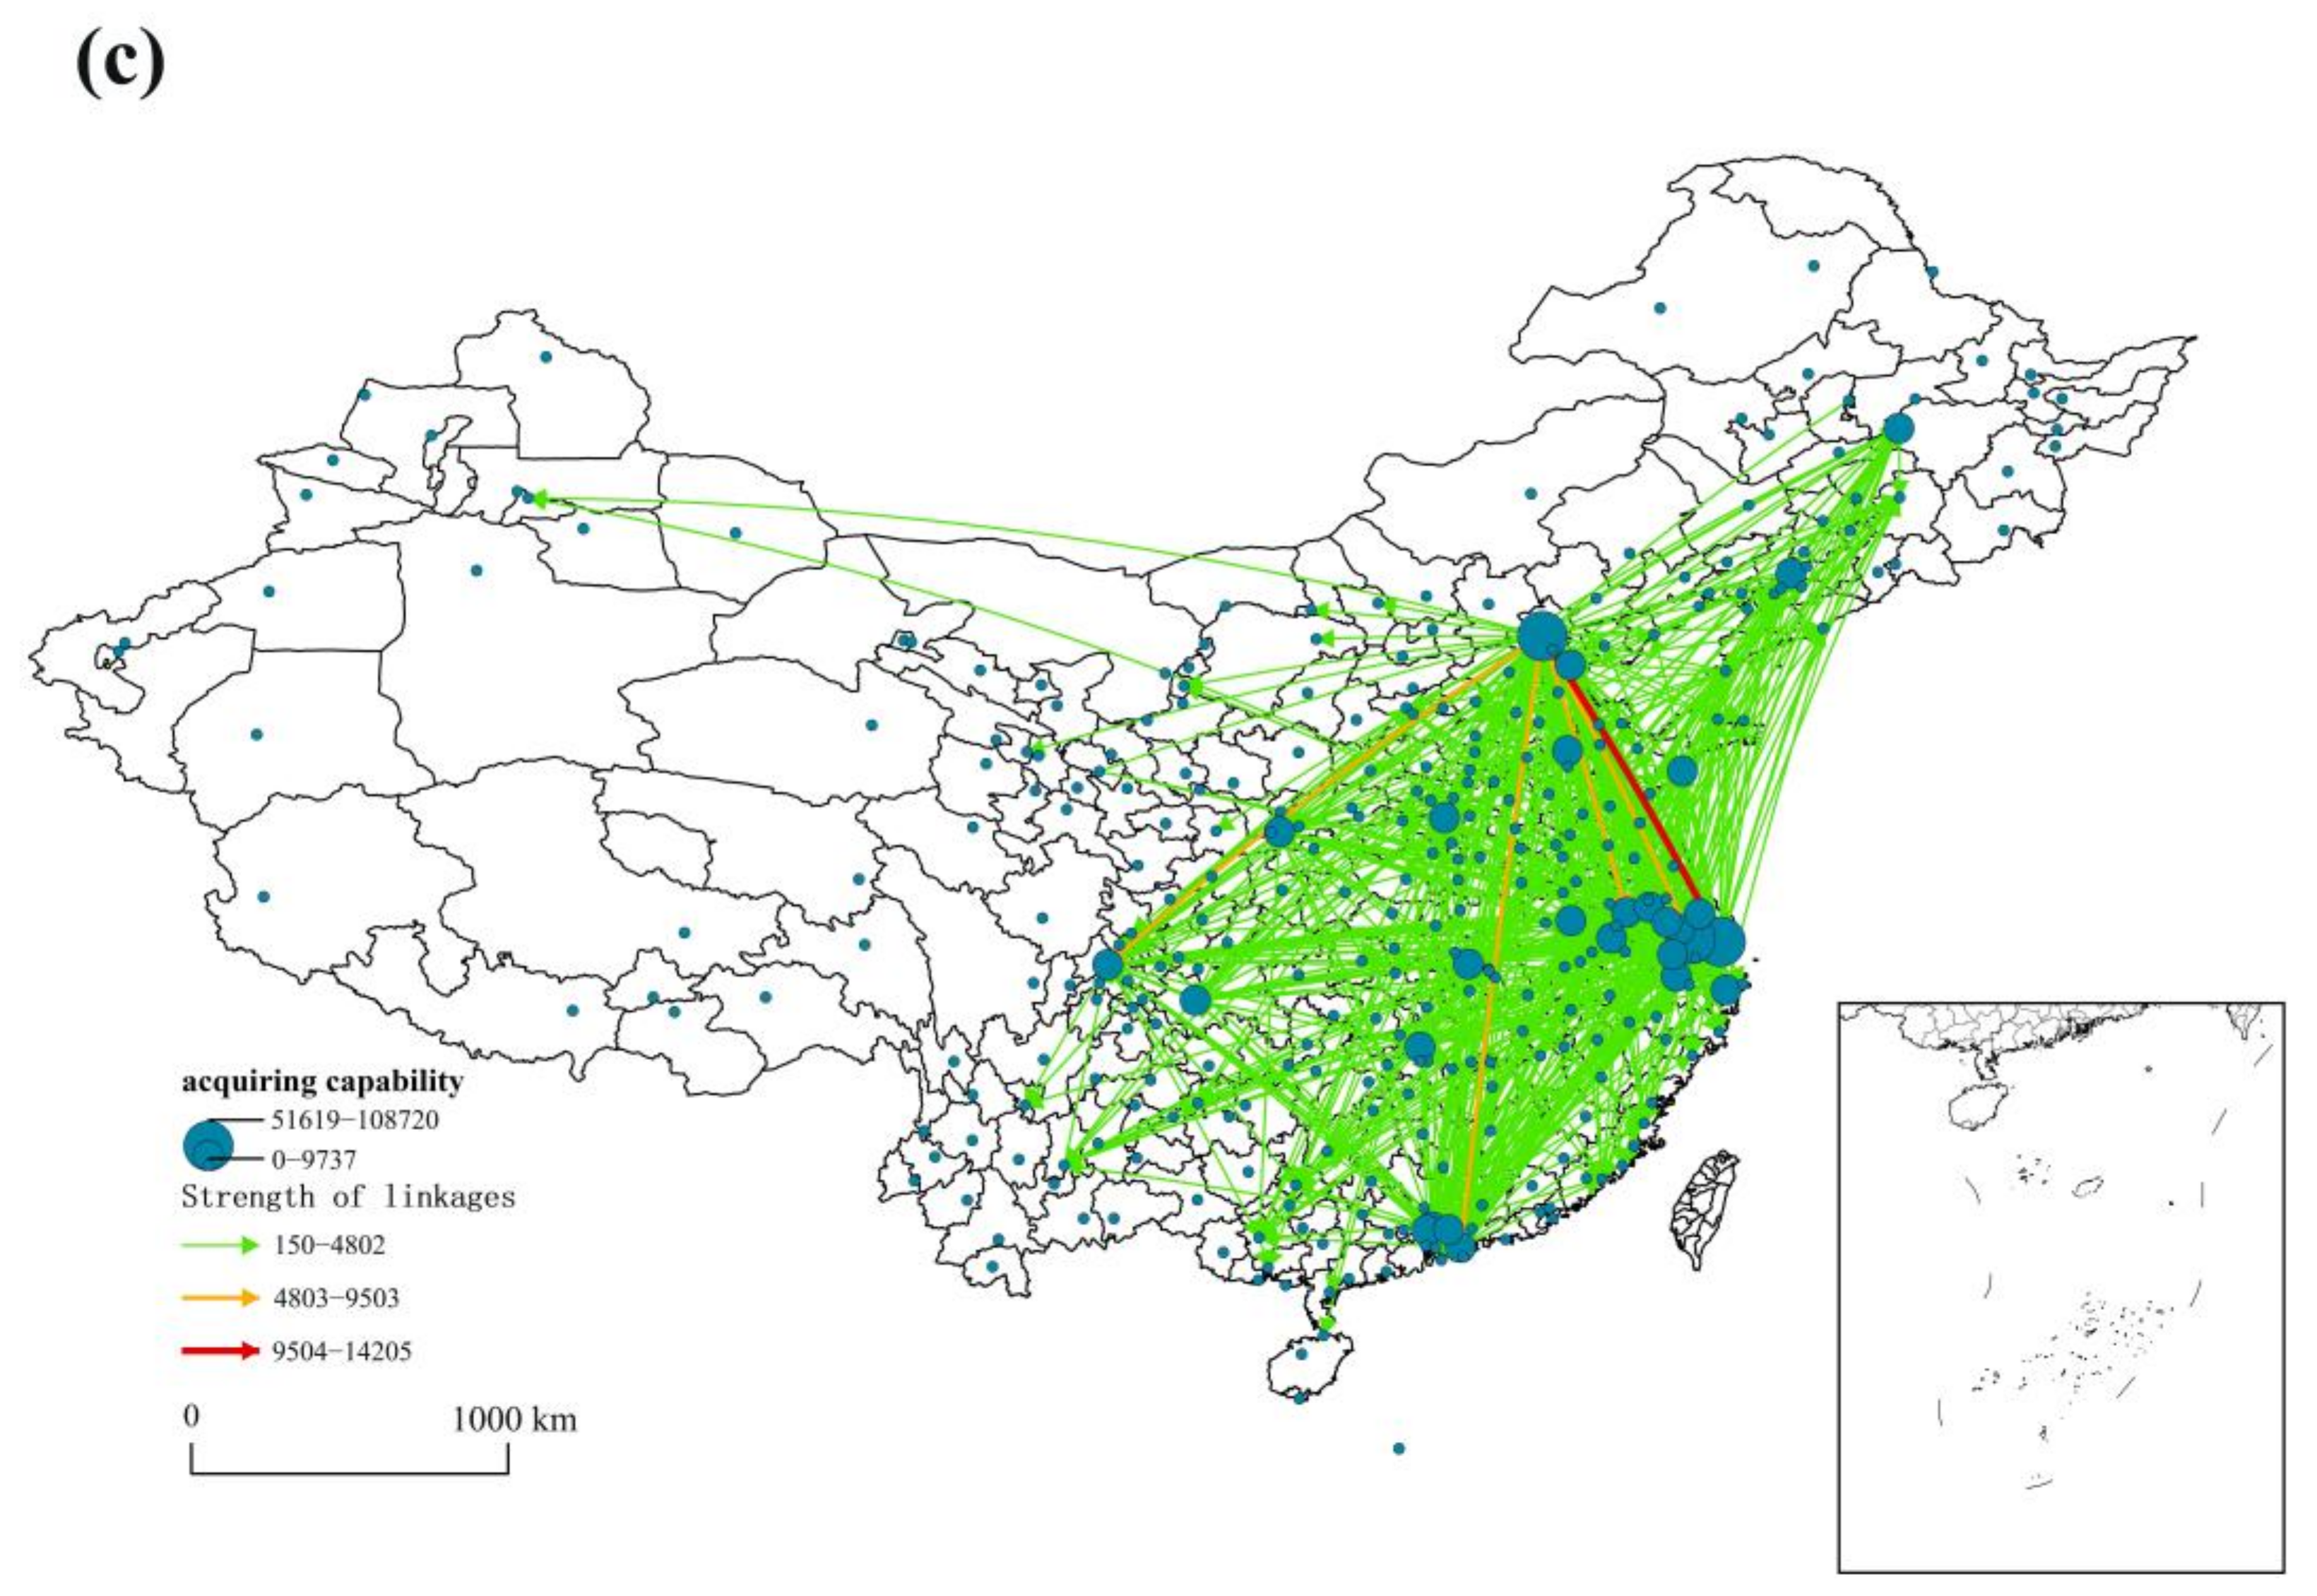
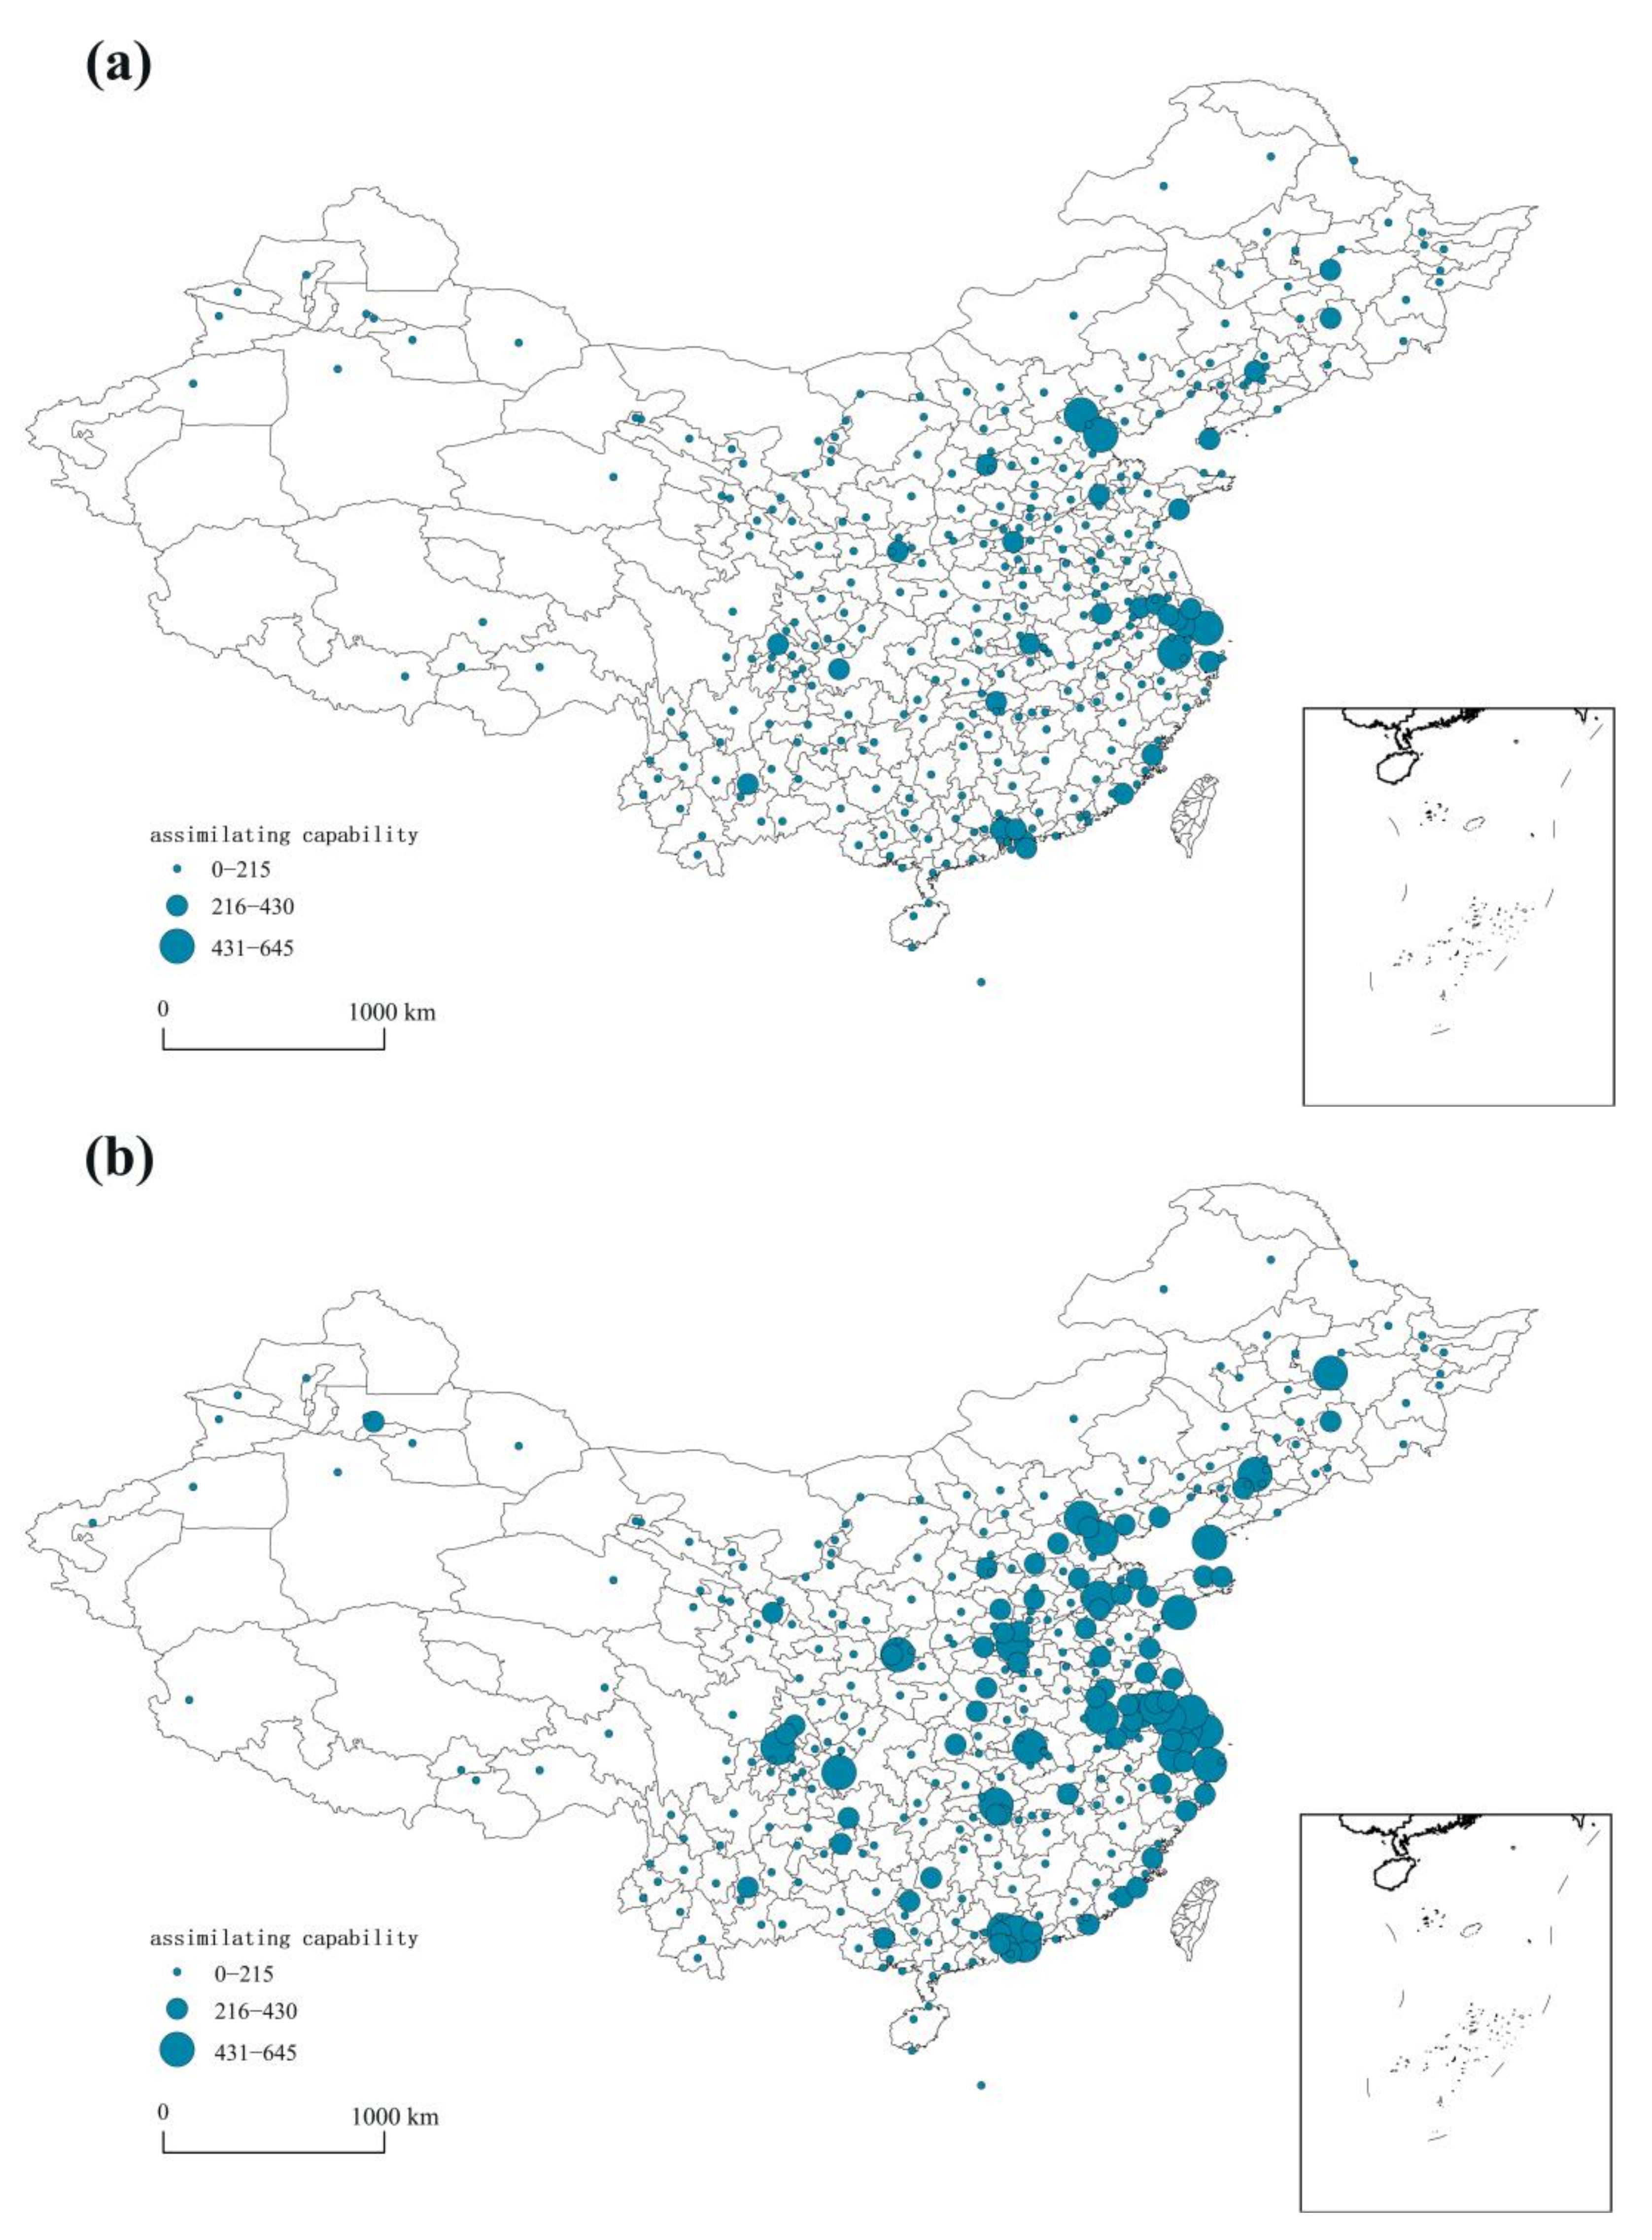
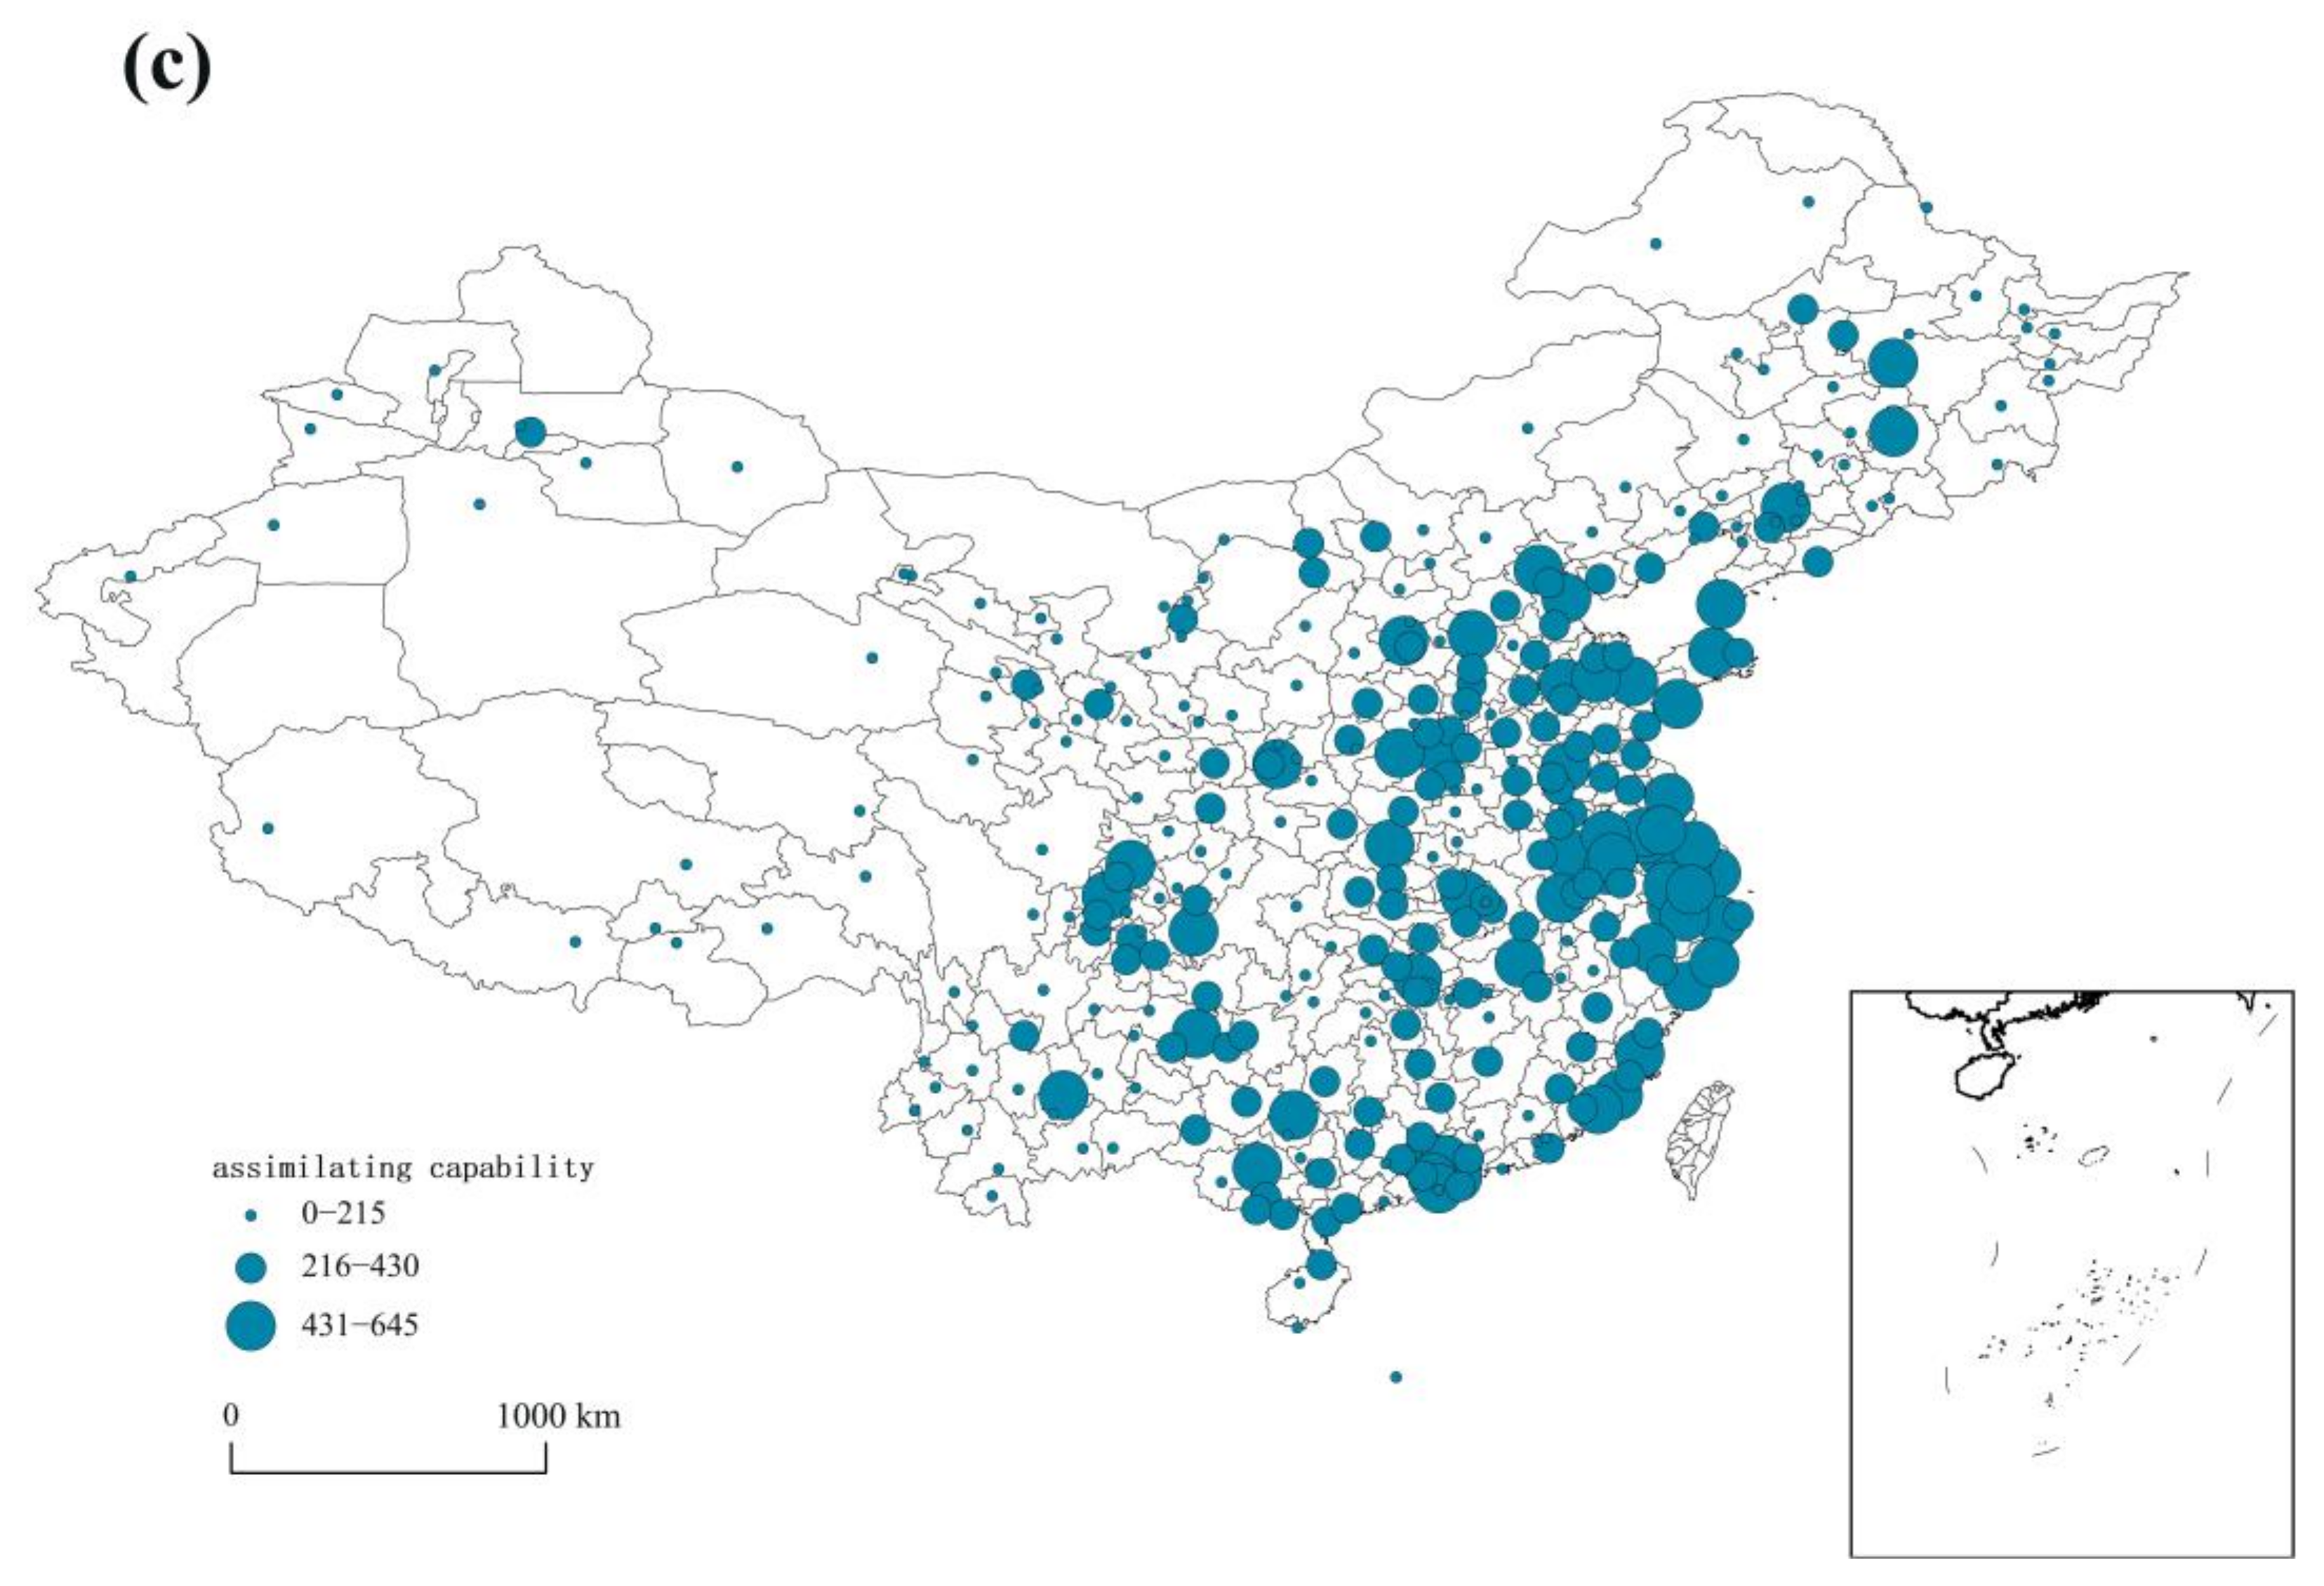
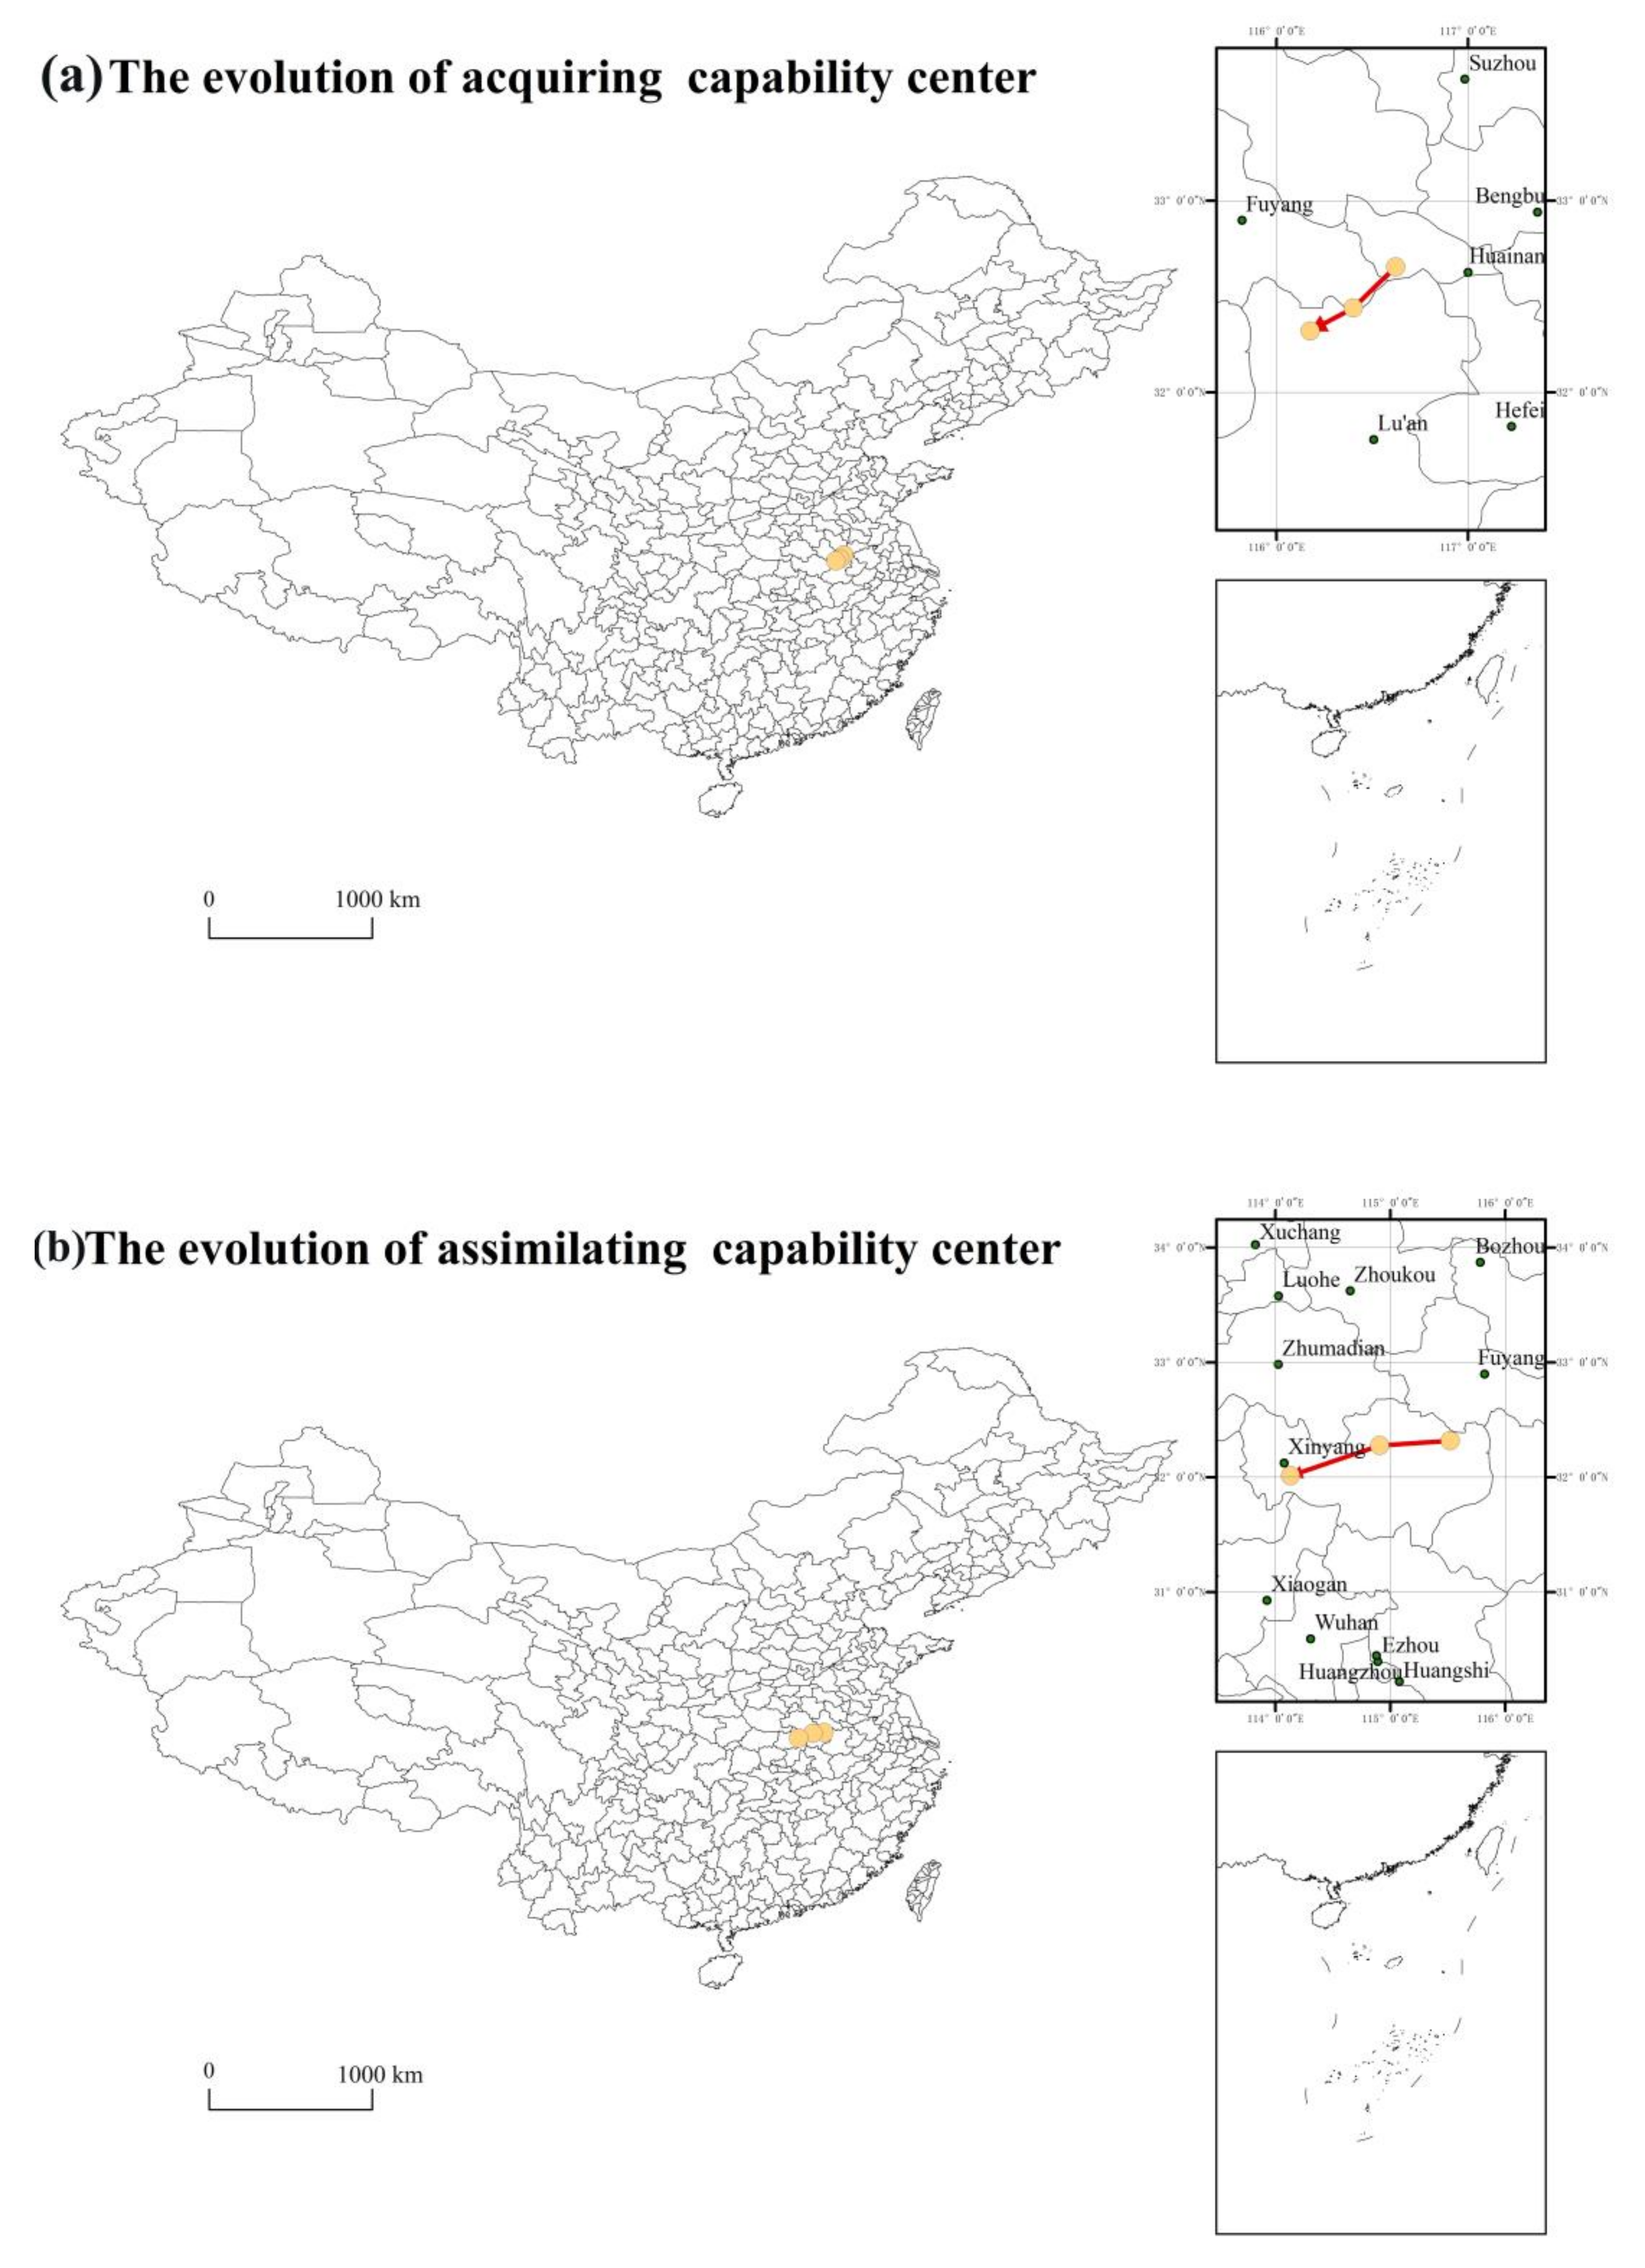
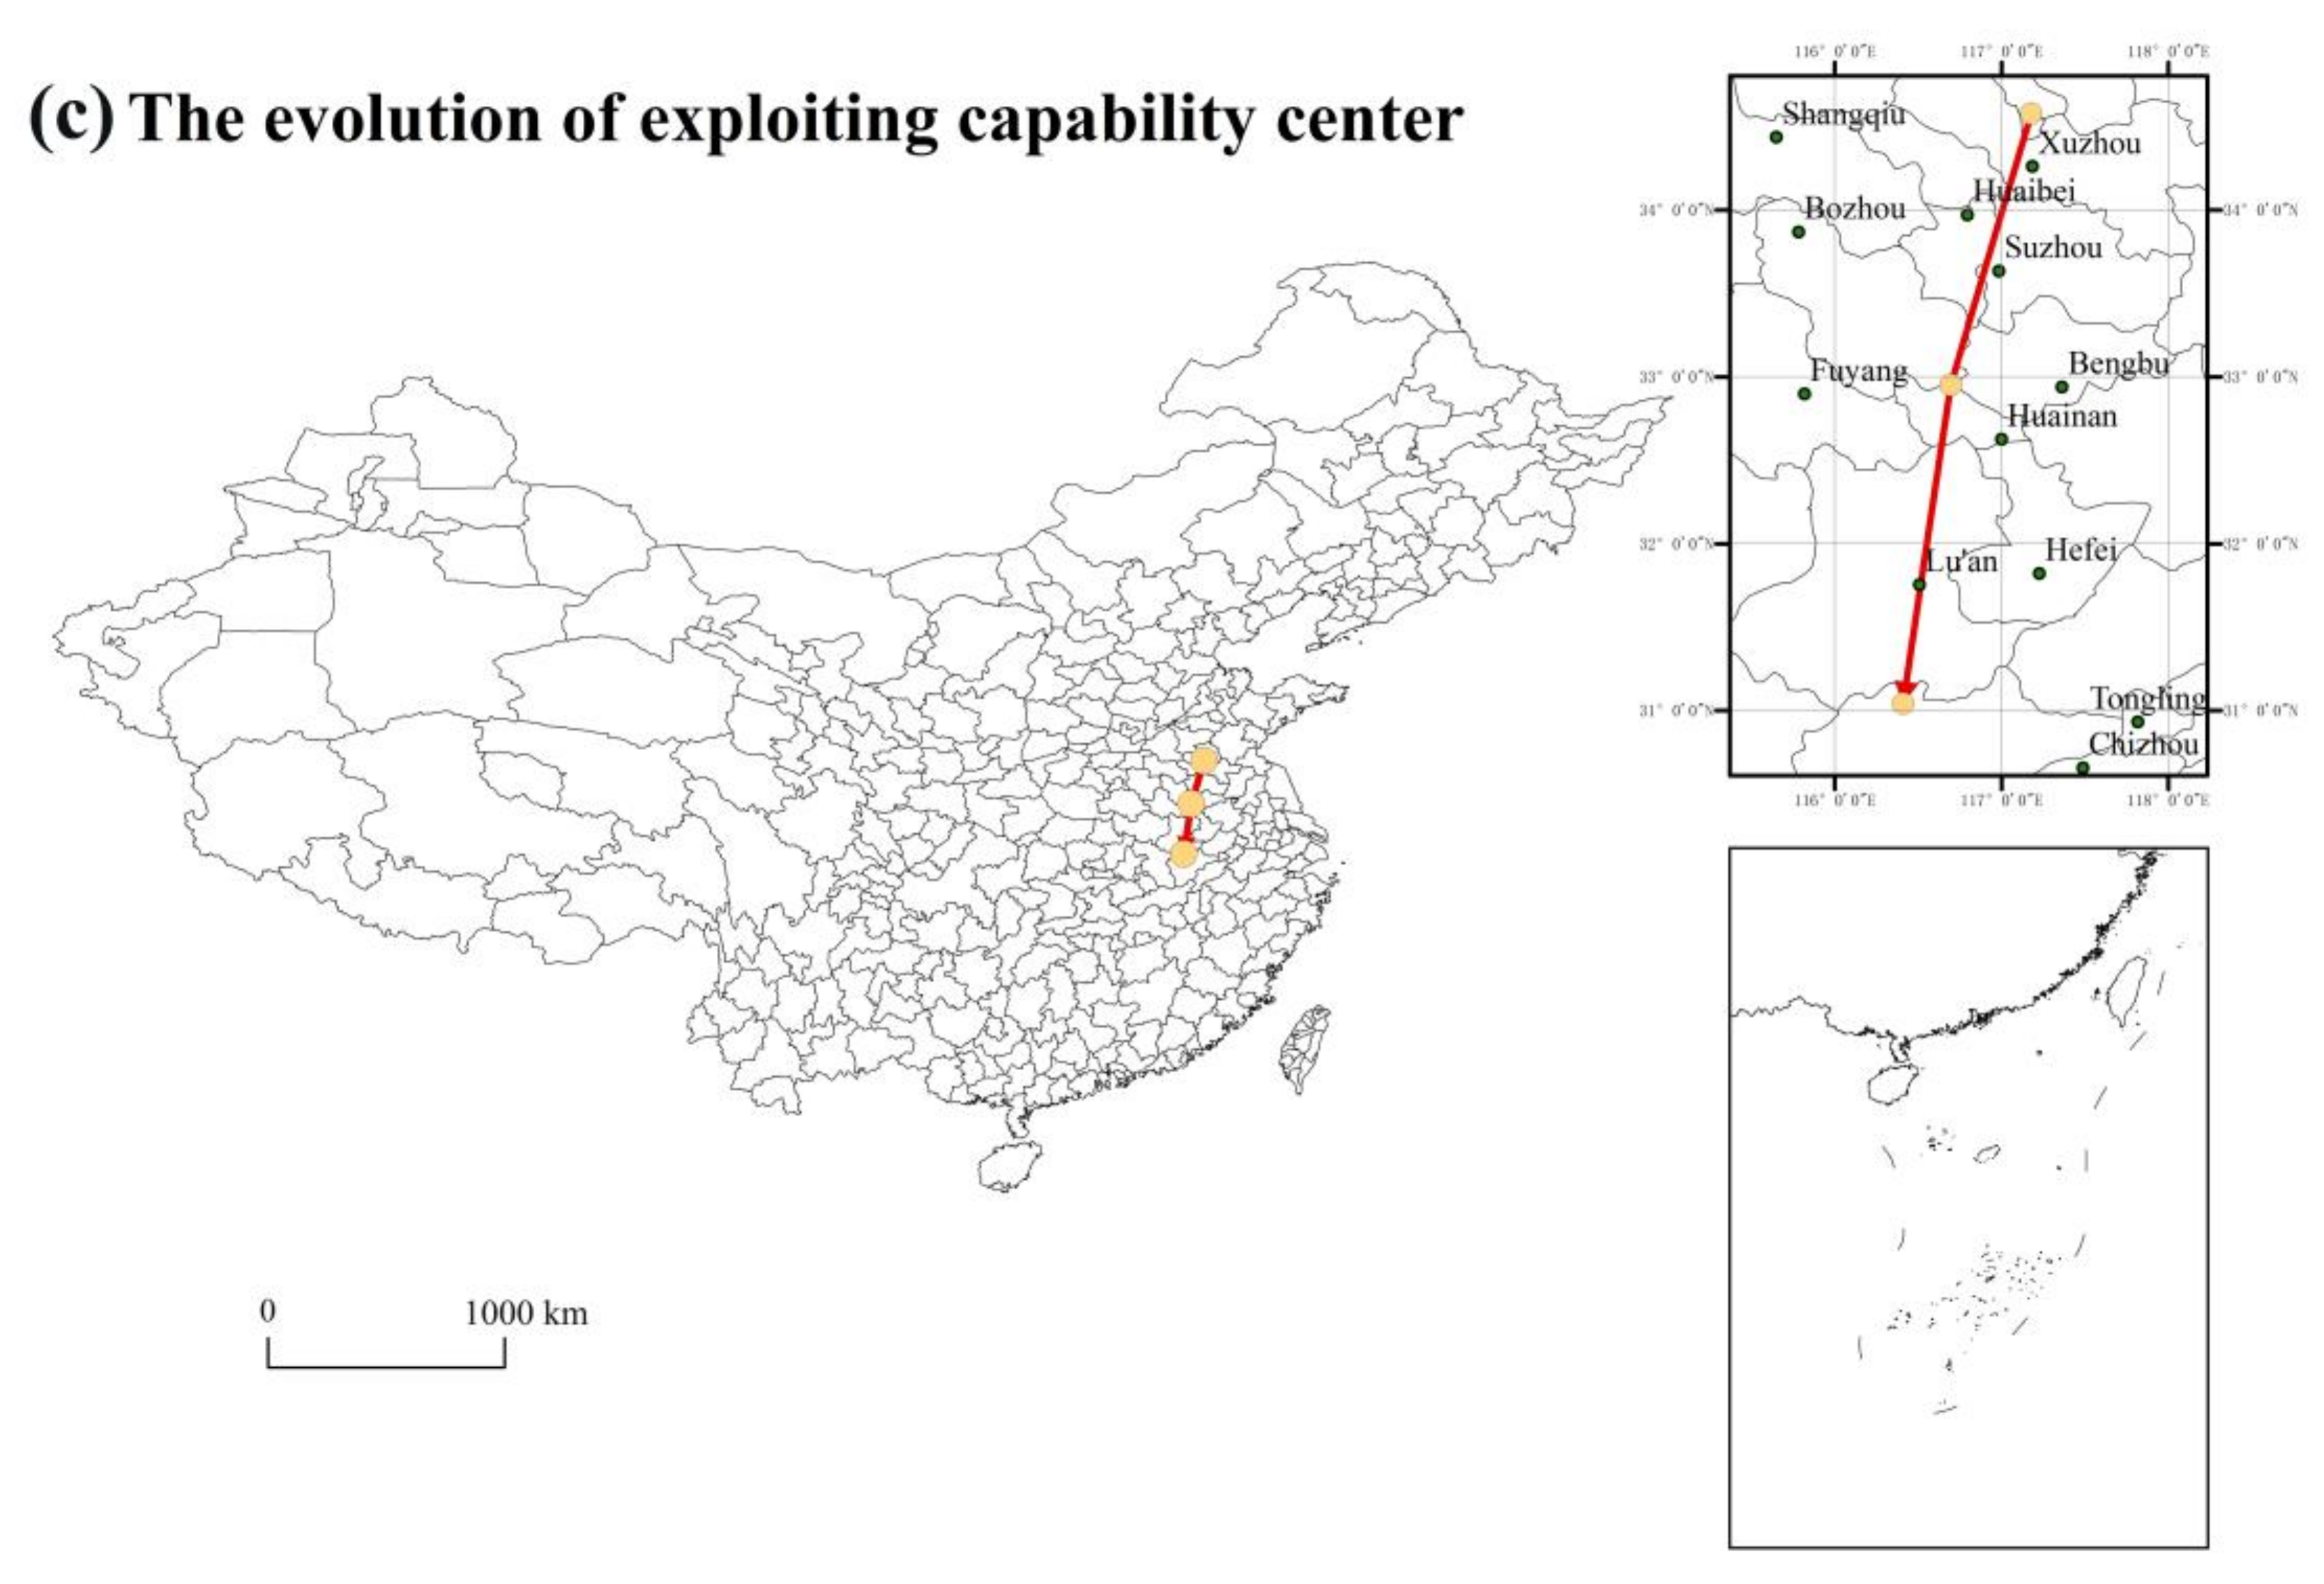
4.2. The Spatial Distribution of Multidimensional ACAP

From a resource-based point of view, an ACAP demonstrates capability whereby regions or cities take advantage of their resources to acquire, assimilate, and exploit external knowledge. These resources include the external knowledge pool, the relationship between “teacher” cities, and the channels that exist to exchange internalized knowledge for commercial benefits. Figure 3 shows the spatial distribution of the urban acquiring capability. The acquiring capability is represented by the node size. The directed lines in Figure 3 are the flow of external knowledge, and the colors and thickness of the lines represent the strength of the links between urban nodes. The strength here is determined by the number of the unidirectional links between two cities. Since the links between cities are bilateral, there are two lines between two cities. For a better visualization, we only keep directional lines with maximum strength. To simplify the graphs, lines with strength < 150 are removed from the maps.
In terms of the acquiring capability, a growing proportion of cities spontaneously sought knowledge from the outside world (Figure 3). In the period of T1 (see panel (a)), 290 cities sought an external knowledge pool for learning. However, all cities except Beijing showed relatively weak acquiring capabilities. Beijing is the converging center of knowledge flows, with a stronger acquiring capability. In the period of T2 (see panel (b)), a great number of cities joined in seeking a knowledge pool and functional differentiation was gradually generated. Beijing, Shanghai, and Shenzhen are leaders in the acquiring capability. Beijing is still the converging center of external knowledge. Unsurprisingly, Beijing shows the strongest willingness to acquire knowledge for across the whole of China. Not only is Beijing the capital of economy and politics but Beijing is also the choice location for the headquarters of many large domestic and foreign companies (e.g., Sinopec) and institutes (e.g., Chinese Academia of Science). In the Yangtze River Delta, with strong acquiring capabilities, Shanghai shoulders the task of providing knowledge to other cities, mainly Beijing, Shenzhen, and neighbor cities such as Suzhou (Jiangsu province). Similar to Shanghai, Shenzhen also relays knowledge to Beijing and neighboring cities such as Dongguan and Guangzhou. In T3 (panel (c)), 329 cities made efforts to acquire external knowledge. In other words, almost all cities strive to acquire external knowledge for development. Noticeably, the maximum strength of the links fell from 28,818 (Shenzhen to Beijing) to 14,205 (Shanghai to Beijing) between T2 and T3. The channels (edges) of knowledge acquirement increased from 35,135 to 41,754 since T2. The spatial pattern of acquiring capability shows the tendency to decentralize, which indicates that traditional cities with a strong acquiring capability plateau or even weaken. Shanghai is a clear example. In T1, Shanghai was in the early stages of knowledge acquirement. Then, Shanghai reached its peak in T2, citing 86,008 patents and having the closest links to Beijing (23,025). In T3, the acquiring capability of Shanghai dropped to 61,056, and the strongest link was with Beijing (14,205). Although the acquiring capability of Shanghai decreased, the acquiring capability of neighboring cities grew. In the Yangtze River Delta Economic Area, 9 cities were in the third or second tiers of acquiring capability in T2, while the number of cities is at 12 in T3.
Figure 4 shows the evolutionary pattern of the urban assimilating capability. Overall, the urban assimilating capability has gradually increased since T1 (panel (a)). The number of cities with diversity (diversity > 0) increased from 320 to 335 between T1 and T3, which means that, to some extent, almost all cities have an assimilating capability. Shanghai and Beijing are at the core of knowledge assimilation, and Shenzhen and Chengdu show promising potential for knowledge assimilation. Unlike the spatial distributing pattern of the acquiring capability, Shanghai has better knowledge assimilation than Beijing. Shanghai has the highest diversity in all three time periods. In T1, relatively few cities show strong assimilating capabilities. In T2 (panel (b)), a greater number of cities with stronger assimilating capabilities appear in the Chinese landscape. Alongside Beijing, Shanghai, and Shenzhen, the southwest core represented by Chengdu-Chongqing, the west core represented by Xi’an, and the middle core represented by Wuhan and Zhengzhou also showed potential to form urban clusters with assimilating capabilities. In T3 (panel (c)), the assimilating capability further increased and urban clusters gradually formed. For instance, within the Yangtze River Delta Economic Area, cities that were led by Shanghai showed the strongest assimilating capabilities.
Figure 5 shows the spatial distribution of the exploiting capability. The size of the nodes represents the strength of the exploiting capability, and the links represent the flows of internalized knowledge. Similarly, in Figure 5, we also preserved the strongest directed lines. To make the connections more visible, lines with a strength of <10 are removed. For a long time, the government and entrepreneurs sought a way to address the dilemma of improving the quality of patents as well as the quantity of patents, which corresponds with improving the exploiting capability of cities. As a result, accompanied by the champion of the “Mass Entrepreneurship and Innovation Initiative” proposed by the Chinese government, the exploiting capability rose dramatically. The size of networks increased from 136 in T1 to 319 in T3 (panel (a), panel (b), and panel (c)). Meanwhile, the edges increased from 477 to 8499 between T1 and T3. During the period of T1, the transaction activities were inactive. Beijing demonstrated a relatively higher exploiting capability. In contrast, in T3, Shenzhen surpassed Beijing and became the city with the strongest transforming capability. Shenzhen sells its technology to its neighbors and throughout the rest of China. In contrast with Beijing and Shanghai, which have a non-negligible proportion of prestigious universities and institutes, Shenzhen mainly relies on its vibrant private economy for its exploiting capability. The main cause of this phenomenon is that Shenzhen government gives priority to the advanced industries and enterprises. The government raised its industrial level from product processing to product manufacture, and then to product design. The exploiting capability is the final and most critical capability to transform internalized knowledge to products. Large companies such as HUAWEI and Zhongxing Telecom Equipment (ZTE), and numerous Small and medium enterprises (SMEs) all play a prominent role in cultivating the innovation atmosphere [48].
The centers of these three capabilities are shown in Figure 6. In T1, the center of the acquiring capability moves slightly towards the area southwest, from Huainan, Anhui, to Lu’an, Anhui (panel (a)). In T2, the center of the assimilating capability gradually moves from east Xinyang, Henan, to west Xinyang, Henan (panel (b)). Additionally, in T3, the center of the exploiting capability moves dramatically southward, from Xuzhou, Jiangsu, towards Anqing, Anhui (panel (c)). In comparison, the movements of the acquiring capability center and the assimilating center are relatively slight, while the center of the exploiting capability moves dramatically southward.

4.3. Regression Results

The regression results of the SDM are presented in Table 2. In all the models, geographical distance plays a significant role, and a spillover effect exists among the neighboring cities so that their innovation performance can also be improved.
In model 1, the two control variables significantly correlate with the innovative performance, which indicates that R&D personnel and R&D investment enact positive effects on innovation performance at the city level. In our model, people who work in and receive payment from research and development institutions represent human resources, and are an indicator of R&D personnel. For a city, the main actors of R&D activities are universities, institutes, firms, and the government. Additionally, human resources, especially the talents in these organizations, play a fundamental role in innovation performance. Our empirical results also show that R&D investments have a positive impact on innovation performance. The R&D investments contribute to long-term impacts on ACAP and innovation outputs [49]. As a control variable, the indicator of R&D investment proves that, when the R&D investment is limited, the capabilities of ACAP are crucial for success in models 2, 3, and 4.
In model 2, the variable acquirement i , t significantly stimulates regional innovation performance, indicating that the acquiring capability directly uplifts regional performance. The gatekeepers introduce external knowledge into the system, and the results show that cities can benefit from the high level of external knowledge acquired, although further action may be needed for the utilization of this knowledge. From model 3, we can see that the variable assimilation i , t has a significant positive impact on innovation performance. The assimilating capability is reflected by the diverse regional knowledge bases. In this model, diverse knowledge bases provide regions with more opportunities to internalize acquired knowledge and to prepare it for future use. In model 4, all three dimensions of the regional ACAP significantly simulate an innovation output. The results corroborate our hypothesis that all three capabilities can positively affect regional innovation performance. The exploiting capability provides economic benefits for regions, which provides the stimuli for R&D activities, which therefore means that innovation performance is upgraded.

5. Conclusions and Discussion

Based on the annul panel data of Chinese cities from 2004 to 2018, this paper constructed a dynamic framework of regional ACAP from a resource-based perspective. We define the regional ACAP in three dimensions, i.e., the acquiring capability, the assimilating capability, and the exploiting capability. The spatial distribution of the three dimensions of regional ACAP show different spatial patterns, where cities with strong capabilities are unevenly distributed across space. Beijing, shanghai, and Shenzhen present three different evolving modes with the capabilities of ACAP. Gradually, Chengdu has joined the “Richman’s club” within the “diamond” structure. In recent years, cities from the middle of China such as Wuhan, Hunan province, and Zhengzhou, Henan province, also grew rapidly, forming a pentagonal structure. Cities display different patterns with their capabilities. For Beijing and the surrounding cities, there exists mono-centricity. Beijing is the only center for all three capabilities that are far beyond neighboring cities like Tianjin, Shijiazhuang (the capital of Hebei province) and Taiyuan (the capital of Shanxi province). On the contrary, in the Yangtze River Delta Economic Development Zone, there exists a poly-centricity. Although Shanghai occupies the highest position in the area, Suzhou, Hangzhou, and other main cities of Zhejiang and Jiangsu province show a strong ACAP with the three dimensions, which agrees with the findings of Li regarding knowledge poly-centricity in the Yangtze River Delta megalopolis [50]. The three dimensions of ACAP demonstrated their unique characteristics. With regard to the acquiring capability, the center moved towards southwest China to a negligible extent. Similarly, the center of the assimilating capability moved slightly west, whereas the center of the exploiting capability moved sharply to the south and traversed two provincial borders, showing that southern cities (especially Shenzhen, Guangzhou, Hong Kong, etc.) have a growing potential to turn external knowledge into commercial profits. The regression results of SDM show that knowledge spillover effects exist. R&D personnel and R&D investment have positive impacts on urban innovation performance. All three dimensions of regional ACAP have a significant positive impacts on regional innovation performance.
Several policy recommendations can be derived from the empirical research, such as, the promotion of the innovation performance of cities for which elevating the ACAP of cities is one of the most effective methods. In order to improve ACAP, three dimensions can be enhanced. For recognizing capability and exploiting capability, the government needs to provide guidance to build the required “channels”, depending on the urban development foundation and innovation resources. For assimilating capability, the government needs to formulate policies to optimize local industrial structures. The initiatives should start with building regional R&D alliance, and then developing a more extensive “structure—function—network” relationship [51]. Chinese cities must not only import technology but should also produce technology themselves, represented in the evolution of the acquiring capability. For leading cities such as Beijing, Shanghai and Shenzhen, their acquiring capability is nearly saturated so they begin to export their knowledge to their neighbors and other less innovative cities. Therefore, for these cities, the domestic channels for knowledge cannot satisfy their own needs and international channels should be opened and expanded. For other cities such as Chengdu, Chongqing and Xi’an, although they have great potential to become the next center of innovation output, their ACAPs are not developed enough to assist with this objective. An emphasis for raising ACAPs should be placed on the local and regional market to provide further collaboration opportunities. There is still room to increase the acquiring capability in the domestic market and, usually, a domestic knowledge pool can be cost-effective for knowledge acquirement. For assimilating knowledge, cities actively broaden their knowledge bases and an increasing number of cities have almost all types of technologies, which means that they fulfill the primary step for quantitatively and qualitatively enriching their knowledge base. For most developing cities, stimulation may be rather efficient way to enlarge knowledge bases. Therefore, policy makers in these cities may induce MNCs and invest in local universities to incubate talents and thereby uplift assimilating capability. The correlation between exploiting capability and commercial profits means that rising cities strive to elevate their exploiting capabilities so that they can become more competitive through their innovation performance. To boost the exploiting capability, more channels that facilitate for selling technology and knowledge-intensive products can be developed by city governors. This paper contributes to the literature by conducting empirical studies on multi-dimensional ACAP at the urban level. Compared with firm-level ACAP, ACAP at the urban level depends more on the performance of organizations. The institutional environment can provide more extensive impacts. For cities outside of China, specific policies can be formulated based on the different development level of cities, to build the “structure-function-network” systems. However, other cities may have their own institutional context and economic development levels different from Chinese cities, and therefore, in special cases, a further investigation should be conducted. Some researchers considered the moderating effects of ACAP, which is not taken into consideration in this paper. Additionally, the way in which the three capabilities of regional ACAP influence one other has not yet been discussed. Research exploring whether they affect innovation performance separately following the time sequence or whether they work simultaneously could also be undertaken in the future. In this paper, Chinese cities were taken as our sample. In future studies, cities from multiple countries and different economic development levels could be taken into consideration.

Author Contributions

Conceptualization: M.J. and D.D.; methodology and data: M.J. and Q.G.; writing: M.J.; revision and editing: W.S. and C.H. All authors have read and agreed to the published version of the manuscript.

Funding

This research was funded by the Major Program of the National Social Science Foundation of China (No. 19ZDA087).

Conflicts of Interest

The authors declare no conflict of interest.

References

  1. Cohen, W.M.; Levinthal, D.A. Absorptive Capacity: A New Perspective on Learning and Innovation. Adm. Sci. Q. 1990, 35, 128–152. [Google Scholar] [CrossRef]
  2. Tang, Y.; Chen, Y.; Wang, K.; Xu, H.; Yi, X. An Analysis on the Spatial Effect of Absorptive Capacity on Regional Innovation Ability Based on Empirical Research in China. Sustainability 2020, 12, 3021. [Google Scholar] [CrossRef] [Green Version]
  3. Kallio, A.; Harmaakorpi, V.; Pihkala, T. Absorptive Capacity and Social Capital in Regional Innovation Systems: The Case of the Lahti Region in Finland. Urban Stud. 2010, 47, 303–319. [Google Scholar] [CrossRef]
  4. Soo, K.T. Innovation across cities. J. Reg. Sci. 2018, 58, 295–314. [Google Scholar] [CrossRef] [Green Version]
  5. Zeng, J.; Liu, Y.; Wang, R.; Zhan, P. Absorptive Capacity and Regional Innovation in China: An Analysis of Patent Applications, 2000–2015. Appl. Spat. Anal. Policy 2019, 12, 1031–1049. [Google Scholar] [CrossRef]
  6. Nooteboom, B.; Van Haverbeke, W.; Duysters, G.; Gilsing, V.; van den Oord, A. Optimal cognitive distance and absorptive capacity. Res. Policy 2007, 36, 1016–1034. [Google Scholar] [CrossRef] [Green Version]
  7. Thomas, R.; Wood, E. Innovation in tourism: Re-conceptualising and measuring the absorptive capacity of the hotel sector. Tour. Manag. 2014, 45, 39–48. [Google Scholar] [CrossRef]
  8. Giuliani, E. Cluster Absorptive Capacity: Why do Some Clusters Forge Ahead and Others Lag Behind? Eur. Urban Reg. Stud. 2005, 12, 269–288. [Google Scholar] [CrossRef]
  9. Kim, L. Crisis Construction and Organizational Learning: Capability Building in Catching-up at Hyundai Motor. Organ. Sci. 1998, 9, 506–521. [Google Scholar] [CrossRef] [Green Version]
  10. Abreu, M. Absorptive capacity in a regional context. In Handbook of Regional Innovation and Growth; Cooke, P., Asheim, B., Boschma, R., Martin, R., Schwartz, D., Todtling, F., Eds.; Edward Elgar: Cheltenham, UK, 2011; pp. 211–221. [Google Scholar]
  11. Agrawal, A.; Cockburn, I.; Rosell, C. Not Invented Here? Innovation in company towns. J. Urban Econ. 2010, 67, 78–89. [Google Scholar] [CrossRef] [Green Version]
  12. Freund, D.; Lee, R.; Tüselmann, H.; Cao, Q. International high-tech SMEs innovative foreign knowledge inflows: Effects of host country weak network ties and absorptive capacity. Multinatl. Bus. Rev. 2020, 28, 333–354. [Google Scholar] [CrossRef]
  13. Mowery, D.C.; Oxley, J.E. Inward technology transfer and competitiveness: The role of national innovation systems. Camb. J. Econ. 1995, 19, 67–93. [Google Scholar] [CrossRef]
  14. Roper, S.; Love, J.H. Innovation and regional absorptive capacity: The labour market dimension. Ann. Reg. Sci. 2006, 40, 437–447. [Google Scholar] [CrossRef] [Green Version]
  15. Giuliani, E.; Arza, V. What drives the formation of ‘valuable’ university–industry linkages?: Insights from the wine industry. Res. Policy 2009, 38, 906–921. [Google Scholar] [CrossRef]
  16. Gertler, M.S. Rules of the Game: The Place of Institutions in Regional Economic Change. Reg. Stud. 2010, 44, 1–15. [Google Scholar] [CrossRef]
  17. Sun, Y.; Cao, C. The evolving relations between government agencies of innovation policymaking in emerging economies: A policy network approach and its application to the Chinese case. Res. Policy 2018, 47, 592–605. [Google Scholar] [CrossRef]
  18. Schillaci, C.E.; Romano, M.; Nicotra, M. Territory’s Absorptive Capacity. Entrep. Res. J. 2013, 3, 109–126. [Google Scholar] [CrossRef] [Green Version]
  19. Etzkowitz, H. The Triple Helix: University-Industry-Government Innovation in Action; Routledge: London, UK, 2008; pp. 20–40. [Google Scholar]
  20. Hemert, P.V.; Iske, P.L. Framing knowledge-based urban development and absorptive capacity of urban regions: A case-study of Limburg, the Netherlands. Int. J. Knowl. Based Dev. 2015, 6, 314. [Google Scholar] [CrossRef]
  21. Leydesdorff, L.; Fritsch, M. Measuring the knowledge base of regional innovation systems in Germany in terms of a Triple Helix dynamics. Res. Policy 2006, 35, 1538–1553. [Google Scholar] [CrossRef] [Green Version]
  22. Castells, M. The Rise of the Network Society; Blackwell Publishers: Malden, MA, USA, 2000; pp. 407–460. [Google Scholar]
  23. Meijers, E. From Central Place to Network Model: Theory and Evidence of a Paradigm Change. Tijdschr. Econ. Soc. Ge. 2007, 98, 245–259. [Google Scholar] [CrossRef]
  24. Simmie, J.; Martin, R. The economic resilience of regions: Towards an evolutionary approach. Camb. J. Reg. Econ. Soc. 2010, 3, 27–43. [Google Scholar] [CrossRef] [Green Version]
  25. Boschma, R. Towards an Evolutionary Perspective on Regional Resilience. Reg. Stud. 2015, 49, 733–751. [Google Scholar] [CrossRef] [Green Version]
  26. Huggins, R.; Izushi, H.; Prokop, D. Regional advantage and the geography of networks: Explaining global-local knowledge sourcing patterns. Pap. Reg. Sci. 2019, 98, 1567–1584. [Google Scholar] [CrossRef]
  27. Boschma, R.A.; ter Wal, A.L.J. Knowledge Networks and Innovative Performance in an Industrial District: The Case of a Footwear District in the South of Italy. Ind. Innov. 2007, 14, 177–199. [Google Scholar] [CrossRef] [Green Version]
  28. Schmidt, T. Absorptive capacity-one size fits all? A firm-level analysis of absorptive capacity for different kinds of knowledge. Manag. Decis. Econ. 2010, 31, 1–18. [Google Scholar] [CrossRef] [Green Version]
  29. Martin, R.; Sunley, P. Path dependence and regional economic evolution. J. Econ. Geogr. 2006, 6, 395–437. [Google Scholar] [CrossRef]
  30. Teece, D.J.; Pisano, G.; Shuen, A. Dynamic capabilities and strategic management. Strateg. Manag. J. 1997, 18, 509–533. [Google Scholar] [CrossRef]
  31. Zahra, S.A.; George, G. Absorptive Capacity: A Review, Reconceptualization, and Extension. Acad. Manag. Rev. 2002, 27, 185–203. [Google Scholar] [CrossRef]
  32. Parada, M.J. Comment on “Territory’s Absorptive Capacity”. Entrep. Res. J. 2013, 3, 141–146. [Google Scholar] [CrossRef] [Green Version]
  33. Lane, P.J.; Koka, B.R.; Pathak, S. The reification of absorptive capacity: A critical review and rejuvenation of the construct. Acad. Manag. Rev. 2006, 31, 833–863. [Google Scholar] [CrossRef]
  34. Vasudeva, G.; Anand, J. Unpacking Absorptive Capacity: A Study of Knowledge Utilization from Alliance Portfolios. Acad. Manag. J. 2011, 54, 611–623. [Google Scholar] [CrossRef]
  35. Binder, P. Impacts of network relationships on absorptive capacity in the context of innovation. Serv. Ind. J. 2020, 40, 1–29. [Google Scholar] [CrossRef]
  36. Laasonen, V.; Kolehmainen, J. Capabilities in knowledge-based regional development—Towards a dynamic framework. Eur. Plan. Stud. 2017, 25, 1673–1692. [Google Scholar] [CrossRef] [Green Version]
  37. Qian, H.; Jung, H. Solving the knowledge filter puzzle: Absorptive capacity, entrepreneurship and regional development. Small Bus. Econ. 2017, 48, 99–114. [Google Scholar] [CrossRef]
  38. Caragliu, A.; Nijkamp, P. The impact of regional absorptive capacity on spatial knowledge spillovers: The Cohen and Levinthal model revisited. Appl. Econ. 2012, 44, 1363–1374. [Google Scholar] [CrossRef]
  39. Miguélez, E.; Moreno, R. Knowledge flows and the absorptive capacity of regions. Res. Policy 2015, 44, 833–848. [Google Scholar] [CrossRef]
  40. Stock, G.N.; Greis, N.P.; Fischer, W.A. Absorptive capacity and new product development. J. High. Technol. Manag. Res. 2001, 12, 77–91. [Google Scholar] [CrossRef]
  41. Todorova, G.; Durisin, B. Absorptive capacity: Valuing a reconceptualization. Acad. Manag. Rev. 2007, 32, 774–786. [Google Scholar] [CrossRef]
  42. Huggins, R.; Thompson, P. Networks and regional economic growth: A spatial analysis of knowledge ties. Environ. Plan. A 2017, 49, 1247–1265. [Google Scholar] [CrossRef] [Green Version]
  43. Asheim, B.T.; Coenen, L. Knowledge bases and regional innovation systems: Comparing Nordic clusters. Res. Policy 2005, 34, 1173–1190. [Google Scholar] [CrossRef]
  44. Mancusi, M.L. International spillovers and absorptive capacity: A cross-country cross-sector analysis based on patents and citations. J. Int. Econ. 2008, 76, 155–165. [Google Scholar] [CrossRef]
  45. Mukherji, N.; Silberman, J. Absorptive Capacity, Knowledge Flows, and Innovation in U.S. Metropolitan Areas. J. Reg. Sci. 2013, 53, 392–417. [Google Scholar] [CrossRef]
  46. Lane, P.J.; Lubatkin, M. Relative absorptive capacity and interorganizational learning. Strateg. Manag. J. 1998, 19, 461–477. [Google Scholar] [CrossRef]
  47. Yang, C.; Lin, H. Openness, Absorptive Capacity, and Regional Innovation in China. Environ. Plan. A Econ. Space 2012, 44, 333–355. [Google Scholar] [CrossRef]
  48. Fan, P. Innovation, Globalization, and Catch-Up of Latecomers: Cases of Chinese Telecom Firms. Environ. Plan. A Econ. Space 2011, 43, 830–849. [Google Scholar] [CrossRef]
  49. Tsai, W. Knowledge Transfer in Intraorganizational Networks: Effects of Network Position and Absorptive Capacity on Business Unit Innovation and Performance. Acad. Manag. J. 2001, 44, 996–1004. [Google Scholar] [CrossRef]
  50. Li, Y.; Phelps, N.A. Knowledge polycentricity and the evolving Yangtze River Delta megalopolis. Reg. Stud. 2017, 51, 1035–1047. [Google Scholar] [CrossRef]
  51. Duan, D.; Xia, Q. Evolution of scientific collaboration on COVID-19: A bibliometric analysis. Learn. Publ. 2021, 34, 429–441. [Google Scholar] [CrossRef]
Figure 1. The framework of a regional ACAP.
Sustainability 13 11460 g001
Figure 2. The distribution of Chinese urban patent applications. (a) The spatial distribution of patent applications for cities in 2004. (b) The spatial distribution of patent applications for cities in 2011. (c) The spatial distribution of patent applications for cities in 2018.
Sustainability 13 11460 g002aSustainability 13 11460 g002b
Figure 3. The spatiotemporal distribution of the acquiring capability. (a) The spatial distribution of the acquiring capability in 2004–2008. (b) The spatial distribution of the acquiring capability in 2009–2013. (c) The spatial distribution of the acquiring capability in 2014–2018.
Sustainability 13 11460 g003aSustainability 13 11460 g003b
Figure 4. The spatiotemporal distribution of the assimilating capability. (a) The spatial distribution of the assimilating capability in 2004–2008. (b) The spatial distribution of the assimilating capability in 2009–2013. (c) The spatial distribution of the assimilating capability in 2014–2018.
Sustainability 13 11460 g004aSustainability 13 11460 g004b
Figure 5. The spatiotemporal distribution of the exploiting capability. (a) The spatial distribution of the exploiting capability in 2004–2008. (b) The spatial distribution of the exploiting capability in 2009–2013. (c) The spatial distribution of the exploiting capability in 2014–2018.
Sustainability 13 11460 g005aSustainability 13 11460 g005b
Figure 6. The centers of the three capabilities. (a) The movement of the acquiring capability center. (b) The movement of the assimilating capability center. (c) The movement of the exploiting capability center.
Sustainability 13 11460 g006aSustainability 13 11460 g006b
Table 1. The introduction of variables.
VariablesStyleDefinitionData Sources
y i , t Dependent VariableThe number of patent applications for city i in year tChina City Statistical Yearbook
acquirement i , t Independent VariableThe number of patent citations for city i in year tSIPO
assimilation i , t Independent VariableThe diverse technologies for city i in year tSIPO
exploitation i , t Independent VariableThe number of patent transactions for city i in year tSIPO
R & D _ P i , t Control VariablePeople who work in and receive payment from research and development institutions.China City Statistical Yearbook
R & D _ I i , t Control VariableAll actual expenditures made for R&D in the reference period.China City Statistical Yearbook
Table 2. Results of SDM.
VariablesModel 1Model 2Model 3Model 4
acquirement i , t 0.300 ***0.285 ***0.334 ***
(0.022)(0.022)(0.019)
assimilation i , t 3.815 ***7.150 ***
(0.826)(0.715)
exploitation i , t 13.906 ***
(0.392)
R & D _ P i , t 0.138 ***0.128 ***0.131 ***0.097 ***
(0.004)(0.004)(0.004)(0.004)
R & D _ I i , t 0.382 ***0.328 ***0.309 ***0.140 ***
(0.015)(0.015)(0.016)(0.014)
W
y i , t 0.237 ***0.261 ***0.136 ***0.061 *
(0.030)(0.029)(0.040)(0.034)
number of obs3654365436543654
pseudo R20.7180.7390.7440.831
log likelihood(-)30,22030,13030,12029,580
chi2(1)62.4779.7611.663.17
prob > chi20.0000.0000.0010.075
Note: * p < 0.1, and *** p < 0.01.
Publisher’s Note: MDPI stays neutral with regard to jurisdictional claims in published maps and institutional affiliations.

