
A Framework to Evaluate the SDG Contribution of Fluvial Nature-Based Solutions

 ,
, 
Abstract
:1. Introduction
- (a)
- Creating a set of fluvial flooding indicators that reflect the interactions of NBSs for FFRM projects with societal, environmental, economic, policy, and technical perspectives;
- (b)
- Establishing a link between the set of fluvial flooding indicators and the SDG indicators;
- (c)
- Testing the fluvial flooding indicators by selecting a specific case study with the necessary project metadata.
2. Methodology
2.1. The Sustainability Performance Evaluation Framework
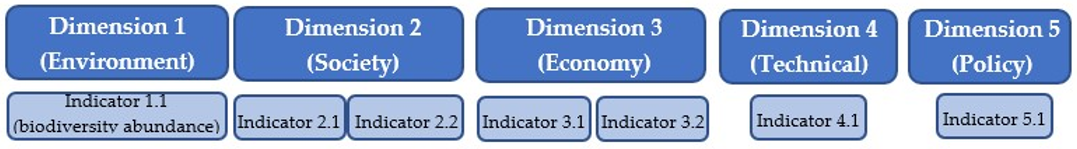
2.2. Step I—Definition of Dimensions and Fluvial Flooding Indicators
- The main objective of the NBSs should be fluvial flood risk mitigation;
- Coverage of different geographical regions and scales;
- Availability of documentation (language, type, and number);
- Accessibility to relevant data, information, documentation;
- Availability of grey literature relevant to the case studies, to be used as an additional source of information, including published articles and videos.
- (i)
- Collecting existing indicators from literature. The collection of indicators comes from the 7 frameworks reviewed for the dimensions. However, starting with the already identified frameworks and using snowballing techniques, three additional frameworks were identified that also revealed additional indicators [23,49,50].
- (ii)
- Using the indicators derived from (i) in analyzing the three case studies (Table 1), chosen to reflect a reasonable geographical coverage, spread in surface and in geomorphological aspects and with enough information at hand to quantify the indicators. In this process, the case studies gave rise to several new indicators that were not included in Step (i).
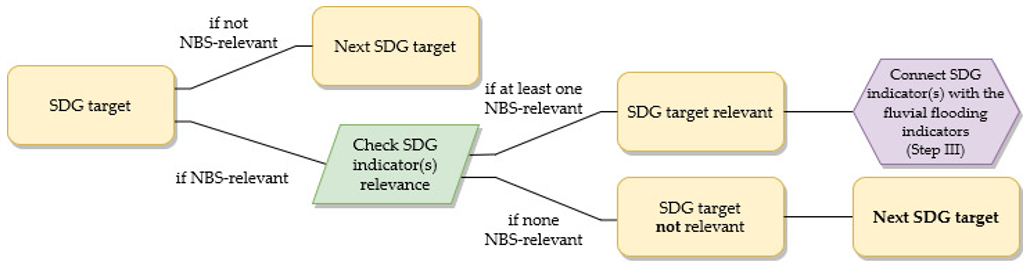
2.3. Step II—Selection of Relevant SDG Targets and SDG Indicators
2.4. Step III—Connection of the SDG Indicators with the Fluvial Flooding Indicators
2.5. Step IV—Assessment of the Fluvial Flooding Indicators Based on Project Metadata
3. Results
3.1. Step I—Definition of Dimensions and Fluvial Flooding Indicators
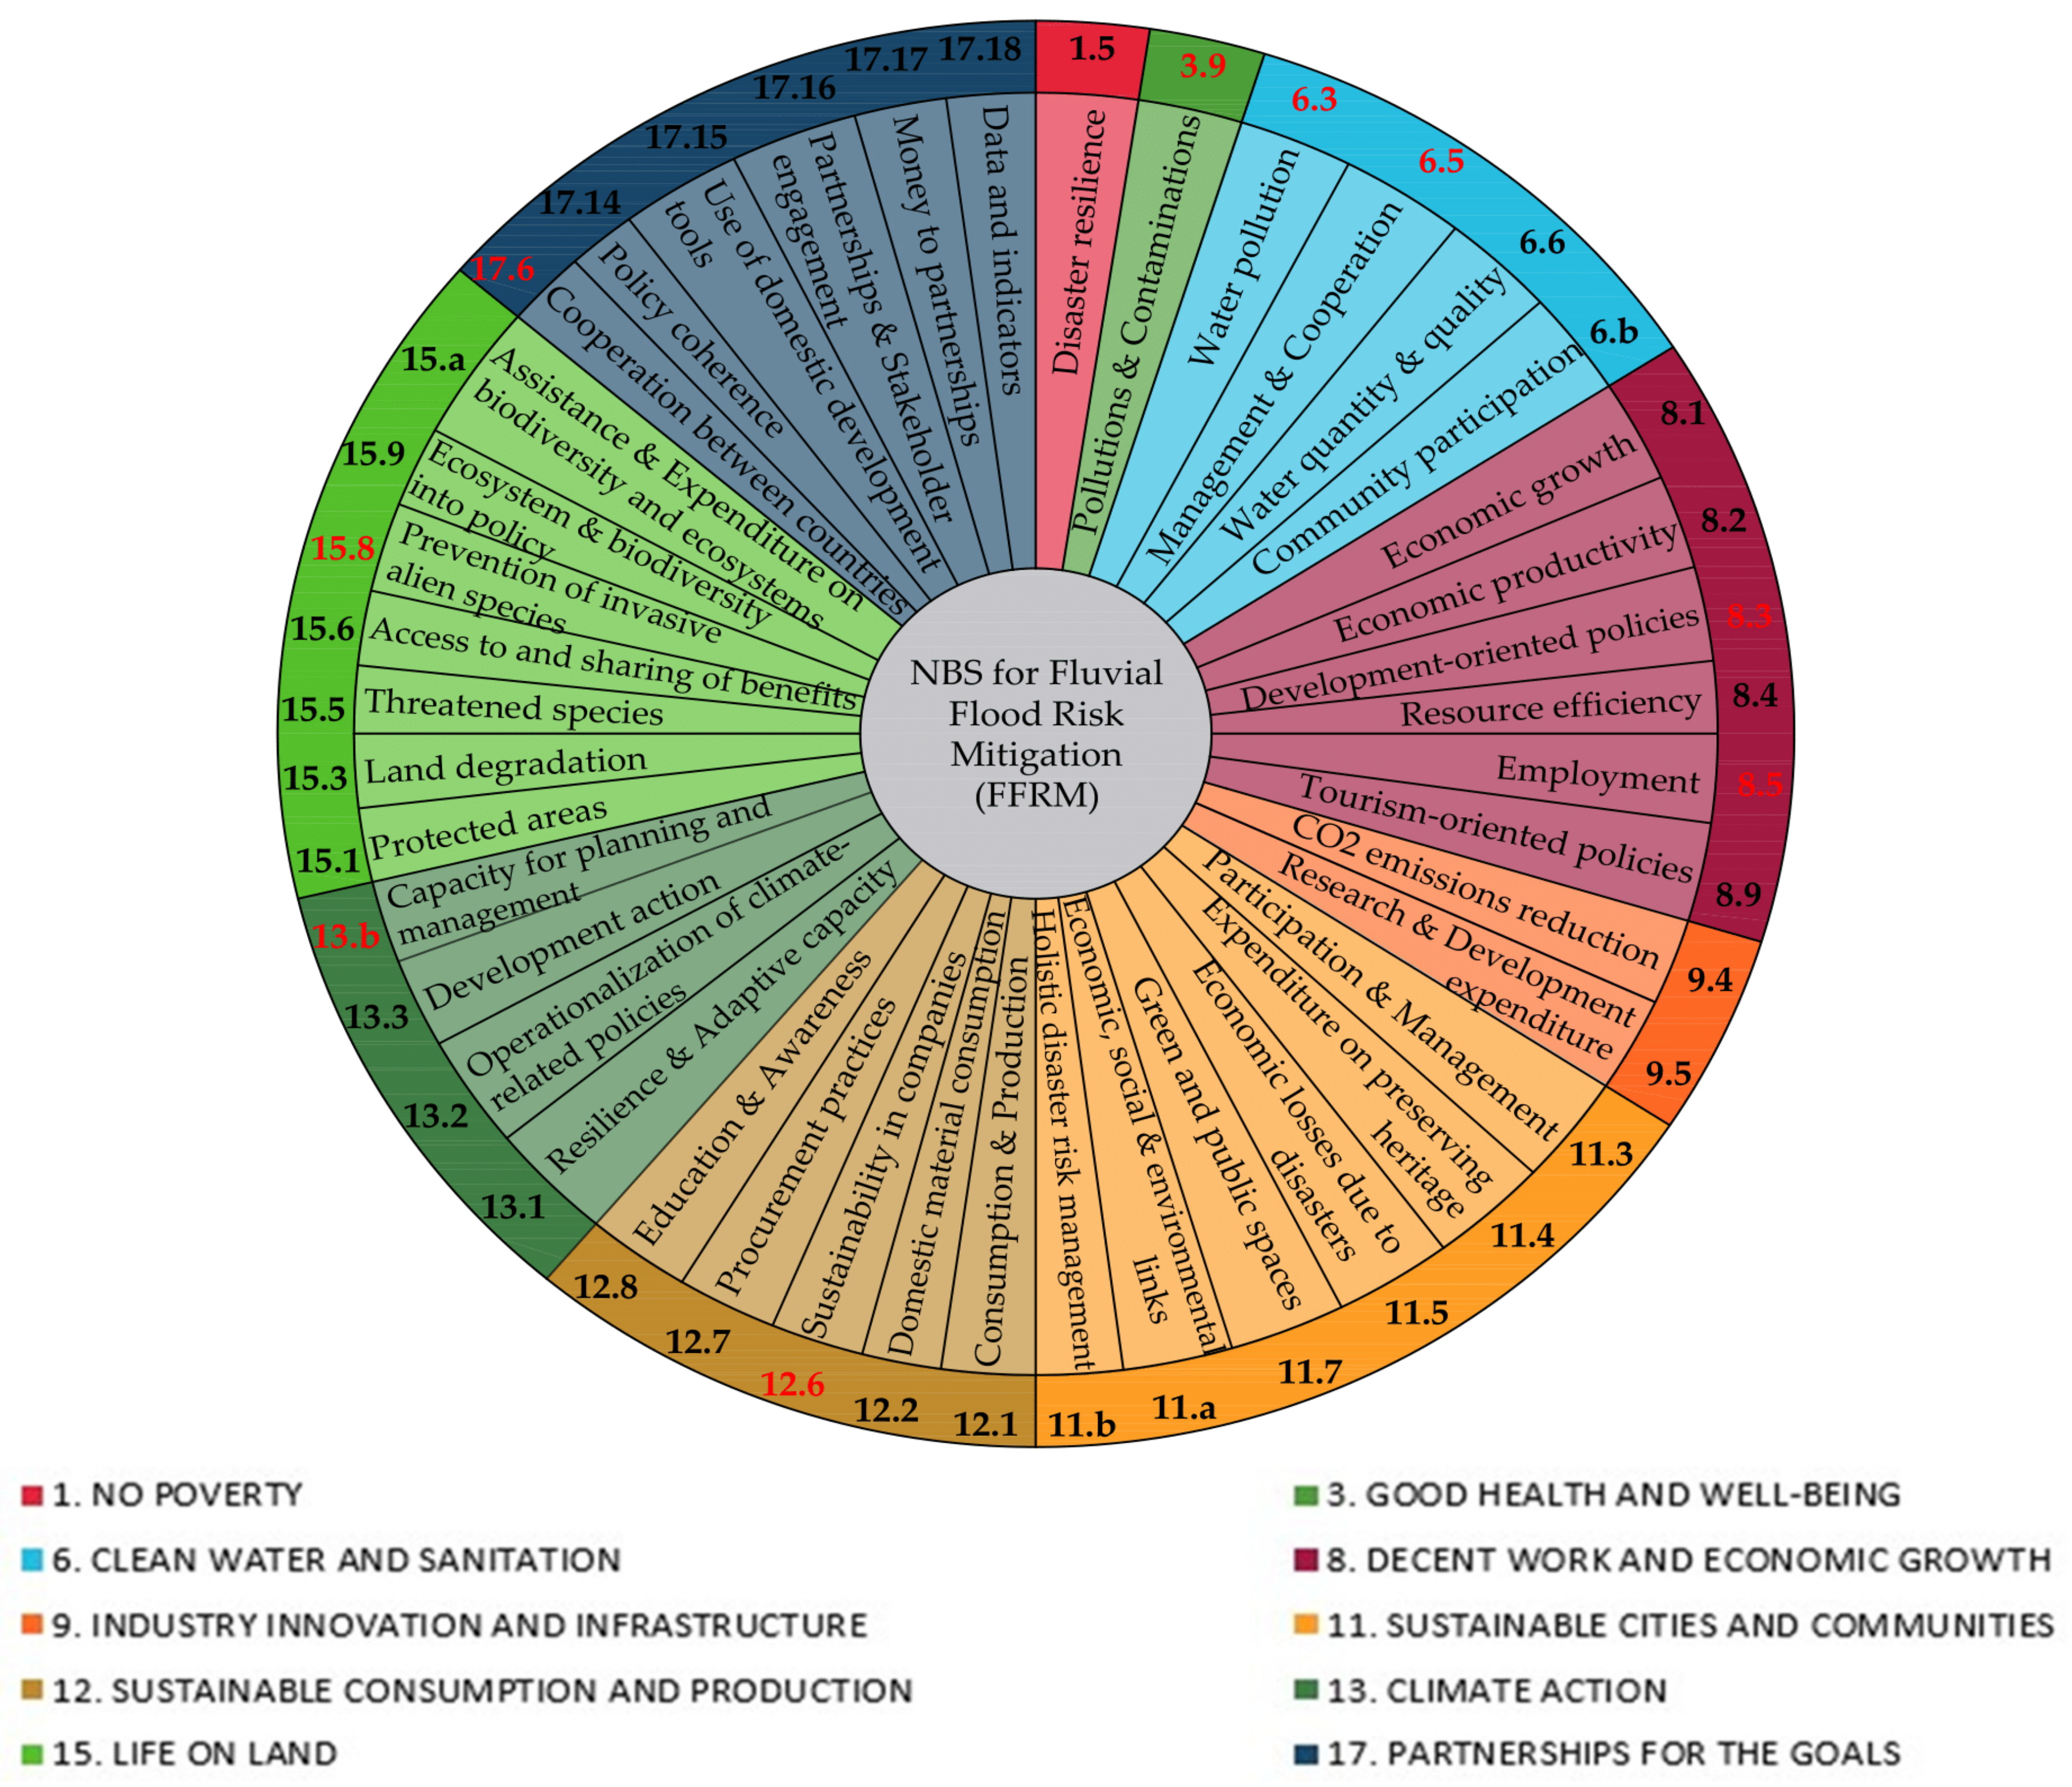
3.2. Step II—Selection of Relevant SDG Targets and SDG Indicators
3.3. Step III—Connection of the SDG Indicators with the Fluvial Flooding Indicators
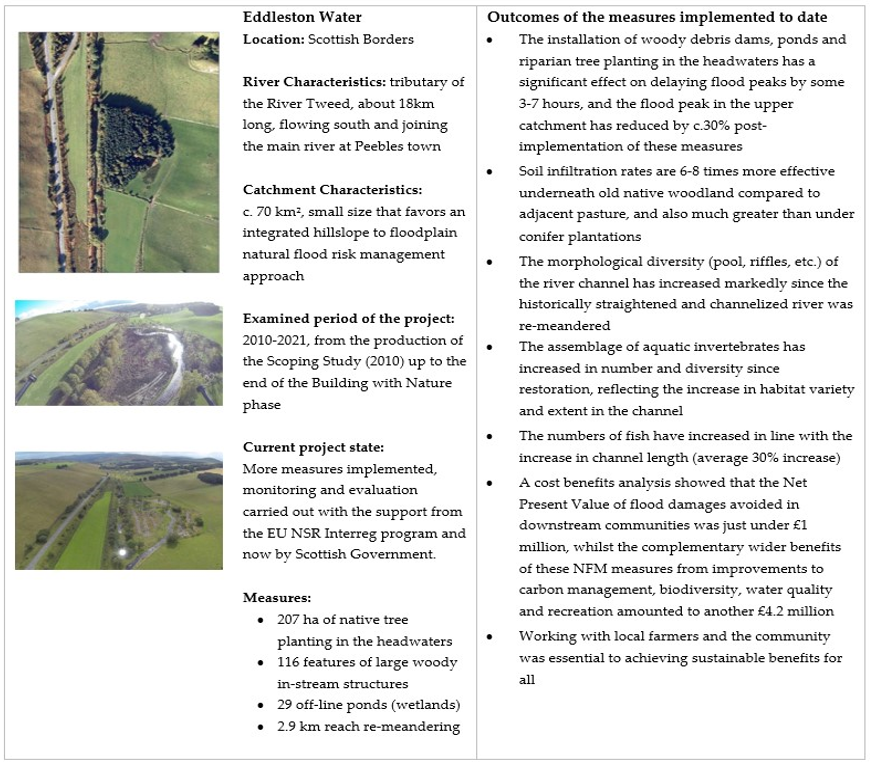
3.4. Case Study: The Eddleston Water Project
3.5. Step IV—Assessment of the Fluvial Flooding Indicators Based on Project Metadata
- Whether the Eddleston Water Project contributes to the attainment of the SDGs, and, if so;
- To which SDGs;
- How and why.
4. Discussion
4.1. Regarding the Framework Itself: From Structure to Output
4.2. How Do the Outcomes of Our Framework Relate to Other Relevant Studies?
4.3. Standardization and Scale of Sustainability Assessments
5. Conclusions
- The Sustainability Performance Evaluation Framework can systematically consider SDG indicators by exploring potential interactions of NBSs for FFRM projects within five chosen dimensions: economy, environment, society, policy, and technical.
- Through the Sustainability Performance Evaluation Framework, it is possible to adjust the SDG concept to the system of interest and qualitatively measure its alignment with and progress towards the SDGs.
- Data availability and accessibility play a crucial role in the Sustainability Performance Evaluation Framework. Although potentially challenging in some situations, many NBSs programs and projects have been funded by the European Union (EU) or national governments and agencies, and data are typically available either publicly or upon request.
- Application to projects where quantified targets pre-exist would help enable the derivation of some form of scored evaluation.
- Application to different case studies in terms of scale, location, and type of measures (e.g., projects in upland rivers and transboundary projects) is suggested.
- Application to case studies in countries with upper-middle, lower-middle, and low-income economies, with different cultural contexts, legal frameworks, governance structures, challenges of environmental justice, and data scarcity would add value. This recommendation, combined with the previous one, would also shed light on the potentials of the proposed indicators to be standardized.
- Application with end-users, stakeholders, or even people unfamiliar with NBSs and SDGs, to examine whether the framework would yield the same indicators and/or the same result regarding the evaluation of the NBSs project (regarding its contribution to the SDGs).
Author Contributions
Funding
Institutional Review Board Statement
Informed Consent Statement
Data Availability Statement
Acknowledgments
Conflicts of Interest
Appendix A. Data Availability and Accessibility for the Eddleston Water Project
References
- UN. The Human Cost of Weather-Related Disasters. Available online: https://www.unisdr.org/files/46796_cop21weatherdisastersreport2015.pdf (accessed on 26 July 2021).
- PBL Netherlands Environmental Assessment Agency. Scientific Justification of the Information Produced for the Chapter ‘Flooding’ of ‘The Geography of Future Water Challenges’. 2018. Available online: https://www.pbl.nl/sites/default/files/downloads/pbl-2018-the-geography-of-future-water-challenges-river-flood-risk_3147.pdf (accessed on 9 October 2021).
- Best, J. Anthropogenic stresses on the world’s big rivers. Nat. Geosci. 2019, 12, 7–21. [Google Scholar] [CrossRef]
- Global Indicator Framework for the Sustainable Development Goals and Targets of the 2030 Agenda for Sustainable Development. Available online: https://unstats.un.org/sdgs/indicators/Global%20Indicator%20Framework%20after%202021%20refinement_Eng.pdf (accessed on 27 July 2021).
- Nature-Based Solutions for Climate Change, People and Biodiversity. Available online: https://www.gla.ac.uk/media/Media_790171_smxx.pdf (accessed on 9 October 2021).
- Debele, S.E.; Kumar, P.; Sahani, J.; Marti-Cardona, B.; Mickovski, S.B.; Leo, L.S.; Porcu, F.; Bertini, F.; Montesi, D.; Vojinovic, Z.; et al. Nature-based solutions for hydro-meteorological hazards: Revised concepts, classification schemes and databases. Environ. Res. 2019, 179, 108799. [Google Scholar] [CrossRef] [PubMed]
- Nature-Based Solutions in Europe: Policy, Knowledge and Practice for Climate-Change Adaptation and Disaster Risk Reduction. Available online: https://www.eea.europa.eu/publications/nature-based-solutions-in-europe (accessed on 26 July 2021).
- Nature-based Solutions for Climate Change in the UK: A Report by the British Ecological Society. Available online: https://www.iucn-uk-peatlandprogramme.org/sites/default/files/2021-05/NbS-Report-Final-Designed.pdf (accessed on 9 October 2021).
- Schröter, B.; Zingraff-Hamed, A.; Ott, E.; Huang, J.; Hüesker, F.; Nicolas, C.; Schröder, N.J.S. The knowledge transfer potential of online data pools on Nature-based Solutions. Sci. Total.Environ. 2020, 762, 143074. [Google Scholar] [CrossRef]
- Kumar, P.; Debele, S.E.; Sahani, J.; Aragão, L.; Barisani, F.; Basu, B.; Bucchignani, E.; Charizopoulus, N.; Di Sabatino, S.; Domeneghetti, A. Towards an operationalisation of nature-based solutions for natural hazards. Sci. Total.Environ. 2020, 731, 138855. [Google Scholar] [CrossRef]
- Ruangpan, L.; Vojinovic, Z.; Plavšić, J.; Doong, D.J.; Bahlmann, T.; Alves, A.; Tseng, L.-H.; Randelovic, A.; Todorovic, A.; Kocic, Z. Incorporating stakeholders’ preferences into a multi-criteria framework for planning large-scale Nature-Based Solutions. Ambio 2020, 50, 1514–1531. [Google Scholar]
- Shah, M.A.R.; Renaud, F.G.; Anderson, C.C.; Wild, A.; Domeneghetti, A.; Polderman, A.; Votsis, A.; Pulvirenti, B.; Basu, B.; Thomson, C. A review of hydro-meteorological hazard, vulnerability, and risk assessment frameworks and indicators in the context of nature-based solutions. Int. J. Disaster Risk Reduct. 2020, 50, 101728. [Google Scholar] [CrossRef]
- Albert, C.; Brillinger, M.; Guerrero, P.; Gottwald, S.; Henze, J.; Schmidt, S.; Ott, E.; Schröter, B. Planning nature-based solutions: Principles, steps, and insights. Ambio 2020, 50, 1446–1461. [Google Scholar] [CrossRef] [PubMed]
- Calliari, E.; Staccione, A.; Mysiak, J. An assessment framework for climate-proof nature-based solutions. Sci. Total. Environ. 2019, 656, 691–700. [Google Scholar] [CrossRef]
- Nesshöver, C.; Assmuth, T.; Irvine, K.N.; Rusch, G.M.; Waylen, K.A.; Delbaere, B.; Hasse, D.; Jones-Walters, L.; Keune, H.; Kovacs, E. The science, policy and practice of nature-based solutions: An interdisciplinary perspective. Sci. Total.Environ. 2017, 579, 1215–1227. [Google Scholar] [CrossRef]
- Arkema, K.K.; Griffin, R.; Maldonado, S.; Silver, J.; Suckale, J.; Guerry, A.D. Linking social, ecological, and physical science to advance natural and nature-based protection for coastal communities. Ann. N. Y. Acad. Sci. 2017, 1399, 5–26. [Google Scholar] [CrossRef] [PubMed]
- Liquete, C.; Udias, A.; Conte, G.; Grizzetti, B.; Masi, F. Integrated valuation of a nature-based solution for water pollution control. Highlighting hidden benefits. Ecosyst.Serv. 2016, 22, 392–401. [Google Scholar] [CrossRef]
- Martín, E.G.; Giordano, R.; Pagano, A.; van der Keur, P.; Costa, M.M. Using a system thinking approach to assess the contribution of nature based solutions to sustainable development goals. Sci. Total. Environ. 2020, 738, 139693. [Google Scholar]
- Pugliese, F.; Caroppi, G.; Zingraff-Hamed, A.; Lupp, G.; Giugni, M. Nature-Based Solutions (NBSs) Application for Hydro-Environment Enhancement. A Case Study of the Isar River (DE). Environ. Sci. Proc. 2020, 2, 30. [Google Scholar] [CrossRef]
- Raymond, C.M.; Frantzeskaki, N.; Kabisch, N.; Berry, P.; Breil, M.; Nita, M.R.; Geneletti, D.; Calfapietra, C. A framework for assessing and implementing the co-benefits of nature-based solutions in urban areas. Environ. Sci. Policy 2017, 77, 15–24. [Google Scholar] [CrossRef]
- Schipper, C.A.; Dekker, G.G.; de Visser, B.; Bolman, B.; Lodder, Q. Characterization of SDGs towards Coastal Management: Sustainability Performance and Cross-Linking Consequences. Sustainability 2021, 13, 1560. [Google Scholar] [CrossRef]
- Artmann, M.; Sartison, K. The role of urban agriculture as a nature-based solution: A review for developing a systemic assessment framework. Sustainability 2018, 10, 1937. [Google Scholar] [CrossRef] [Green Version]
- Pakzad, P.; Osmond, P. Developing a sustainability indicator set for measuring green infrastructure performance. Procedia-Soc. Behav. Sci. 2016, 216, 68–79. [Google Scholar] [CrossRef] [Green Version]
- Seifollahi-Aghmiuni, S.; Nockrach, M.; Kalantari, Z. The potential of wetlands in achieving the sustainable development goals of the 2030 Agenda. Water 2019, 11, 609. [Google Scholar] [CrossRef] [Green Version]
- Weber, C.; Åberg, U.; Buijse, A.D.; Hughes, F.M.; McKie, B.G.; Piégay, H.; Roni, P.; Vollenweider, S.; Haertel-Borer, S. Goals and principles for programmatic river restoration monitoring and evaluation: Collaborative learning across multiple projects. Wiley Interdiscip. Rev. Water 2018, 5, e1257. [Google Scholar] [CrossRef] [Green Version]
- Evaluating Nature-Based Solutions. Best Practices, Frameworks and Guidelines. Available online: https://northsearegion.eu/media/6959/report_pr3812_evaluatingnbs_final_29112018.pdf (accessed on 26 July 2021).
- Schipper, C.A.; Vreugdenhil, H.; De Jong, M.P.C. A sustainability assessment of ports and port-city plans: Comparing ambitions with achievements. Transp. Res. 2017, 57, 84–111. [Google Scholar] [CrossRef]
- Engineering With Nature: An Atlas. Available online: https://ewn.el.erdc.dren.mil/img/atlas/ERDC-EL_SR-18-8_Ebook_file.pdf (accessed on 26 July 2021).
- Taming the Floods, Dutch-Style. Available online: https://www.theguardian.com/environment/2014/may/19/floods-dutch-britain-netherlands-climatechange (accessed on 26 July 2021).
- Juarez, A. Unveiling Rules-In-Use in Eco-Engineering Projects. MSc: Wageningen, The Netherlands, 2013; Available online: https://www.google.com/url?sa=t&rct=j&q=&esrc=s&source=web&cd=&cad=rja&uact=8&ved=2ahUKEwj6pcuXwr3zAhU5wQIHHf80AiMQFnoECAMQAQ&url=https%3A%2F%2Fwww.wur.nl%2Fweb%2Ffile%3Fuuid%3D9ad1cc8e-514f-445e-a445-21023ba438f3%26owner%3Dfb4cacd6-0b7a-4091-ae5f-7fd83160b8f1&usg=AOvVaw2l3qxR7krpZOVddZDVrc43 (accessed on 9 October 2021).
- Engineering: Building with Nature 101x MOOC—Hints and Information for Building with Nature Design—Case 1: Climate-proof Noordwaard. Available online: https://ocw.tudelft.nl/wp-content/uploads/Hints_for_Noordwaard.pdf (accessed on 26 July 2021).
- Warner, J.F.; van Buuren, A.; Edelenbos, J. (Eds.) Making Space for the River; IWA Publishing: London, UK, 2012; pp. 56–62. [Google Scholar]
- Tailor Made Collaboration: A Clever Combination of Process and Content. Available online: https://issuu.com/ruimtevoorderivier/docs/tailor_made_collaboration_a_clever_/17 (accessed on 26 July 2021).
- Colorado Watershed Flood Recovery. Available online: https://coyotegulch.blog/2018/09/09/cwcb_dnr-colorado-watershed-flood-recovery-summary/ (accessed on 26 July 2021).
- Post-Flood Recovery Assessment and Stream Restoration Guidelines for the Colorado Front Range. Available online: https://cpw.state.co.us/Documents/Research/Aquatic/pdf/PostFloodAssessmentandGuidelines.pdf (accessed on 26 July 2021).
- Nicholson, A.R.; O’Donnell, G.M.; Wilkinson, M.E.; Quinn, P.F. The potential of runoff attenuation features as a Natural Flood Management approach. J. Flood Risk Manag. 2020, 13, e12565. [Google Scholar] [CrossRef] [Green Version]
- Nicholson, A.R.; Wilkinson, M.E.; O’Donnell, G.M.; Quinn, P.F. Runoff attenuation features: A sustainable flood mitigation strategy in the Belford catchment, UK. Area 2012, 44, 463–469. [Google Scholar] [CrossRef]
- Case study 16. Belford Natural Flood Management Scheme, Northumberland. Available online: https://ewn.el.erdc.dren.mil/symposiums/May2019/FridaySiteVisit/case_study_16_belford.pdf (accessed on 26 July 2021).
- Reducing Flood in Belford [Video File]. Available online: https://www.youtube.com/watch?v=zqHLm4V_c58 (accessed on 26 July 2021).
- Belford: A Case Study of Catchment Scale Natural Flood Management. Available online: https://www.parliament.uk/globalassets/documents/post/QuinnPOST.pdf (accessed on 26 July 2021).
- Belford Burn Runoff Attenuation Scheme—Northumberland. Case Study 14. Available online: https://www.therrc.co.uk/sites/default/files/projects/sc120015_case_study_14.pdf (accessed on 26 July 2021).
- Potential Use of Runoff Attenuation Features in Small Rural Catchments for Flood Mitigation. Available online: https://research.ncl.ac.uk/proactive/belford/newcastlenfmrafreport/reportpdf/June%20NFM%20RAF%20Report.pdf (accessed on 26 July 2021).
- Natural Flood Management Handbook. Available online: https://www.sepa.org.uk/media/163560/sepa-natural-flood-management-handbook1.pdf (accessed on 26 July 2021).
- Wilkinson, M.E.; Quinn, P.F. Belford Catchment Proactive Flood Solutions: A toolkit for managing runoff in the rural landscape. Clim. Water Soil Sci. Policy Pract. 2010, 103. Available online: https://research.ncl.ac.uk/proactive/belford/papers/SAC2010.pdf (accessed on 9 October 2021).
- Wilkinson, M.E.; Quinn, P.F.; Welton, P. Belford catchment proactive flood solutions: Storing and attenuating runoff on farms. In Proceedings of the BHS 10th National Hydrology Symposium, Exeter, UK, 15–17 September 2008. [Google Scholar]
- Wilkinson, M.E.; Quinn, P.F.; Welton, P. Runoff management during the September 2008 floods in the Belford catchment, Northumberland. J. Flood Risk Manag. 2010, 3, 285–295. [Google Scholar] [CrossRef]
- Wilkinson, M.E.; Quinn, P.F.; Barber, N.J.; Jonczyk, J. A framework for managing runoff and pollution in the rural landscape using a Catchment Systems Engineering approach. Sci. Total. Environ. 2014, 468, 1245–1254. [Google Scholar] [CrossRef] [PubMed]
- Haase, D.; Larondelle, N.; Andersson, E.; Artmann, M.; Borgström, S.; Breuste, J.; Baggethun-Gomez, E.; Gren, A.; Hamstead, Z.; Kabisch, N. A quantitative review of urban ecosystem service assessments: Concepts, models, and implementation. Ambio 2014, 43, 413–433. [Google Scholar] [CrossRef] [Green Version]
- Den Dekker-Arlain, J. Sustainable Rivers; MSc: Avans Hogeschool, The Netherlands, 2019. [Google Scholar]
- Kabisch, N.; Frantzeskaki, N.; Pauleit, S.; Naumann, S.; Davis, M.; Artmann, M.; Hasse, D.; Knapp, S.; Korn, H.; Stadler, J. Nature-based solutions to climate change mitigation and adaptation in urban areas: Perspectives on indicators, knowledge gaps, barriers, and opportunities for action. Ecol. Soc. 2016, 21, 39. Available online: https://www.ecologyandsociety.org/vol21/iss2/art39/ (accessed on 9 October 2021). [CrossRef] [Green Version]
- Development and Globalization Facts and Figures. Available online: https://stats.unctad.org/Dgff2016/DGFF2016.pdf (accessed on 27 July 2021).
- Evaluating the Impact of Nature-Based Solutions: A Handbook for Practitioners. Available online: https://op.europa.eu/en/publication-detail/-/publication/d7d496b5-ad4e-11eb-9767-01aa75ed71a1 (accessed on 27 July 2021).
- Comprehensive Framework for NBS Assessment. Available online: https://phusicos.eu/wp-content/uploads/2019/05/D4.1_Task4.1_UNINA_14052019_Final_withAppendicies.pdf (accessed on 27 July 2021).
- Distilling Engineering Design Principles. Available online: https://data.4tu.nl/articles/dataset/Engineering_Building_with_Nature_101x_video_06_-_Engineering_design_principles_Dikes_/12693668 (accessed on 27 July 2021).
- Spray, C.; Baillie, A.; Chalmers, H.; Comins, L.; Black, A.; Dewell, E.; Ncube, S.; Perez, K.; Spray, C.; Ball, T. Eddleston Water Project Report 2016. Tweed Forum: Melrose, UK, 2017. [Google Scholar]
- Black, A.; Peskett, L.; MacDonald, A.; Young, A.; Spray, C.; Ball, T.; Thomas, H.; Werritty, A. Natural flood management, lag time and catchment scale: Results from an empirical nested catchment study. J. Flood Risk Manag. 2021, 14, e12717. [Google Scholar] [CrossRef]
- Dittrich, R.; Ball, T.; Wreford, A.; Moran, D.; Spray, C.J. A cost-benefit analysis of afforestation as a climate change adaptation measure to reduce flood risk. J. Flood Risk Manag. 2019, 12, e12482. [Google Scholar] [CrossRef] [Green Version]
- Werritty, A.; Spray, C.; Ball, T.; Bonell, M.; Rouillard, J.; MacDonald, A.; Comins, L.; Richardson, R. Integrated catchment management: From rhetoric to reality in a Scottish HELP basin. In Proceedings of the British Hydrological Society, Third International Conference. Role of Hydrology in Managing Consequences of a Changing Global Environment, Newcastle-upon-Tyne, UK, 19-23 July 2010; pp. 1–15. [Google Scholar]
- Working with Natural Processes—Evidence Directory. Available online: https://assets.publishing.service.gov.uk/media/6036c5468fa8f5480a5386e9/Working_with_natural_processes_evidence_directory.pdf (accessed on 27 July 2021).
- Tier Classification for Global SDG Indicators. Available online: https://unstats.un.org/sdgs/files/Tier%20Classification%20of%20SDG%20Indicators_29%20Mar%202021_web.pdf (accessed on 27 July 2021).
- Andrikopoulou, T. Nature based solutions for fluvial flood mitigation: An integrated assessment framework. Master’s Thesis, Technical University of Delft, Delft, The Netherlands, 2020. [Google Scholar]
- Ge, Y.; Li, X.; Cai, X.; Deng, X.; Wu, F.; Li, Z.; Luan, W. Converting UN sustainable development goals (SDGs) to decision-making objectives and implementation options at the river basin scale. Sustainability 2018, 10, 1056. [Google Scholar] [CrossRef] [Green Version]
- Pohle, A.; Blind, K.; Neustroev, D. The impact of international management standards on academic research. Sustainability 2018, 10, 4656. [Google Scholar] [CrossRef] [Green Version]
- Veugelers, R.; Cincera, M.; Frietsch, R.; Rammer, C.; Schubert, T.; Pelle, A.; Renda, A.; Montalvo, C.; Leijten, J. The impact of horizon 2020 on innovation in Europe. Intereconomics 2015, 50, 4–30. [Google Scholar] [CrossRef] [Green Version]
- Clarke, R.Y. Measuring success in the development of smart and sustainable cities. In Managing for Social Impact; Springer: Cham, Switzerland, 2017; pp. 239–254. [Google Scholar]
- Huovila, A.; Bosch, P.; Airaksinen, M. Comparative analysis of standardized indicators for Smart sustainable cities: What indicators and standards to use and when? Cities 2019, 89, 141–153. [Google Scholar] [CrossRef]
- Ávila-Gutiérrez, M.J.; Martín-Gómez, A.; Aguayo-González, F.; Córdoba-Roldán, A. Standardization framework for sustainability from circular economy 4.0. Sustainability 2019, 11, 6490. [Google Scholar] [CrossRef] [Green Version]
- Caprotti, F.; Cowley, R.; Datta, A.; Broto, V.C.; Gao, E.; Georgeson, L.; Herrick, C.; Odendaal, N.; Joss, S. The New Urban Agenda: Key opportunities and challenges for policy and practice. Urban Res.Pract. 2017, 10, 367–378. [Google Scholar] [CrossRef] [Green Version]


| Project | Location | Scale | References |
|---|---|---|---|
| Wave-attenuating willow forest | Noordwaard polder, The Netherlands | ~44.50 km2 polder area | [28,29,30,31,32,33] |
| Colorado front range: recovery from 2013 floods | United States of America (USA) | ~105 km river and floodplain improvements | [28,34,35] |
| Belford natural flood management scheme | Belford, Northumberland, United Kingdom (UK) | ~6 km2 catchment size | [36,37,38,39,40,41,42,43,44,45,46,47] |
| SDGs Identified | Relevant SDG Targets | Relevant SDG Indicators | Explanation |
|---|---|---|---|
| GOAL 1 End poverty in all its forms everywhere | Target 1.5 Disaster Resilience | 1.5.1 Casualties due to disasters | Protect from/reduce exposure of people to flooding |
| 1.5.2 GDP economic losses due to disasters | Prevent or minimize economic losses due to flooding | ||
| 1.5.3 Strategies in line with Sendai | Introduce to/become part of the national flood risk reduction strategies | ||
| 1.5.4 Alignment of local and national strategies | Make the alignment with national flood risk reduction strategies feasible | ||
| GOAL 3 Ensure healthy lives and promote well-being for all at all ages | Target 3.9 Pollutions and Contaminations | 3.9.1 Air pollution mortality | Can contribute to air purification due to the natural elements used/enhanced |
| 3.9.2 Unsafe water mortality | Protect from/reduce exposure of people to poor quality water | ||
| GOAL 6 Ensure availability and sustainable management of water and sanitation for all | Target 6.3 Water Pollution | 6.3.2 Water quality | Can contribute to water purification due to the natural elements used/enhanced |
| Target 6.5 Management and Cooperation | 6.5.1 Integrated water resources management | Require integrated water resources management | |
| 6.5.2 Transboundary water cooperation | Can potentially achieve it | ||
| Target 6.6 Water Quantity and Quality | 6.6.1 Extent of water-related ecosystems | By enhancing the natural processes, the ecosystem expands | |
| Target 6.b Community Participation | 6.b.1 Community engagement | They require inclusive processes and stakeholder participation in the management of water resources | |
| GOAL 8 Promote sustained, inclusive, and sustainable economic growth, full and productive employment, and decent work for all | Target 8.1 Economic Growth | 8.1.1 Economic growth per capita | Overall economic growth shared over the local population due to new jobs, increased income, or production due to intervention |
| Target 8.2 Economic Productivity | 8.2.1 Economic growth per employed person | Potential increase of the income per employed person due to jobs created or enhanced by the intervention | |
| Target 8.3 Development-Oriented Policies | 8.3.1 Employment | Ameliorate existing jobs by providing opportunities and better prevailing conditions | |
| Target 8.4 Resource Efficiency | 8.4.2 Domestic material consumption per GDP | Use of locally available materials and limited cost compared to grey materials | |
| Target 8.5 Employment | 8.5.2 Unemployment rates | New job opportunities | |
| Target 8.9 Tourism-Oriented Policies | 8.9.1 Economic growth due to tourists | Money and jobs due to the touristic attractiveness of the area | |
| GOAL 9 Build resilient infrastructure, promote inclusive and sustainable industrialization, and foster innovation | Target 9.4 CO2 Emissions Reduction | 9.4.1 CO2 emissions | C02 sequestration through use of the natural material chosen |
| Target 9.5 Research and Development Expenditure | 9.5.1 Research and development expenditure | Research and pilot projects needed for the implementation of the NBSs | |
| GOAL 11 Make cities and human settlements inclusive, safe, resilient, and sustainable | Target 11.3 Participation and Management | 11.3.2 Public engagement strategies | Stakeholder involvement in NBSs design and implementation |
| Target 11.4 Expenditure on Preserving Heritage | 11.4.1 Expenditure on culture and heritage | Protection of cultural heritage is an additional aspect to the NBSs’ main function in flood risk mitigation | |
| Target 11.5 Economic Losses Due to Disasters | 11.5.1 Casualties due to disasters | Protect from/reduce exposure of people to flooding | |
| 11.5.2 Damages to infrastructures and services | Prevent or minimize economic losses due to flooding | ||
| Target 11.7 Green and Public Spaces | 11.7.1 Use of public areas | Accessibility, recreation, and leisure space are additional aspects to the NBSs’ main function in flood-risk mitigation | |
| Target 11.A Economic, Social, and Environmental Links | 11.a.1 Development plans accounting for future projections | Part of the NBSs design | |
| Target 11.B Holistic Disaster Risk Management | 11.b.1 Strategies to protect development gains from the risk of disaster (Sendai framework) | NBSs are part of flood-risk-reduction strategies which align with Sendai FDRR | |
| 11.b.2 Alignment of local and national strategies | Make the alignment with national flood risk reduction strategies feasible | ||
| GOAL 12 Ensure sustainable consumption and production patterns | Target 12.1 Consumption and Production | 12.1.1 Sustainable production and consumption plans | NBSs include sustainable use/consumption of naturally available materials |
| Target 12.2 Domestic Material Consumption | 12.2.2 Domestic material consumption | Use of locally available materials | |
| Target 12.6 Sustainability in Companies | 12.6.1 Sustainability reports by companies | NBSs involve the three sustainability pillars and thus could evoke sustainable activities in the companies | |
| Target 12.7 Procurement Practices | 12.7.1 Sustainable action plans | NBSs involve inclusive strategies, actions, and the three sustainability pillars | |
| Target 12.8 Education and Awareness | 12.8.1 Education for sustainability | Offer education through the enrichment of the area and close contact with nature | |
| GOAL 13 Take urgent action to combat climate change and its impacts | Target 13.1 Resilience and Adaptive Capacity | 13.1.1 Casualties due to disasters | Protect from/reduce exposure of people to flooding |
| 13.1.2 Strategies in line with Sendai | NBSs are part of flood-risk-reduction strategies that align with Sendai FDRR | ||
| 13.1.3 Alignment of local and national strategies | Make the alignment with national flood risk reduction strategies feasible | ||
| Target 13.2 Operationalization of Climate-Related Policies | 13.2.1 Climate adaptation plans and strategies | Offer multi-benefit approach that applies at NBSs design and implementation | |
| Target 13.3 Development Action | 13.3.2 Technology knowledge, transfer, and development in countries | NBSs result from and contribute to development | |
| Target 13.B Capacity for Planning and Management | 13.b.1 Support for climate-related actions | Strengthening the evidence and experience in NBSs would spread their application for climate resilience | |
| GOAL 15 Protect, restore and promote sustainable use of terrestrial ecosystems, sustainably manage forests, combat desertification, and halt and reverse land degradation and halt biodiversity loss | Target 15.1 Protected Areas | 15.1.2 Protected areas | Protection and conservation of designated sites (including Natura 2000) are considered during NBSs design and implementation |
| Target 15.3 Land Degradation | 15.3.1 Degraded areas | NBSs can contribute to halting erosion | |
| Target 15.5 Threatened Species | 15.5.1 Red List Index | Generation of wildlife habitat and population viability are addressed by NBSs | |
| Target 15.6 Access to and Sharing of Benefits | 15.6.1 Policies for sharing of benefits | NBSs are designed in order to provide as many benefits as possible to multiple stakeholders | |
| Target 15.8 Prevention of Invasive Alien Species | 15.8.1 Policies for control of invasive non-native species | Contribute to awareness and prevention of spread of non-native invasive species in riverine ecosystems | |
| Target 15.9 Ecosystem and Biodiversity into Policies | 15.9.1 Aichi biodiversity target 2 | Enhance biodiversity as part of the NBSs goals | |
| Target 15.A Assistance and Expenditure on Biodiversity and Ecosystems | 15.a.1 Use and conservation of biodiversity and ecosystems | Part of the NBSs project goals | |
| GOAL 17 Strengthen the means of implementation and revitalize the Global Partnership for Sustainable Development | Target 17.6 Cooperation between Countries | 17.6.1 Cooperation between countries | NBSs could enhance science and technology cooperation between countries |
| Target 17.14 Policy Coherence | 17.14.1 Mechanisms for sustainable development | The broad involvement needed in NBSs projects could lead to policy coherence for sustainable development | |
| Target 17.15 Use of Domestic Development Tools | 17.15.1 Use country-owned resources | NBSs intervention aligned with national policies and development plans | |
| Target 17.16 Partnerships and Stakeholder Engagement | 17.16.1 Reporting progress in SDG | NBSs can contribute to SDG progress through the multi-benefit approach, which includes society, environment, and economy | |
| Target 17.17 Money to Partnerships | 17.17.1 Partnerships | Partnerships and coalitions formed/enhanced through NBSs | |
| Targets 17.18 Data and Indicators | 17.18.1 Production of SD indicators per country | NBSs can create trackable indicators |
| # | Fluvial Flooding Indicator | (Fluvial Flooding Indicator) General Description | Ref. | Dimension | Relevant SDG Indicator | (SDG Indicator) Short Description |
|---|---|---|---|---|---|---|
| 1 | Biodiversity abundance | Animals using the site, vegetation cover, designation as a protected site (e.g., inclusion in the EU ‘Natura 2000’ network) | [14,15,20,22,25,26,27] | Environment | 15.1.2 | Protected areas |
| 2 | Wildlife habitat | Creation of habitat for flora and fauna | [14,15,20,22,25,26,27] | 15.5.1 | Red List Index | |
| 3 | Population viability | Expresses either lifetime of a species in time or natural elements that enhance fauna abundance | [14,15,20,22,25,26,27] | 15.5.1 | Red List Index | |
| 4 | Endogeneity | Presence of non-native invasive species | [14,15,20,22,25,26,27] | - | - | |
| 5 | Continuity of water and sediment flux | Erosion, sediment traps, amount of sediment captured | [14,15,20,22,25,26,27] | 15.3.1 | Degraded areas | |
| 6 | Water quality | Nitrates, phosphorus, and suspended sediments, water discharge | [14,15,20,22,25,26,27] | 6.3.2 | Water quality | |
| 7 | CO2 emissions | CO2 captured by the vegetation/natural elements used | [14,15,20,22,25,26,27] | 9.4.1 | CO2 emissions | |
| 8 | Extent of water-related ecosystems | Spatial extent of the water-related ecosystem since the NBSs’ implementation | [14,15,20,22,25,26,27] | 6.6.1 | Extent of water-related ecosystems | |
| 9 | Well-being | Mortality rate, numbers of people affected by water pollution, air pollution, flooding | [14,15,20,22,25,26,27] | Society | 1.5.1/ 13.1.1/ 11.5.1 | Casualties due to disasters |
| 3.9.1 | Air pollution mortality | |||||
| 3.9.2 | Unsafe water mortality | |||||
| 10 | Physical and mental health | People frequently using the NBSs area | [14,15,20,22,25,26,27] | - | - | |
| 11 | Cultural heritage/educational value | Protected or (newly) created value by the intervention | [14,15,20,22,25,26,27] | 12.8.1 | Education for sustainability | |
| 12 | Recreation/leisure value | (New) walking/running/biking paths, activities | [14,15,20,22,25,26,27] | 11.7.1 | Use of public areas | |
| 13 | Enhance attractiveness | Improvement of ‘spatial quality’, accessibility of the area, number of tourists (tourist accommodation) | [14,15,20,22,25,26,27] | 11.7.1 | Use of public areas | |
| 14 | Exploitation | A measure of Net Present Value from the stakeholders’ perspective, e.g., income per exploitation activity (irrigation, recreation, cattle farming, agriculture, tourists) | [14,15,20,22,25,26,27] | Economy | 8.1.1 | Economic growth per capita |
| 8.2.1 | Economic growth per employed person | |||||
| 8.9.1 | Economic growth due to tourists | |||||
| 15 | Investment | A measure of Net Present Value from the intervention’s perspective, e.g., less money spent compared to a traditional measure | [14,15,20,22,25,26,27] | Economy | 8.4.2/ 12.2.2 | Domestic material consumption per GDP |
| 9.5.1 | Research and development expenditure | |||||
| 11.4.1 | Expenditure on culture and heritage | |||||
| 16 | Employment | Additional jobs created (pruning of trees, mowing, renting canoes, selling local growing products) | [14,15,20,22,25,26,27] | 8.3.1 | Employment/ | |
| 8.5.2 | Unemployment rates | |||||
| 17 | Value of flood damage avoided | Value of assets that would have been destroyed in case of flood avoided relocation | [14,15,20,22,25,26,27] | 1.5.2 | GDP economic losses due to flooding disasters | |
| 11.5.2 | Damages to infrastructure and services | |||||
| 18 | Maintenance | Money spent for maintenance | [28,29,30,31,32,33,34,35,36,37,38,39,40,41,42,43,44,45,46,47] | - | - | |
| 19 | Flood protection | Attenuation of the flood due to the natural components of the intervention, delay of the travel time of the peak flow | [14,15,20,22,25,26,27] | Technical | - | - |
| 20 | Structural integrity | Proof of structural stability whilst using natural materials | [54] | - | - | |
| 21 | Reliability | Repairs or replacements needed since construction | [54] | - | - | |
| 22 | Ease of implementation | Availability (and use) of resources and materials available on site | [54] | 8.4.2/ 12.2.2 | Domestic material consumption | |
| 12.1.1 | Sustainable production and consumption plans | |||||
| 23 | Adaptability | Future changes in function | [54] | 11.a.1 | Development plans accounting for future projections | |
| 13.2.1 | Climate adaptation plans and strategies | |||||
| 24 | Resilience | Whether another major intervention will be needed in due course (long-term perspective with respect to safety) | [54] | - | - | |
| 25 | Different stakeholders/disciplines involved | Different stakeholders/disciplines involved | [14,15,20,22,25,26,27] | Policy— Procedural | 11.3.2 | Public engagement strategies |
| 12.7.1 | Sustainable action plans | |||||
| 26 | Planning/participatory processes | Types of participatory/planning process used: top-down/bottom-up, formal/informal rule-oriented, trust-based, consultation processes, collaborative learning, learning by performing, workshops, meetings | [14,15,20,22,25,26,27] | Policy— Procedural | 6.b.1 | Community engagement |
| 12.7.1 | Sustainable action plans | |||||
| 27 | Hierarchy relations (e.g., communication, transparency) | Gap between local stakeholders and projects managers/central bosses (committed and accessible project managers) | [28,29,30,31,32,33,34,35,36,37,38,39,40,41,42,43,44,45,46,47] | - | - | |
| 28 | Environmental agendas, frameworks, directives | Different legislations that need to be considered: assessments, (water, floods, birds) directives, Natura 2000 | [14,15,20,22,25,26,27] | 1.5.3/ 11.b.1/ 13.1.2 | Strategies in line with Sendai | |
| 1.5.4/ 11.b.2/ 13.1.3 | Alignment of local and national strategies | |||||
| 15.8.1 | Policies for invasive alien species | |||||
| 29 | Integrated water resources management | Newly added dimension indicator to cover the relevant SDG indicator | [4] | 6.5.1 | Integrated water resources management | |
| 30 | Transboundary water cooperation | Newly added dimension indicator to cover the relevant SDG indicator | [4] | 6.5.2 | Transboundary water cooperation | |
| 31 | Capacity-building for development actions | Newly added dimension indicator to cover the relevant SDG indicator | [4] | 13.3.2 | Technology knowledge, transfer, and development in countries | |
| 32 | Sharing of benefits | Newly added dimension indicator to cover the relevant SDG indicator | [4] | 15.6.1 | Policies for sharing of benefits | |
| 33 | Aichi biodiversity target 2 | Newly added dimension indicator to cover the relevant SDG indicator | [4] | 15.9.1 | Aichi Biodiversity target 2 | |
| 34 | Conservation of biodiversity and ecosystems | Newly added dimension indicator to cover the relevant SDG indicator | [4] | 15.a.1 | Use and conservation of biodiversity and ecosystems | |
| 35 | Expectations-outcomes alignment | Alignment of project aims with the expectations of stakeholders and with the outputs and outcomes delivered | [28,29,30,31,32,33,34,35,36,37,38,39,40,41,42,43,44,45,46,47] | Policy— Procedural | - | - |
| 36 | Long-term data consistency | Existence and/or maintenance of databases relevant to the project info | [14,15,20,22,25,26,27] | - | - | |
| 37 | Raising and sharing nbss awareness | Virtual visits on respective sites/forums, publications in social media, citations/newspapers, public consultations about how the people feel after the completion of the intervention (public engagement meeting) | [14,15,20,22,25,26,27] | - | - | |
| 38 | Promoting collaboration | Coalition and partnerships formed and sustained | [14,15,20,22,25,26,27] | 17.14.1 | Mechanisms for sustainable development | |
| 17.17.1 | Partnerships | |||||
| 39 | Sustainability reporting | Newly added dimension indicator to cover the relevant SDG indicator | [4] | 12.6.1 | Sustainability reports by companies | |
| 40 | Climate-related support | Newly added dimension indicator to cover the relevant SDG indicator | [4] | 13.b.1 | Support for climate-related actions | |
| 41 | (Types of) cooperation between countries | Newly added dimension indicator to cover the relevant SDG indicator | [4] | 17.6.1 | Cooperation between countries | |
| 42 | Country-owned resources | Newly added dimension indicator to cover the relevant SDG indicator | [4] | 17.15.1 | Use country-owned resources | |
| 43 | Progress in SDGs | Newly added dimension indicator to cover the relevant SDG indicator | [4] | 17.16.1 | Reporting progress in SDG | |
| 44 | Production of national indicators | Newly added dimension indicator to cover the relevant SDG indicator | [4] | 17.18.1 | Production of SD indicators per country |
| # | Fluvial Flooding Indicator | Contribution to SDGs | SDG Targets | Eddleston Project Metadata |
|---|---|---|---|---|
| 1 | Biodiversity abundance | 15 | 15.1 | EU Special Area of Conservation (SAC) for its salmon, lampreys, otters, and aquatic plants Macroinvertebrate: a rapid recolonization of re-meandered channels by aquatic macroinvertebrates. Species richness and diversity increased post-restoration Salmonids: Eddleston is important for breeding salmon and as a nursery habitat. Improved salmonid habitat due to restorations in terms of the provision of suitable micro habitat and overall physical diversity. Total available habitat area increased due to the increased channel length and width |
| 2 | Wildlife habitat | 15 | 15.5 | An increase in overall physical diversity of habitats within re-meandered sections and an increase in habitat area, both greater where there has been a greater degree of re-meandering |
| 3 | Population viability | 15 | 15.5 | Potential increase in the number and extent of spawning habitats for salmon, as indicated by changes in the spatial distribution of favored micro-habitats for salmonids |
| 4 | Continuity of water and sediment | 15 | 15.3 | Morphological units: generally, there is much greater morphological diversity through the reach because of restoration, with the most significant change happening at the Lakewood reach with the biggest increase in length (re-meandering). Generally, restoration has resulted in much more diverse channel morphology, with all morphological unit types present in 2015/2016 compared to only three in 2009 Grain size per geomorphic unit: following restoration, the overall grain size and variation was seen to decrease, with units post-restoration being better sorted and grain sizes more distinctive and specific per geomorphic unit |
| 5 | Water quality | - | - | Water quality is generally good in Eddleston, apart from some isolated incidents of diffuse organic pollution and increased nitrate levels in recent decades. Generally, it was not an objective, aim, or constraint of the project (Spray et al., 2017) |
| 6 | CO2 emissions | 9 | 9.4 | Tree planting reduces carbon; however, no specific measurements were taken because it is not a key project issue. However, more research is currently being completed in this direction |
| 7 | Extent of water-related ecosystems | 6 | 6.6 | Re-meandering (approximately 3 km): the new courses increase the existing individual lengths of channel by between 8% and 56%, reducing the gradient and adding some 300 m (approximately 3000 m2) of new in-channel habitat |
| 8 | Well-being | 1, 11, 13 | 1.5, 11.5, 13.1 | Modeling from SEPA (SEPA’s flood risk assessments) shows 521 properties in Peebles, 61 in Eddleston, and 7 rural dwellings are at risk from a 1:200 year flood event. To date, catchment communities escaped the 2015/2016 and late 2016 winter floods |
| 9 | Cultural heritage/educational value | 12 | 12.8 | The project works as a living laboratory, open to public and to schools for raising awareness of flooding in the area and encouraging pupils and teachers to take an active part in the project and learn about their catchment. Additionally, interpretation boards enhance the commercial use of the area. Finally, as a publicly funded Research Platform, the river is the location for many research projects from universities and academic institutions |
| 10 | Recreation/leisure value | 11 | 11.7 | Soon, a multi-use track (biking, walking) will be constructed on the old railway line, which will attract even more people for recreation |
| 11 | Enhance attractiveness | 11 | 11.7 | Interpretation boards to be produced along this new path will improve the recreational side of the Eddleston |
| 12 | Exploitation | 8 | 8.1, 8.2, 8.9 | Full details of the economic costs and benefits of the implementation of NBSs measures have been analyzed as they impact farm income and profitability in the case study area based on land use data, agricultural and environmental support subsidies, and foregone farm income The salmon fishery of the Tweed is worth a total of over 24 million GBP a year to the local economy and supports over 500 jobs, so any improvement to fish habitat is important. Although salmon fishing is predominantly on the main Tweed River, Eddleston Water and similar tributaries are vital as breeding and nursery locations for salmon |
| 13 | Investment | 8, 9,11,12 | 8.4, 9.5, 11.4, 12.2 | Modeling for a range of climate change scenarios shows a positive net present value from NFM tree planting, indicating that the riparian woodland is worth implementing. Annual benefits of c. 80 k GBP per year were estimated, with a high average benefit–cost ratio for the riparian woodland, though full benefits will not be realized for some 15 years after implementation Direct measurements on the ground of the value of a range of ecosystem services/multiple benefits already delivered as part of the NFM measures is an additional GBP 4.2 million Net Present Value (NPV) over and above the NPV from flood damages avoided (GBP 950 k) from the implementation of the same measures. The total cost of physical works amounts to GBP 1.3 million across 20 different landholdings, with the majority of that attributed to river and pond excavations, fencing, and planting. Monitoring and evaluation have cost some GBP 925 k on top of that |
| 14 | Employment | - | - | No additional jobs created yet. Maybe some slight vegetation management, but nothing bigger. If the track is realized, then it is possible that there will be more additional jobs (such as renting bicycles) |
| 15 | Value of reduced flood damage | 1, 11 | 1.5, 11.5 | The value of flood damages avoided by the current NFM features is GBP 950 k Net Present Value (100 years) The value of other ecosystem services/multiple benefits delivered as part of the NFM measures is an additional GBP 4.2 million NPV over and above the NPV from flood damages avoided (GBP 950 k) from the implementation of the same measures |
| 16 | Implementability | 8, 12 | 8.4, 12.1, 12.2 | Where possible, interventions are made of local timber from recently felled trees in the forest. An exception was for the rocks protecting the meander where it approaches the road, which were imported Large woody structures: on the Middle Burn, nearby conifers were felled and pinned across the channel Woodland and riparian woodland planting with native trees: species included oak, ash, willow, birch, aspen, and hazel |
| 17 | Adaptability | 11, 13 | 11.a, 13.2 | Although measures put in are seen as permanent, they are all subject to natural ecological and hydrological processes, and thus they will eventually need replacement. Potential change in the land of the area must be feasible, and project managers must be willing to facilitate and work with the landowners for land-use changes |
| 18 | Different stakeholders/disciplines involved | 11, 12 | 11.3, 12.7 | Landowners are key, and to date, 25 farmers and landowners have been involved, and 19 have hosted measures on their land. The Tweed Forum acts as project managers with Scottish Government, SEPA, Scottish Borders Council, Dundee University, and British Geological Survey. Others include Peebles Community Council, Forest Commission Scotland, Environment Agency, Scottish Natural Heritage, and National Farmers Union (Scotland) |
| 19 | Planning/participatory processes | 6, 12 | 6.b, 12.7 | Shared policy development and implementation: as a ‘Trusted Intermediary’, Tweed Forum spent significant time and effort informing and engaging with the local community and landowners in framing the project prior to implementation; regular meetings and presentations with the Peebles Community Council; interviews with landowners; leaflet to locals outlining and explaining aims of the project before the start of it; hands-on participatory engagement at local shows; questionnaire survey for the implemented measures |
| 20 | Environmental agendas, frameworks, directives | 1, 11, 13 | 1.5, 11.b, 13.1 | Tweed EU Special Area of Conservation (SAC); Water Environment and Water Services (Scotland) Act 2003; Flood Risk Management (Scotland) Act 2009; Eddleston Water forms part of the River Tweed, which has been designated as a HELP basin following the UNESCO program; Scottish Rural Development Programme (SRDP) scheme |
| 21 | Integrated water resources management | 6 | 6.5 | The Eddleston Project adopted an integrated catchment approach across all aspects of water resource management since this underpins the project approach to address the ‘sources—pathways and receptors’ contributing to flood risks |
| 22 | Transboundary water cooperation | - | - | Not a transboundary water project |
| 23 | Capacity-building for development actions | 13 | 13.3 | Eddleston is a small catchment where a specialized focus and strengthening of locals’ interest and involvement was needed for the realization of the project. This was achieved through participatory processes and engagement strategies |
| 24 | Sharing of benefits | 15 | 15.6 | Participatory processes and engagement strategies were a way of ensuring equitable share of benefits over the sectors considered in the project, including recognition of potential impacts of NBSs on farm businesses |
| 25 | Aichi biodiversity target 2 | 15 | 15.9 | Monitoring campaigns are running, aiming at evaluating the effect of the measures on biodiversity and hydro-morphology, creating evidence for strengthening biodiversity strategies |
| 26 | Conservation of biodiversity and ecosystems | 15 | 15.a | Monitoring campaigns are running, aiming at evaluating the outputs of the measures on biodiversity and ecosystems |
| 27 | Promoting collaboration | 17 | 17.14, 17.17 | Generally, a partnership approach has been followed, and Tweed Forum has brought together the landowners, the community, and the project experts |
| 28 | Sustainability reporting | - | - | No sustainability reports by companies |
| 29 | Climate-related support | - | - | No climate-related support. Currently, more research is being carried out to examine the effects of the interventions on climate change projections |
| 30 | (Types of) cooperation between countries | - | - | No cooperation between countries in the beginning. Many countries were involved when the project became part of the Interreg North Sea Region Program |
| 31 | Country-owned resources | 17 | 17.15 | The Eddleston Project Managers are Tweed Forum, and they, along with Scottish Government and SEPA and the main science provider, Dundee University, are all based in Scotland, and thus the project was generated and developed by country-owned institutions before attracting wider interest |
| 32 | Progress in SDGs | 17 | 17.16 | Very detailed and wide-ranging monitoring campaigns are running, aiming at evaluating the outcomes of the measures on multiple sectors and thus progress on SDGs |
| 33 | Production of national indicators | - | - | No production of SDG indicators |
| Dimension | Policy— Procedural | Economy | Society | Environment | Technical |
|---|---|---|---|---|---|
| Sustainable Development Goals | SDG 1 | SDG 1 | SDG 1 | SDG 6 | SDG 8 |
| SDG 11 | SDG 11 | SDG 11 | SDG 9 | SDG 12 | |
| SDG 13 | SDG 8 | SDG 13 | SDG 15 | SDG 13 | |
| SDG 6 | SDG 9 | SDG 12 | SDG 11 | ||
| SDG 12 | |||||
| SDG 17 |
Publisher’s Note: MDPI stays neutral with regard to jurisdictional claims in published maps and institutional affiliations. |
© 2021 by the authors. Licensee MDPI, Basel, Switzerland. This article is an open access article distributed under the terms and conditions of the Creative Commons Attribution (CC BY) license (https://creativecommons.org/licenses/by/4.0/).
Share and Cite
Andrikopoulou, T.; Schielen, R.M.J.; Spray, C.J.; Schipper, C.A.; Blom, A. A Framework to Evaluate the SDG Contribution of Fluvial Nature-Based Solutions. Sustainability 2021, 13, 11320. https://doi.org/10.3390/su132011320
Andrikopoulou T, Schielen RMJ, Spray CJ, Schipper CA, Blom A. A Framework to Evaluate the SDG Contribution of Fluvial Nature-Based Solutions. Sustainability. 2021; 13(20):11320. https://doi.org/10.3390/su132011320
Chicago/Turabian StyleAndrikopoulou, Tatiana, Ralph M. J. Schielen, Chris J. Spray, Cor A. Schipper, and Astrid Blom. 2021. "A Framework to Evaluate the SDG Contribution of Fluvial Nature-Based Solutions" Sustainability 13, no. 20: 11320. https://doi.org/10.3390/su132011320
APA StyleAndrikopoulou, T., Schielen, R. M. J., Spray, C. J., Schipper, C. A., & Blom, A. (2021). A Framework to Evaluate the SDG Contribution of Fluvial Nature-Based Solutions. Sustainability, 13(20), 11320. https://doi.org/10.3390/su132011320