1. Introduction
Food waste is a phenomenon with significant economic and, most importantly, social consequences. The inefficient end-use of food wasting creates significant environmental demands [
1,
2]. The amount of wasted food has been increasing over a time period [
3] and it is estimated that one third of food produced for human consumption is lost or wasted [
4,
5,
6].
Food is wasted throughout the food chain—from primary production, food processing, and production, through wholesale and retail to catering facilities and households. There are significant differences in the volume of waste and the end part of the food chain—households—are the most significant sources of food waste throughout the entire food chain [
7,
8,
9,
10,
11,
12,
13,
14,
15,
16,
17]. According to Beretta et al. [
18], the waste that is considered the most avoidable food waste is generated at the household level. Here, “avoidable” means food waste that can be prevented and that has the greatest potential in terms of possible reduction. According to a definition by the European Commission [
19], food waste can be any food that: (1) entered the food supply chain, (2) was removed or disposed of from the food supply chain or consumed as waste, (3) was destined for treatment as waste. Thus, food waste may include edible food, as well as food that was not intended to be eaten, i.e., inedible food.
Although many authors agree that households contribute significantly to food waste, there are no detailed household-level data available to our knowledge in the Czech Republic nor within the EU that would systematically monitor waste production at the end of the food chain, for example, the FUSIONS study [
20] has shown that the structure and the level of detail of EUROSTAT data are not sufficient for monitoring and evaluation purposes. Differences in household food waste estimates are caused by inconsistent methodologies [
21,
22]. This inconsistency results in that different numbers of food waste can be found in different sources, e.g., according to Food waste—causes, impacts, and proposals study [
23], in Denmark food waste is estimated at 118 kg per person per year, in France 144 kg, in Luxembourg 207 kg, and in Sweden 227 kg. The households’ contribution of food waste is 42%, according to this study. There are other studies, e.g., Preparatory study on food waste across EU27 [
21], which states 7 kg per capita per year of household food waste in Denmark, 133 kg in Luxemburg, 47 kg in France, and 43 kg in Sweden [
23], but if we compare this number with another study, different numbers are available: according to Naturvårdsverket [
24], the amount of food wasted by Swedish households was 100 kg per person per year. Despite these differences, it is stated that European consumers, who have different shopping and cultural habits than American and Asian consumers [
4] waste on average 76 kg of food per person per year [
9].
The lack of relevant comparable data of household food waste led the authors to conduct an extensive survey among Czech households. The primary aim was to map in detail the structure and actual amount of food waste produced by households. The effort to obtain the most accurate picture of the volume of wasted food in households led to the implementation of a survey among a large sample of households. Data on food waste volumes were obtained by analysing municipal waste produced by a sample of 900 households. To capture possible seasonal fluctuations in food waste and monitor the possible impact of types of residential housing on the amount of food waste, the analysis of municipal waste was performed in three types of residential housing developments throughout the year; the authors analysed dustbin contents in quarterly intervals for one year. Given the fact that the Czech Republic was affected by the COVID-19 pandemic in the monitored period, the authors were also able to compare household food waste volumes before and during the first wave of the pandemic.
Although the primary aim of the research was to determine food waste volumes through waste analyses, the analyses were supplemented by an extensive household questionnaire survey on the causes of food waste. The purpose was to identify the causes of wasting and, thus, outline how to motivate households to reduce their waste. In-depth interviews were also conducted to identify in detail the causes and facts affecting food waste.
The goal of the study is to give exact numbers on food waste generated by Czech households, find out what the main causes of food waste are, and show whether the volume of the food waste is affected by the place where the household is located, and whether the volume of food waste is affected by the season—whether it is possible to observe seasonal effects. The findings were supposed to reveal how consumers behave in terms of food management and waste production.
Based on the goals, it is possible to define the main research questions of this study:
What is the average volume of food waste generated by Czech private households per person per year?
How does food waste amount change during the seasons in the observed year?
Does the place where the household is located affect the volume of food waste?
What are the main causes of food waste in Czech households?
2. Theoretical Background
Food waste can be analysed from various angles—ethical, economic, and environmental [
25]. According to Swedish Environmental Research Institute [
19], the majority of food waste is produced by households; this implies that end parts of the food chain are the most significant sources of waste. Kummu et al. [
3], Griffin et al. [
1], Gooch and Felfel [
15], Parfitt et al. [
2], and other authors agree with this statement and provide data that even in the US [
7,
26], in Canada [
15], in Australia [
27,
28], or in other developed countries [
8,
29], the most food waste is produced by households.
However, gastronomic establishments are also a significant source of food waste as consumer decisions play a significant role here (the “plate waste” phenomenon—see Engström and Carlsson-Kanyama [
30]). Many studies, such as FUSIONS [
31], also point out that households are the riskiest parts of the food chain in terms of a possible waste increase. Although the UK Waste Reduction Initiative [
32] led to a 14% drop in household food waste between 2007 and 2010, the same study shows that very little progress has been made in recent years. Evans [
33] says that most people feel bad about wasting food and consider food waste an undesirable phenomenon, which leads to the question why the rates are so high.
Food waste-related behaviour is a relatively common topic in scientific studies. For example, Herath and Felfel [
34] have been looking into possible links between food properties (influencing purchasing decisions) and waste-related behaviour. At the same time, consumers with better food and nutritional awareness tend to waste less food. Wasting itself does not have to result from purely rational behaviour, because it bears high economic costs—WRAP report [
32] states that the cost of waste for households in the UK is about 15% of overall food cost, Buzby and Hyman [
35] estimate that the cost of food waste exceeds USD 900 per household per year.
Herath and Felfel [
34] emphasize that despite the growing interest in the issue, there is still a lack of empirical studies. Primary research based on direct food-waste measurement and objective data collection is still rather rare. Several different methodologies have been used to measure the amount of food waste, but all of them have certain drawbacks—see Thyberg and Tonjes [
36] in Ilakovac et al. [
14]. Grainger et al. [
37] state that given the high cost of measuring household food waste, the conclusions of most studies have been based on questionnaire-based self-assessments by households. A good example of data collection based on diaries is Herzberg et al. [
38], where authors collected dataset on household food waste in Germany based on a diary study, or Van Der Werf et al. [
39] who present a four-season waste characterization study, which adopted a Pay as You Throw system. Giordano [
40] points out the fact that, for example, in the years 2020–2021, it is possible to find ten studies dealing with food waste issues, but that most of them are based on questionnaires and come mostly from so called Global North countries. Primary research based on direct food-waste measurement and objective data collection is still rather rare. Next to attempts to quantify food waste, researchers also focus on causes leading to food waste production—see, for example [
8,
16,
41,
42,
43,
44].
Parfitt et al. [
8] analysed various case studies on household food waste and identified several factors that may affect the amount of food waste. One of the main factors is the size and composition of the family (these findings have been supported by, for example [
14,
33,
43,
45]. According to Parfitt et al. [
8], and Richter and Bokelmann [
46], another factor is household members’ ages, younger family members waste more than older ones. Ilakovac et al. [
14] also concluded that older people tend to waste less food and this finding has also been confirmed by Stancu et al. [
47]. Przezbórska-Skobiej and Wiza [
48] also, in their study, showed that young people declare to waste more food than older people, this can also be found in studies [
49,
50]. Other factors influencing household food waste include household income (low-income households waste less food—see also Baker et al. [
51], Stancu et al. [
47] or Ilakovac et al. [
14]), the sex of the family member doing the shopping (some research [
52] also indicate that females show higher motivation in preventing food waste), and the frequency of discounted product purchases [
45,
53]). Bozdağ and Çakiroğlu [
54] point out that many studies state that women generate more food waste than men; there are also some studies showing that men generate more food waste [
55,
56].
Stefan et al. [
57] pointed out the importance of shopping habits in terms of food waste and emphasize the perceived degree of ability to influence the result (perceived control). Moreover, Krisjanti, Quinta [
52] draw attention to the fact that food waste behaviour problems come from the food shopping behaviour; according to them, people tend to buy more food products than they need. Ammann [
58] also points to studies [
41,
59] that prove that those who regularly buy too much food out of habit, or who tend to buy discounted products, tend to waste more food. Lebersorger and Schneider [
60] examined the relationship between food waste and other factors, such as settlement structure (countryside or city), type of housing (single or multi-apartment houses), and distance to the nearest bio-waste sorting bins. The results of a case study by these authors showed a higher rate of food waste production in cities compared to villages, and in multi-apartment houses compared to single-apartment houses. Bozdağ and Çakiroğlu [
54] point to the fact that their study showed a significant negative association between the amount of food waste in households and age or living place. Neff et al. [
42] presents in their study that living in urban or rural areas does not have a significant impact on generating food waste. Richter and Bokelmann [
46] and Tokareva [
53] found in their research that households that wasted less were those of families living in villages. Research on household food waste also looks at what type of food is wasted most. The most significant source of food waste is perishable food, mostly fresh fruit and vegetables, bread, dairy products, meat and fish [
8]. Food waste production is often related to household consumption behaviour, based on research on food waste at the retail and consumer level. Buzby and Hyman [
35] identified three basic food groups that are wasted the most: meat, vegetables, and dairy products. Bozdağ and Çakiroğlu [
54] state that most wasted food categories vary by country—e.g., home-made foods and milk products in Finland [
61]; bakery products in Norway [
62]; fresh vegetables and salads in England [
32]; or pasta, fast food, previously-cooked meals, vegetables, fruits, and bread in Italy [
63,
64]. According to Bozdağ and Çakiroğlu [
54], the different food cultures may explain the reason for the differences in food waste.
It is clear from the available studies that food waste is influenced by the number of socio-economic and behaviour factors; therefore, this study focuses not only on finding out the amount of food wasted in Czech households but also on finding out these key factors and causes of waste.
3. Materials and Methods
In this study, the authors adopted a concept defining food waste as disposed of edible food. This food waste does not contain cuttings, skins, bones, and other parts seen as a necessary waste. Another term used in the article is biological waste or bio-waste. The term encompasses kitchen waste of plant and animal origin, beverage residues, household waste (e.g., house plants and their residues, animal feed of plant origin, pet beddings, etc.) and garden plant waste (grass, leaves, branches, etc.). A detailed structure of bio-waste, as used in the study, is shown below.
Studies [
32,
39,
65,
66] show that subjective estimates of how many households waste food differ from objective data. Therefore, the authors decided to combine objective and subjective data. For a holistic view of food waste in households, it was necessary not only to find out the real amount of wasted food but also to discover what motives lead to waste. Therefore, the authors proceeded to the triangulation of methods.
For the study were used three methods: mixed municipal waste analysis, quantitative research in the form of a questionnaire survey, which was followed by a deeper explanation of the causes of waste in households by in-depth interviews. Many papers [
42,
46,
53,
54,
67] confirm that the volume of wasted food varies depending on where households are located. Therefore, the waste analysis was divided into three specific locations—rural built-up areas, single family development and housing estates. The analysis of municipal waste was performed four times a year, in each season, in order to eliminate the effect of seasonality on the volume of food waste in households (the effect of seasonality is confirmed e.g., in [
68]).
To capture possible differences in food waste in different types of residential housing, three types of residential housing developments were distinguished in the research:
Rural built-up areas consisting mainly of households living in family houses with local heating by solid fuels. Such households have better access to waste incineration in domestic fireplaces. They also have the possibility of garden composting their biological waste or feeding it to domestic animals. In this type of development, the share of service facilities and small trade establishments is insignificant.
Single-family developments, i.e., urban residential areas with floor or local heating by gas or electricity. These dwellings have also access to garden composting of biological waste. Heating with solid fuels is negligible. The share of service facilities and small trade establishments is insignificant.
Housing estates, i.e., apartment buildings with centralized heat supply. These dwellings have no possibility of utilising their waste. The share of service facilities and small trade establishments is insignificant.
The research was based on collections and analyses of waste produced by about 300 households from each of the above-mentioned housing developments. From each type of development, three different localities were selected in the city of Brno and its surroundings, where the waste was collected and subsequently analysed together, from 100 households from each locality separately. Thus, in total, waste from 900 households was analysed. The authors used secondary data on the permanent residence of persons living along the analysed collection routes (the data were obtained from the municipal office in Brno) and determined the amounts of waste per person.
3.1. Objective Waste Measurement—The Mixed Municipal Waste Analyses
The mixed municipal waste analyses took place in the city of Brno and the surrounding areas. The waste produced in each type of development was analysed separately. The composition of mixed municipal waste was determined through sub-sample analyses (a sub-sample accounted for about 200 kg of waste). The quaternation method was employed for sample collection. When using the quaternation method, the sample (each sample was collected from 100 households from one type of development) is divided into four equal piles, while two opposite piles are removed, and the remaining piles are mixed and divided into four equal piles again. This procedure is repeated until a representative sample weighing about 200 kg is obtained [
69]. This representative sub-sample for the given housing development type is then examined in detail. Waste composition was determined by sieve analysis and manual sorting into predetermined substance groups (see below). 40 mm × 40 mm mesh-size sieves were used for the sieve analysis. The sub-sieve fraction was further divided into wasted food and other waste (therefore, in the sub-sieve fraction, waste components were not sorted in detail, see
Table 1). Subsequently, the authors determined the real amount of food wasted in the given type of housing development.
Collections and analyses of mixed municipal waste (MMW) were carried out in each season (spring, summer, autumn, winter) so that the authors could assess the seasonality of food waste production. The seasonality perspective of the research corresponds to changes in the basic characteristics of waste—for example, changes between heating and non-heating seasons, changes reflecting the summer holiday period, or changes in vegetation conditions. Specifically, waste collected in the summer of 2019, autumn 2019, winter 2020, and spring 2020 has been analysed. The COVID-19 pandemic affected only one analysis—the one carried out in the spring of 2020 when the COVID-19 pandemic broke out in the Czech Republic.
Data on mixed municipal waste were classified into the following substance categories: paper/cardboard, plastics, glass, metals, textiles, mineral waste (e.g., porcelain, bricks, rubble), hazardous waste (e.g., medicines, batteries, protective equipment against COVID-19), electrical waste, combustible waste (e.g., nappies, tissues, etc.), and biological waste. The table below lists biological waste categories distinguished within municipal waste analyses.
Quantitative data on food waste obtained from MMW analyses were processed using basic statistical methods, such as absolute and relative frequencies or averages.
3.2. Quantitative Research—Questionnaire Survey
In January 2020, the authors performed an electronic questionnaire survey to obtain subjective data on food waste. On the basis of the studies [
22,
50,
70], a questionnaire was formulated, the main aim of which was to reveal the causes and the reason for wasting food in households. The authors decided to do the survey mainly because the MMW analyses did not capture links to the subjects producing the waste, nor did they reveal the reasons why food was wasted. It helped to find out what are the main causes of food waste in Czech private households and to answer a previously determined qualitative research question “What are the main causes of food waste in Czech private households?”. As mentioned above, the level of waste can be significantly affected by household income, the number of households members, members’ age, or the frequency of shopping. These data could be gathered through a questionnaire survey. Based on established research questions and findings obtained from the literary survey, the authors determined the set of following statistical hypothesis.
Analyses of waste showed certain differences in biological waste compositions and in food waste amounts depending on the type of development the respondents lived in. Tokareva et al. [
53] comment on this in their study. Specifically, these authors talk about different attitudes of people in rural areas who live “closer” to food, often because they grow their crops. Similar observations were presented by Sosna et al. [
67]. Therefore, the logical step was to verify whether the questionnaire survey results would also support this assumption:
Hypothesis 1a (H1a). The amounts of food wasted by households living in a housing estate, a family house, a single-family development, or a rural-area family house differ.
Previous research [
8] suggests that the more often households make larger purchases, the greater the risk of food being wasted because the family does not have time to consume it. Therefore, the authors set the following hypothesis:
Hypothesis 2a (H2a). There is relationship between the frequency of large purchases of food and the amounts of food waste.
Food waste production is also affected by household income [
8,
14,
47,
51]; it comes as no big surprise that the higher the household income, the higher subjective estimates of food waste.
Hypothesis 3a (H3a). There is relationship between the net monthly income and the amounts of food waste.
It can also be assumed that with the growing number of household members the demands on food management increase and, thus, estimating the right amounts of food purchases becomes more difficult [
46,
47].
Hypothesis 4a (H4a). There is relationship between the number of household members and the amounts of food waste.
The generational difference is also a frequently discussed factor influencing food waste levels. Very often you can hear or read that younger people waste more [
14,
47]. The authors have also addressed this factor in their research. The following hypothesis was tested:
Hypothesis 5a (H5a). The amount of wasted food varies depending on (the respondent’s) age.
Lebersorger and Schneider [
60], Bozdağ and Çakiroğlu [
54], Richter and Bokelmann [
46] stated the influence of the place where the household lives on the volume of wasted food in their studies. Based on this, the last hypothesis was formulated.
Hypothesis 6a (H6a). There are differences in the causes of food waste between different types of housing developments.
Moreover, in a questionnaire survey, subjective data on perceived amounts of food waste (subjective estimates) can be obtained. Such data provide a comparative basis for the results of objective food waste analyses. This provides a deeper insight into the difference between the perceived and the objective amount of wasted food.
Due to the pandemic situation, the questionnaire was disseminated only in electronic form through the social network, and it was targeted at various city districts in Brno. The research team, thus, had to abandon the semi-structured interview conducted by the interviewer, which was intended, and the selection of respondents is conceived as a random selection. The questionnaires were fully completed by 395 respondents (households living in Brno) classified into the three housing development types described above. It should be noted that the questionnaire survey was not conducted in those specific households where the waste analysis was performed. The respondents were residents of the city of Brno and surrounding areas. The average Czech household has 2.43 members [
71].
The basic characteristics of the questionnaire’s respondents are shown in the overview
Table 2.
The data obtained by the questionnaire survey were used for the statistical testing of research hypotheses. The authors employed the Kruskal–Wallis test for testing the hypothesis of distribution congruence between multiple independent samples (Hypothesis 1b, Hypothesis 5b). This test is suitable for ordinal quantities that do not have a normal distribution. Other hypotheses were tested by Spearman’s coefficient of ordinal correlation. The coefficient is used for testing the dependence of ordinal characteristics. This test was employed for testing the Hypothesis 2b, Hypothesis 3b, and Hypothesis 4b [
72].
3.3. Qualitative Research—In-Depth Interviews
As said above, only one of the MMW data collections (spring 2020) was affected by the pandemic. Therefore, to understand the deeper context of waste production, food management, and food waste in these specific conditions, the authors conducted in-depth interviews with respondents from different types of households. Fourteen people were contacted, and 10 agreed to participate in an interview. The basic characteristics of the interview’s respondents are shown in the overview
Table 2 above. The questions were determined based on the quantitative survey, to further clarify the causes and reasons for the findings of the questionnaire survey. During the interview, questions related to the respondent’s behaviour, perceptions, and opinions were asked. The answers revealed how the households behaved during the pandemic and enabled the authors to assess the most significant changes.
4. Results
The presented research is unique, especially in the way it enables comparisons of subjective and objective data. The research aimed to reveal the actual amounts of food that end up in mixed waste. The subjects were anonymous and did not know about the measurements of food they threw away. This eliminated the risk of distortion of data. Simultaneously with the experiment, the authors have also conducted a quantitative questionnaire survey to clarify the causes of waste and the ways households manage their food. The survey also aimed at identifying people’s willingness to address the issue of food waste, as well as finding appropriate support channels in the fight against waste. Based on the findings, the authors could compare whether the actual amounts (measurements) and reported amounts (questionnaires) of food waste corresponded. The qualitative data obtained through in-depth interviews helped the authors to understand the food waste behaviour in more detail.
4.1. Objective Quantities—Actual Amounts of Food in Municipal Waste
As was mentioned above, the experiment included 900 households from three selected types of housing developments, namely housing estates and single-family and rural developments. There were approximately 300 households from each type of development, where the analysis of mixed municipal waste was performed (see
Figure 1).
4.1.1. Individual Types of Housing Developments—Waste Quantities
The average amount of mixed municipal waste was 217.1 kg per person per year, of which 105.9 kg (49.0%) was biological waste. Most biological waste per person was produced in rural developments—121.6 kg per person per year (51.32% of mixed municipal waste). In housing developments, the biological component of waste accounted only for 45.3% of the total amount of waste (99.33 kg per person per year). However, a detailed look at the biological waste composition in rural and single-family developments shows that there was a significant portion of garden plant waste such as grass, branches, sawdust, leaves, etc., rather than food intended for consumption—see
Figure 2. The research aimed at food waste (i.e., food intended for consumption) only. Therefore, the values have been adjusted for the necessary waste such as shells, bones, tea and coffee grounds, etc. The results showed that most food is wasted in housing estates, namely 53.6 kg per person per year (18.7% of total waste), then in single-family developments—32.7 kg per person per year (16.2%), and then in rural areas where food waste accounted only for 29.1 kg per person per year (14.1% of mixed waste). However, we cannot say the consumers living in housing estate are wasting more. The results probably point at different food storage conditions, as well as limited possibilities for further utilization of leftover food (feeding, composting etc.).
When taking into account all types of developments and averaging the amounts of food wasted in the entire sample (
n = 900 households), the objectively measured amount was 37.4 kg of food waste (excluding necessary waste) per person per year. Similar results were published by, for example, Dutch researchers, who reported a slightly lower rate of food waste (30.4 kg per person per year—see Grasso et al. [
73]). As for Danish consumers, Halloran et al. [
25] speak of 42 kg of food waste per person per year. Another study into food waste in the Czech Republic even speaks of a lower waste amount (25 kg per person per year), however, these are only estimates based on Eurostat data [
9].
4.1.2. Seasonality in Waste Production
One of the factors potentially affecting the results of research into waste is the season in which data are collected. There is a large number of seasonal aspects that can affect food waste amounts. Even though the impact of seasonality on food purchases and management is obvious, very little information can be found in scientific studies. Seasonality can be the reason why reported food waste amounts may differ during the year. In other words, research results may be affected by the time of year in which data collection took place.
To exclude seasonality, the authors collected data four times in one year. This gave them the idea of the variability of biological waste amounts during the year. The authors identified seasonal differences in food waste production (see
Figure 3). This finding corresponds to the study by Adelodun et al. [
68] who were also one of the few to address this factor. Apparently, food is wasted more during the harvest period. It may be because people do not have time to process the crop, because fruit and vegetables are cheaper at this time of the year, or because many people go on holiday and, therefore, do not care about food management so much.
From the total amount of 37.4 kg of food waste per person per year, most food waste was produced in summer (33.2%, i.e., 12.4 kg of food waste found within summer collections), then in autumn (31.8%, i.e., 11.9 kg of food waste), in winter (19,8%, i.e., 7.4 kg of food waste), and the least food was wasted in spring (15.2%, i.e., 5.7 kg of food waste).
These proportions applied to all types of developments, except for single-family developments where a slightly higher amount of food was wasted in autumn (11.5 kg) than in summer (8.6 kg). An interesting finding was that households living in all types of developments produced the least waste in the spring season. Thus, we can observe a declining trend in the amount of wasted food (see
Figure 3), but it is necessary to point out that the last observed period was a lockdown within the COVID-19 pandemic. Therefore, it is not possible to conclude that generally, people waste less during the spring. Since the amount of wasted food changed throughout the year, it was important to identify the causes of these changes and to examine the structure of food waste.
The total amount of collected municipal waste, which was analysed in the study, varied as follows in the individual seasons: in the summer of the reference year, it was 2360 kg, in autumn it was 1944 kg, in winter it was 1654 kg, and in spring it was 1795 kg. It can be seen from this data that not only the amount of food waste has changed within the individual seasons, but also the total amount of municipal waste that households produce.
4.1.3. Structure of Waste—Wasted Food
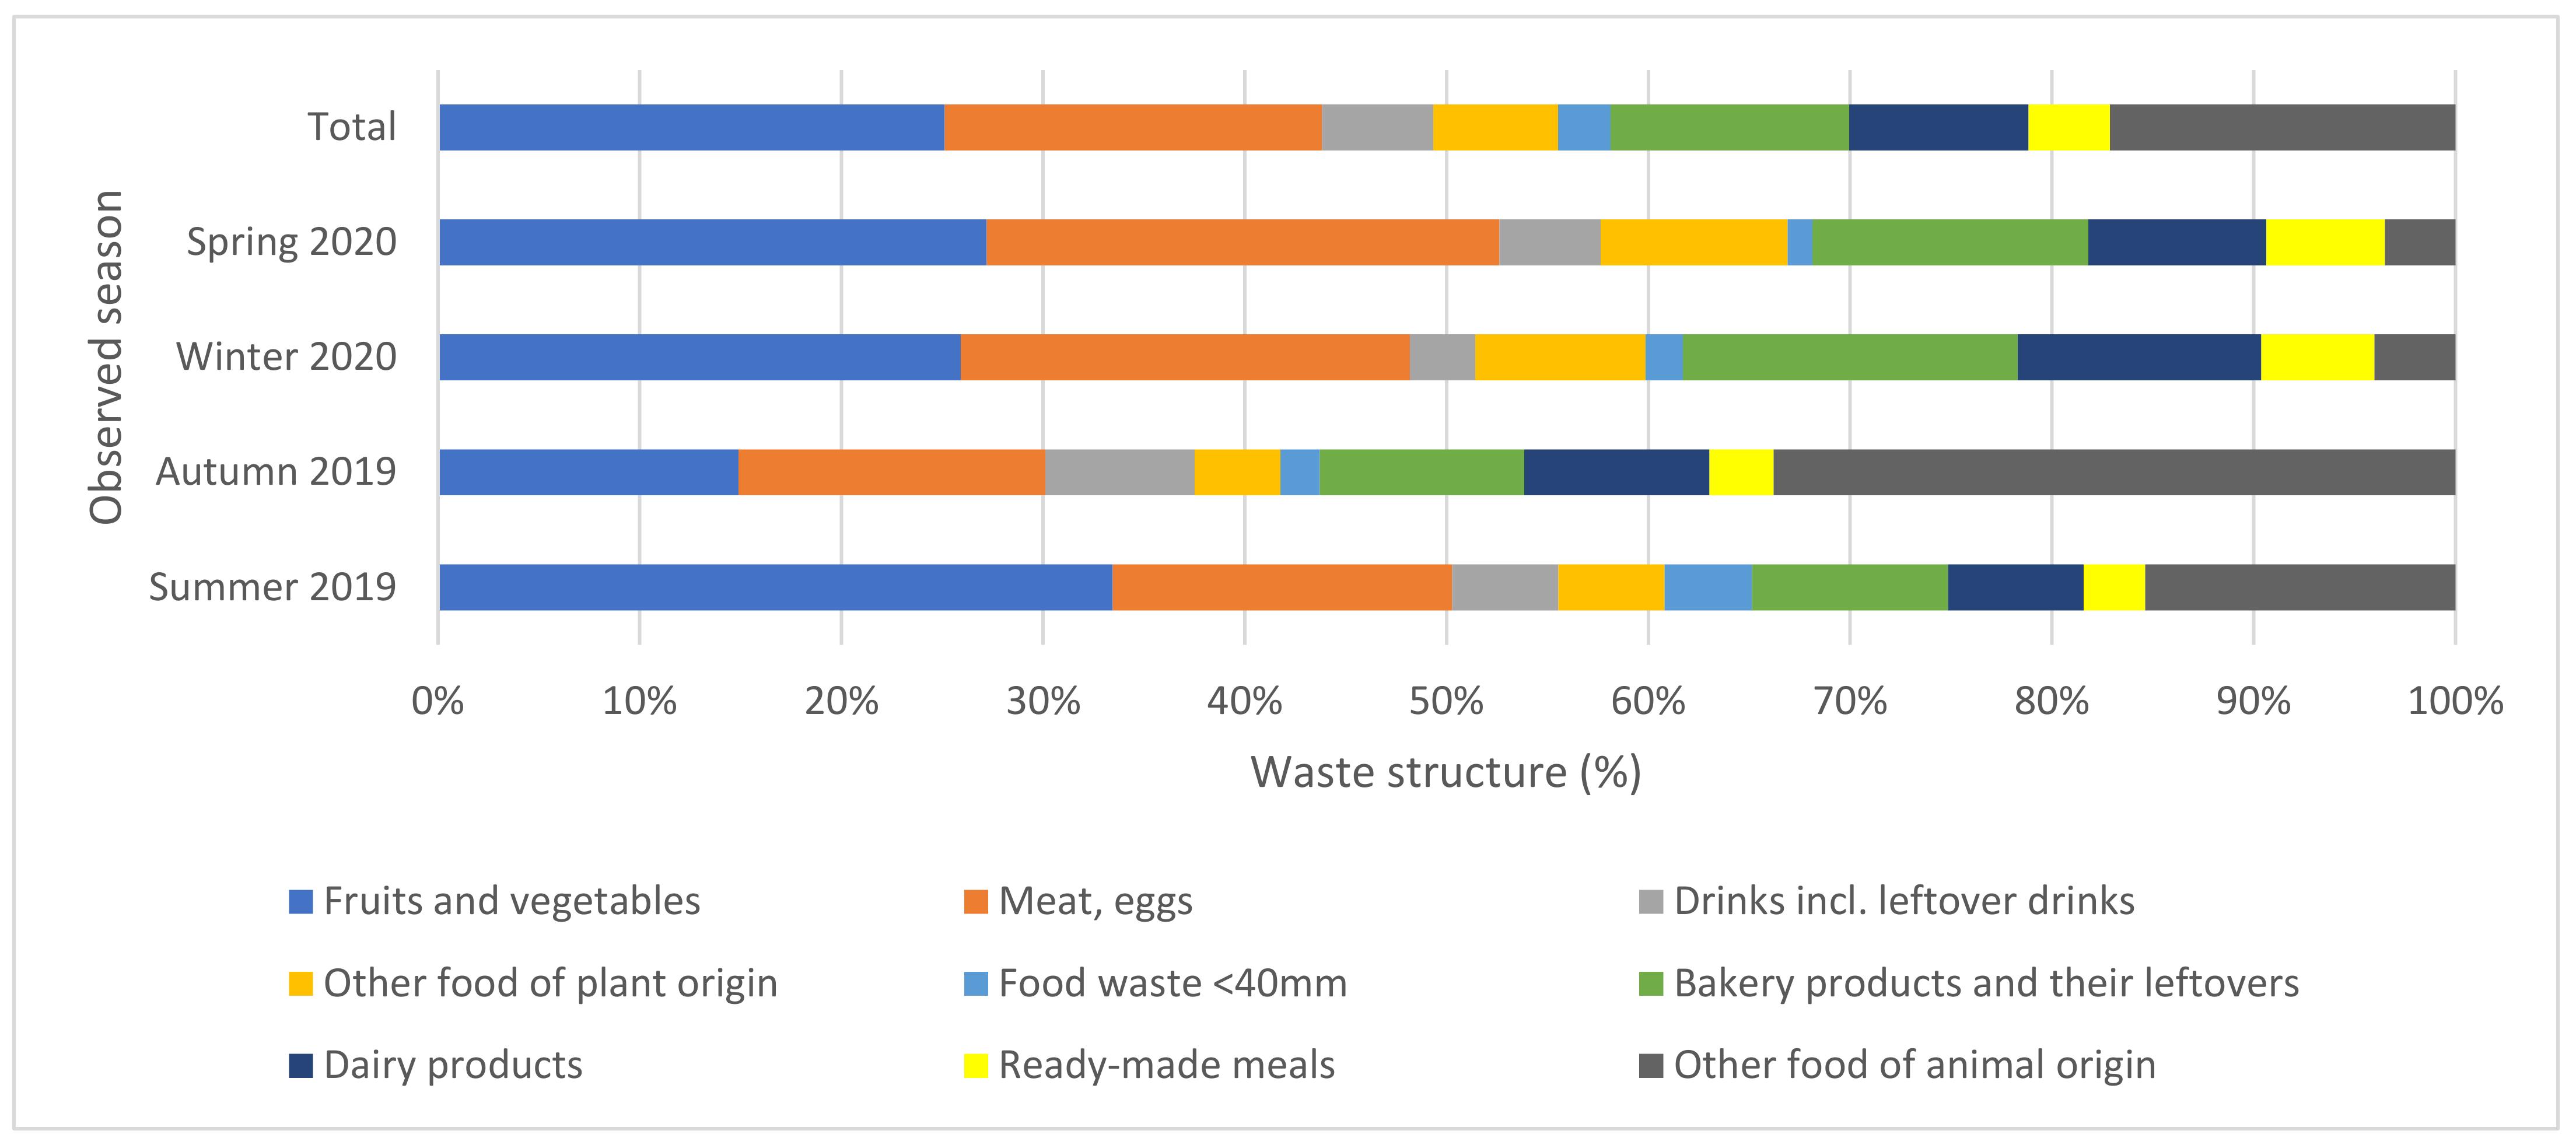
A key prerequisite for reducing household food waste is identifying the composition of waste and finding out what is wasted most. In addition, information on the composition of food waste allows for a better interpretation of seasonal fluctuations and identification of reasons for increased waste in the summer and autumn months. The following chart (
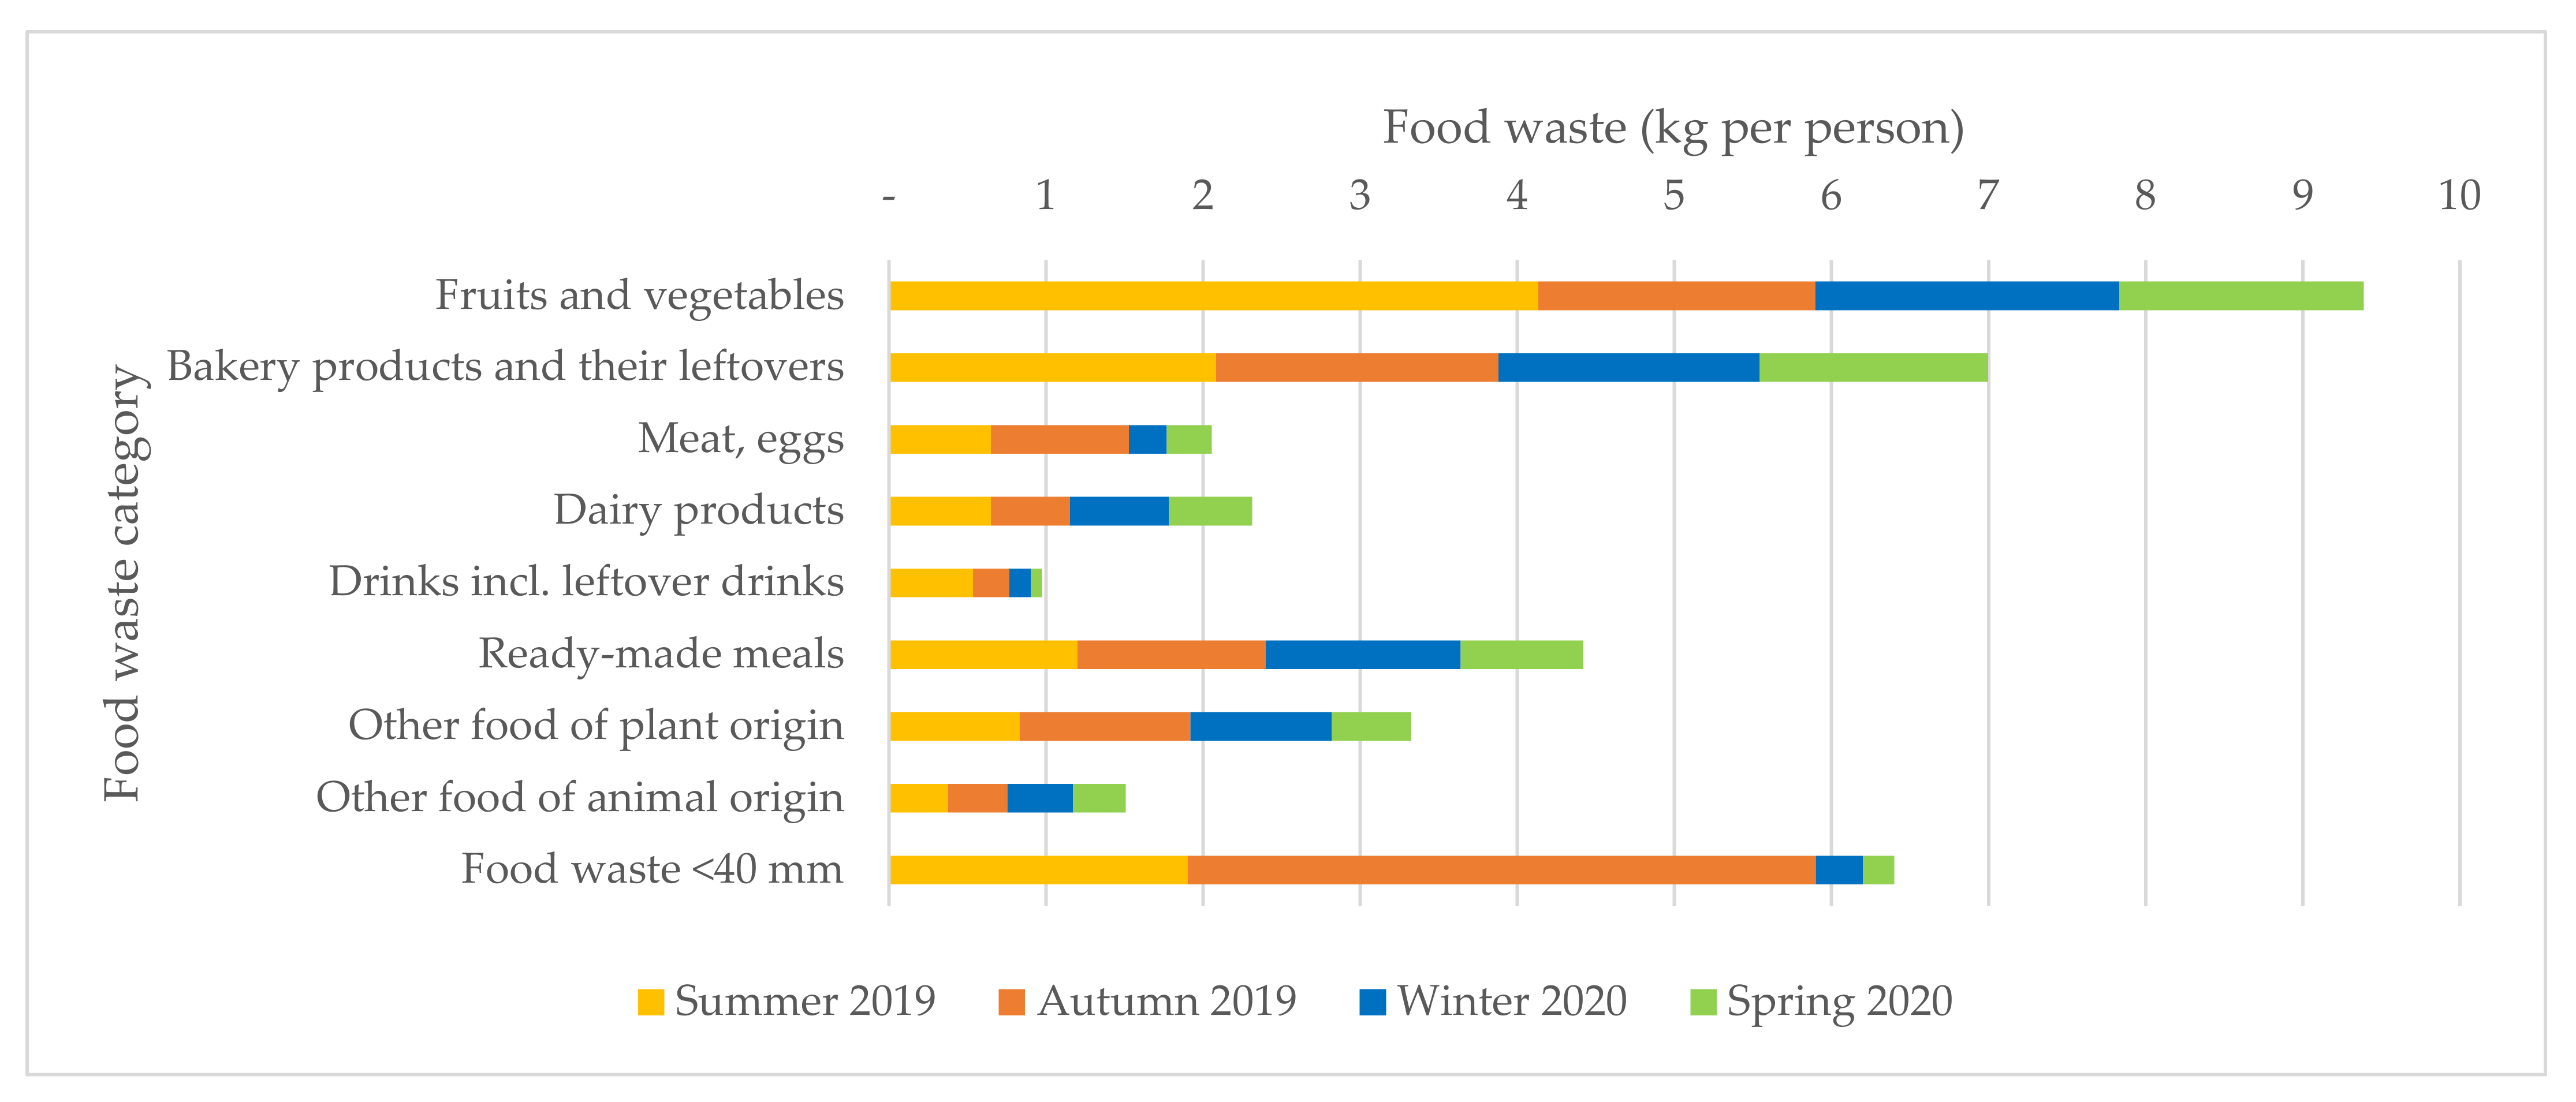
Figure 4) shows food waste structures in individual seasons.
Overall, households waste fruit and vegetables the most (25.1%, i.e., 9.4 kg per person per year), then baked goods and leftover bakery products (18.7%, i.e., 7 kg per person per year), and ready meals (11.8%, i.e., 4.4 kg per person per year). For illustrative reasons, the authors converted the quantities into specific foods from individual categories. For example, an average person wasted about 28 eggs, 13 yoghurts, 163 rolls, 188 carrots, and 28 food servings (250 g per serving) during the year.
There was a significant share of food waste in the sub-sieve fraction (17.1%), but this waste has not been broken down into categories. It is because these are small pieces of food—mostly meal and side dish leftovers (
Figure 5).
We can see dramatic seasonal changes in food waste structure, especially in the “Fruit and Vegetables” category where there was a significant peak in the summer period. Out of the total amount of fruit and vegetables wasted per year (9.4 kg), as much as 44% (4.1 kg) falls within the summer season. There has also been a notable seasonal difference in the meat and eggs category where the amounts of wasted food decreased significantly in winter and spring. This can also be attributed to the slower perishability of food in the colder months. Last but not least, there have been significant seasonal differences in food waste amounts in the sub-sieve fraction (a huge increase in autumn).
4.2. Subjective Quantities—Questionnaire Survey Results
As outlined in the introduction, there is a noticeable difference between how people perceive the amounts of food they waste and what the actual food waste amounts are. This assumption has been confirmed by a quantitative survey with 395 respondents—households. The respondents were asked to estimate the amount of food wasted in their household per week. The average amount of food waste, as subjectively perceived by the households, was 12.3 kg per person per year. Seventy-eight percent of respondents said their household wasted up to 0.5 kg of food per week. However, the reality is different—the actual amount of food waste in mixed municipal waste was 37.4 kg per person per year. This means that an average household (2.43 household members—see [
71]) wasted 1.7 kg of food per week. A further comparison of annual values shows that the estimated food waste amounts were almost two thirds (67%) lower than the actual amounts. People often do not realise they waste so much.
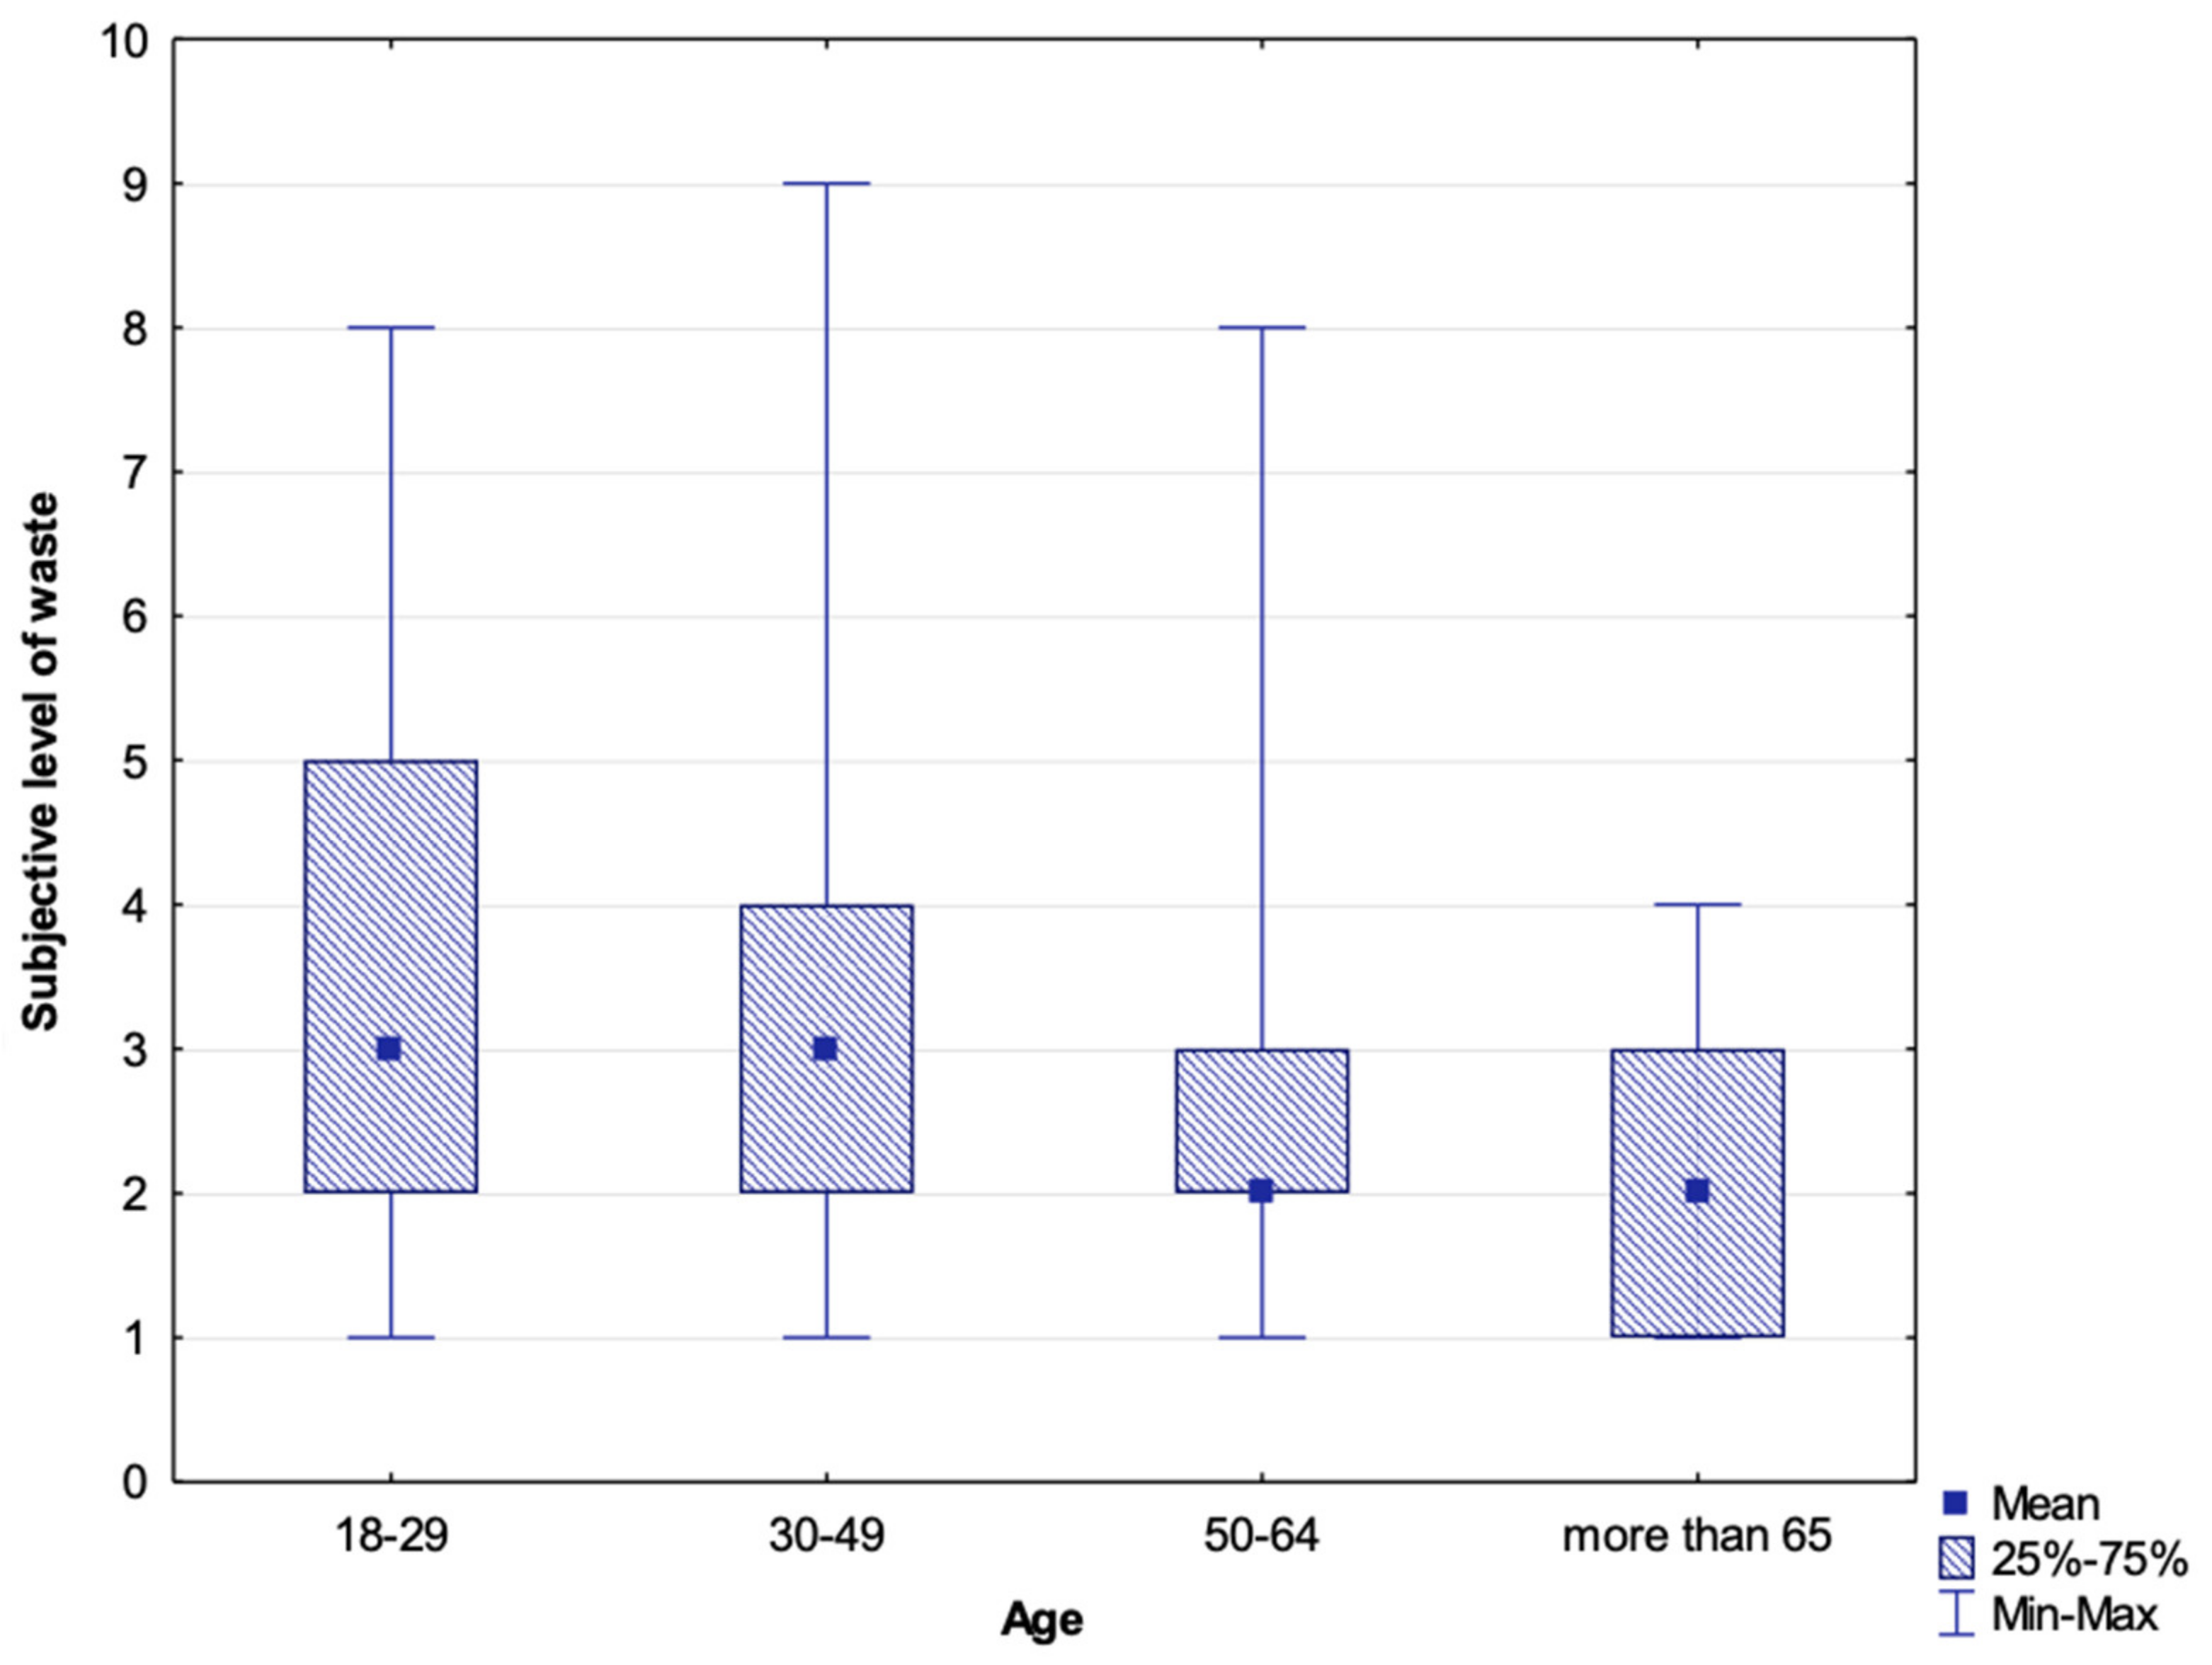
The following chart (
Figure 6) shows subjective assessments of food waste rates, where respondents indicated the level of waste in their household on the Likert scale (1 = we do not waste food and 10 = we waste a lot of food). Most respondents (85.1%) said their waste rate was rather low (which corresponded to values 1–5 in the chart). The graph (
Figure 6) also shows that the younger generation subjectively perceives themselves as more food wasting, however, their perception of their own food waste is very low, the mean value corresponds to a value of 3 on a scale of 1 to 10.
We comment on the issue of differences in food waste for different generations below (see testing of Hypothesis 5b).
4.2.1. Factors Influencing Waste Rates in Households
This sub-chapter evaluates variables that may affect subjective perceptions of weekly food waste amounts. Waste analyses showed some differences in the composition of bio-waste and in the amount of food waste depending on the type of development in which the respondents lived, household income, the size of purchases made, the age of the respondents. The authors determined the set of hypothesis (see Methodology part,
Section 3.2) and the following null hypotheses were statistically tested:
Hypothesis 1b (H1b). The amounts of food wasted by households living in a housing estate, a family house, a single-family development, or a rural-area family house do not differ.
The respondents gave their estimates on the weekly amounts of food they wasted. The hypothesis was verified by the Kruskal–Wallis test (
Table 3). The null hypothesis, however, could not be rejected at the 5% level of significance,
p = 0.2315. Even though the data on the actual food waste showed differences between individual types of development (
Figure 2), in the case of the subjectively perceived amounts of waste the differences were statistically insignificant.
Other variables included in the research related to households’ shopping behaviour. The households were asked how often and where they made purchases and how large their purchases were. The results showed that smaller purchases were much more frequent—48.9% of respondents even said they never made large purchases (above CZK 1500). Small purchases (up to CZK 200) were a common part of households’ routines as 71.6% of respondents said they made such purchases several times a week. By far the most food purchases were made in supermarkets and hypermarkets (89.6%), which is in line with other research—see, for example [
74]. Online purchases came second (5.3%), which may have been a somewhat surprising finding, ahead of shopping in smaller specialized shops (3%). This trend is likely to intensify in the future, as the pandemic accelerates the shift from traditional to online shopping.
Hypothesis 2b (H2b). There is no relationship between the frequency of large purchases of food and the amounts of food waste.
The dependence was tested by Spearman’s rank correlation coefficient (
Table 3). The authors have rejected Hypothesis 2b at the 5% level of significance (
p = 0.0001) and accepted the alternative hypothesis. The more often a household makes large purchases, the higher their estimate of average weekly food waste production. However, Spearman’s rank correlation coefficient is low (0.27) and, thus, this is a weak dependence.
Hypothesis 3b (H3b). There is no relationship between the net monthly income and the amounts of food waste.
Moreover, in this case the authors have rejected the null hypothesis (
Table 3). Spearman’s coefficient of rank correlation (0.20) showed a weak dependence. Specifically, there was a direct proportion between increasing net monthly income and amounts of food thrown away.
Hypothesis 4b (H4b). There is no relationship between the number of household members and the amounts of food waste.
Since the resulting p-value was 0.0000, the authors accepted the alternative hypothesis. Spearman’s coefficient of rank correlation (0.25) showed a weak dependence between the variables. It means that the more members a household has, the higher its average weekly food waste production.
Hypothesis 5b (H5b). The amount of wasted food does not vary depending on (the respondent’s) age.
As you can see (
Table 3), this dependence was tested by the Kruskal–Wallis test. Moreover, in this case, the null hypothesis was rejected at the 5% level of significance. Therefore, the authors proceeded to
p-value comparisons. The results showed differences in average weekly food waste levels depending on the respondent’s (household representative’s) age. While in young people’s households (aged 18–29) and middle-aged people’s households (30–49 years), the most commonly reported weekly food waste amount was “up to 0.5 kg”, in households of seniors (the age category of 65 and above) the most frequent answer was “less than 50 g”. Furthermore, no senior reported they wasted more than 0.5 kg of food per week, while this option was chosen by about a quarter (24%) of young people aged 18–29 and a quarter (25%) of middle-aged people aged 30–49.
4.2.2. Waste Structure—Bakery Products vs. Fruit
The detailed analysis of food waste found in mixed municipal waste showed that the most wasted category were fruits and vegetables (
Figure 4). As for the subjective waste rate perception, the respondents said they wasted pastry most (
Figure 7). As many as 14.1% of respondents said they threw away bread at least once a week, and another 25.6% of respondents said they wasted bread two to three times a month. However, vegetables and fruits were right after pastry (19.6% of households said they threw away vegetables and fruits at least twice a month). In the third place—like in the primary measurements—was home-cooked food (16.4% of households said they threw it away at least twice a month).
Most studies into the subject of food waste confirmed the findings of the primary research (direct analyses of municipal waste). Due to their perishable nature, fruits and vegetables are generally the most wasted food category [
8,
14,
61]. The fact that bakery products are relatively cheap may also be one of the reasons why this food category is the second most wasted one. As for home-cooked meals, the thing is it is often very difficult for households to estimate the appropriate amounts to cook.
4.2.3. Causes of Food Waste
Giordano and Franco [
40] said there was no other use for food thrown away by households and, therefore, prevention was the only way how to combat the issue of food waste and its effects. To make prevention possible, it is essential to know the causes of food waste. For this reason, respondents were also asked what waste-related factors they considered most critical.
Figure 8 shows that the most frequently reported factor was the spoilage of food during storage—it was reported by 58.7% of respondents, mostly belonging to the younger age group (18–29 years). Other frequent factors included exceeding the date of minimum durability or shelf life, and the fact that households often cook more food than they consume. This food then ends up in mixed municipal waste. The survey also shows that the cause of food waste is very rarely deterioration before food storage or damaged package. On the contrary, one of the important sources of waste is the inadequate quality of purchased food.
However, is it possible to distinguish between the causes of food waste in housing estates and rural areas? The authors set the following hypothesis:
Hypothesis 6b (H6b). There are no differences in the causes of food waste between different types of housing developments.
All the reported causes of wasting were tested by the Kruskal–Wallis test (rated on a scale of 1–10 where (1) was the least common cause and (10) the most common cause). Only for the “Excessive yield of own crops” the null hypothesis was rejected (p = 0.005) and a statistically significant difference was found. This cause of waste was more common for households living in rural areas (median value = 3) than for households living in housing estates (or in single-family developments, median value = 1). As for other causes, no differences in evaluations were identified between households living in housing estates, single-family developments, and rural areas.
Of households, 85.3% said food waste was an important issue, and 77.6% of these households feared that this would be a major threat in the future. As many as 76.2% of respondents believed that food waste should be given more attention, and 65.8% of respondents said they were interested in the topic and would welcome more information, including guidelines on ways how to reduce household waste.
Regarding the specific forms of consumer support in this field, the households would prefer the following ones: recipes and tips on what to do with leftover food (67.9%), better information about the appropriate storage of various types of food (59.8%), better awareness of meanings of minimum shelf life and usability (54.4%), and better awareness of impacts of food waste on the environment (49.1%). The data also showed that a change can be achieved, above all, through the planning of purchases by the family needs for the following week, and through checking the condition of already purchased food. Households that check their food stocks before they go shopping produce less waste.
4.3. Impact of the Pandemic
As mentioned above, part of the data collection was affected by the COVID-19 pandemic. This fact could, therefore, also affect the actual measured amounts of household food waste and, thus, affect the results of the survey. The questionnaire survey took place in the winter of 2020 when the impact of the pandemic on the Czech Republic was not yet noticeable. People were often unaware of the danger and, therefore, the subjective assessments of waste levels were not affected by the pandemic situation. On the other hand, the last measurement (spring 2020) took place during the lockdown and this fact most likely affected the last analyses of waste. There have been many studies into how the pandemic affected food waste [
75,
76,
77,
78].
The primary data clearly showed that food waste levels decreased compared to other seasons. Only 15.2% of the total annual food waste was produced in the spring season. The obvious question was whether the structure of food waste also changed. As regards this point, no significant deviation was found, i.e., food waste structure remained the same—see
Figure 9.
The analysis of municipal waste showed that in the spring of 2020, there was a change in the amount of food waste. It was necessary to look for the causes, so the authors used online in-depth interviews to learn about the significance of changes the new regime brought to the households—the results of the online interviews are summarized below. Ten respondents from different families living in different developments were contacted.
The greatest changes reported concerned the frequency of shopping. Most households that used to shop every day or every other day have limited their shopping to once or twice a week. (Only one respondent said they did not change their shopping behaviour and went shopping as often as before). The lower frequency of shopping led the households to think more about the food they needed, i.e., to plan their consumption. The respondents said they made shopping lists more often so that they would not forget anything. Due to this, on the other hand, they started making larger purchases than before. The respondents said they spent more time cooking and had a better overview of food they had at home, including better awareness of the expiration dates of their stock of food.
The most popular shopping venues have still been supermarkets, mostly because they offer convenient parking, larger assortment of goods, and advantageous special offers. Nevertheless, online food sales increased as well and seven out of 10 respondents said they had bought food online at least once. The pandemic also affected preferred methods of payment—three respondents out of 10 said they paid in cash before the pandemic, now only one in 10 respondents uses this method of payment. In addition, some respondents said they started to save more and reduce their costs. Respondents bought more durable food but said they kept only small food stocks. Most often, they kept extra sugar, flour, rice, pasta, and long-life milk. Last but not least, some respondents said they bought more canned food, such as beans or tuna, and also frozen foods.
4.4. Research Limitations and Further Study
In this study, triangulation of methods is used to gain a holistic view of the issue of food waste. However, the study also has some limitations. Firstly, it could be mentioned, that our measurements are still based on a large number of assumptions. As already mentioned in the methodology, data on food waste volumes were obtained by analysing municipal waste produced by a sample of 900 households in three types of residential housing developments, i.e., 300 households from every type of development. From each type of development, three different localities were selected in the city of Brno and its surroundings, where the waste was collected and analysed together from 100 households from each locality separately. This number of households was determined according to the number of natural persons who have permanent residence at the given address. However, we cannot guarantee that this number is exactly in line with reality. Furthermore, it is not possible to filter out phenomena such as the possible departure of some families away from home (they do not produce waste in the monitored area) at the time of the experiment. As well as the fact that they regularly take out waste every week. Furthermore, we only know the total quantities for every 100 households from the nine waste collection routes, but we are not able to measure the amount of waste for each household separately.
Due to the complexity of collecting objective data, it was not possible to perform the analysis in areas further away from the larger city. The company that collected the waste for the experiment does not cover remote locations with the collection routes. Families living here may then show other eating habits.
It is also difficult to distinguish the effect of the season and the COVID-19 pandemic, as spring 2020 was affected by the pandemic situation. It is not possible to reliably describe how the amount of food waste develops during the year because we do not know to what extent the seasonal change has manifested itself and what weight the reduction of waste in the spring can be attributed to the lockdown during a pandemic.
Last but not least, for each questionnaire, the reliability and accuracy of the data can be compromised by various limitations, such as the honesty of the participants. In addition, the participant may unconsciously improve.
Our study provides an opportunity to expand knowledge on food waste only at the regional level. Consumer behaviour across different cultures could be highly inconsistent about food.
The issue of food waste still raises many unanswered questions, the authors continue to collect data through the analysis of mixed municipal waste in the next two years. Longer collection times may help to better understand household behaviour, identify the causes of waste and find suitable methods to reduce food waste.
5. Discussion and Conclusions
Many studies point to the fact that households are the main producers of food waste [
7,
8,
11,
13]. As the need to address the issue of food waste grows, food waste produced at the household level is being examined from various angles. According to Giordano and Franco [
40], the number of Scopus-registered research studies into food waste produced at the household level has increased 10-fold in the last 10 years.
As mentioned above, it is very important to realize that there are many methodologies for measuring amounts of wasted food, and, therefore, values presented by different institutions may vary considerably. In terms of parts of the food chain, the last one—i.e., the amount of food wasted at the level of final consumers and households—is generally the hardest to measure. Some of the studies aimed at objective identifications of food waste in municipal mixed waste—mainly through analysing mixed municipal waste [
39,
60,
62,
67]. Other studies were based on subjective monitoring of food waste, mainly through questionnaires [
79,
80,
81,
82]. The authors of these studies often discuss the advantages and disadvantages of the methods they used. The reported amount of food wasted by households is often only an estimated value calculated based on information from a set of respondents, thus, the estimates tend to be inaccurate [
39,
65]. Consumers tend to make themselves look better—whether knowingly or not—and undervalue the amounts of food they throw away by up to 40% [
32]. The abundance they live in prevents them from seeing how significant their contributions to the overall alarming amount of food waste are. A more accurate form of research are diary records in which consumers put detailed information on the food they do not consume and throw away. The fact that respondents have to make the records can affect their consumer behaviour and the results tend to be skewed to a certain degree. Undistorted results can be obtained only by empirical measurements of leftover food found in the garbage—see Ilakovac et al. [
14]; Elimelech et al. [
83]. It is also very important to ensure that the observed subjects are not aware of the measurements taking place in their area. However, the financial, time, and also personnel demand of such empirical research often pose a problem for researchers [
37]. Studies based on subjectively ascertained data predominate in the scientific literature—Herath and Felfel [
34] pointed out that studies based on objective data collections and direct weighing of food waste are still rather rare. Grainger et al. [
37] added that given the high cost of measuring household food waste directly, conclusions of most studies stem from questionnaire-based self-assessments by households. The subjective surveys are most criticized for underestimations of food waste amounts by consumers [
39,
65].
This study is unique because it is based on high-quality, objectively determined primary data obtained by mixed municipal waste analyses. Subjective data not detectable by this method (e.g., reasons for wasting food or linking the issue of food waste to characteristics of those producing the waste) were obtained by questionnaire surveys and in-depth interviews. In this study, triangulation of methods was used.
Based on the mixed municipal waste analyses the authors found out that on average 105.9 kg of biological waste per person per year ends up in the bins, of which 37.4 kg per person per year is wasted (this means edible parts of food, i.e., the avoidable food waste). According to Beretta et al. [
18], most avoidable food waste is produced at the household level, and avoidable food waste can be prevented and has the greatest potential in terms of possible reduction and usability in tackling environmental problems. Giordano and Franco [
40] added that the only way to address this problem and its effects is through prevention. Based on the identified causes of wasting and the in-depth interviews, the authors concluded that the search for effective intervention modes has to take into account households’ preferences. Furthermore, prospective media strategies will have to reflect target groups’ ages. There is no universal way to reach all households as each household has members belonging to different generations, and every generation has their specific needs. Despite this fact, short videos broadcast through online formats appear to be one of the most effective forms of disseminating information. This is because short videos are best for attracting viewers’ attention and the online environment is a low-cost alternative enabling reaching a wide audience even in the current pandemic times. The videos should have a positive and motivating tone, but also be instructive. Consumers prefer specific tips and advice on how to reduce household waste production.
When taking a closer look at the issue of food waste produced by households, we can see that households living in urban developments—especially housing estates—produced the most waste. The reason is these households have limited possibilities of utilizing their biological waste and, therefore, almost all their food waste ends up in mixed municipal waste. On average, this means 53.6 kg of food (avoidable food waste) thrown away per person per year. The least food is wasted by households living in rural areas. These households waste about 29.1 kg of food per person per year. The fact that more food is wasted in towns and cities than in rural areas has also been proved by Lebersorger and Schneider [
60], Hanssen et al. [
62], and Tokareva et al. [
53]. Our results are consistent with the findings by these authors. There are several possible reasons for this—for example, the possibility of composting leftover food or feeding it to domestic animals. According to Tokareva et al. [
53], the reason for lower rates of food waste in or near rural areas is a closer relationship people living there have to their food—they can see the crops grow and know how much effort it costs to grow their food. These findings apply to the general concept of a European consumer and are in line with the results found for Czech households.
As for the structure of the foods that are thrown away the most, these are mainly fruits and vegetables, bakery products, and ready-made home-cooked meals. These results correspond to the findings by Parfitt et al. [
8] and Silvennoinen et al. [
61]. The reason food belonging to these categories is wasted so much is mainly its perishability [
8,
61]. Parfitt et al. [
8] add that the structure of food waste is largely related to households’ consumption habits. When considering seasonality, most food waste is produced in autumn and summer. However, there are only a tiny number of studies mapping seasonality factors in food waste production. The reasons are the complexity of data collection and high costs. This is why the extent of data and results presented in this study are so unique—the data on food waste creation cover all seasons, which allows for identifying seasonality in food waste production. The influence of the measurement period on the identified amounts of food waste has been proven by, for example, Wenlock et al. [
84] who monitored food waste production in summer and winter. They found out that more food was wasted in summer than in winter, which is in line with our findings. The Korean study [
68] also describes the different amounts of food waste depending on the season and also points to lower wastage rates during winter and spring. In our research, on average 12.4 kg of food (per person) was thrown away in summer and 7.4 kg in winter. Higher food waste in the summer months could be associated with limited storage options during these higher temperature months. It is, therefore, possible to point out the importance of proper storage and equipment for proper food cooling in households. That means knowledge of how to keep fresh food longer is essential [
85]. There are several possible reasons for higher food waste in autumn, households switch from the “holiday regime” (households with children eat at home more often) to the “eating-out school regime” and before families switch to the new regime and set up their food management properly, they may buy unnecessarily large amounts of food, which is then wasted. This is also the season when, for example, apples and pears ripen and, therefore, crop surpluses end up in the rubbish bin more often—this especially applies to rural and residential areas. People wasted food the least during the spring, 5,7 kg. However, households’ consumer behaviour was most likely influenced by external circumstances, as the COVID-19 pandemic broke out during the spring.
Why do consumers waste food? This question could not be answered through analysing mixed municipal waste—this method provides objective data (which is its great advantage), but does not encompass the link to the household, i.e., the producer of waste [
83]. Therefore, to identify the reasons behind food waste, we have conducted an additional questionnaire survey. The survey results showed that the main reason was food deterioration due to exceeded dates of minimum durability or shelf life. The other reason was that households often cook more food than they consume.
The questionnaire survey results also revealed how well Czech consumers are able to estimate the amount of food they throw away.
Figure 7 shows that households’ estimates of the amounts of food they wasted were very poor. Subjective estimates differed from the objective primary data by about 67%. This corresponds to the findings by van Herpen et al. [
65] and van der Werf et al. [
39].
The effect of the pandemic on households’ food management is indisputable. The changes, which have been observed and discussed with selected households, are in line with the results of the spring measurement. This measurement was affected by the first wave of the pandemic and was characterised by a significant decrease in the amount of wasted food (5.7 kg per person, 15.2% of the total annual total waste). Qian et al. [
77], and Schmitt et al. [
76] also pointed out lower waste rates during the pandemic. On the other hand, as regards the structure of waste, no statistically significant deviation from the period before the outbreak of the pandemic has been found. All households reported they planned their purchases more thoroughly in the pandemic—they thought more about what they needed to buy and made purchase lists. However, planning often requires advanced experience as it is not always easy to estimate the amount of food needed, especially with the growing number of household members. Skills in food management often come with experience—in some cases, older people are better at planning the required amounts of food and, therefore, waste less (see Hypothesis 5b). The elderly generally spend more time at home and, thus, have more time to manage their food supplies and process those approaching expiration dates [
77]. Shopping habits are also changing with households shopping less often and buying more or buying food online.
The status and composition of food waste generated by Czech households included in the measurement were investigated by examining two important influencing factors of seasonality and housing types. The study indicated that food waste production differs significantly according to housing development and the seasons. Of the three different types of housing considered, the highest level of food waste production was in housing estates. Likewise, the amount of discarded food varies depending on the season. The most food is wasted in summer and autumn, regardless of the type of housing development. During the COVID-19 pandemic and lockdown (spring 2020), the food-wasting was significantly lower. Qualitative research points to changes in food management of families in this period. The findings of this study also indicate that there is a significant difference between subjectively perceived and objectively measured amounts of wasted food. The results of this research can, thus, become a valuable basis for the development of intervention strategies to prevent waste.


