Article

Numerical Study on Natural Ventilation Characteristics of a Partial-Cylinder Opening for One-Sided-Windcatcher of Variable Air-Feeding Orientations in Taif, Saudi Arabia

1
Department of Mechanical Engineering, College of Engineering, Taif University, P.O. Box 11099, Taif 21944, Saudi Arabia
2
Department of Civil Engineering, College of Engineering, Taif University, P.O. Box 11099, Taif 21944, Saudi Arabia
3
Alexandria Higher Institute of Engineering and Technology (AIET), Alexandria 21311, Egypt
4
Department of Mechanical Power Engineering, Faculty of Engineering, Menoufia University, Shebin El Kom 32511, Egypt
*
Authors to whom correspondence should be addressed.
Sustainability 2021, 13(20), 11310; https://doi.org/10.3390/su132011310
Submission received: 21 September 2021 / Revised: 8 October 2021 / Accepted: 11 October 2021 / Published: 13 October 2021
(This article belongs to the Collection Sustainable Electric Power Systems Research)

Abstract

:
To provide a clean and cheap source of natural ventilation in windy and arid zones, a windcatcher facility is the best option. This paper aims to study the effect of the inlet opening angle of a new windcatcher model with different values ranging from 60° to 90° for three different feeding orientations at leading-down, central-up, and trailing-down locations. The ventilation performance of the new one-sided windcatcher is numerically examined using CFD simulations, where the 3D RANS and k-epsilon equations are applied at different wind speeds. The flow features of the new models are analyzed and compared with a basic traditional model based on the induced air distribution, aerodynamic losses, and ventilation rates. Results revealed that the sharp edge of the inlet opening leads to an increase in the flow separation and recirculation zone, especially when the opening angle is increased. The highest pressure coefficient is achieved by the trailing-down model compared with the other windcatcher models at an opening angle of 90°. The total pressure drop and ventilation rates increase in all the new windcatcher models due to the increase in the opening angle from 60° to 90°. At identical conditions, with an opening angle of 90° and wind speed of 5 m/s, the trailing-down model achieved a higher pressure coefficient than the leading-down and central-up models by 20.55% and 37.37%, respectively. Furthermore, the trailing-down model could provide higher ventilation rates than the central-up and leading-down models by 31% and 42%, respectively. Finally, the trailing-down windcatcher model can be recommended as the best choice to provide natural ventilation at Taif City in Saudi Arabia.

1. Introduction

In the past two decades, the continuous energy demand for achieving human comfort, especially in summer, has become a main issue of interest due to the energy crisis in developing countries [1]. There are various methods to achieve human comfort inside their buildings using either expensive machines (HVAC systems) or cheap natural ventilation by wind energy. Wind energy is a double-edged weapon, as it can be used for natural ventilation for a building or may destroy this building if there is a sandy storm [2]. Zafra et al. [3] studied the effect of wind speed in a thermal performance assessment of a given space to achieve thermal comfort. To achieve a healthy environment within indoor places, natural ventilation can be applied using several passive systems such as windcatchers, in order to reduce the negative effect of buildings on nature. A windcatcher can be defined as a wind-driven structure that can obtain wind from a high level and direct it down inside the building via the pressure difference between the outside air and the exit openings. Windcatchers of different structures are mounted on the roof of a building and can be utilized to provide the indoor zones with natural fresh air [4,5,6,7,8]. Saudi Arabia has more windy and arid regions, especially in Taif city, so windcatchers can be implemented to protect the residents from the hostile environment by supplying them with free ventilated air [9,10]. Initially, the idea of natural ventilation was introduced using a four-sided windcatcher model for a building. Then, this idea was applied for a one-sided windcatcher to analyze the effect of using an internal section inside the windcatcher tower. Moreover, variable cross-section areas of the inlet opening were investigated in terms of pressure coefficient values.
Several researchers have studied the flow structure inside various windcatcher models that have one inlet/outlet opening and one vertical channel. The flow separation, reattachment, recirculation, and secondary flow were observed in that design. Different passive cooling systems (shading systems, phase change material, passive cooling shelter, heat sinks, radiant heat barriers, eco-evaporation cooling, and natural ventilation) were implemented to evaluate their cooling performance [1]. Furthermore, the flow behavior inside a two-sided windcatcher was analyzed under the outdoor airflow effect [11]. Montazeri and Azizian [12] simulated the atmospheric wind via experimental tests of smoke visualization for a one-sided windcatcher to determine the pressure coefficients in a wind tunnel. A two-sided wind-catcher was presented to investigate the ventilation performance [13]. Results indicated that the discharge coefficients were a function of the wind incident angle. Montazeri [14] studied the ventilation effectiveness for five different models of windcatcher at identical heights and cross-section areas. The results showed that the produced ventilation rates decreased with the increase in the number of openings, from a one-sided to twelve-sided windcatcher. Referring to the traditional design of the windcatcher in Ref. [15], the low flow momentum near the leading wall leads to flow separation, and a recirculation zone occurs after the bend. In addition, by increasing the flow separation further downstream, the flow losses increase, and hence reduces the efficiency of the windcatcher. The unsuitable aerodynamic geometry of the windcatcher can lead to high flow losses, which decrease the flow rate at the openings. The flow losses in windcatchers are composed of frictional and dynamic losses [16]. Elmualim and Awbi [17] reported that the sharp edge of a square windcatcher increased the flow separation compared to a circular one.
Various influential parameters (number, arrangement, shape, dimensions) were studied on the cooling performance of windcatchers. CFD simulations were performed to study the impact of the number and arrangement of inlet and outlet openings [4]. Experimental and analytical studies were conducted on three different inlet shapes of a simple windcatcher at zero and variable wind directions [18]. The effect of extension length at the inlet and angle [19,20] revealed that the windcatcher could obtain a 50% higher ventilation effectiveness at a wing wall angle of 30° compared to a conventional one. Additionally, the height and depth of the windcatcher [21,22,23] were investigated. The ventilation mass flow rate increased by 13% for the two-sided windcatcher with a convergent–divergent nozzle and finned–curved inlet openings [24]. Hughes and Abdul Ghani [25] provided recommended rates of ventilation air even at low incident wind speeds on a windcatcher using numerical simulations in a small classroom. Su et al. [26] confirmed, using practical and numerical work, that the direction of the wind has a small impact on the ventilation rate in a circular-section windcatcher at different wind velocities. Regarding the ventilation rate control at the inlets and openings of windcatchers, the impact of louvers was numerically analyzed [27]. Dampers were utilized to withstand the infiltrations of the airflow through the windcatcher to the environment [28].
CFD simulation has recently garnered great attention in the place of experimental tests, due to their high cost, for examining the design and performance of windcatchers. Hosseinzadeh et al. [29,30,31] implemented CFD modelling for different case studies of a heat exchanger using ANSYS software. The numerical solution using the k-epsilon turbulence model achieved good agreement with the experimental measurements [32]. Ghadiri et al. [33] utilized 3D steady RANS for different models of traditional two-sided windcatchers. In addition, the outdoor airstream effect was analyzed on the internal flow features of the traditional two-sided windcatcher model [11]. Calautit et al. [34] studied the indoor ventilation quality in buildings with a passive cooling windcatcher integrated with heat pipes via numerical modeling using the standard k-epsilon turbulence model. Alsailani et al. [35] utilized detailed 3D steady RANS CFD simulations to study the effect of 40 different geometries of windcatchers on the performance of the cross-ventilation inside buildings. Good agreement between wind tunnel and CFD results was achieved using both the standard k-epsilon and RNG k-epsilon turbulence models.
From the previously cited literature, the main parameters that were investigated related to the inlet opening of a windcatcher system were the number of openings, surface shape (flat/circular), and incident angle of the wind. Increasing the number of inlet openings leads to decreasing the ventilation rate [14]. Moreover, huge flow separation and aerodynamic losses appeared at the inlet opening of sharp edges (flat surface) of different windcatcher models by [9,10,11,12,13] and [17]. Furthermore, the sensitivity of the windcatcher with the wind direction decreased with the increase in the number of the inlet openings [14].
Based on those significant findings, this paper studies two new influential parameters; namely, the cross-section area of the inlet opening based on the opening angle and the location of the exit opening. These parameters are investigated inside a novel partial-cylinder opening of a one-sided windcatcher that has not been studied before. The partial-cylinder opening is evaluated for three different opening angles that were selected based on the best results of previous work by Ref. [14]. Furthermore, the ventilation performance of the novel windcatcher is analyzed at three different feeding orientations. The different cases of the new model are simulated using a CFD code and the results are compared with a basic traditional model at the same operating conditions.

2. Methodology

The current paper aims to examine a new design of the one-sided windcatcher and compare its ventilation performance with a traditional one [12,15] to explore new features that can enhance the usage of sustainable wind energy. Moreover, previous work declared that the one-sided windcatchers achieved higher ventilation rates than the multi-opening windcatchers at an arbitrary wind direction [4]. Consequently, this paper addresses this type in detail to optimize the new geometric parameters. CFD simulations were employed to perform the different cases for both basic and new windcatcher models at three different feeding orientations of the outdoor fresh air into the ventilated room (leading-down, central-up, and trailing-down). The partial-cylinder of the new windcatcher was examined at various inlet-opening angles (60°, 75°, and 90°) under three different wind speeds (1, 3, and 5 m/s) at the same wind-flow direction. The following sections introduce the details of the physical geometries, applied boundary conditions, governing parameters, solution procedure, grid generation, and CFD model validation.

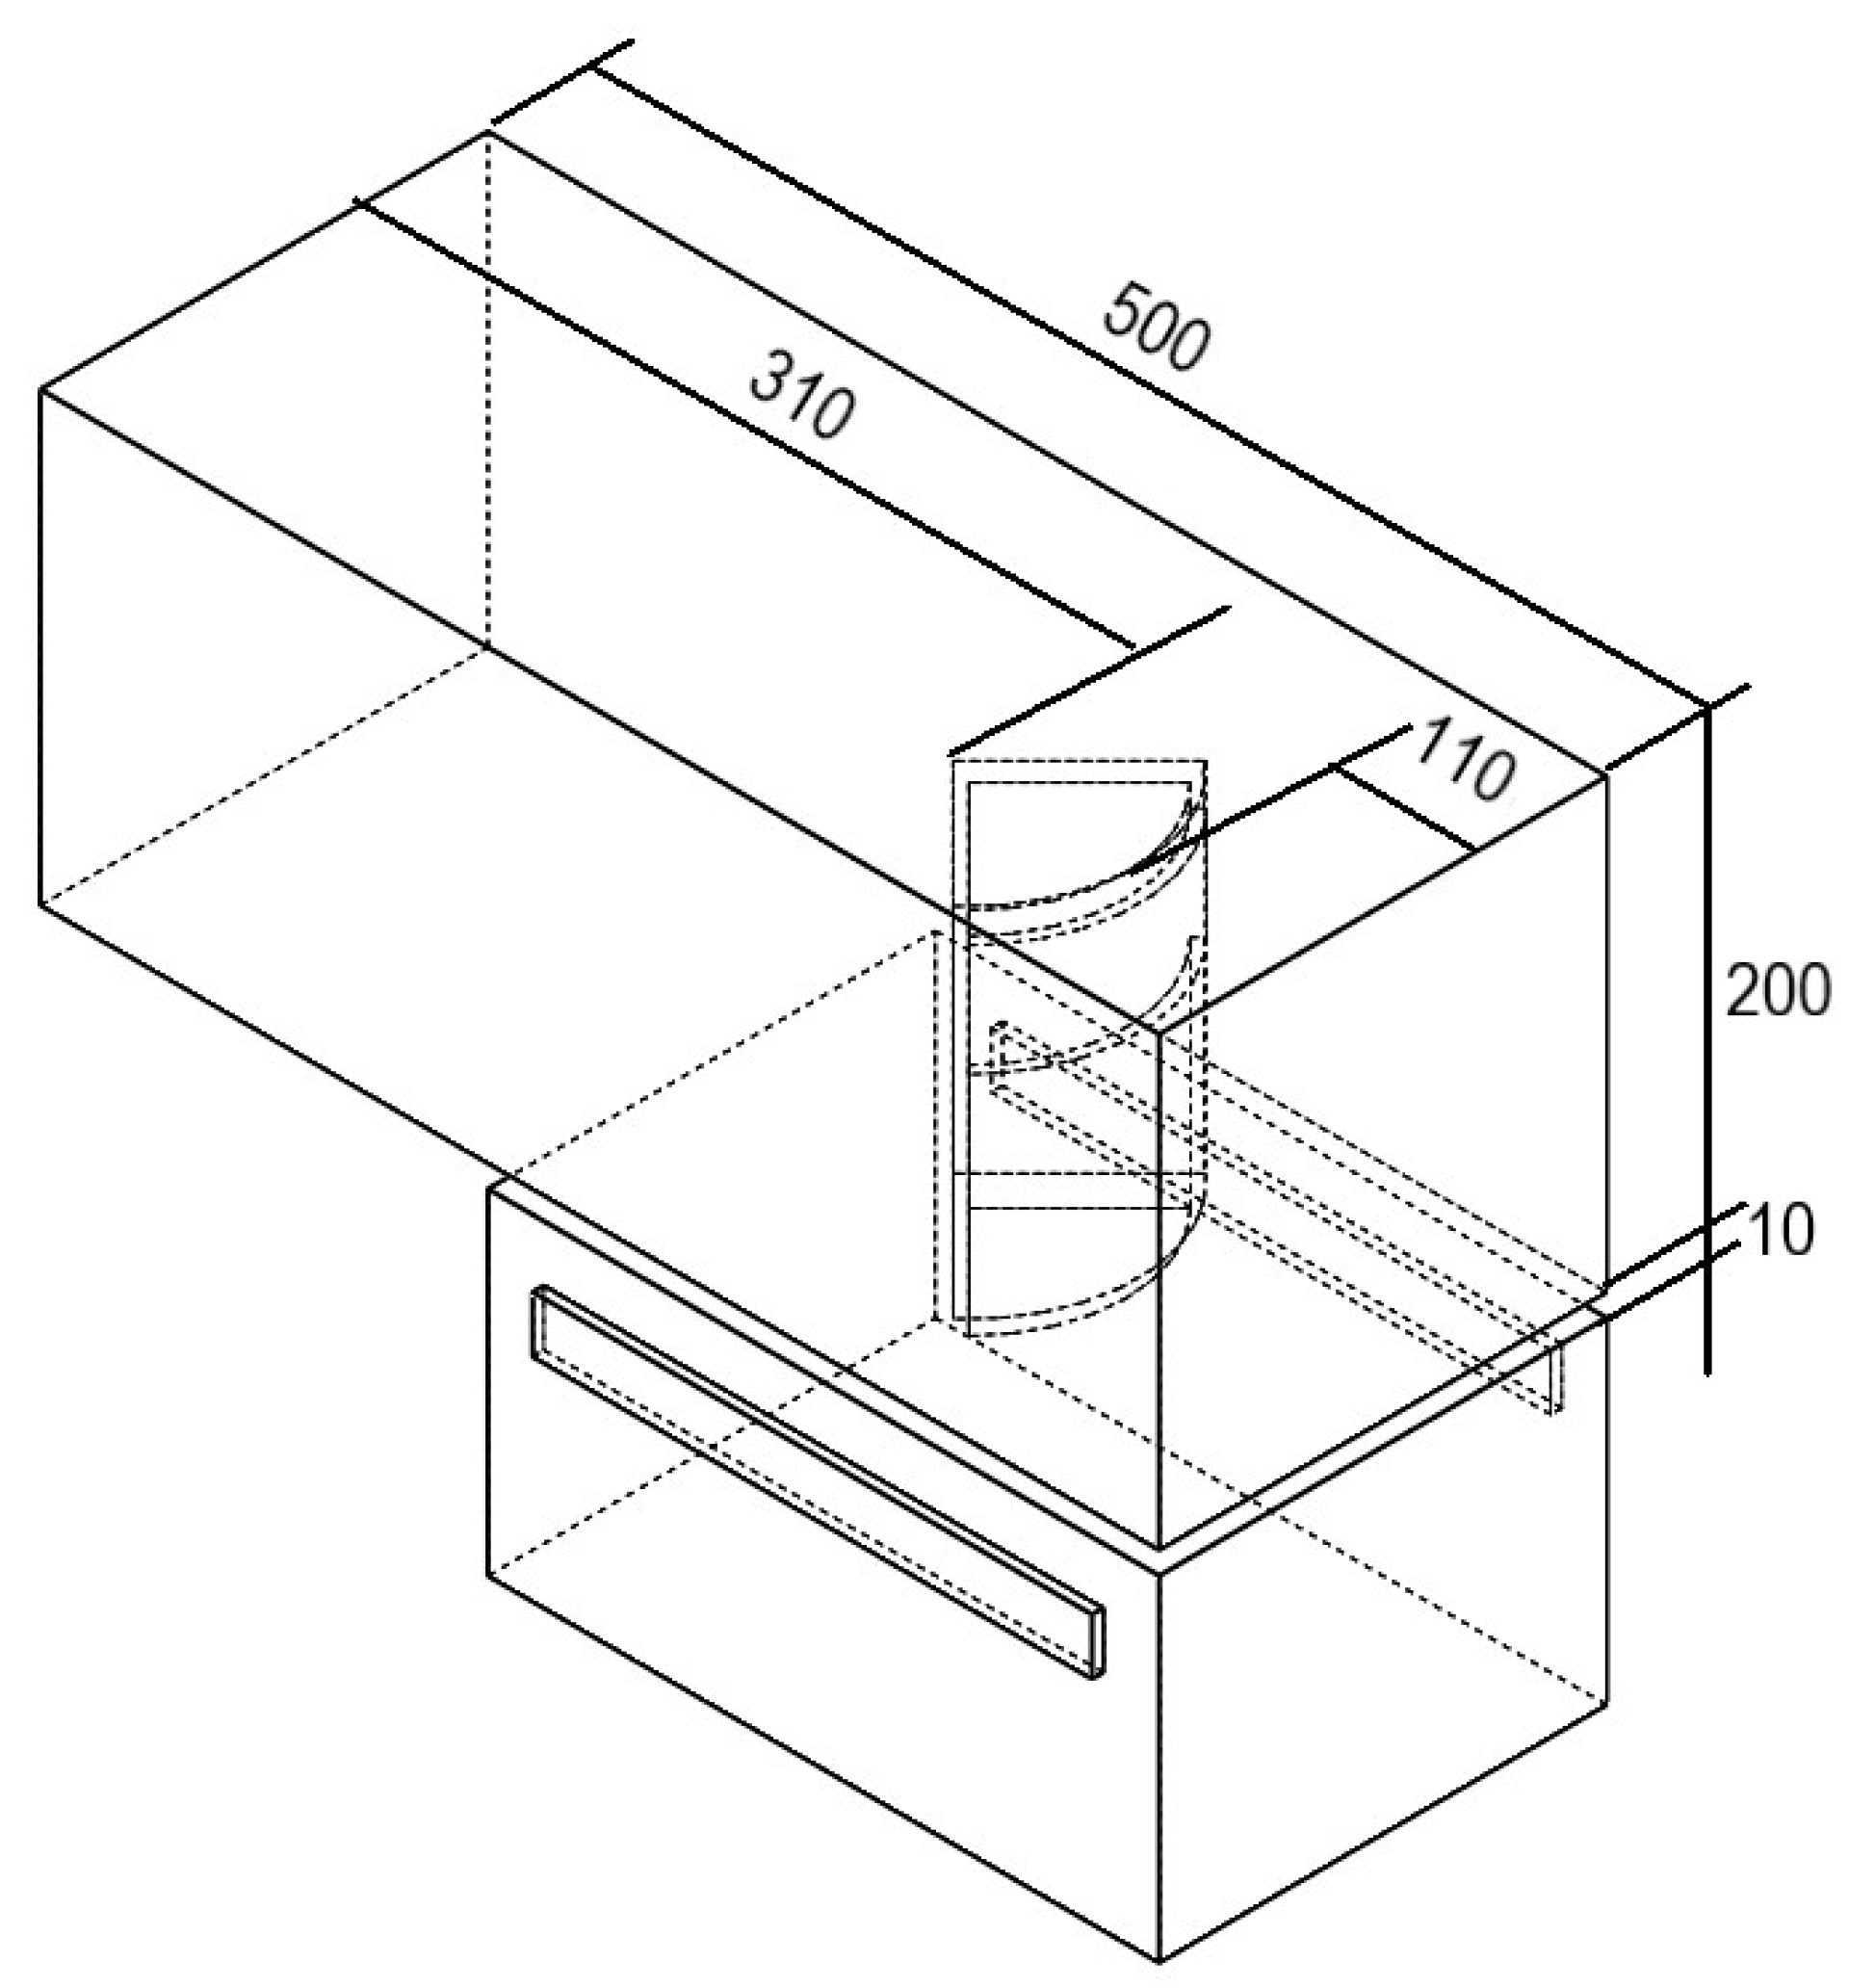
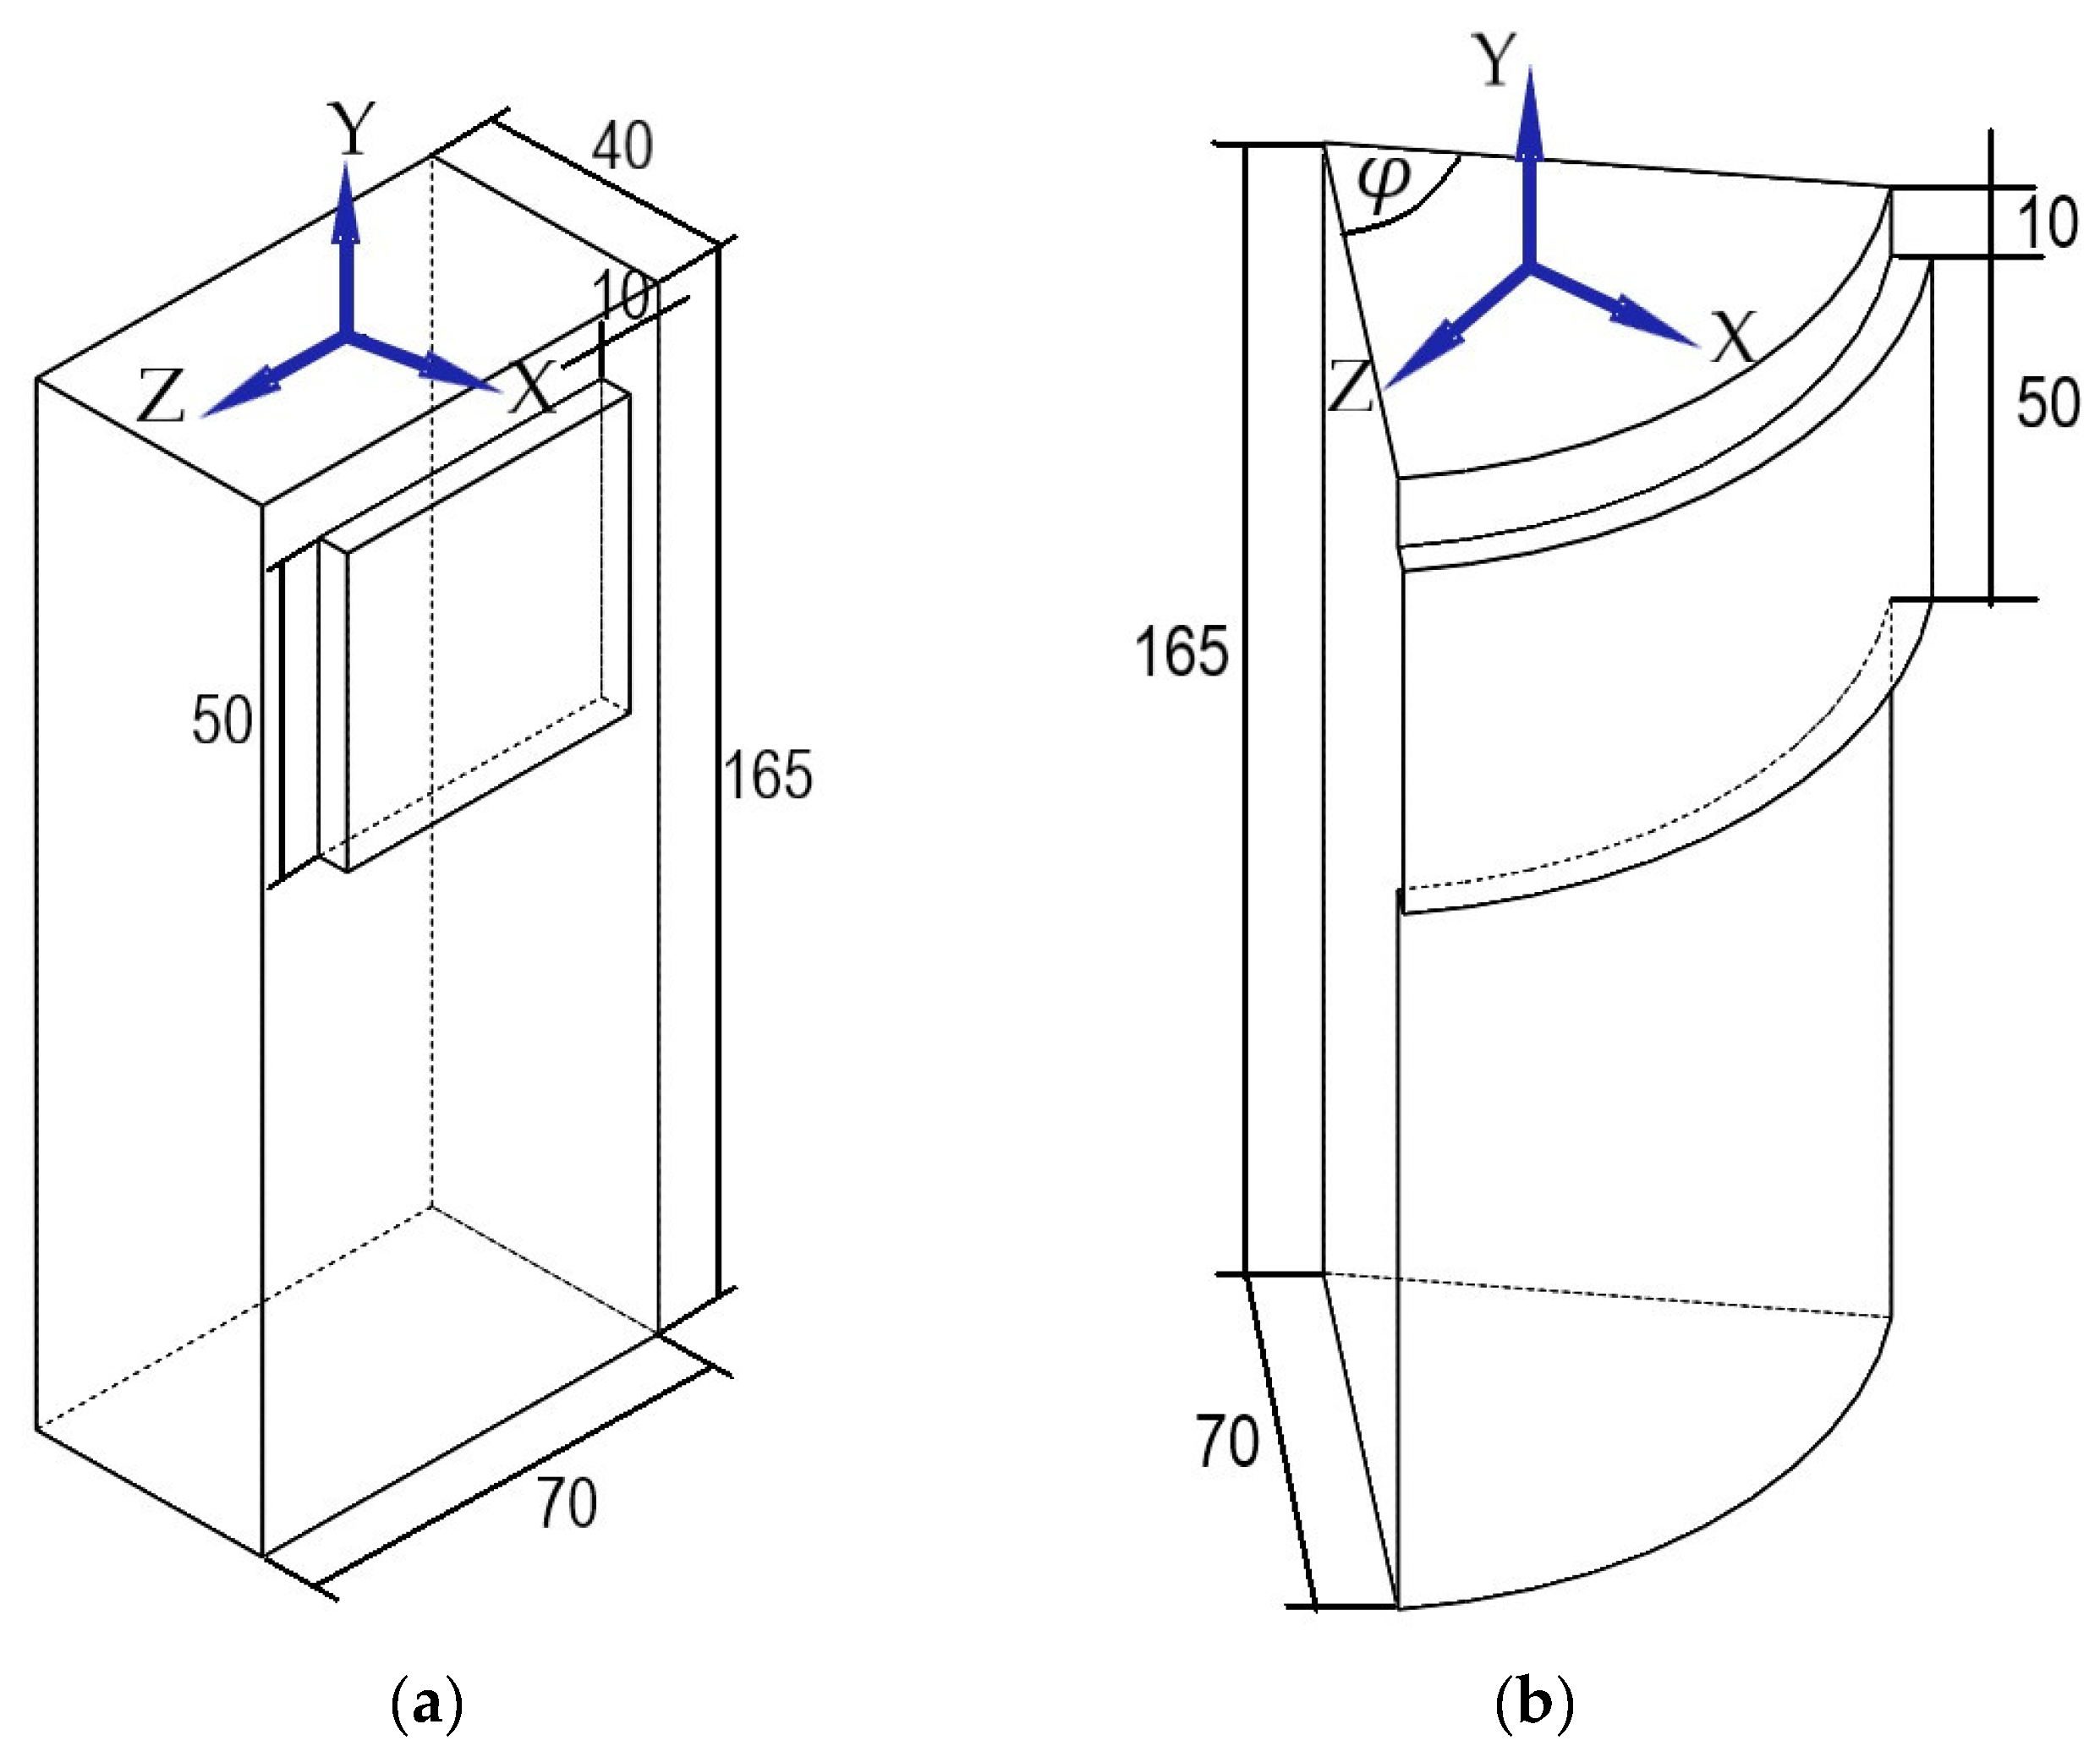
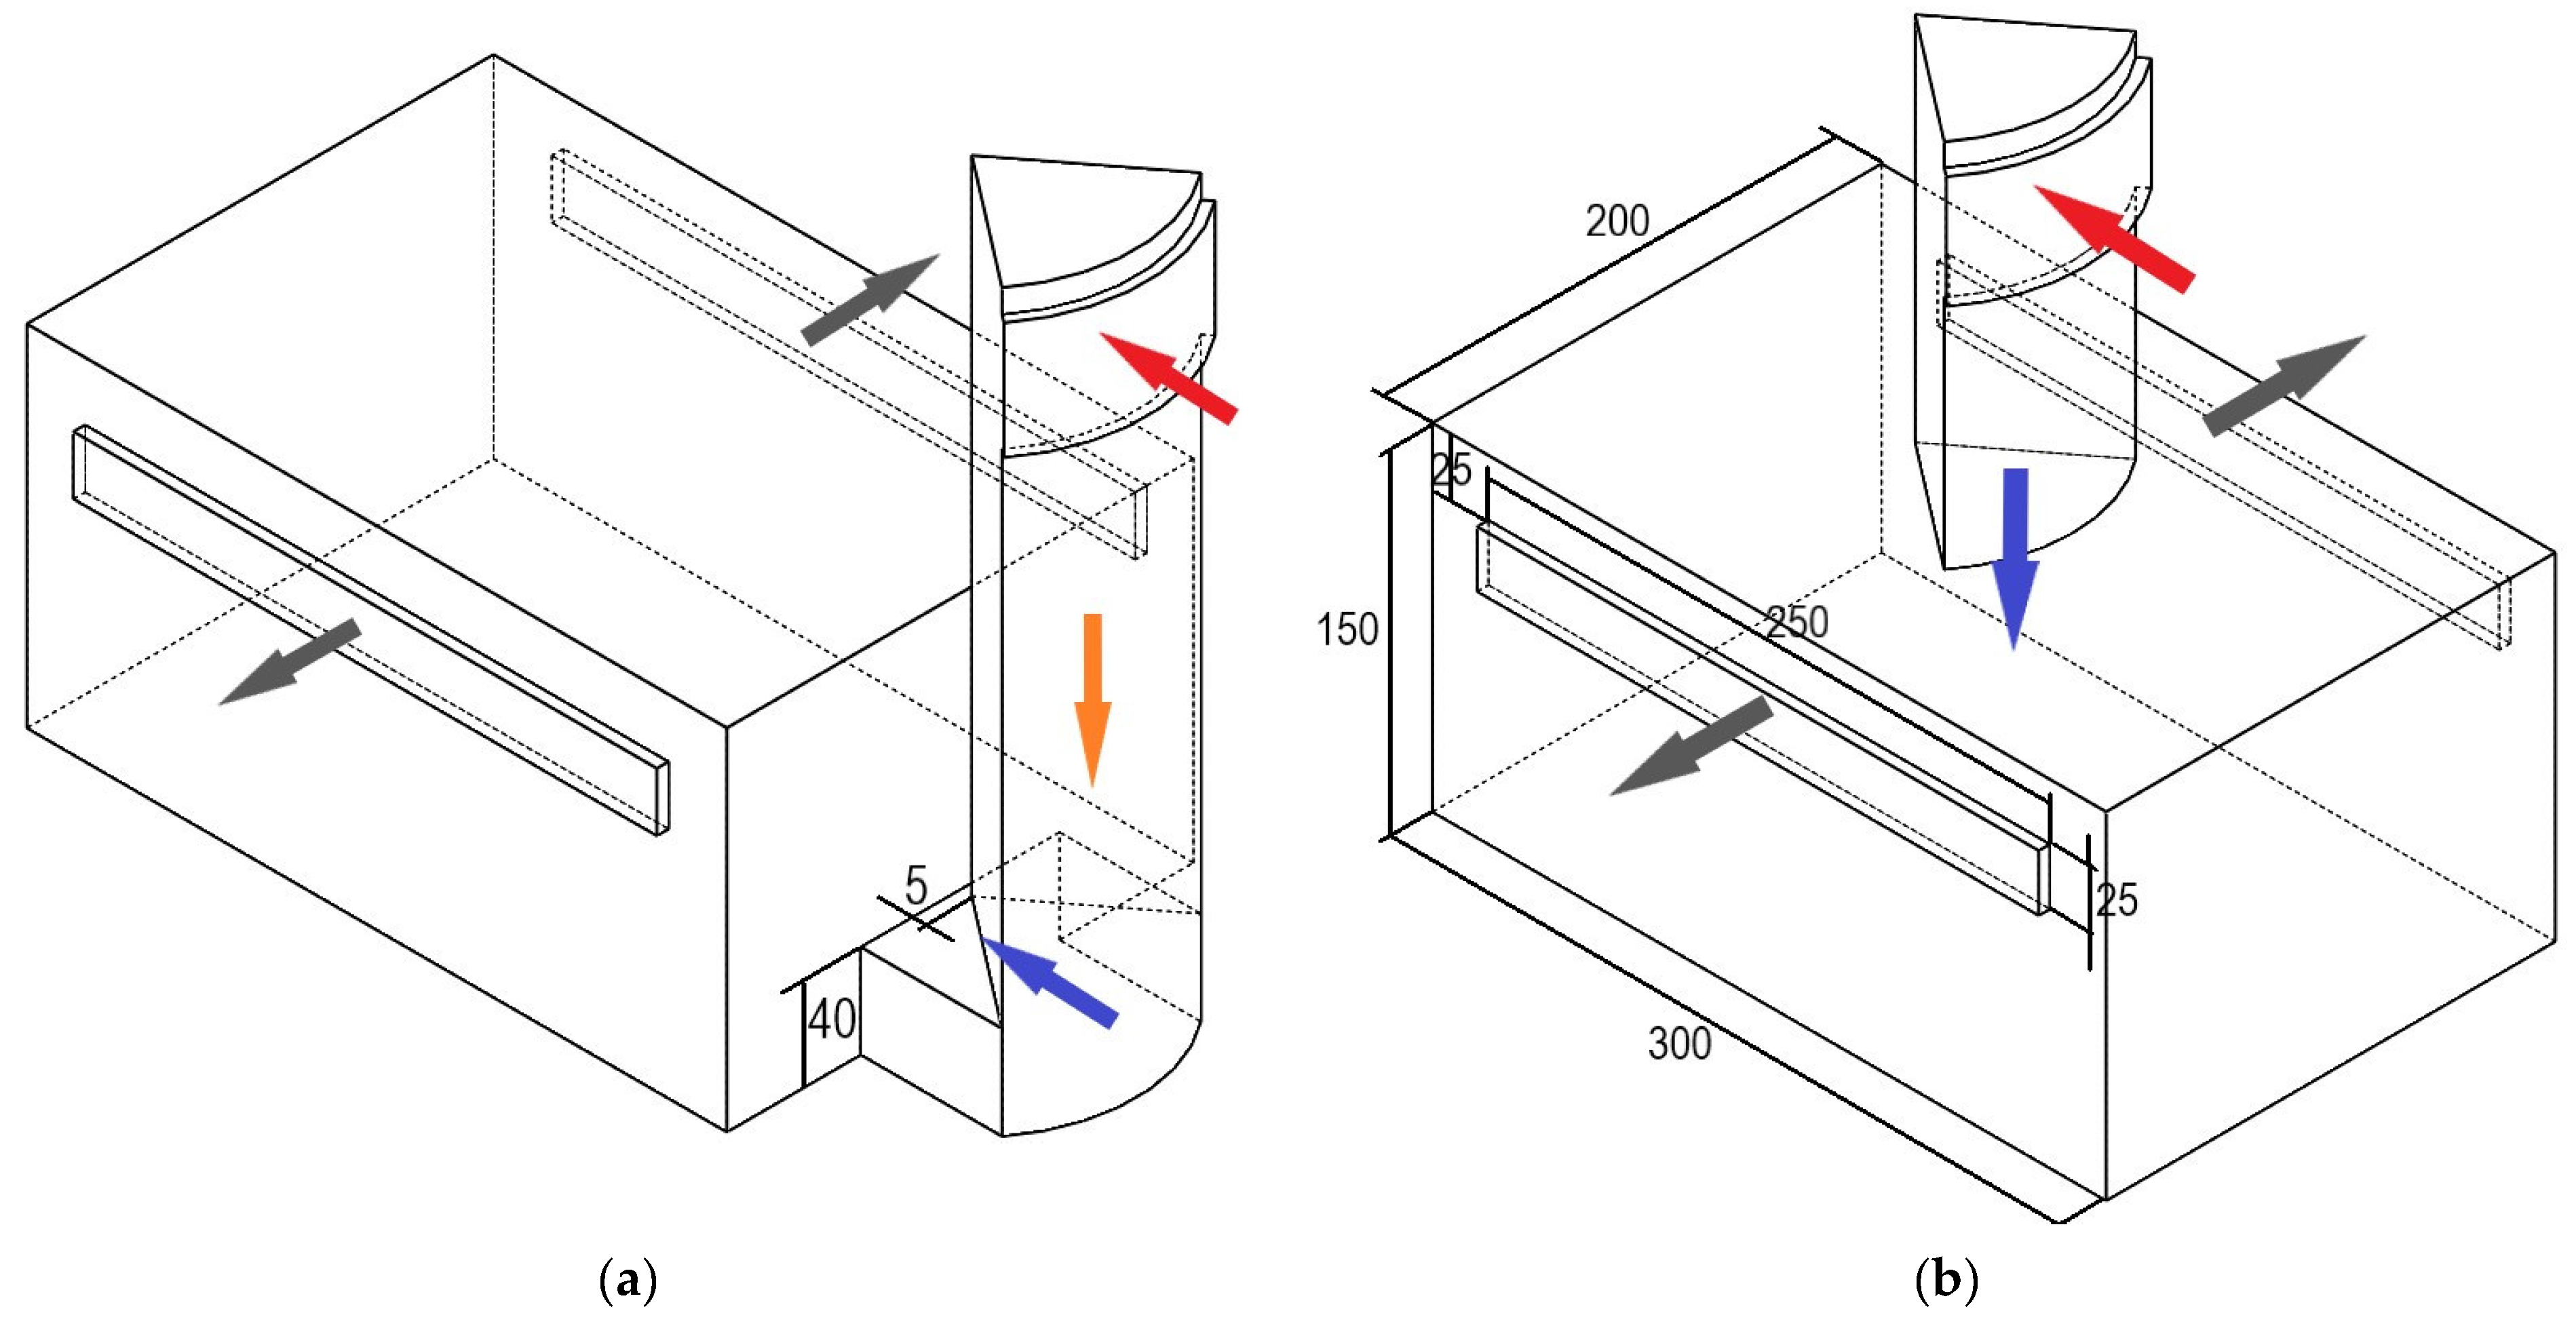
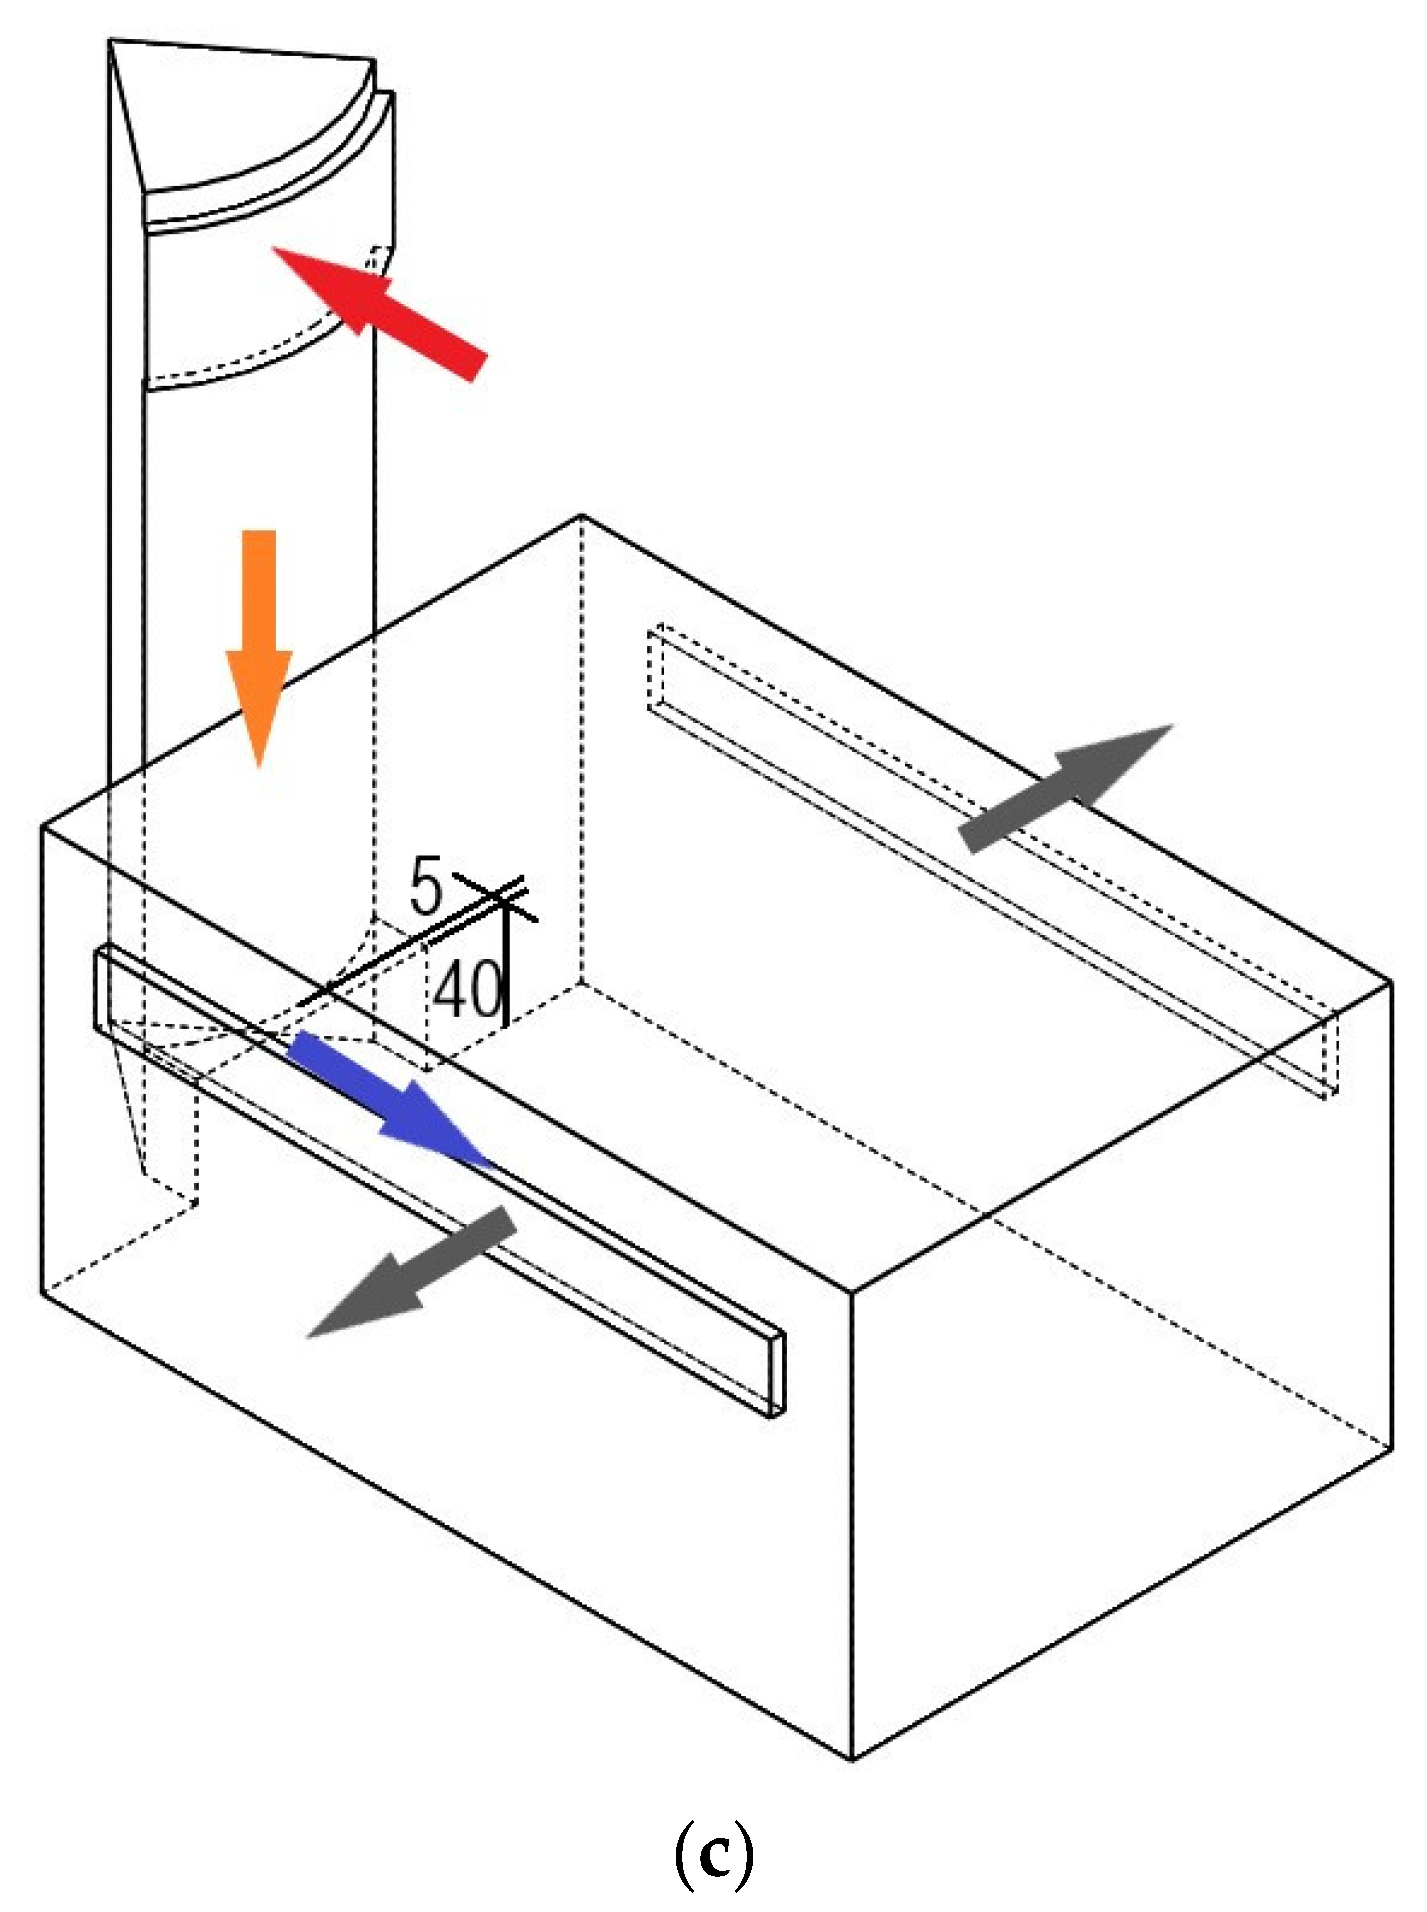
2.1. Physical Geometry

The physical geometries were designed for the basic and new models using SOLIDWORKS 2017 software and were imported into ANSYS Workbench via the geometry option to generate the computational domains. Figure 1 illustrates the dimension details of the basic and new windcatcher models. The basic model was a traditional one-sided windcatcher with a square inlet opening and a rectangular duct, which was adopted from Ref. [15]. In order to avoid the wind direction sensitivity problem from the previous one-sided windcatcher [12,13,14,15,16], a curved inlet opening embedded into a partial cylindrical duct was employed. As depicted in Figure 1b, the new windcatcher model can capture the mainstream flow at variable wind directions from 0 to 45 based on the x-axis direction. As shown in Figure 2, the performance of the new windcatcher was examined for three different orientations with respect to the same ventilated room, namely leading-down, central-up, and trailing-down. In addition, the ventilated room dimensions were evolved from a previous experimental model [12] with some modifications. The ventilated room had two exit openings located on the opposite side walls as recommended by Alsailani et al. [34]. The volume of both the basic and new windcatcher models was about 6% of the volume of the ventilated room.

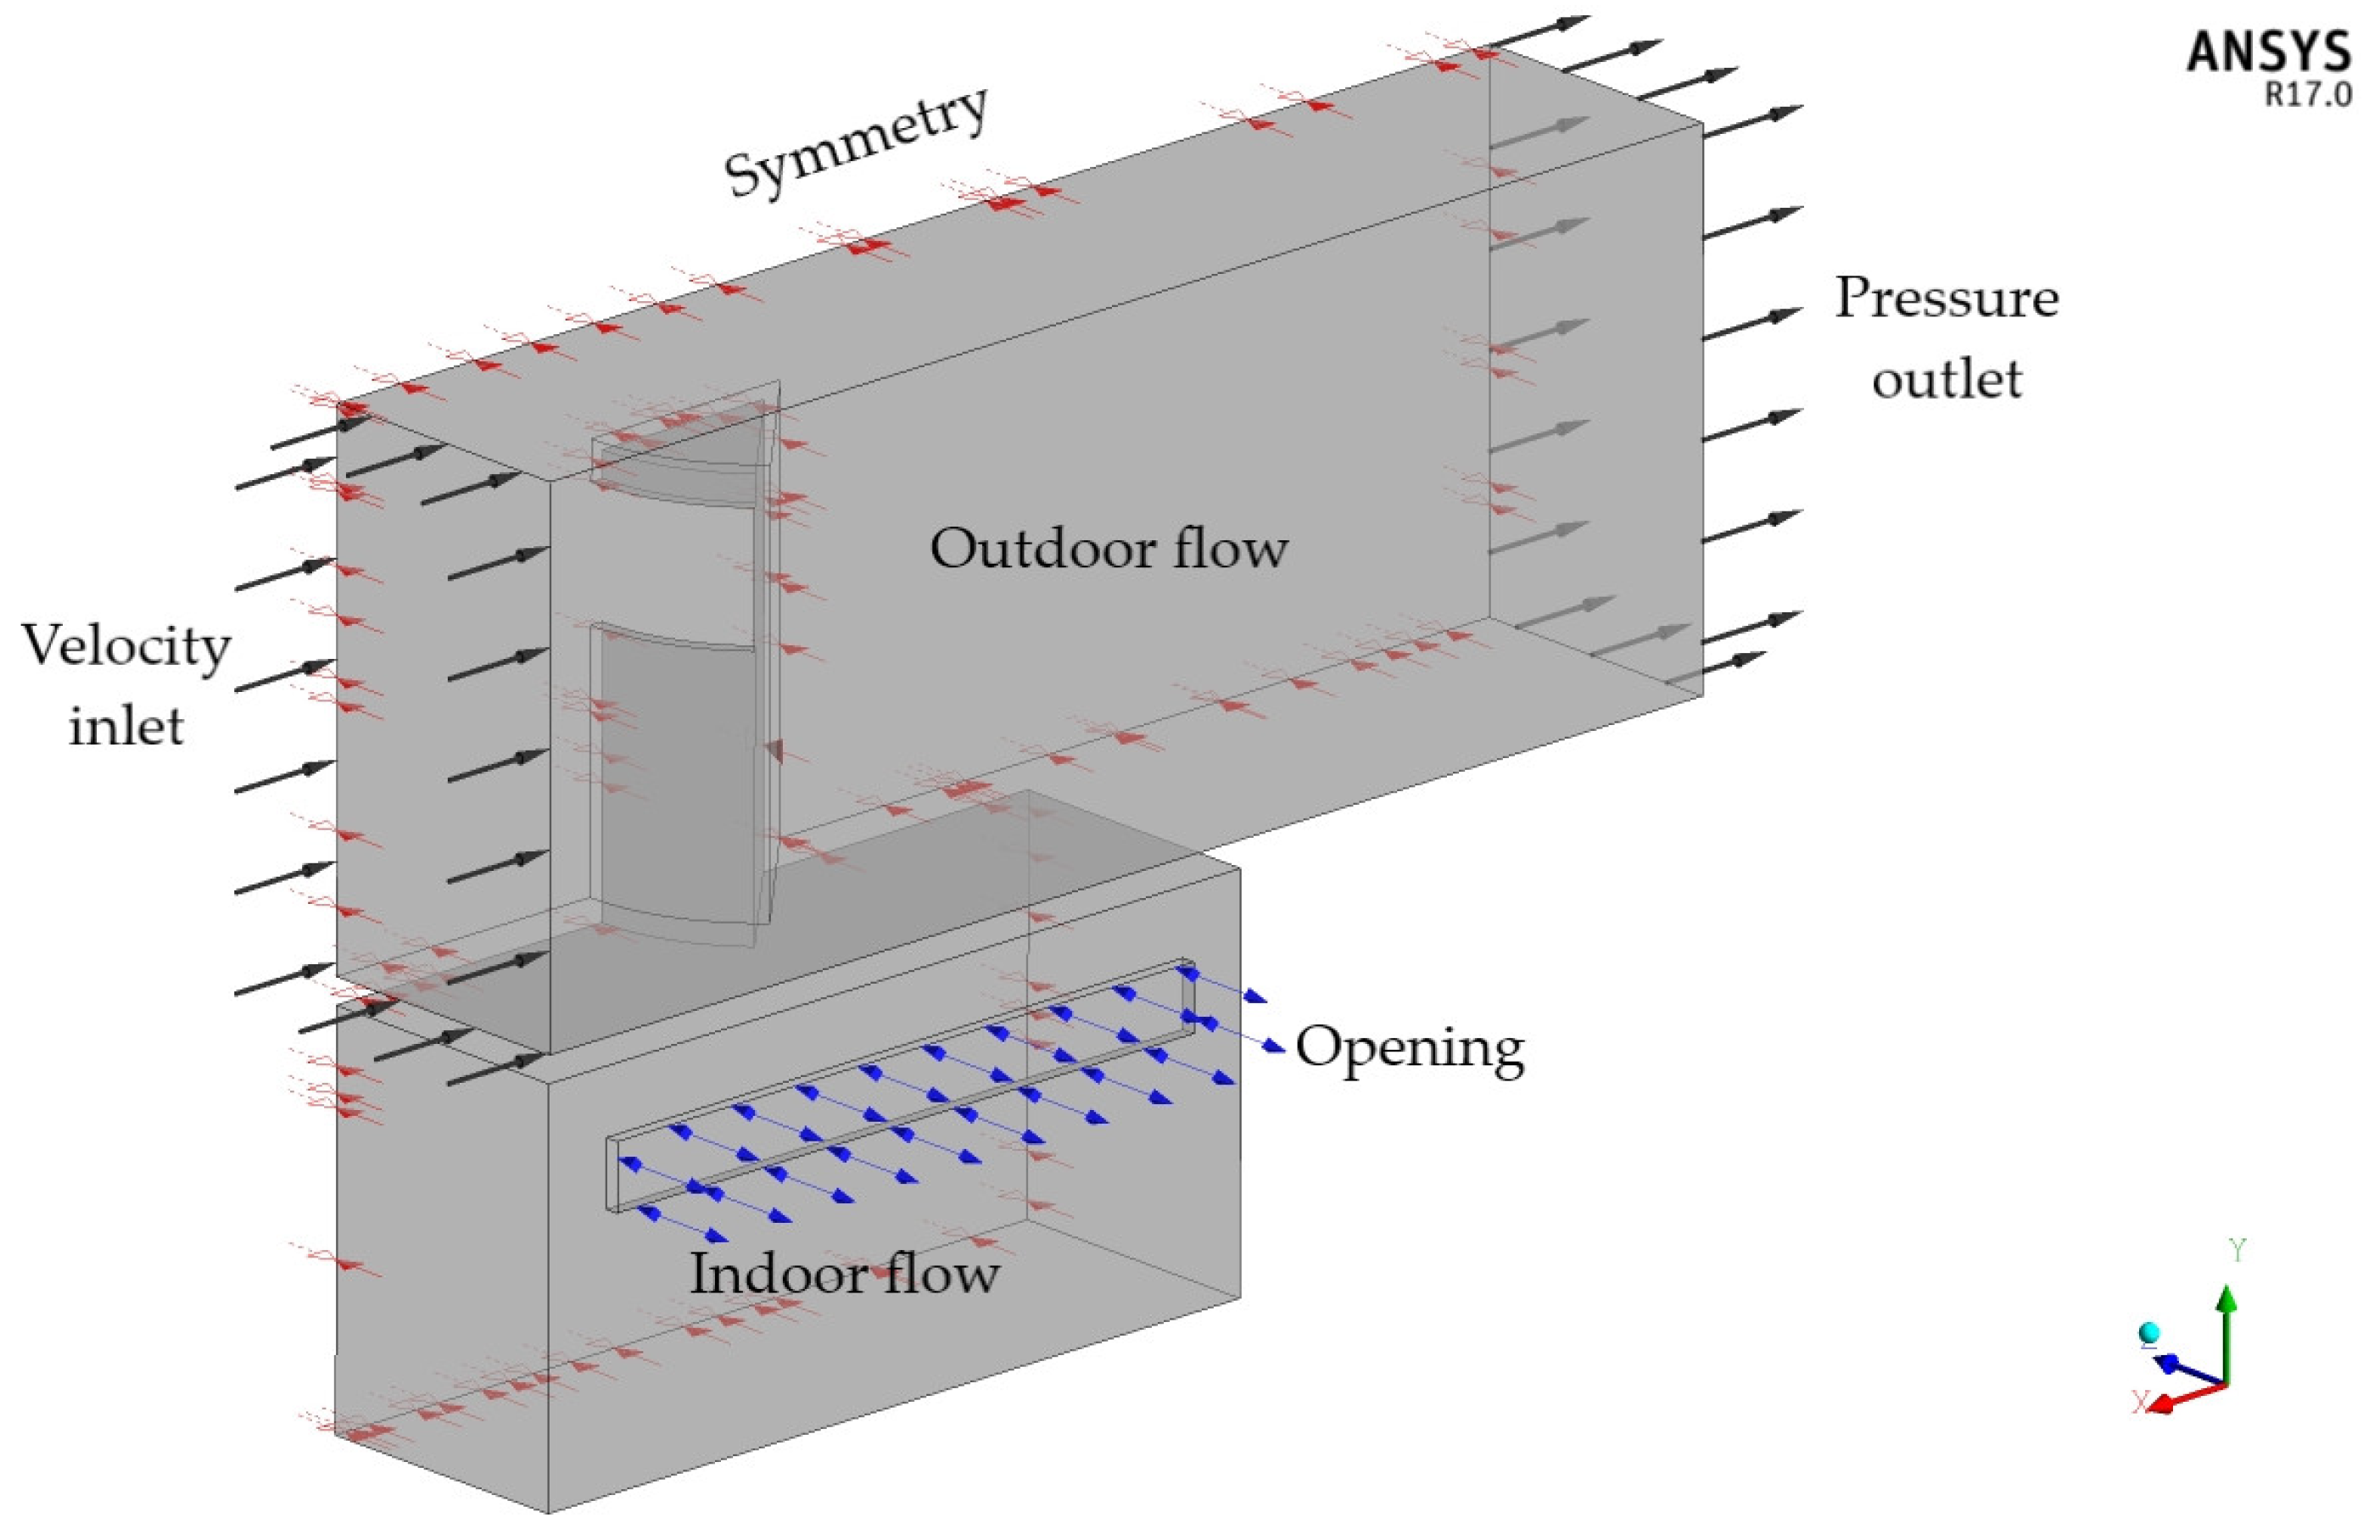
2.2. Boundary Conditions and Data Definition

For all cases, the computational domain consisted of the outdoor and indoor airflow through the windcatcher and the ventilated room as shown in Figure 3. The upstream and downstream domain lengths of the outdoor airflow were 110 and 310 mm, respectively, based on what was applied for model validation. The computational domain was solved at the specified boundary conditions that simulate the outdoor mainstream flow and the indoor airflow through the windcatcher and the room. Details of the CFD model boundary conditions are described in Figure 4. As depicted in Figure 4, the outdoor airflow speed was varied from 1 m/s to 5 m/s, which was directed toward the positive x-axis. The turbulence intensity was 1% (a lower value than [18]) and the fluid domain was kept at the isothermal temperature of 25 °C as presented in Table 1. As a result of the wide inlet opening of the new windcatcher, a large quantity of the mainstream was captured and driven to the room due to the pressure difference generated in the windcatcher tower. The outlet condition was set at an average static pressure of 100,700 Pa according to the climate conditions of Taif City [36]. The induced ventilated air leaves from the exit opening at a relative pressure of 100,700 Pa. The half-section boundary of the whole fluid domain was set as symmetrical. All the other walls were assumed to be of a no-slip condition. In order to describe the flow features around and inside the different windcatcher models, the following parameters are defined. The effect of the new design of the inlet openings on the ventilation performance can be evaluated using the dimensionless velocity magnitude V/U0. U0 is the reference velocity of the upstream airflow. The static pressure coefficient Cp is calculated using Equation (1) as:
C p = ( P P 0 ) / 0.5 ρ U 0 2 ,  
where P is the local static pressure, P0 is the upstream static pressure (100,700 Pa), and ρ is the density of the air (1.185 kg/m3), which is constant. Furthermore, the total pressure-drop coefficient PDt, inside the windcatcher is determined from Equation (2).
P D t = ( P t , i n P t , o u t ) / P t , i n ,
where Pt,in and Pt,out are the total pressure at the inlet and outlet of the windcatchers, respectively. Furthermore, the ventilation rate Q is calculated for all windcatcher models at the exit opening, which is defined as
Q = A × V ,
where A is the cross-section area of the exit opening and V is the area-average velocity at the exit opening.

2.3. Solution Procedure

The flow behavior inside the different windcatcher models can be predicted using various CFD codes such as ANSYS Workbench and Flow-3D software. The current study adopted ANSYS CFX as a part of ANSYS Workbench due to its reliability for low-speed wind flow. Yamini et al. [38] applied the Flow-3D package to study the effect of sea currents and waves on the instability of a vertical wind turbine under low-speed water flow. The commercial CFD software ANSYS CFX 17.0 was utilized to conduct the numerical simulation for all cases. The ANSYS CFX used a hybrid finite-element/finite-volume approach to discretize the partial differential equations of RANS and the turbulence model, which were solved iteratively for each control volume. The assumptions for the RANS equations involved steady-state, 3D, turbulent, isothermal, incompressible, and non-buoyant flow. The turbulent flow field was predicted using the standard k-epsilon model, which was previously implemented for various windcatcher models [35,37,39]. The governing equations of mass, momentum, and k-epsilon are summarized as follows [40].
× ( ρ U ) = 0 ,
where ρ is the density and U is the air velocity vector.
× ( ρ U U ) = p + ρ g + × ( μ U ) × τ t ,
where p is the pressure, g is a vector of gravitational acceleration, μ is the molecular dynamic viscosity, and τt is the turbulence stresses, which account for auxiliary stresses due to velocity fluctuations.
× ( ρ k U ) = × ( α k μ e f f k ) + G k ρ ε ,
× ( ρ ε U ) = × ( α ε μ e f f ε ) + G 1 ε ε k G k C 2 ε ρ ε 2 k ,
where k is the turbulent kinetic energy, ε is the energy dissipation rate, Gk is the source of turbulent kinetic energy due to average velocity gradient, αk and αε are turbulent Prandtl’s numbers, and C and C are empirical model constants. Moreover, all simulations were performed using a multi-CPUs computer facility that requires 48 h per run, and the scheme of discretization was of high-resolution and second-order accuracy. The criteria of convergence for the steady solutions were based on the residual target for all RMS terms of the order 10−7, and the imbalance percentages of mass between the inlet and exit of the fluid domain were less than 0.001%. The steady-state calculations in the current study typically required between 500 and 2000 outer-loop iterations to achieve adequate convergence. An auto timescale with unity for the timescale factor was chosen for the timescale control setting.

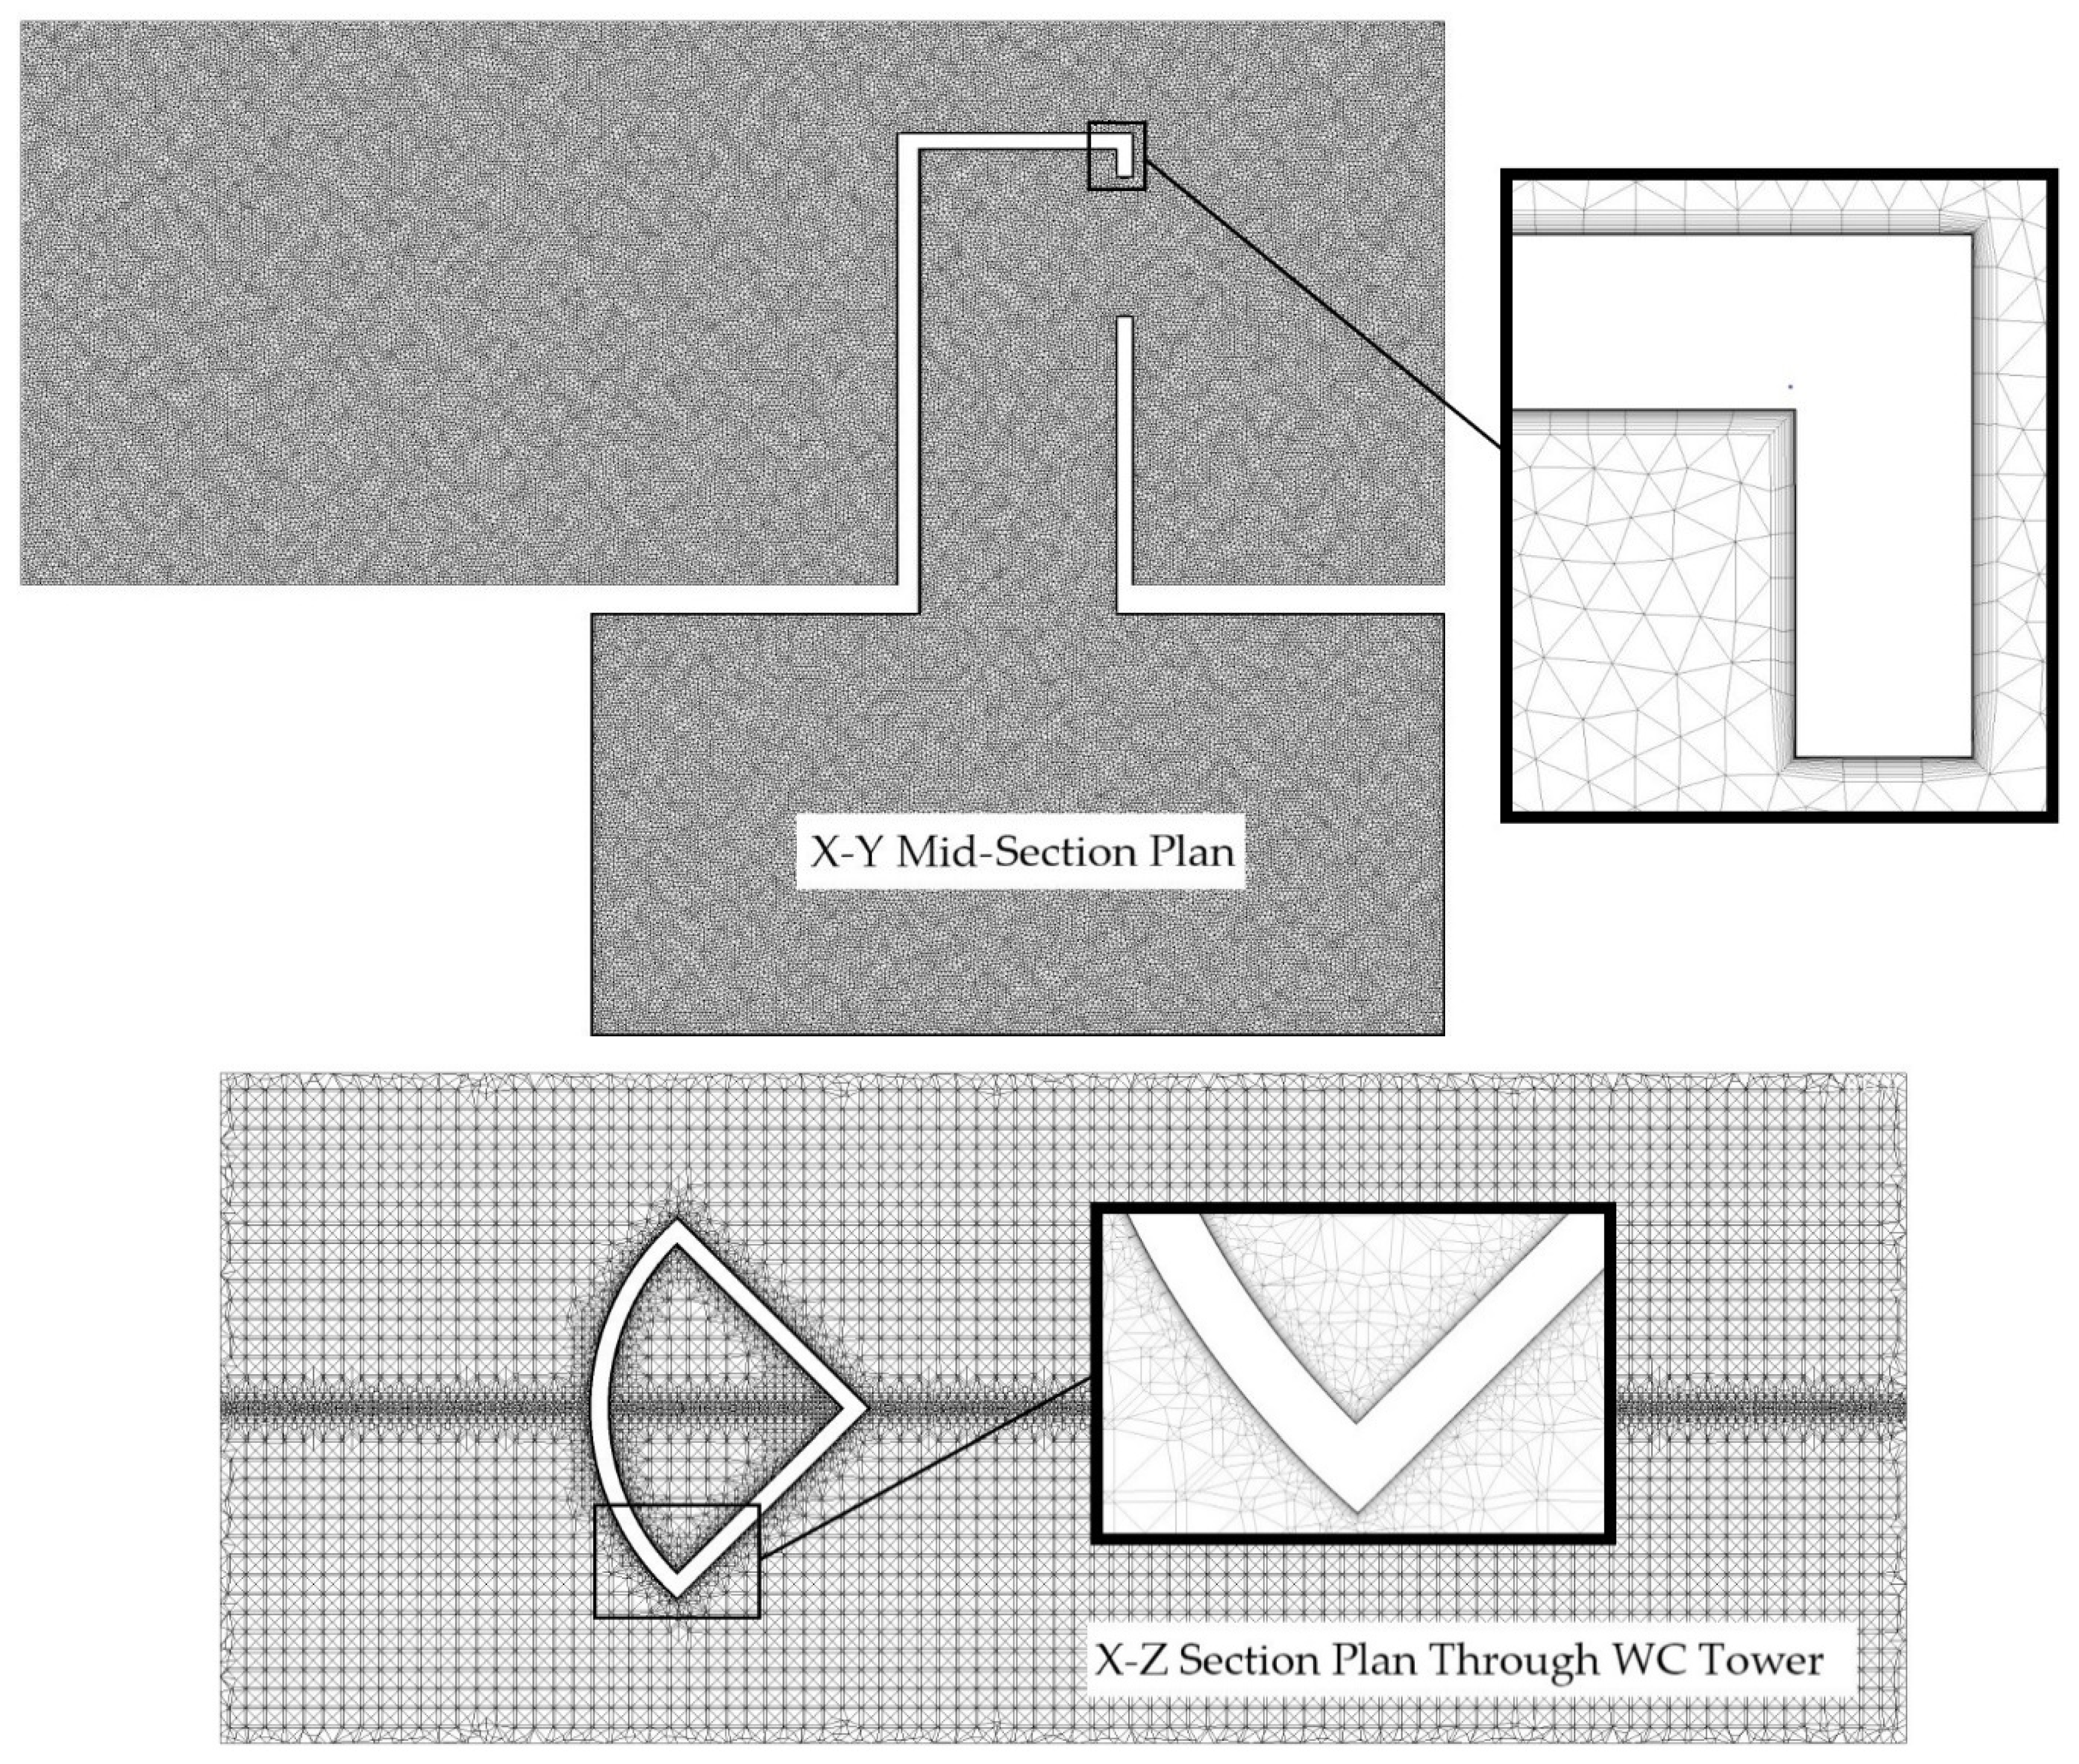
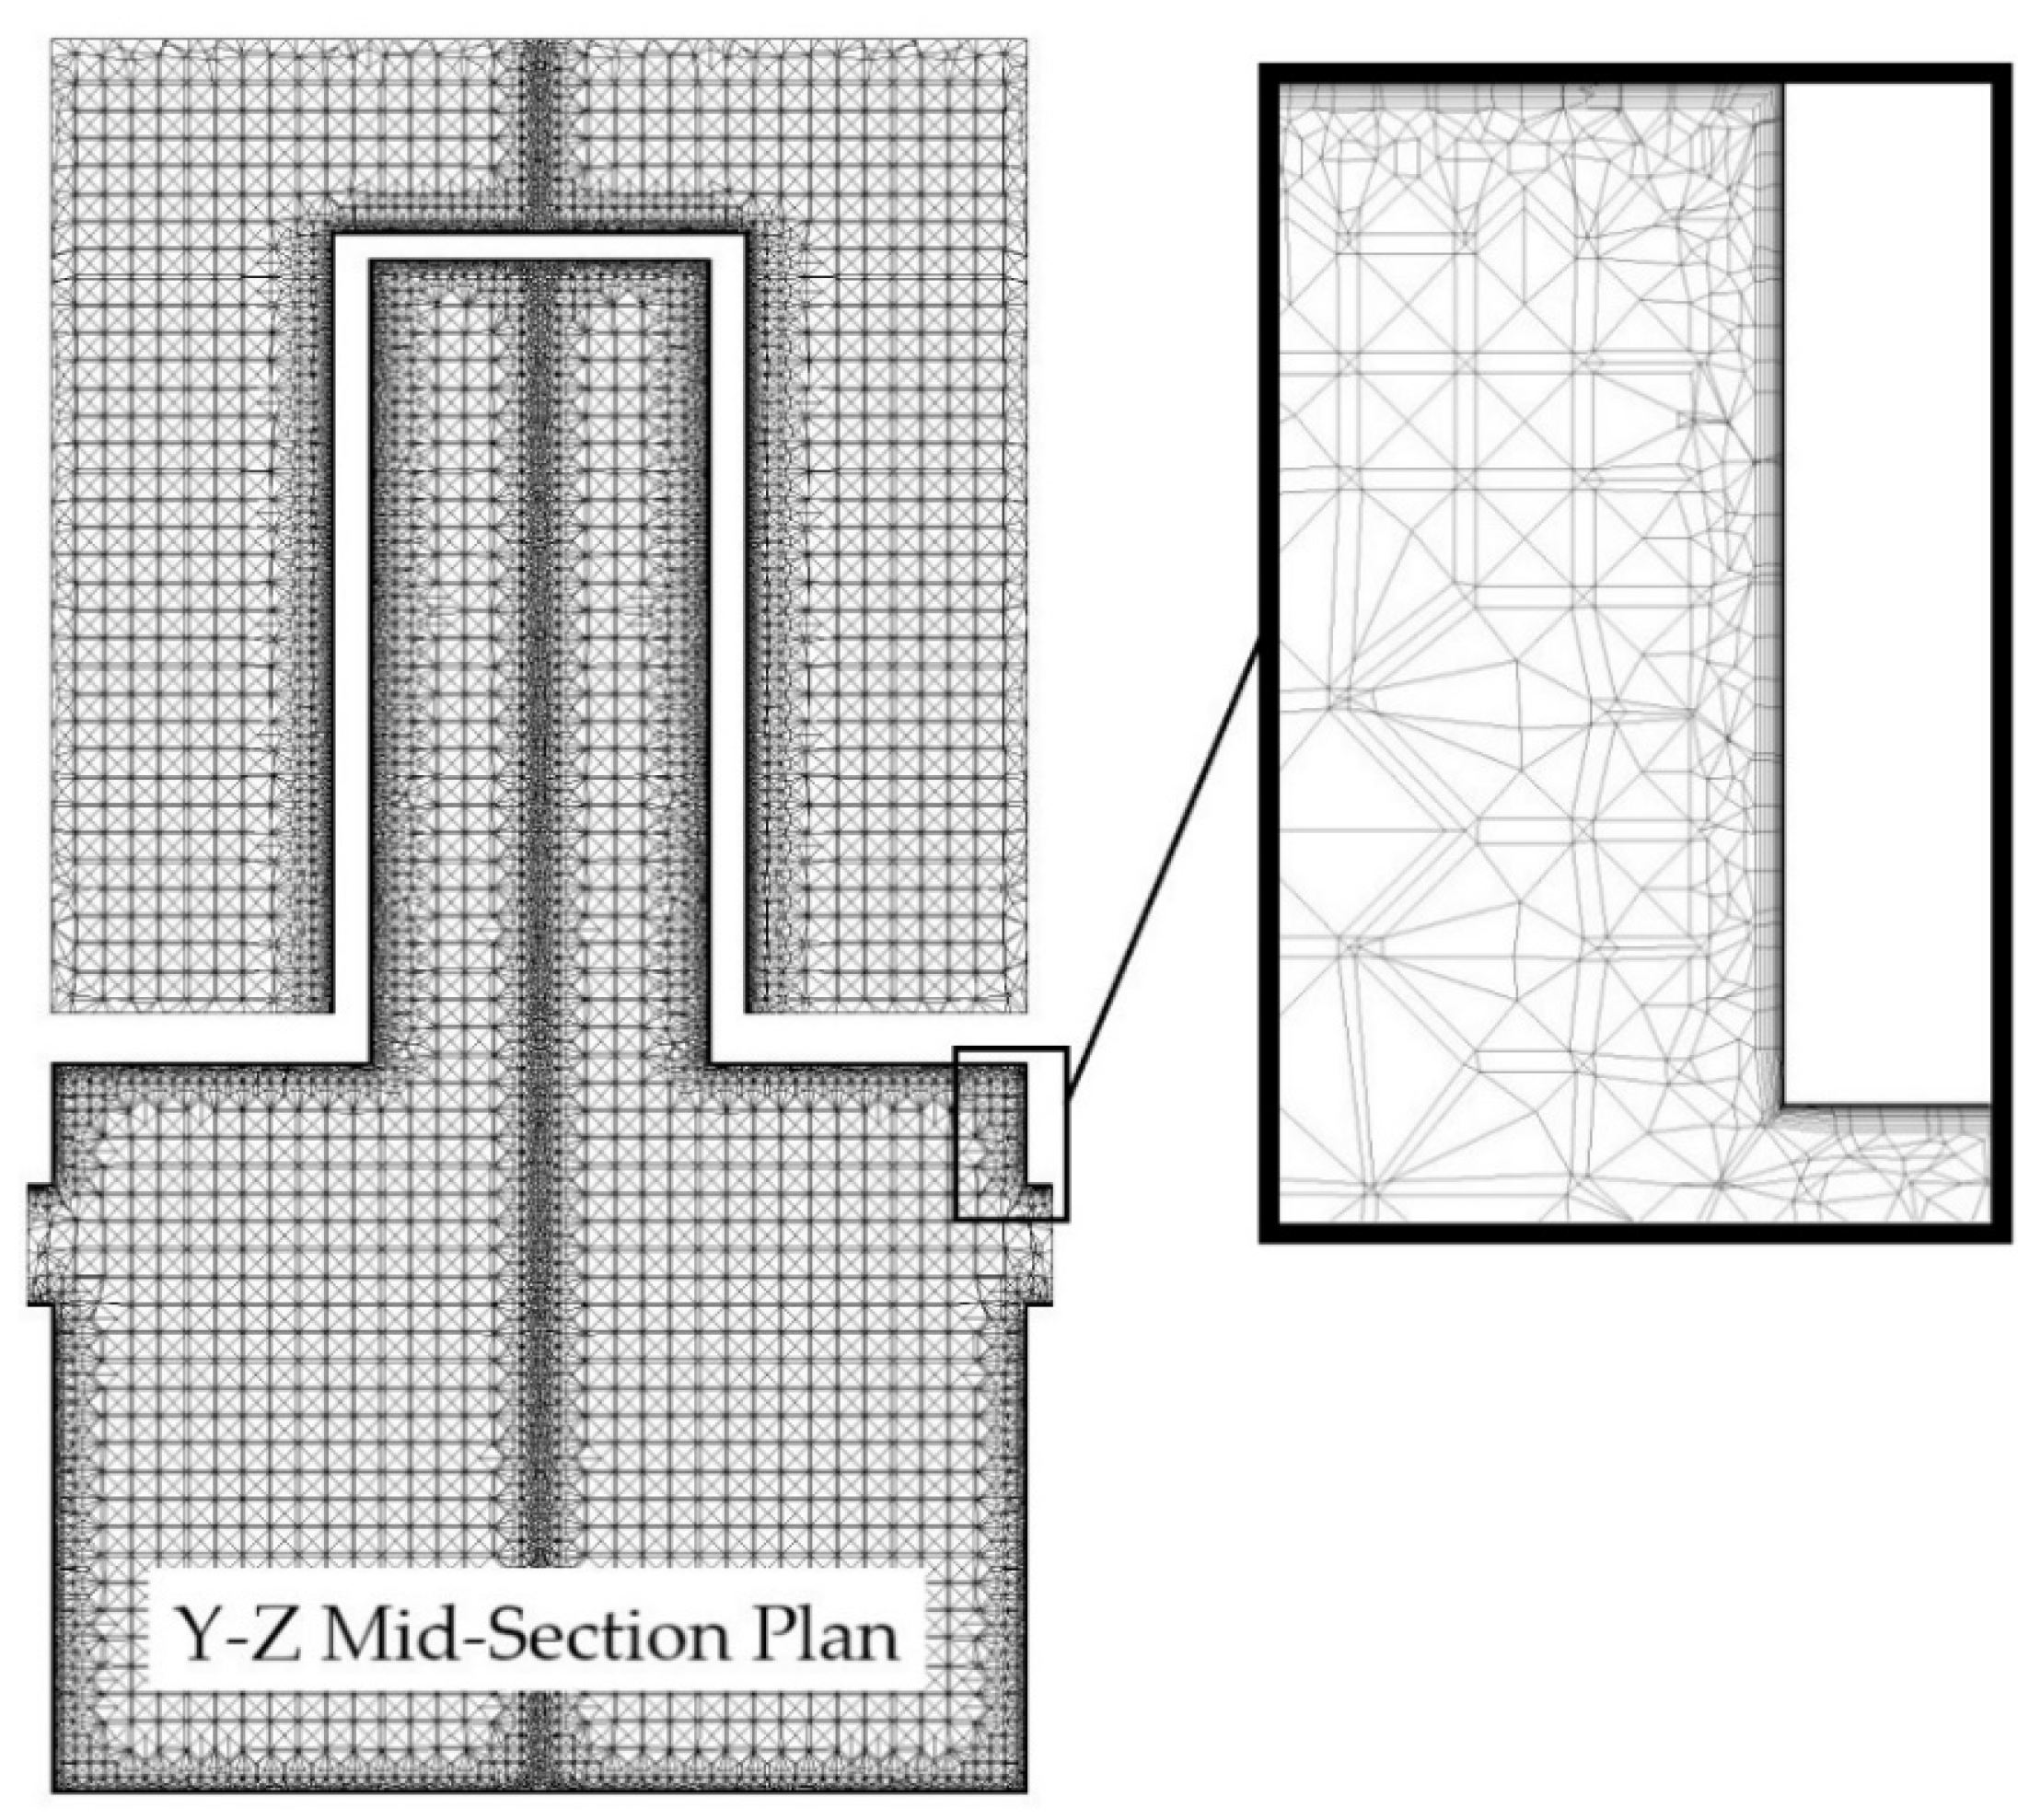
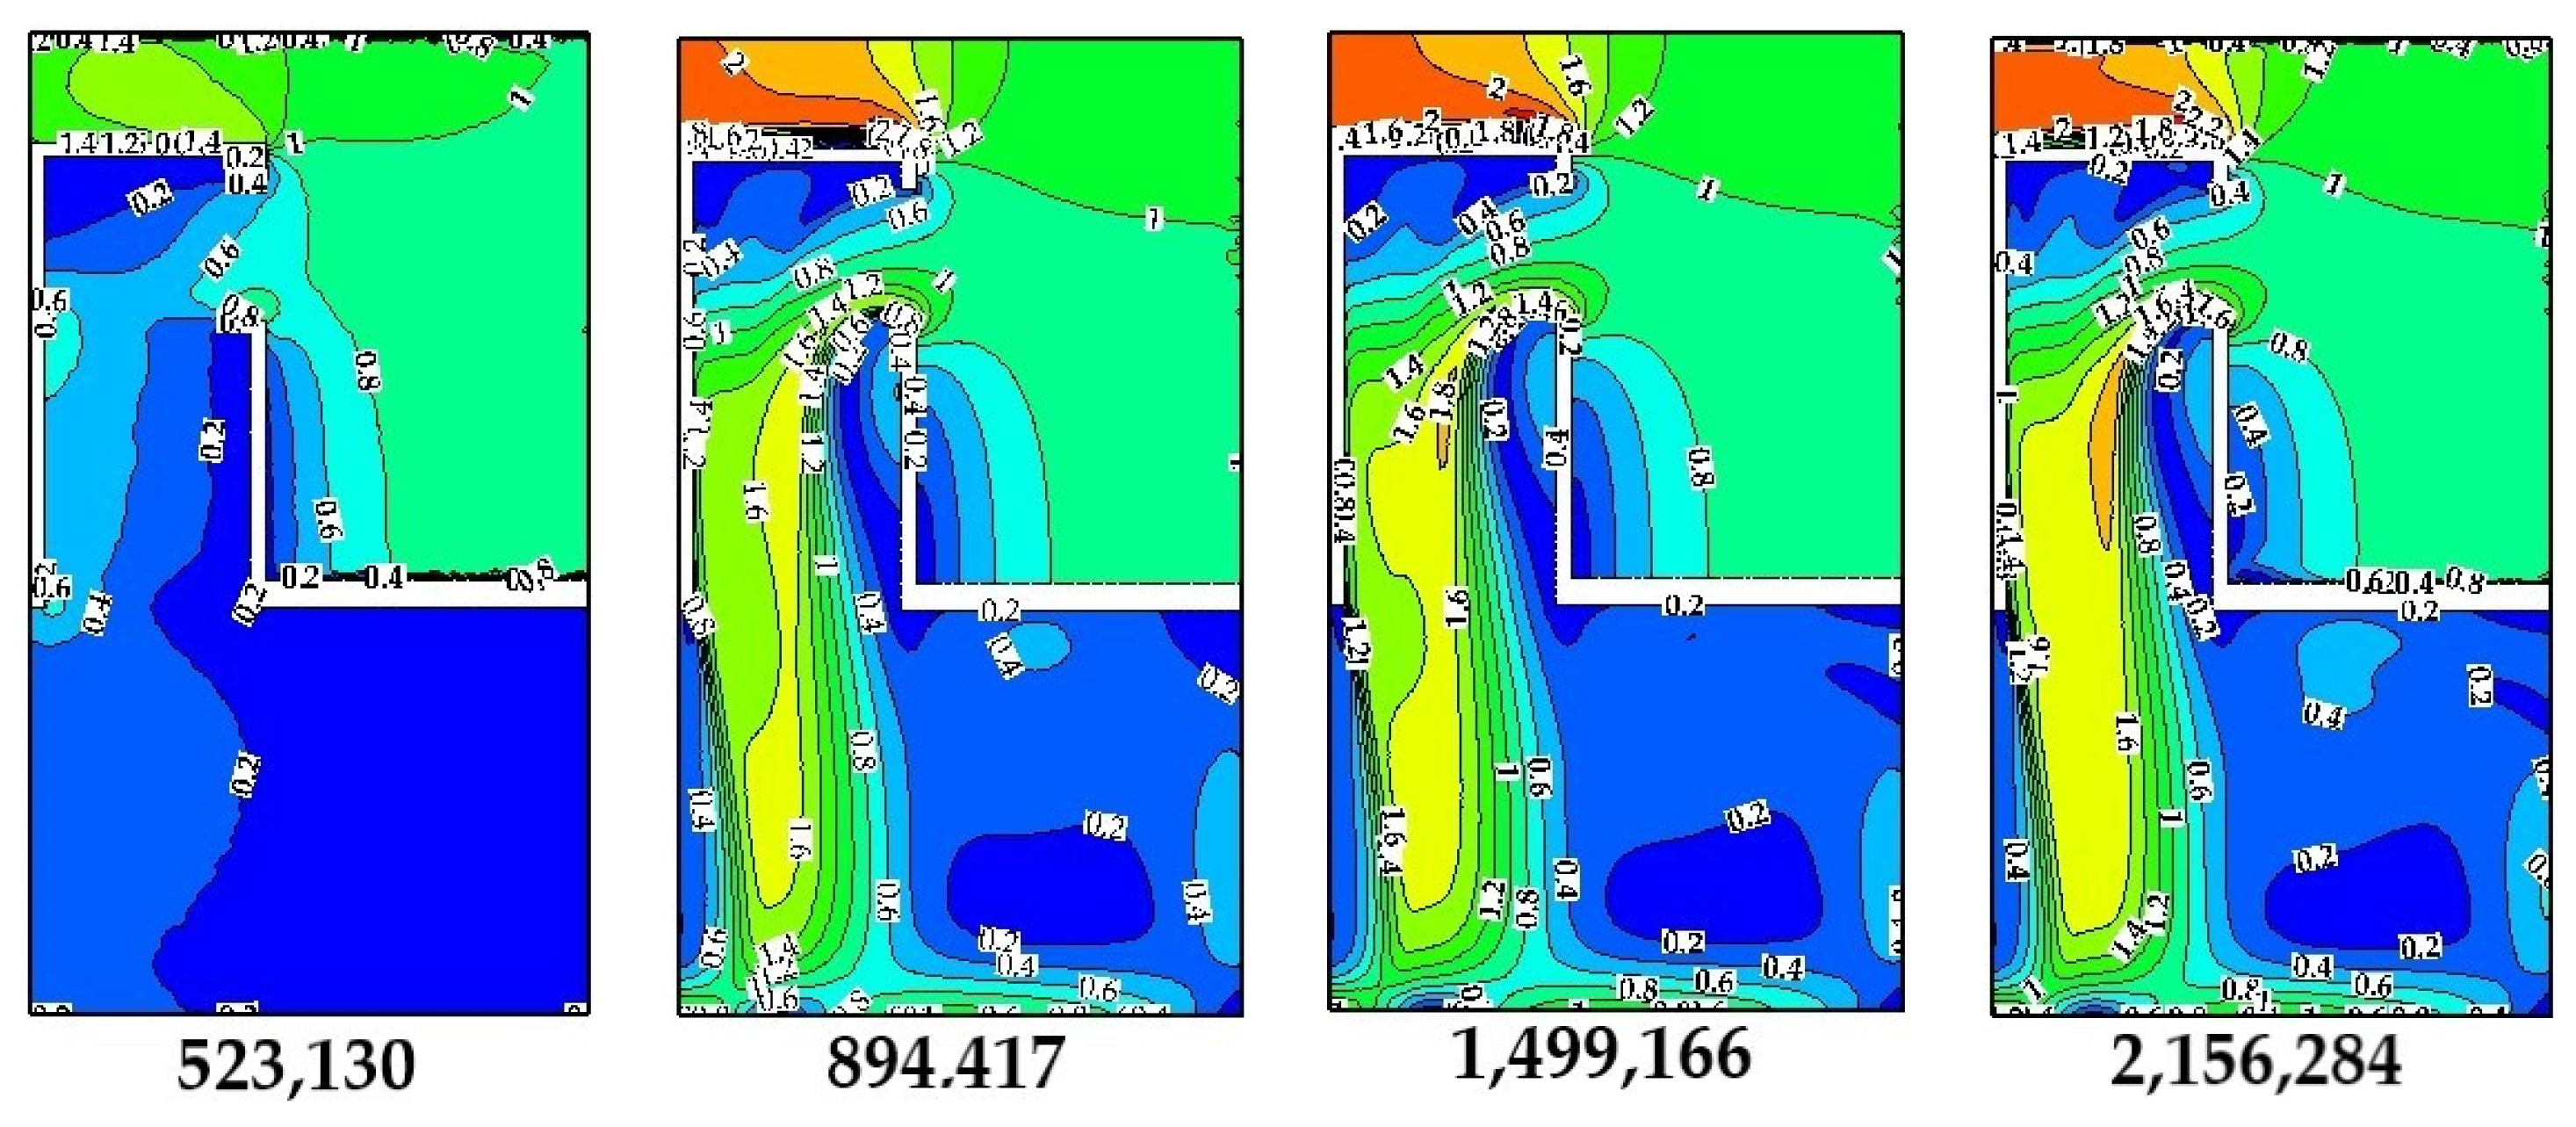
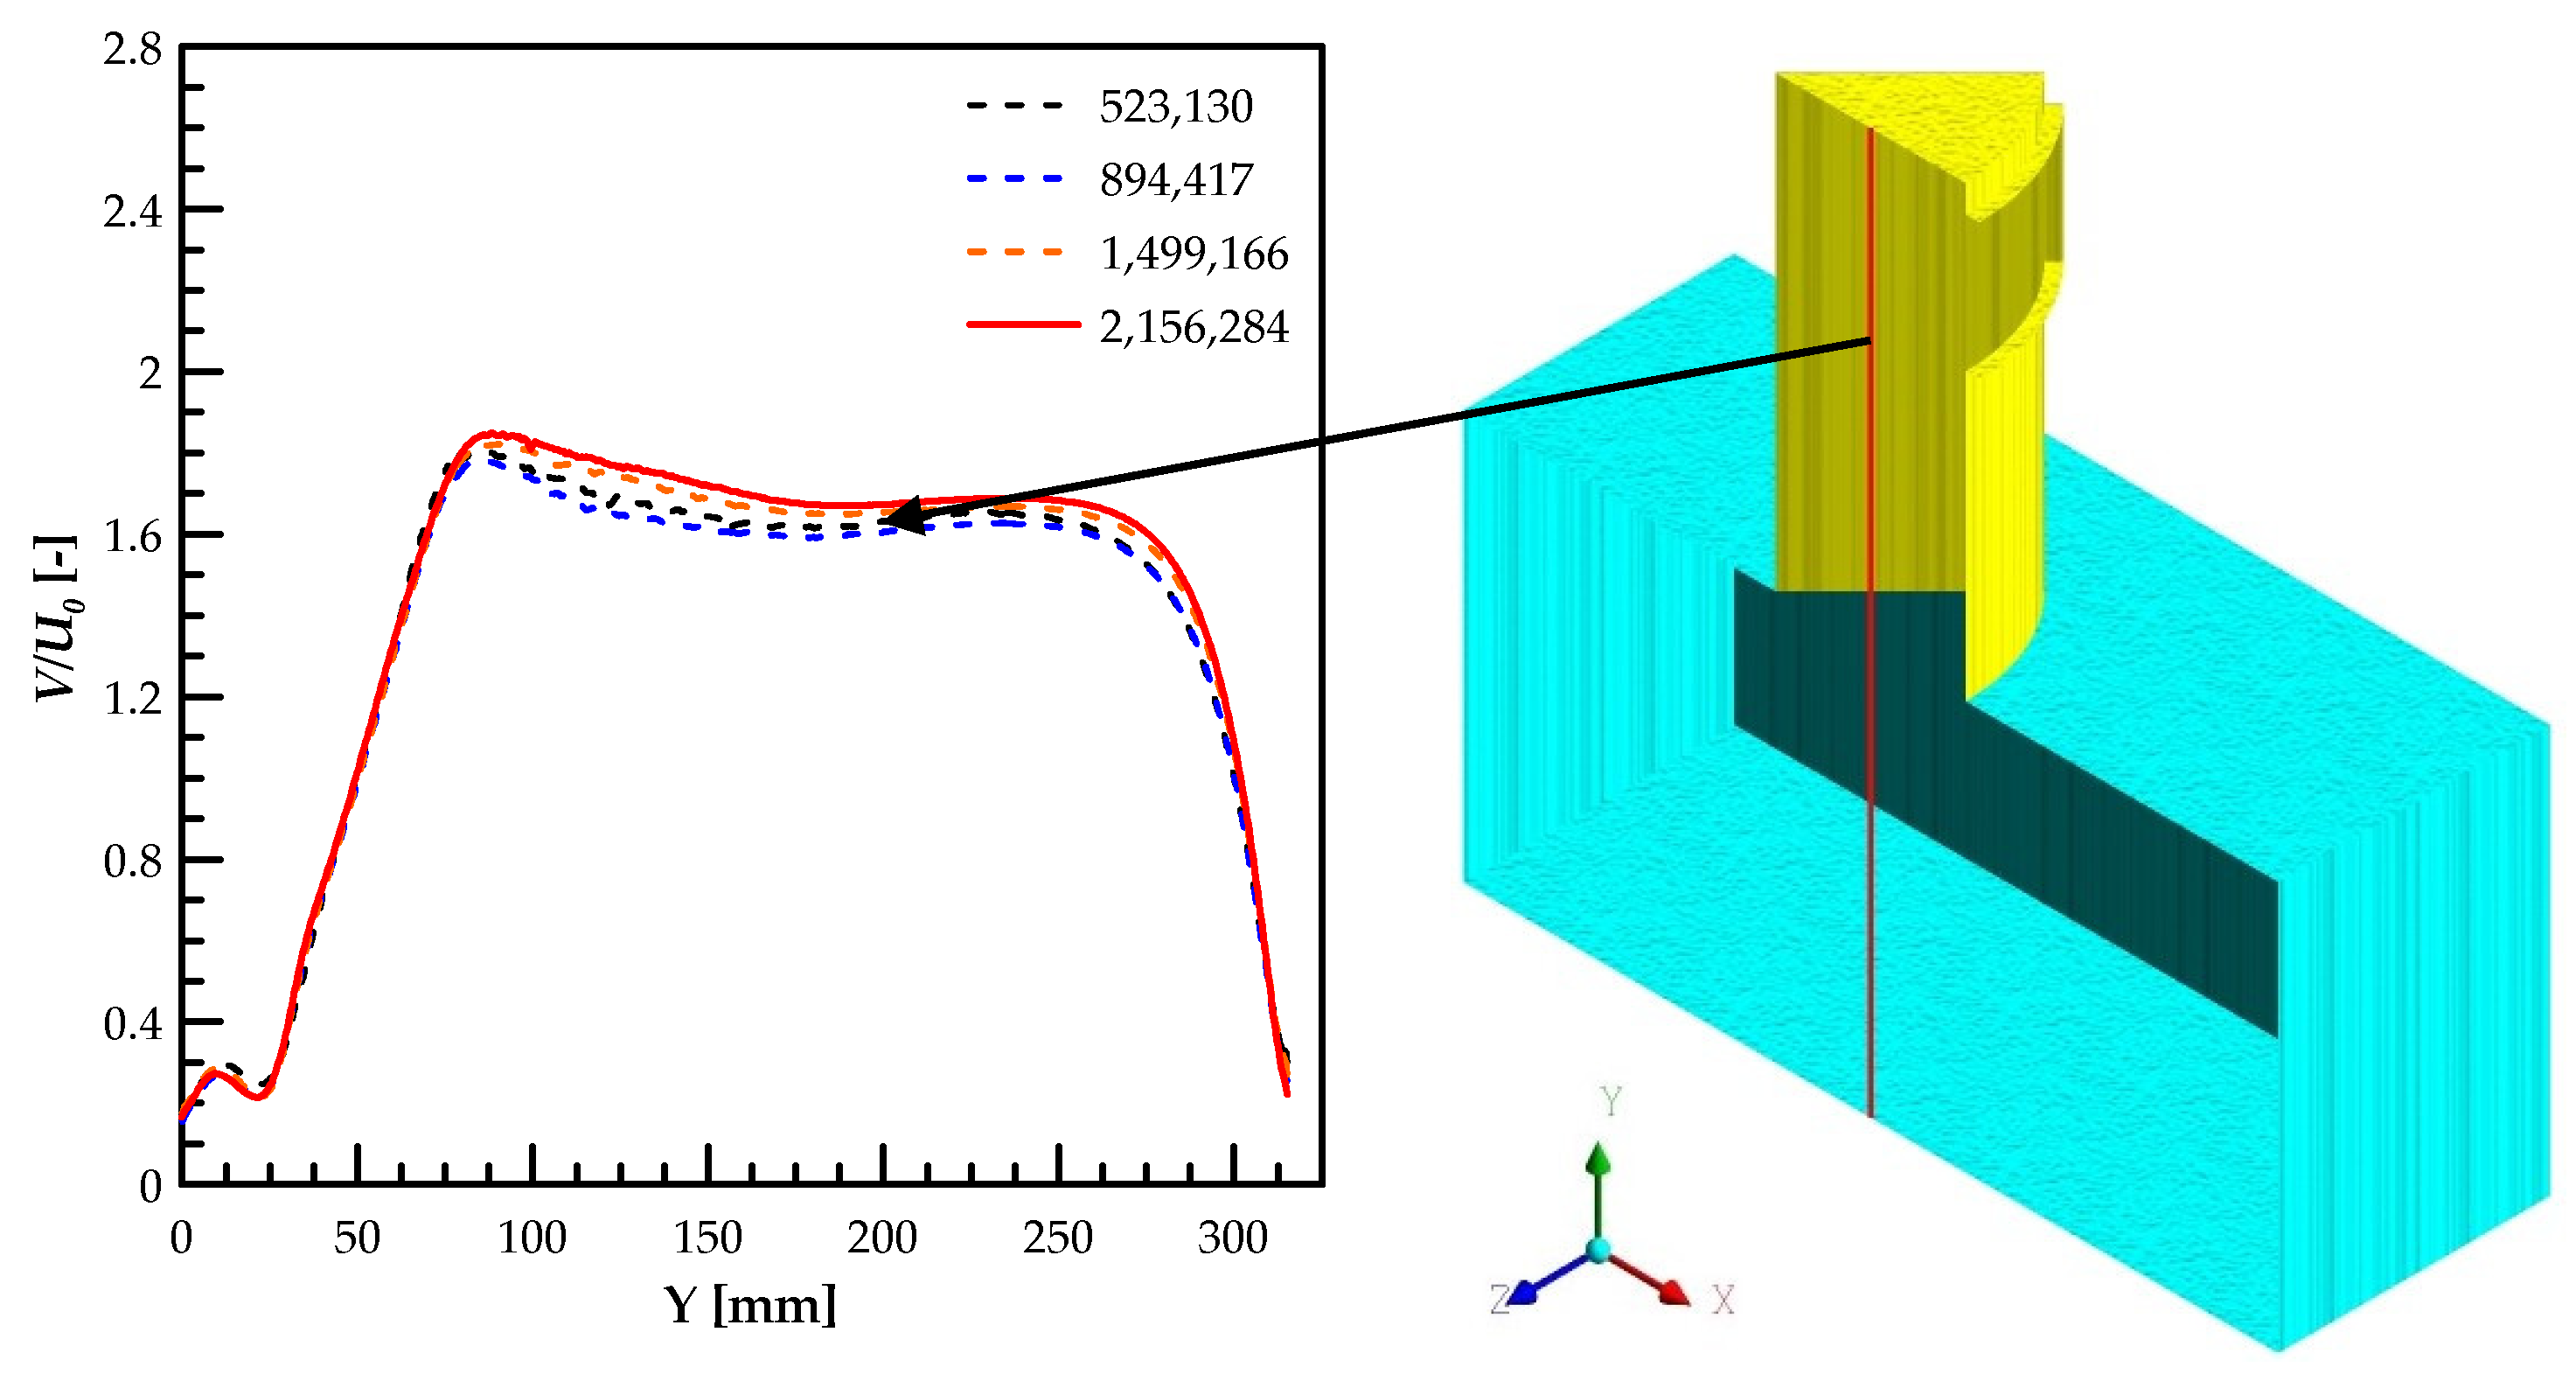
2.4. Grid Generation and Senstivity Check

An unstructured grid was employed to discretize the computational domain using the ANSYS ICEM package. Figure 5 illustrates the details of the generated mesh (very fine) for the central-up windcatcher model. In order to capture the flow field accurately, the grid was refined for the significant areas of interest in the current study, such as the windcatcher and room walls. A mesh independency check was performed to verify the computational domain, as depicted in Figure 6 and Figure 7. The sensitivity check was carried out by applying the same simulation procedure for four different mesh node numbers from 0.5 million (coarse) to 2.1 million (very fine), and the generated results were analyzed. Table 2 presents the average dimensionless velocity values corresponding to the different grids. As depicted in Figure 6, the velocity profiles for the last two mesh node numbers were very similar. Furthermore, the percentage error of the results increased initially and then decreased by increasing the mesh node numbers to reach the lower value of 1% as introduced in Table 2. Thereby, the grid with 2.1 million and beyond was applied for all simulations. The grid refinement near the target walls used 15 prism layers with the first layer height of 0.001 mm and a height ratio of 1.2. Moreover, the dimensionless wall distance value (Y+) of the first layer was less than unity.

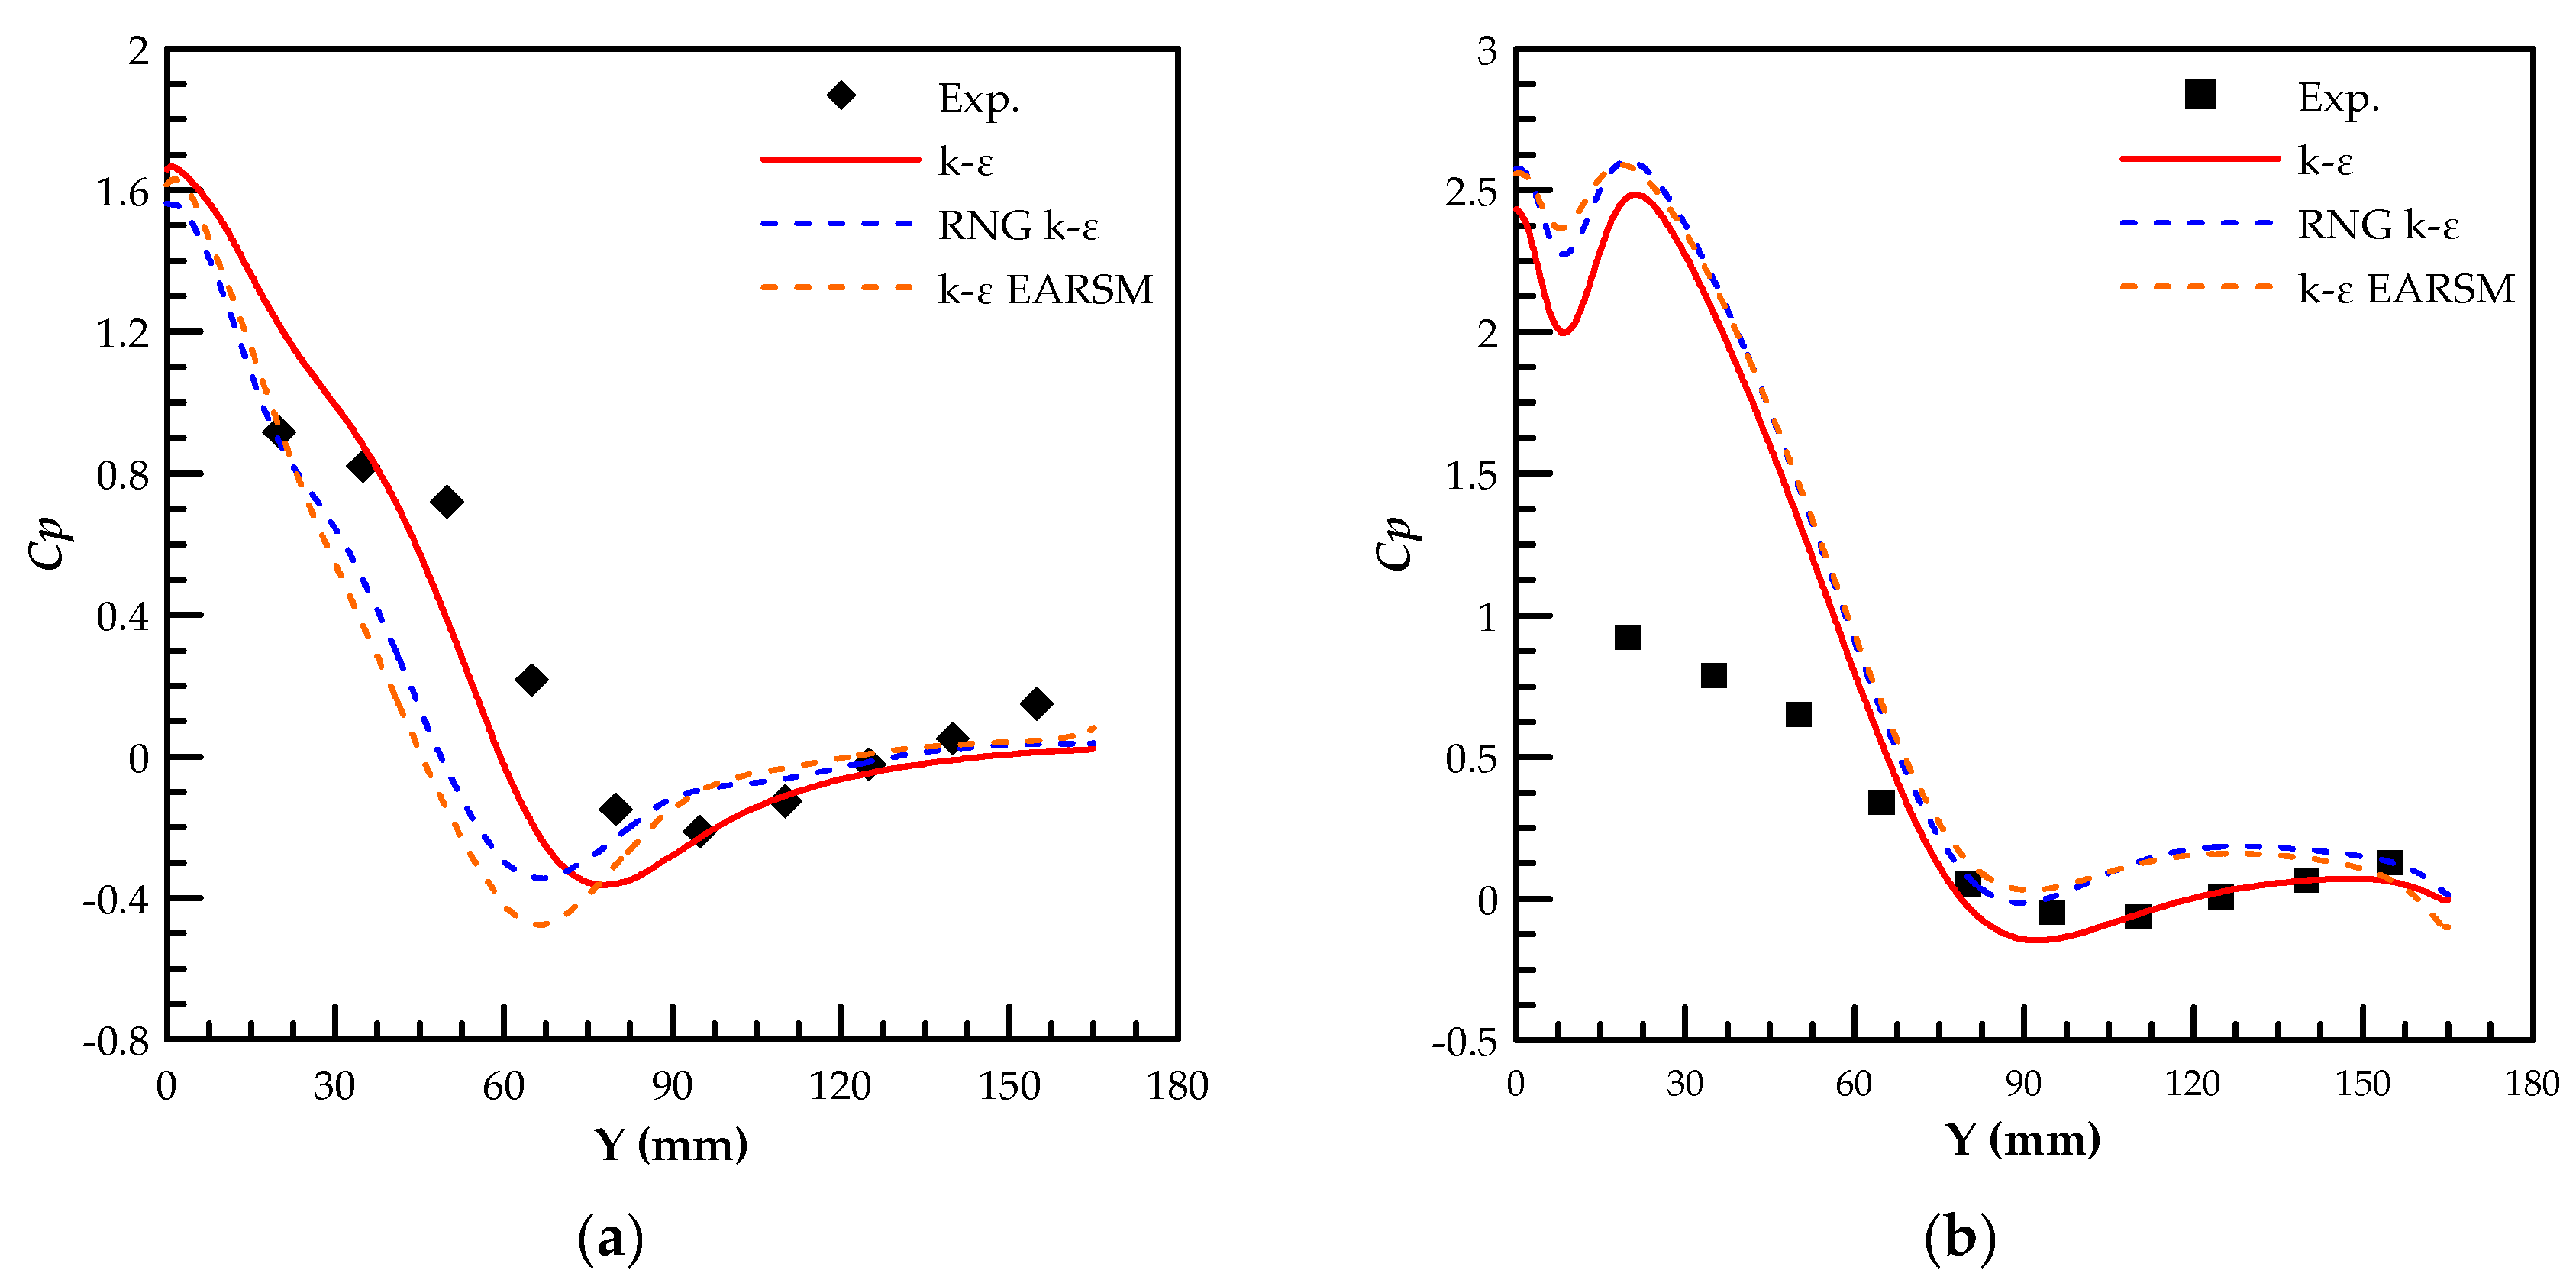
2.5. Turbulence Model Validation

The accuracy of the numerical results was evaluated using the most suitable turbulence model, which achieved reasonable agreement with the most pertinent experimental data. Three turbulence models were used to predict the experimental data at a free stream velocity of 10 m/s, as shown in Figure 8. As depicted in Figure 8, the k-epsilon model showed better agreement with the experimental results than the other turbulence models. Furthermore, many previous related studies [9,11,35,37,39] confirmed the superiority of this turbulence model in predicting the flow behavior inside the windcatcher. Therefore, the k-epsilon turbulence model is applied for all simulations in the present work.

3. Results

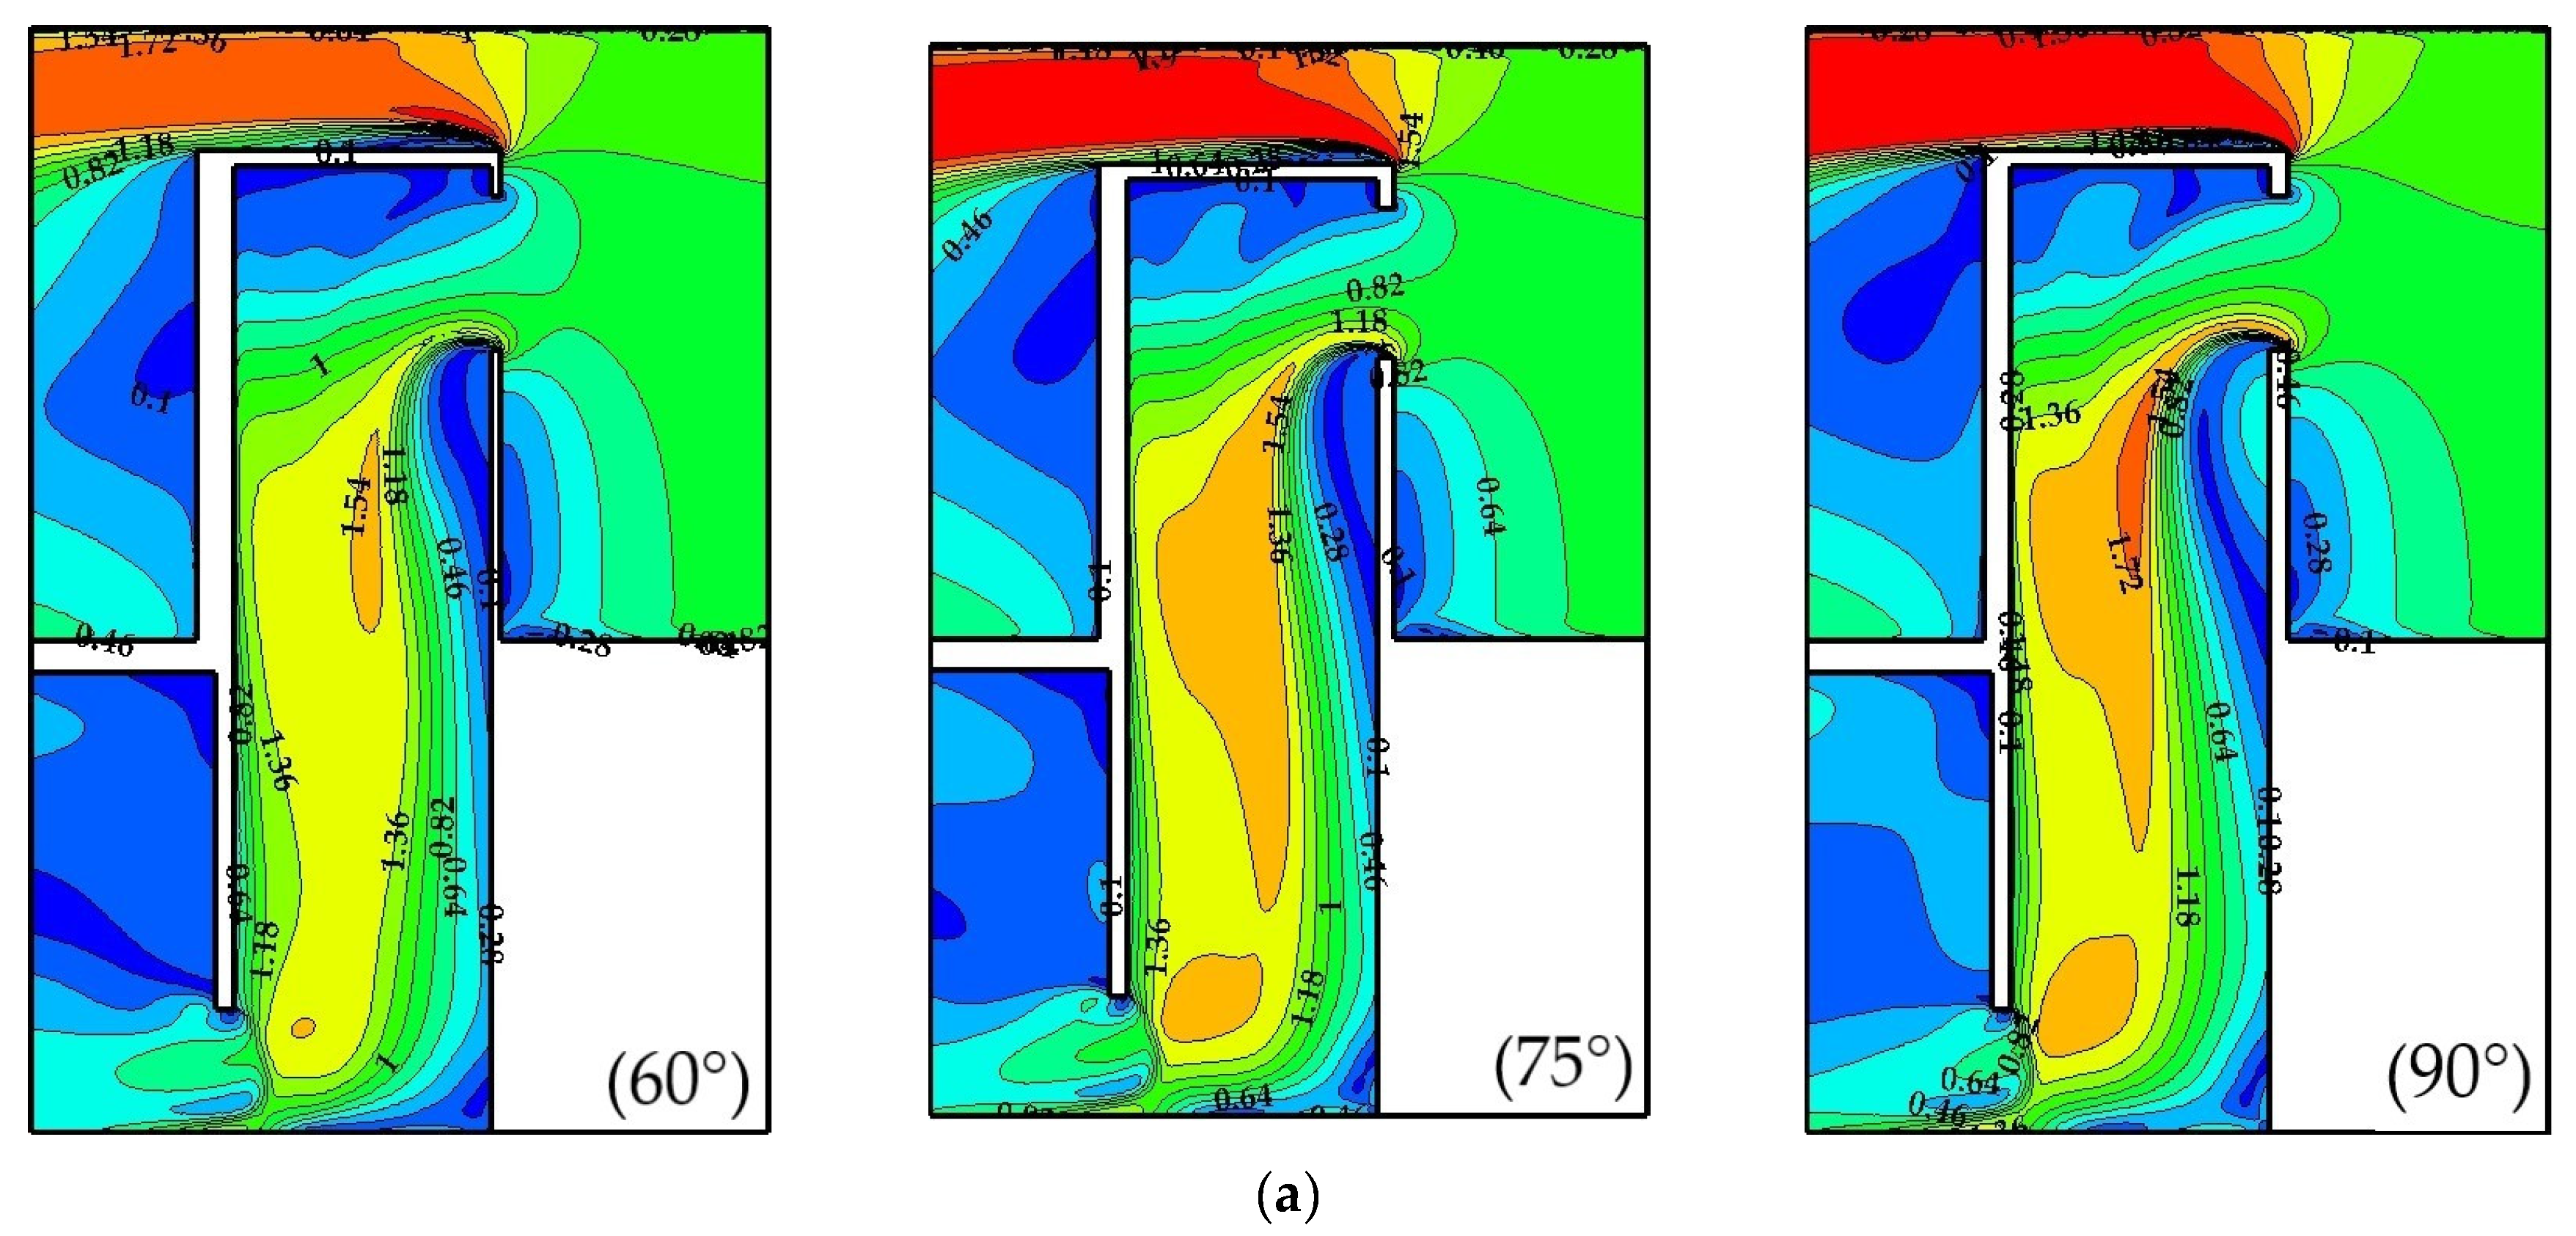
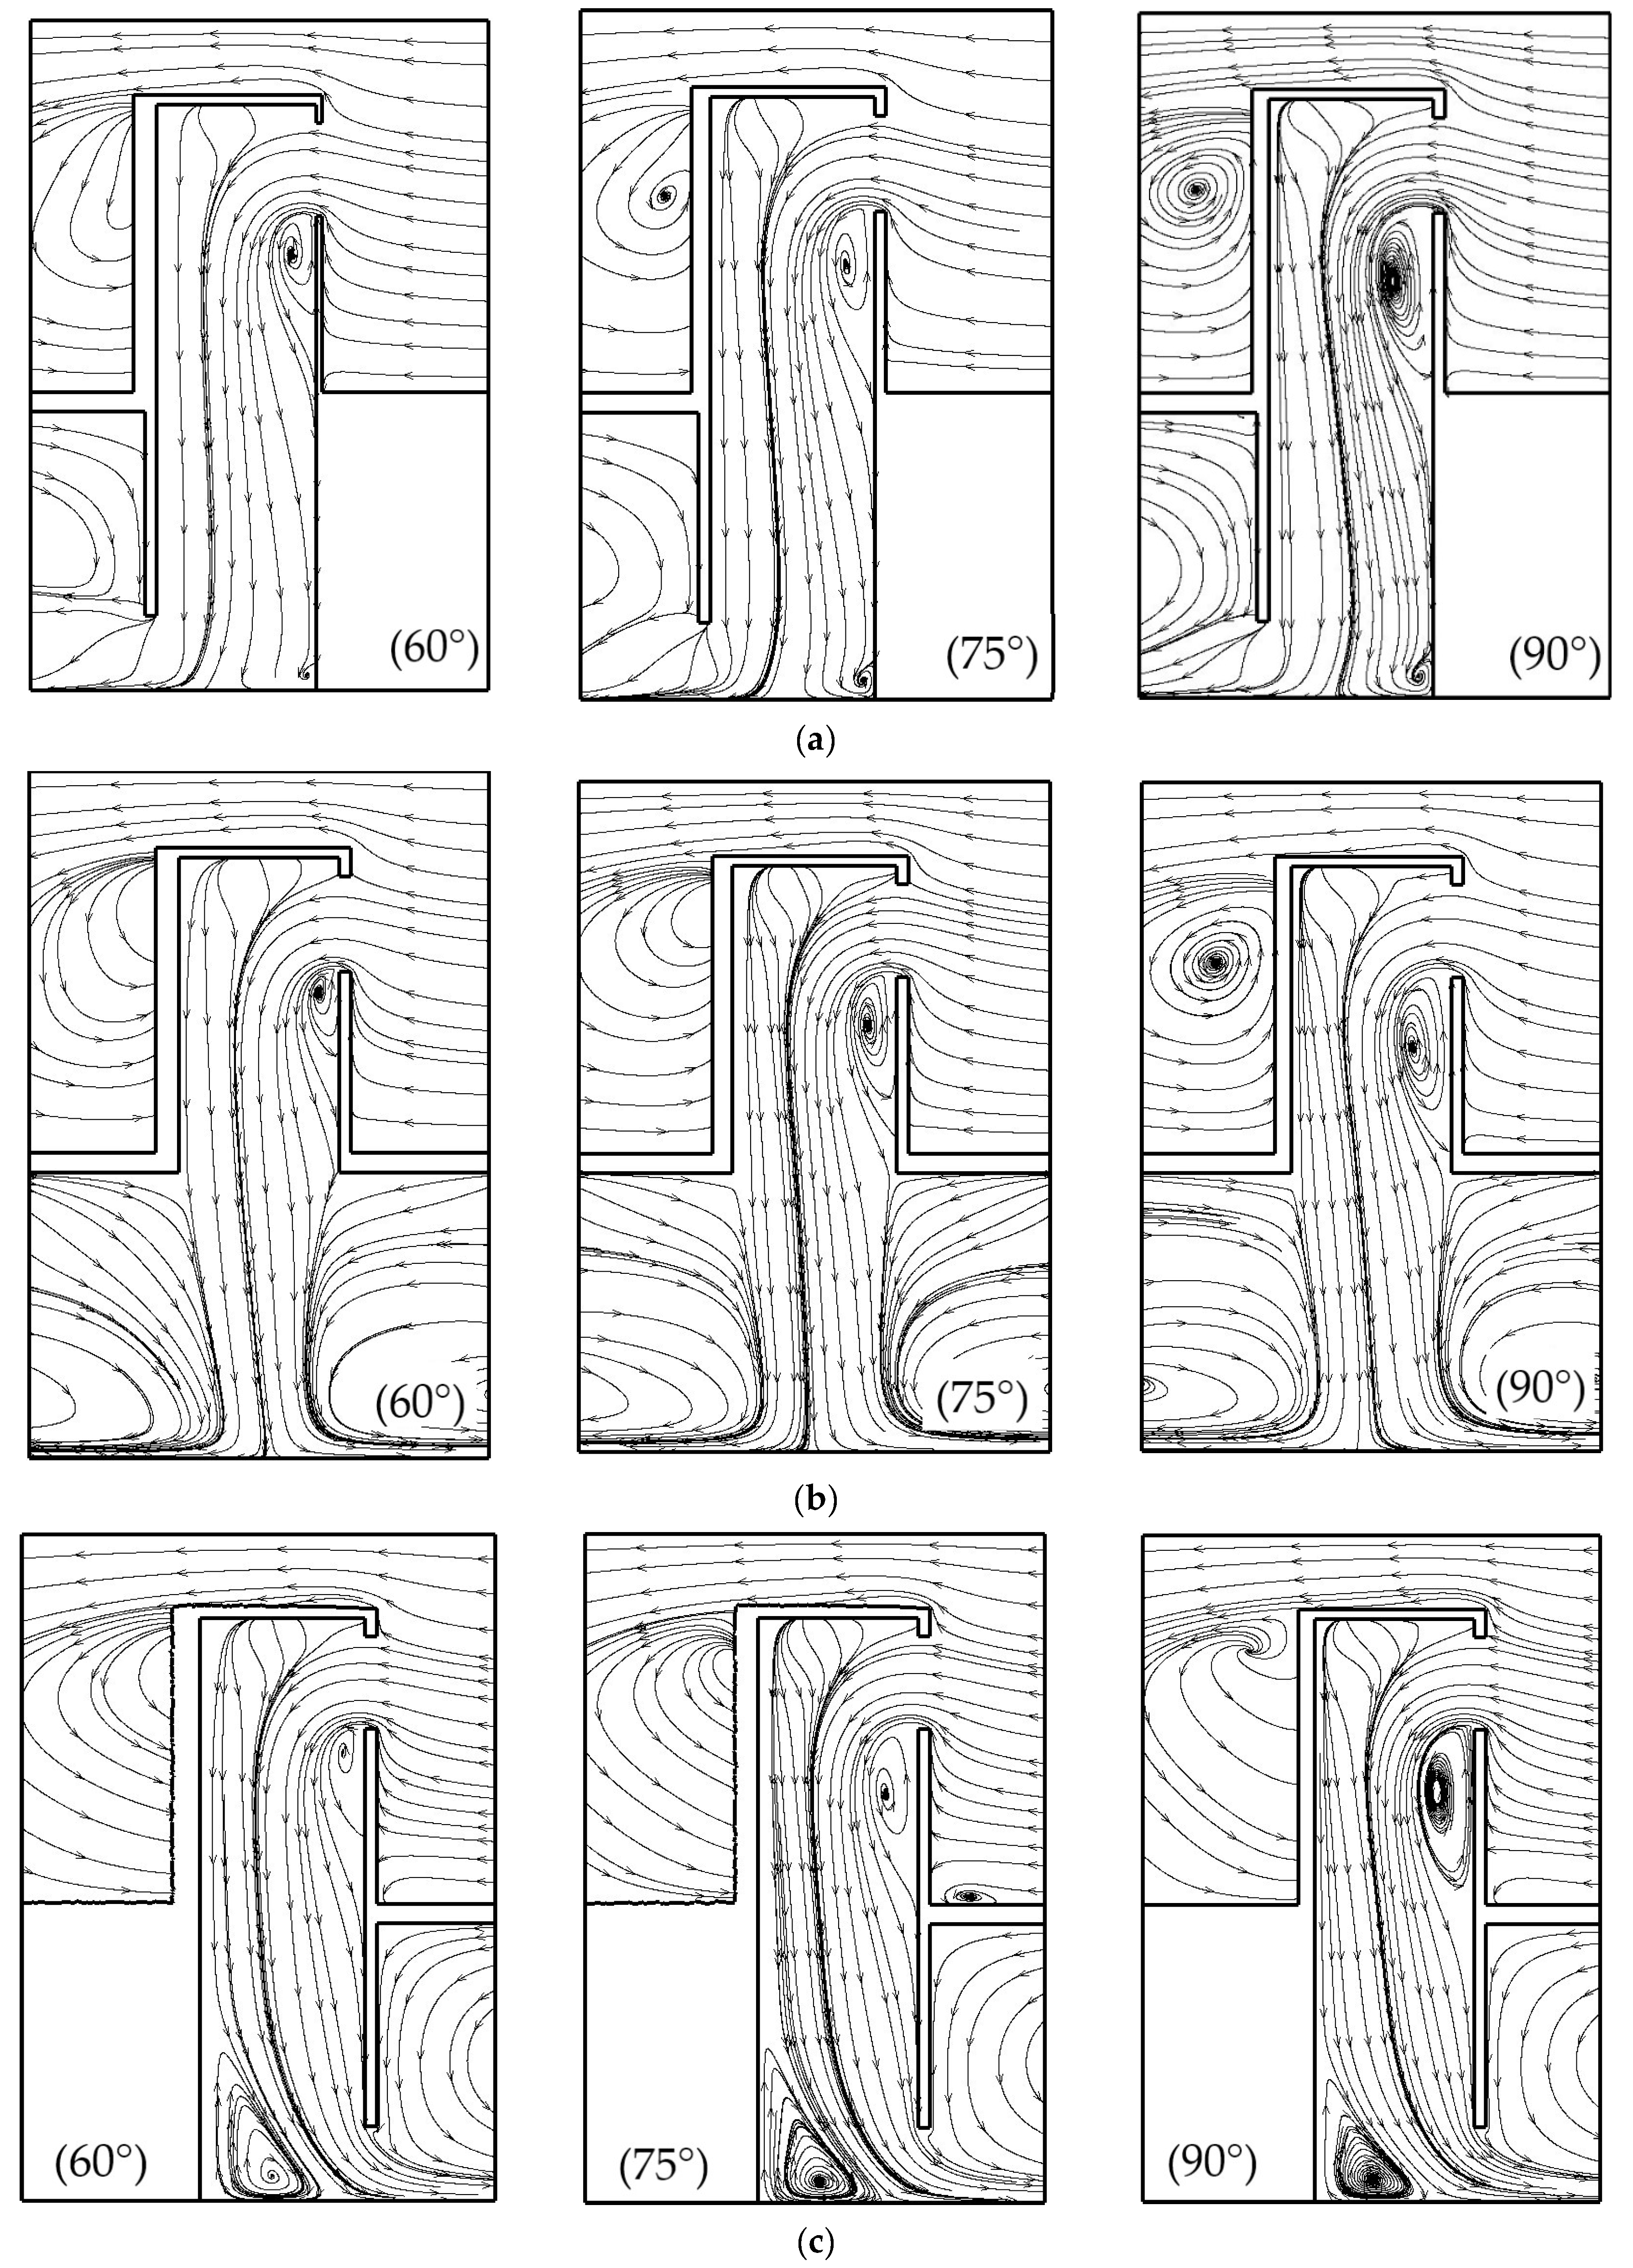
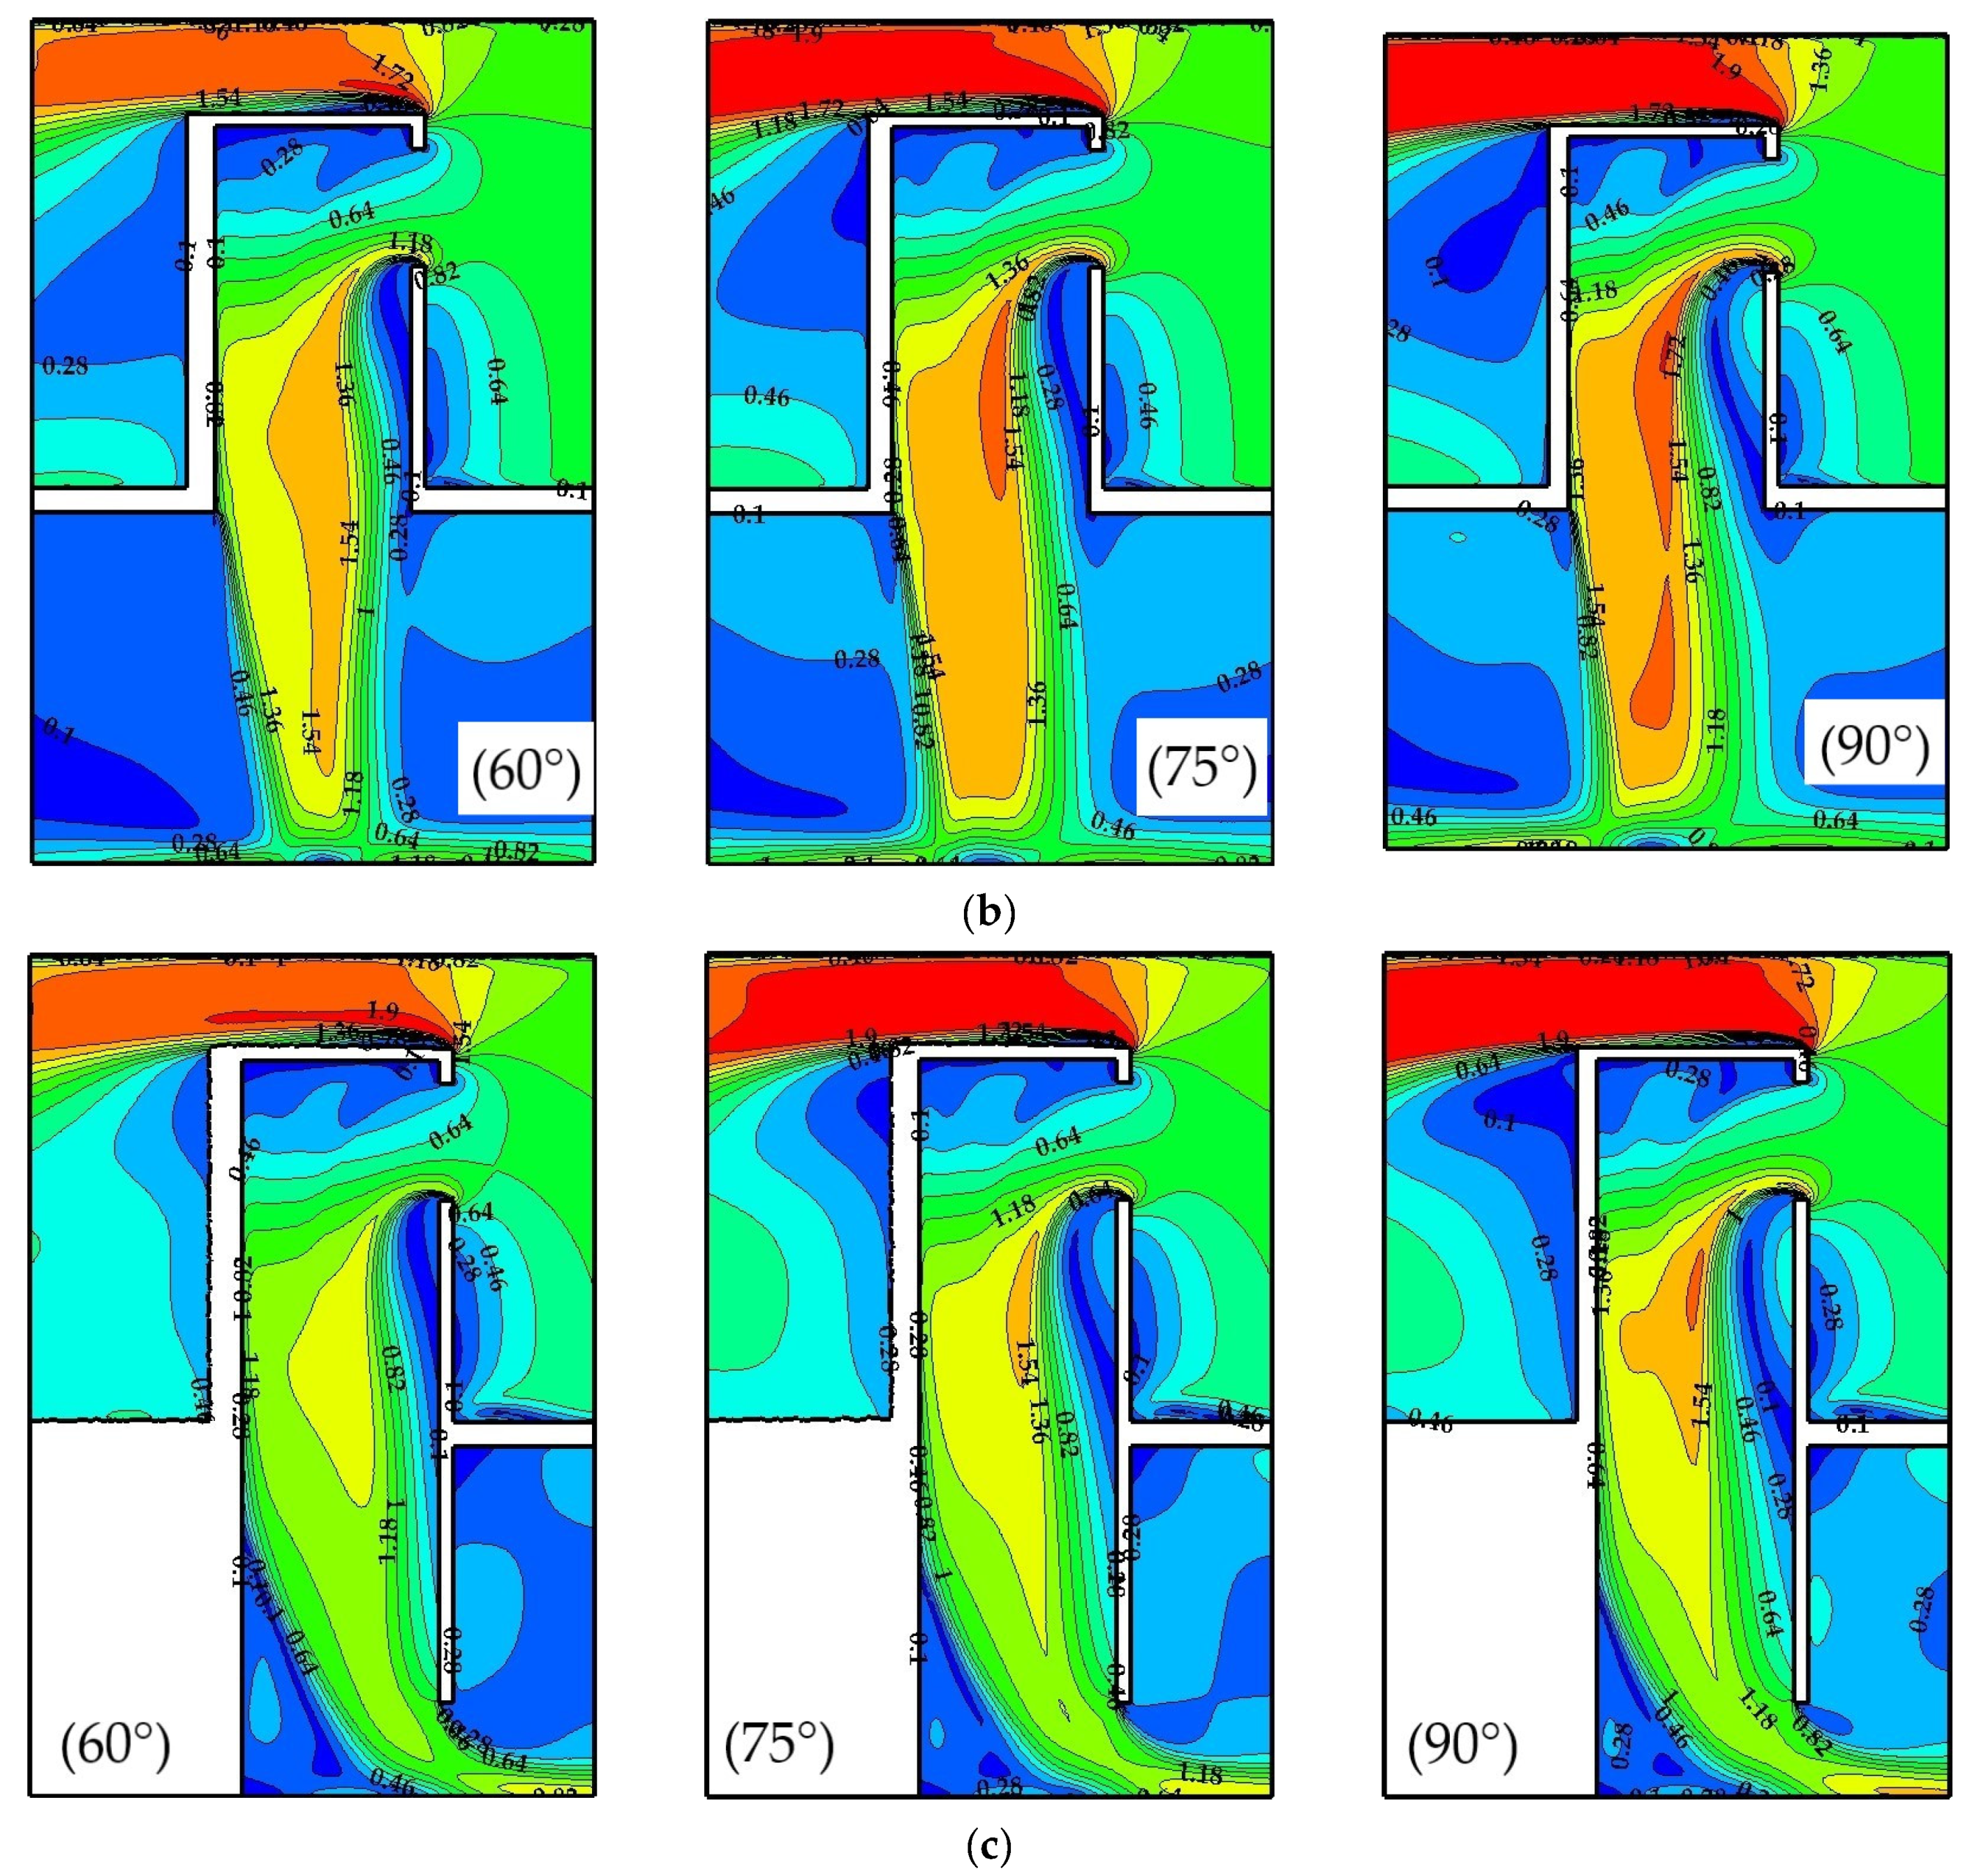
3.1. Induced Air Distribution

The internal flow of a windcatcher has complicated behavior as it is affected by flow separation, recirculation, reattachment, as well as secondary flows. Numerical simulations were performed for the different windcatcher models under different wind speeds, from 1 m/s to 5 m/s. The flow characteristics were described for the new windcatcher models at different opening angles from 60° to 90° for three different feeding orientations (leading-down, central-up, and trailing-down). Figure 9 shows contours of the dimensionless velocity magnitude of the indoor airflow on the symmetrical plane of the new windcatcher models at U0 = 5 m/s. For all cases, the outdoor airflow enters the windcatcher tower through the curved inlet opening in which it is impinged by the two sidewalls and changes its direction down toward the exit opening of the windcatcher. Then, the indoor airflow enters the ventilated room and fills its space until leaving from the two opposite room openings as depicted in Figure 2. For the same feeding orientation, by increasing the opening angle from 60° to 90°, the flow velocity increases through the windcatcher tower, which in turn leads to an increase in the fluid momentum inside the ventilated room.
At an identical opening angle, the flow momentum decreases gradually through the windcatcher tower due to the large pressure gradient between the inlet and exit openings of the windcatcher as shown in Figure 9a. In addition, the indoor flow velocity almost deteriorates at the end of the windcatcher tower due to the sharp edge of the corner, and then the flow changes its trajectory to a low momentum. In the case of the central-up feeding orientation, there is no corner at the end of the windcatcher tower and the duct is short, as depicted in Figure 9b. Thereby, the indoor flow retains its high fluid momentum better than in the leading-down model, which in turn increases the induced air through the ventilated room. For the last orientation (trailing-down), the indoor flow has the same behavior as the first case (leading-down) except at the end of the windcatcher tower, where the flow has a higher momentum.
Figure 10 illustrates the flow patterns for all cases, in terms of velocity streamlines on the symmetrical plane at the different inlet opening angles for different feeding orientations. Generally, the flow separation and recirculation zone increase directly downstream of the inlet opening due to the sharp edge. Furthermore, they increase with the increase in the opening angle from 60° to 90° as depicted in Figure 10. At the same opening angle, there is a small corner vortex at the end of the windcatcher tower as shown in Figure 10a. Additionally, the reattachment after flow separation occurs in the opposite direction to the windcatcher exit opening. In the case of the central-up orientation, the indoor flow impinges on the room floor and creates two opposite vortices as indicated in Figure 10b. In Figure 10c, there is an additional large corner vortex at the end of the windcatcher tower, which turns the flow direction toward the ventilated room. The dimensionless velocity profile in Figure 9c can be attributed to the flow reattachment in the same direction as the descending flow trajectory toward the windcatcher exit opening as shown in Figure 10c.

3.2. Aerodynamic Analyses

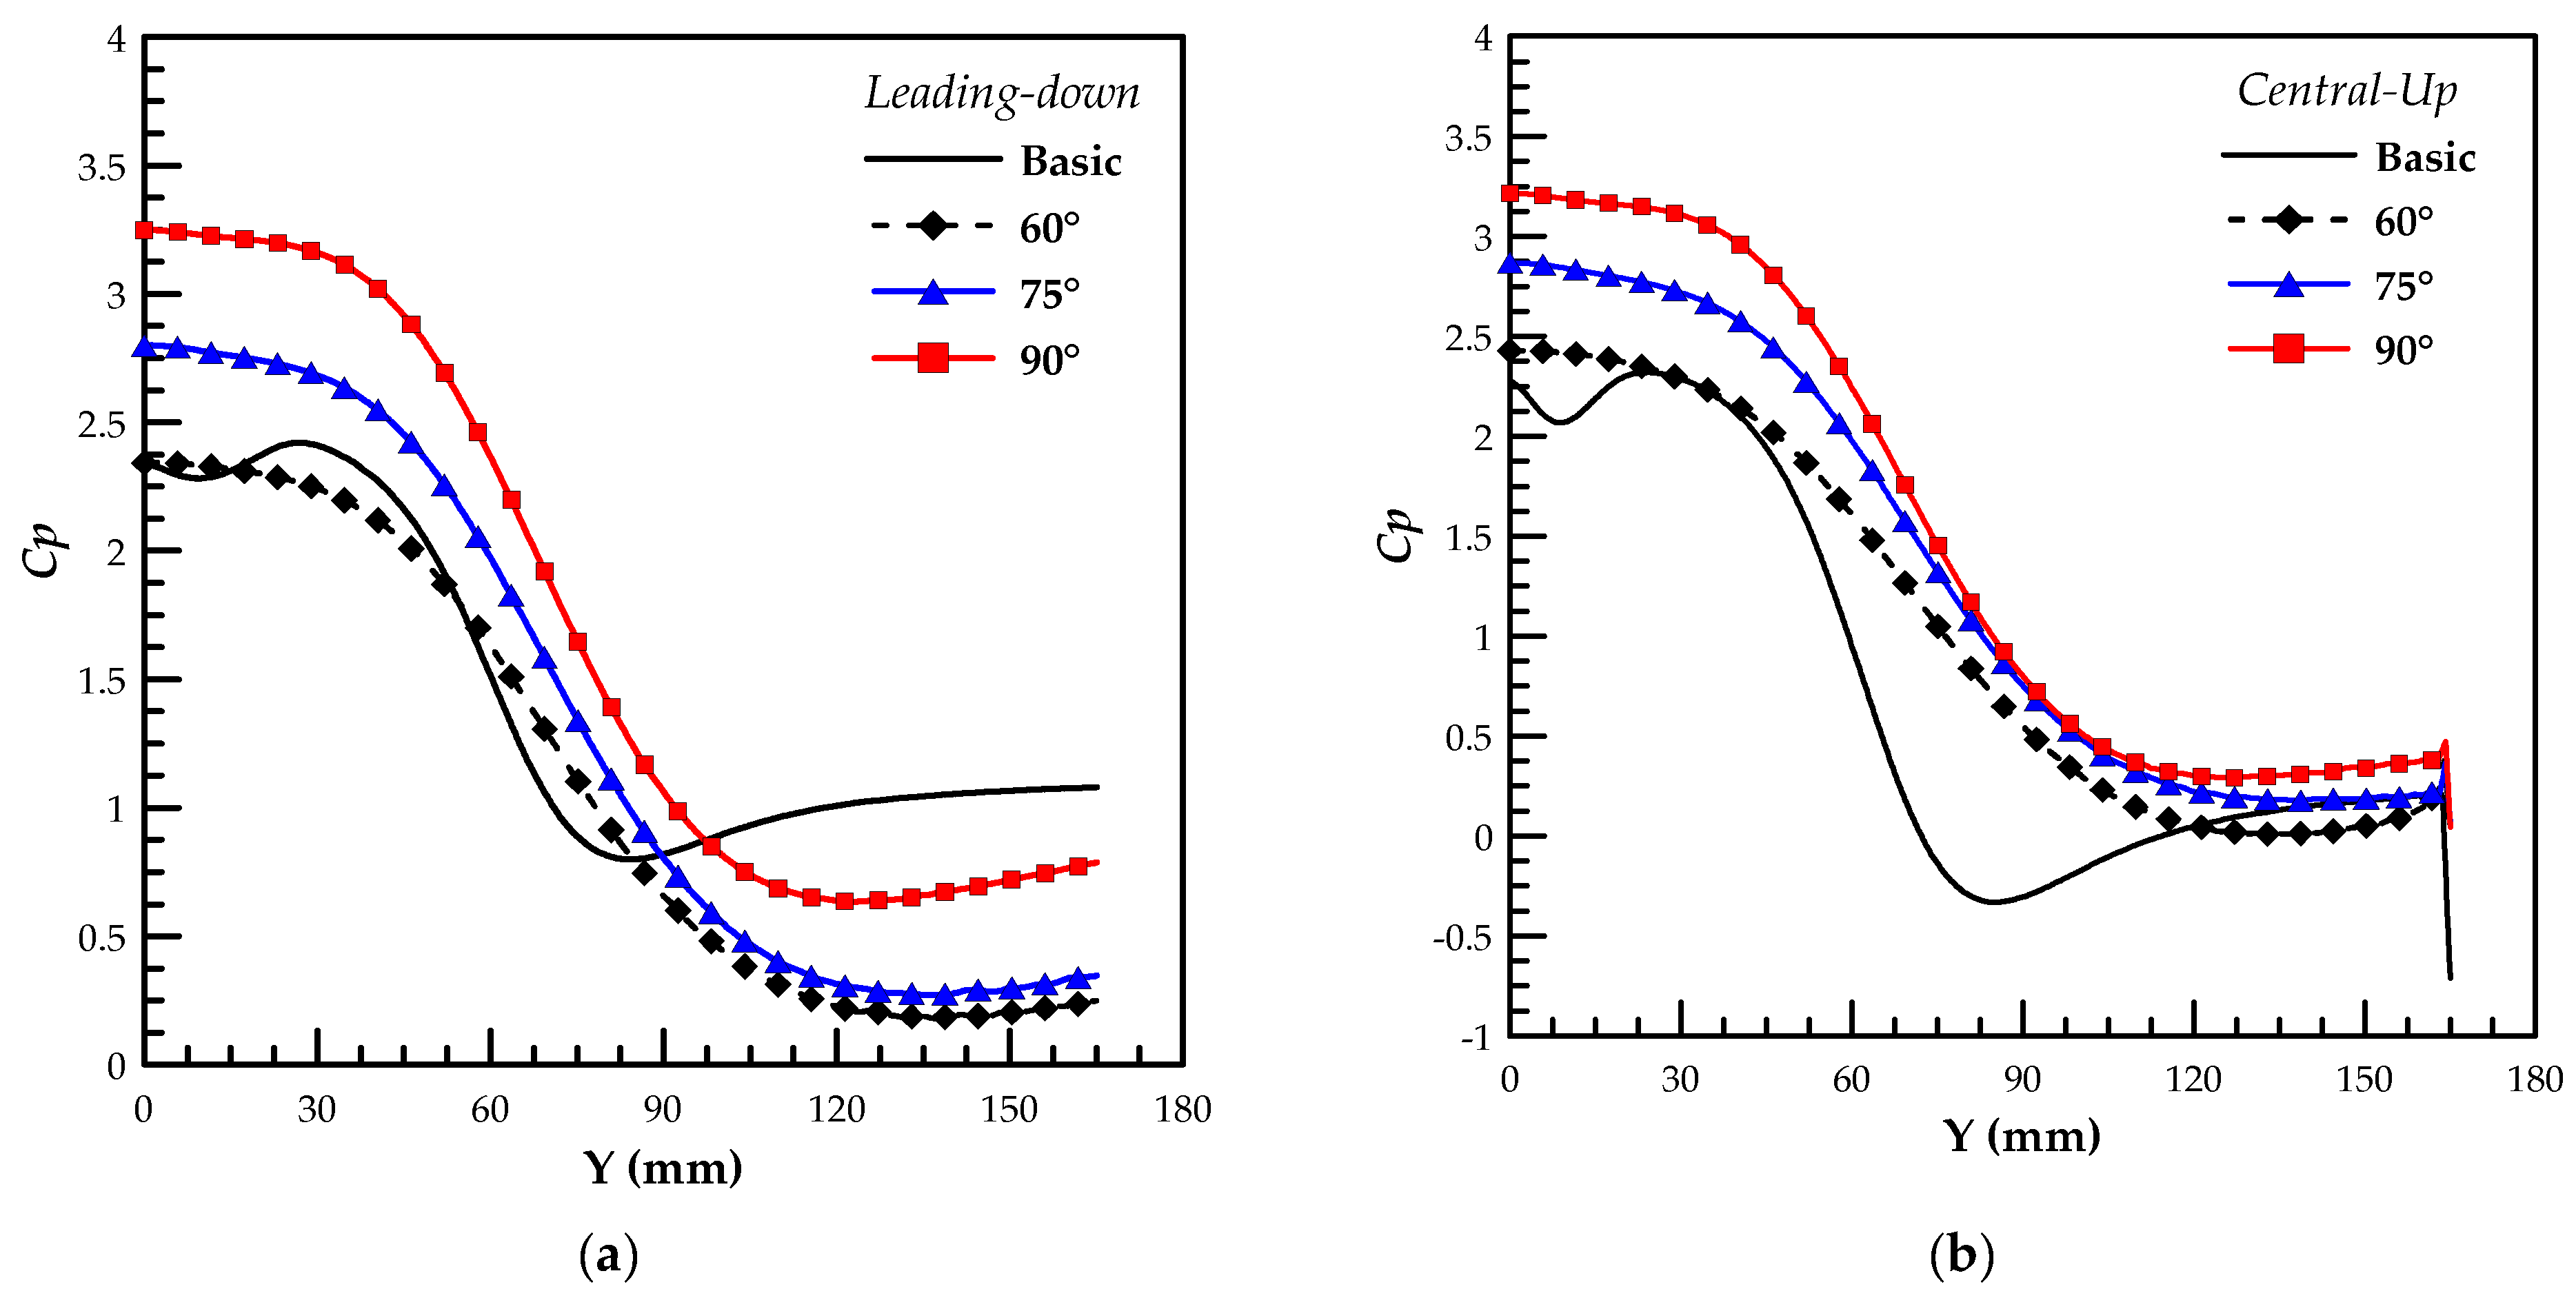
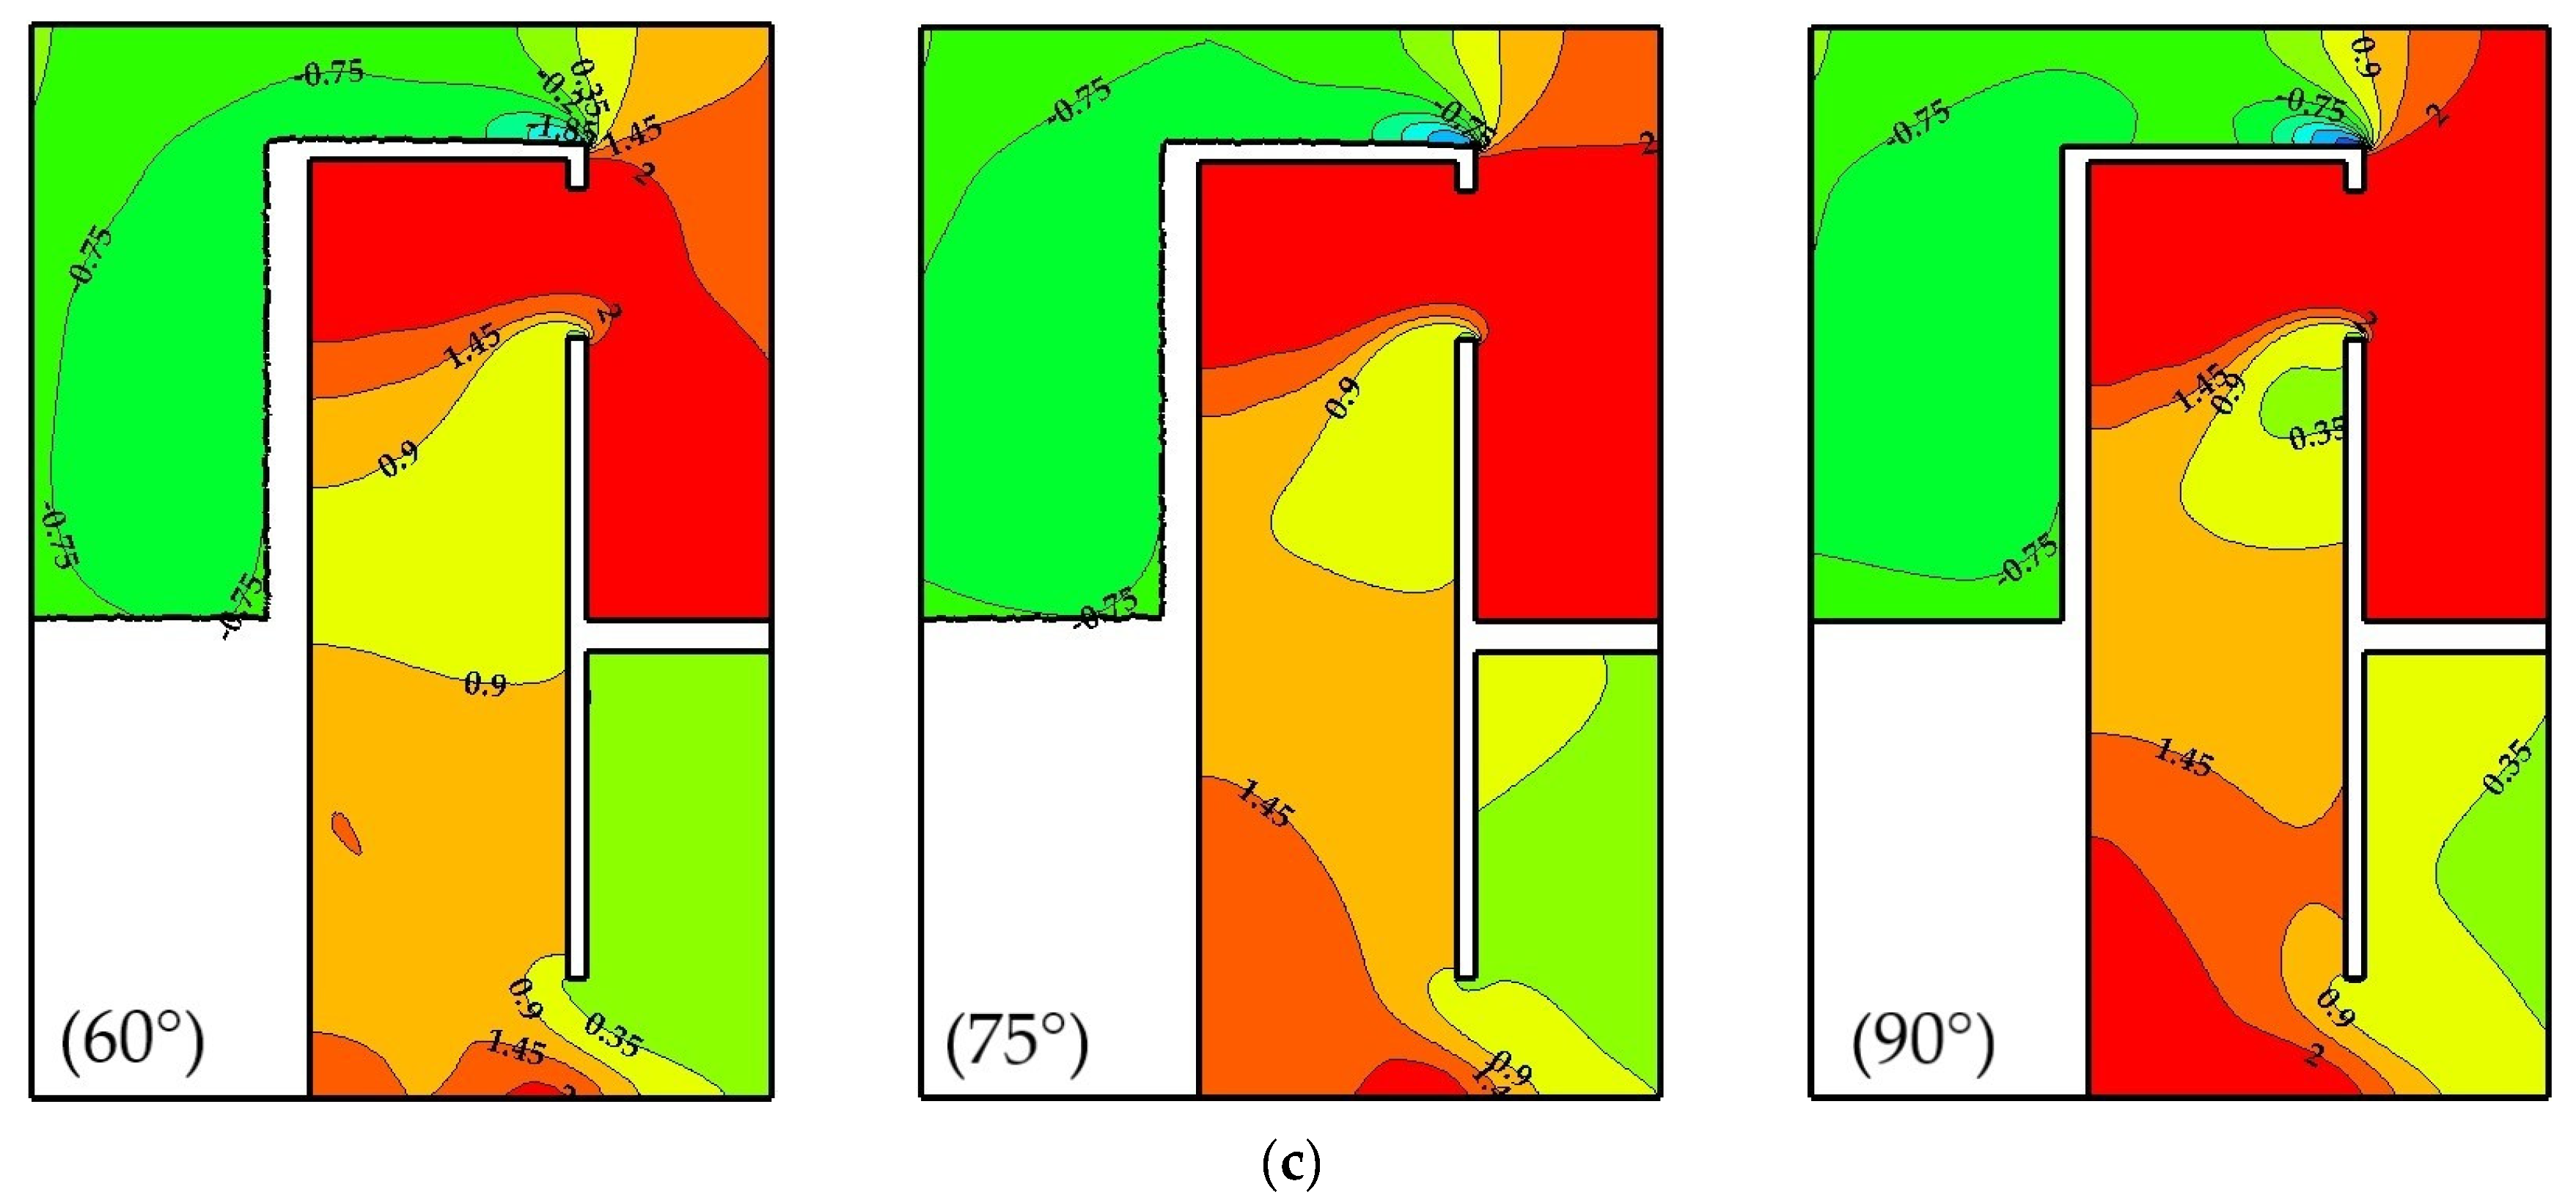
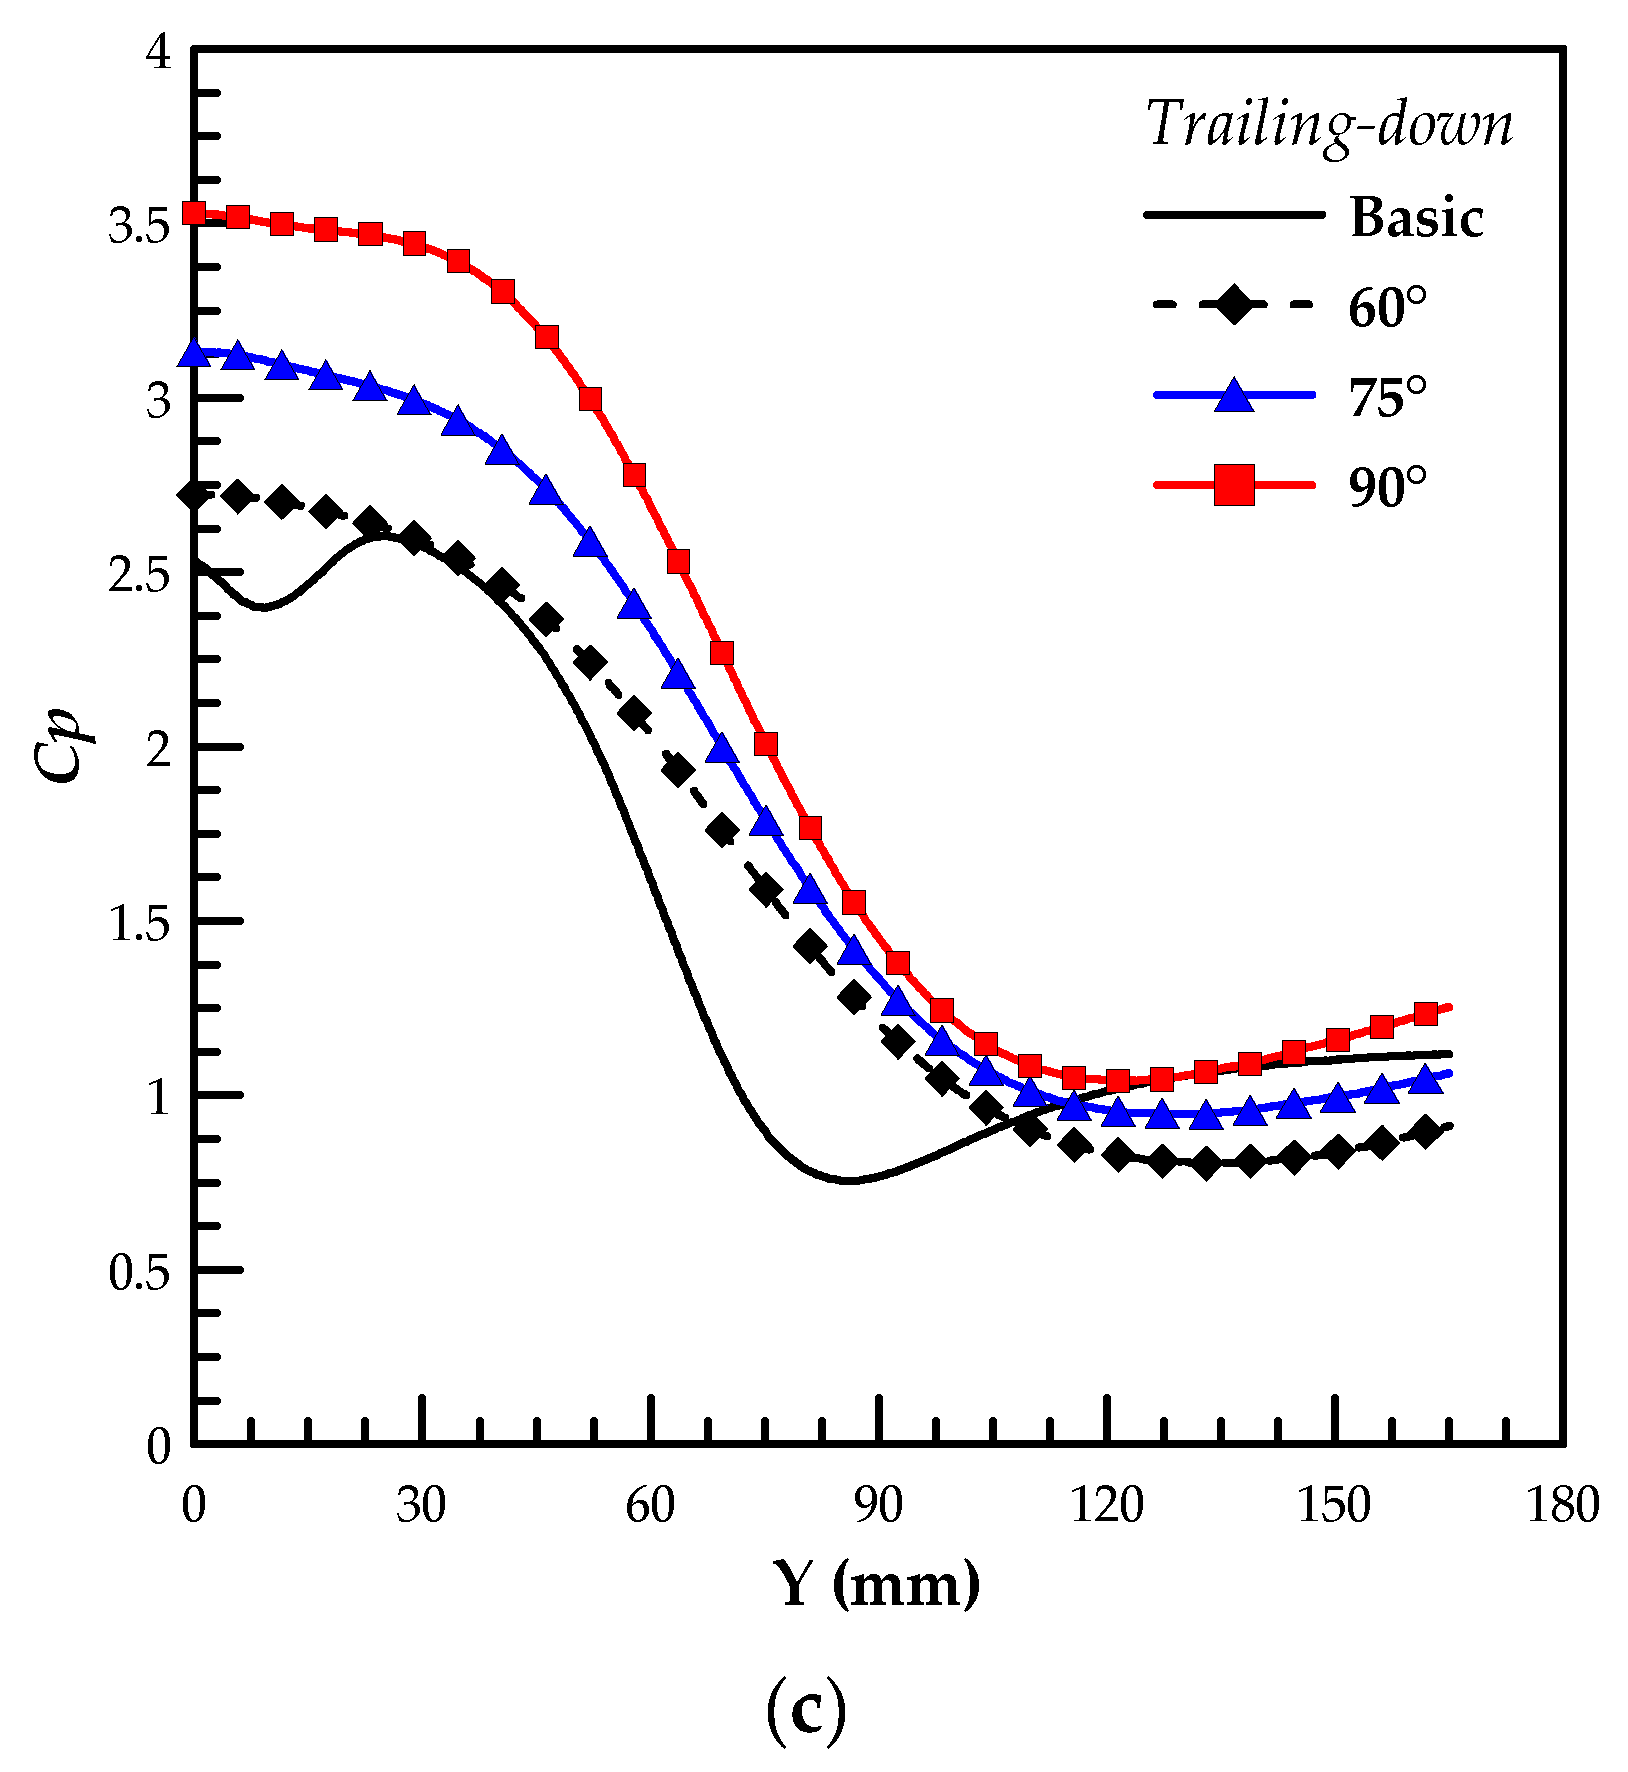
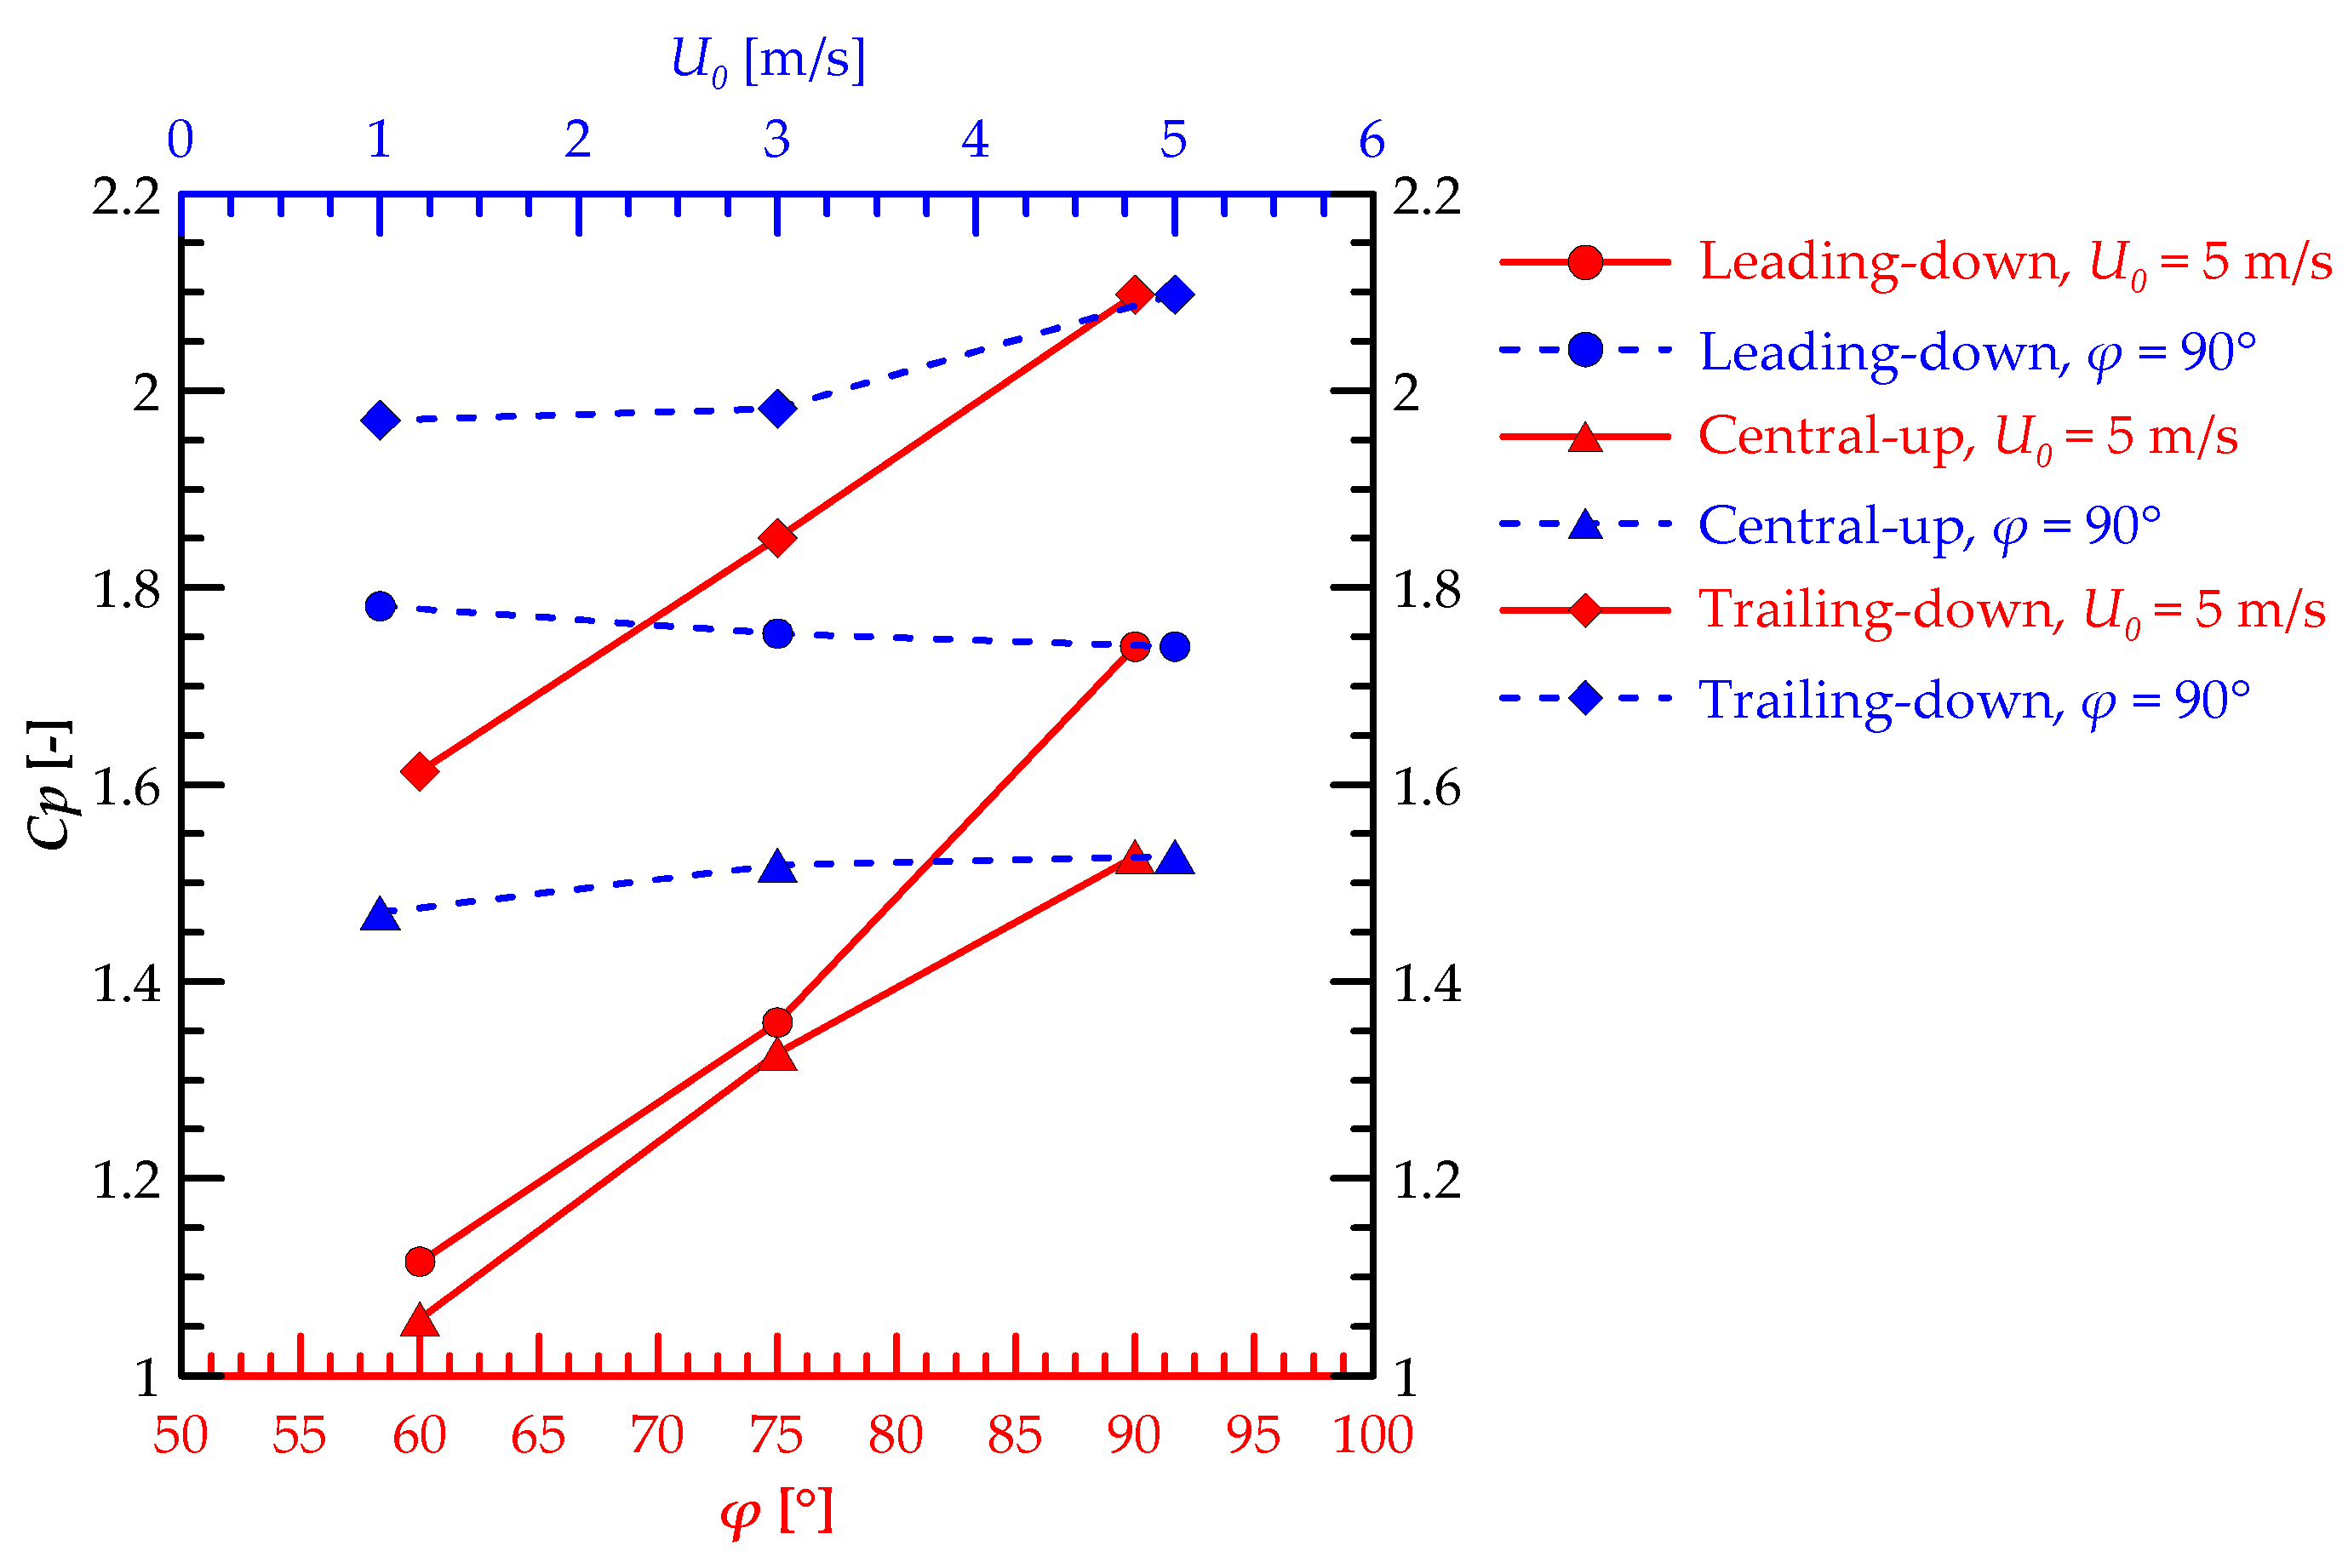
3.2.1. Pressure Coefficient

The static pressure coefficient determines the ratio of the local surface pressure and the dynamic pressure as presented in Equation (1). Figure 11 indicates the variations of static pressure coefficient on the intersection line of the leeward surfaces for all windcatcher models for different feeding orientations under a constant wind speed. As depicted in Figure 11, all new models generate pressure coefficients with maximum values (positive values) that decrease due to the indoor flow acceleration. Then, a sharp decrease occurs further downstream along the windcatcher tower until the minimum values are reached at Y = 120 mm due to the flow separation, as shown in Figure 10. After that, the pressure coefficients slightly recover again toward the end of the windcatcher tower as shown in Figure 11. Moreover, the pressure coefficient variations increase with the increase in the opening angle from 60° to 90° due to the increase in the recirculation zones, which increase the static pressure of the inlet-opening surface. Based on the feeding orientation parameters, all of the new windcatcher models have high-pressure coefficient distributions, except at φ = 60°, compared to the basic model, as indicated in Figure 11a. For the central-up models, almost all of the new models have the highest distributions of Cp compared to the basic model, as depicted in Figure 11b. In Figure 11c, the new model at φ = 90° achieved the highest values of Cp compared with all the other windcatcher models.
The contours of the static pressure coefficient distributions for the symmetrical plane of the new windcatcher models at different opening angles and different feeding orientations are presented in Figure 12. As described in this figure, the contours of Cp reflect the same behavior of all windcatcher models that are presented in detail in Figure 11. It can be concluded that the new windcatcher model with a 90° opening angle has the highest Cp distributions, which can induce more airflow inside the ventilated room with a trailing-down feeding orientation as shown in Figure 12c.

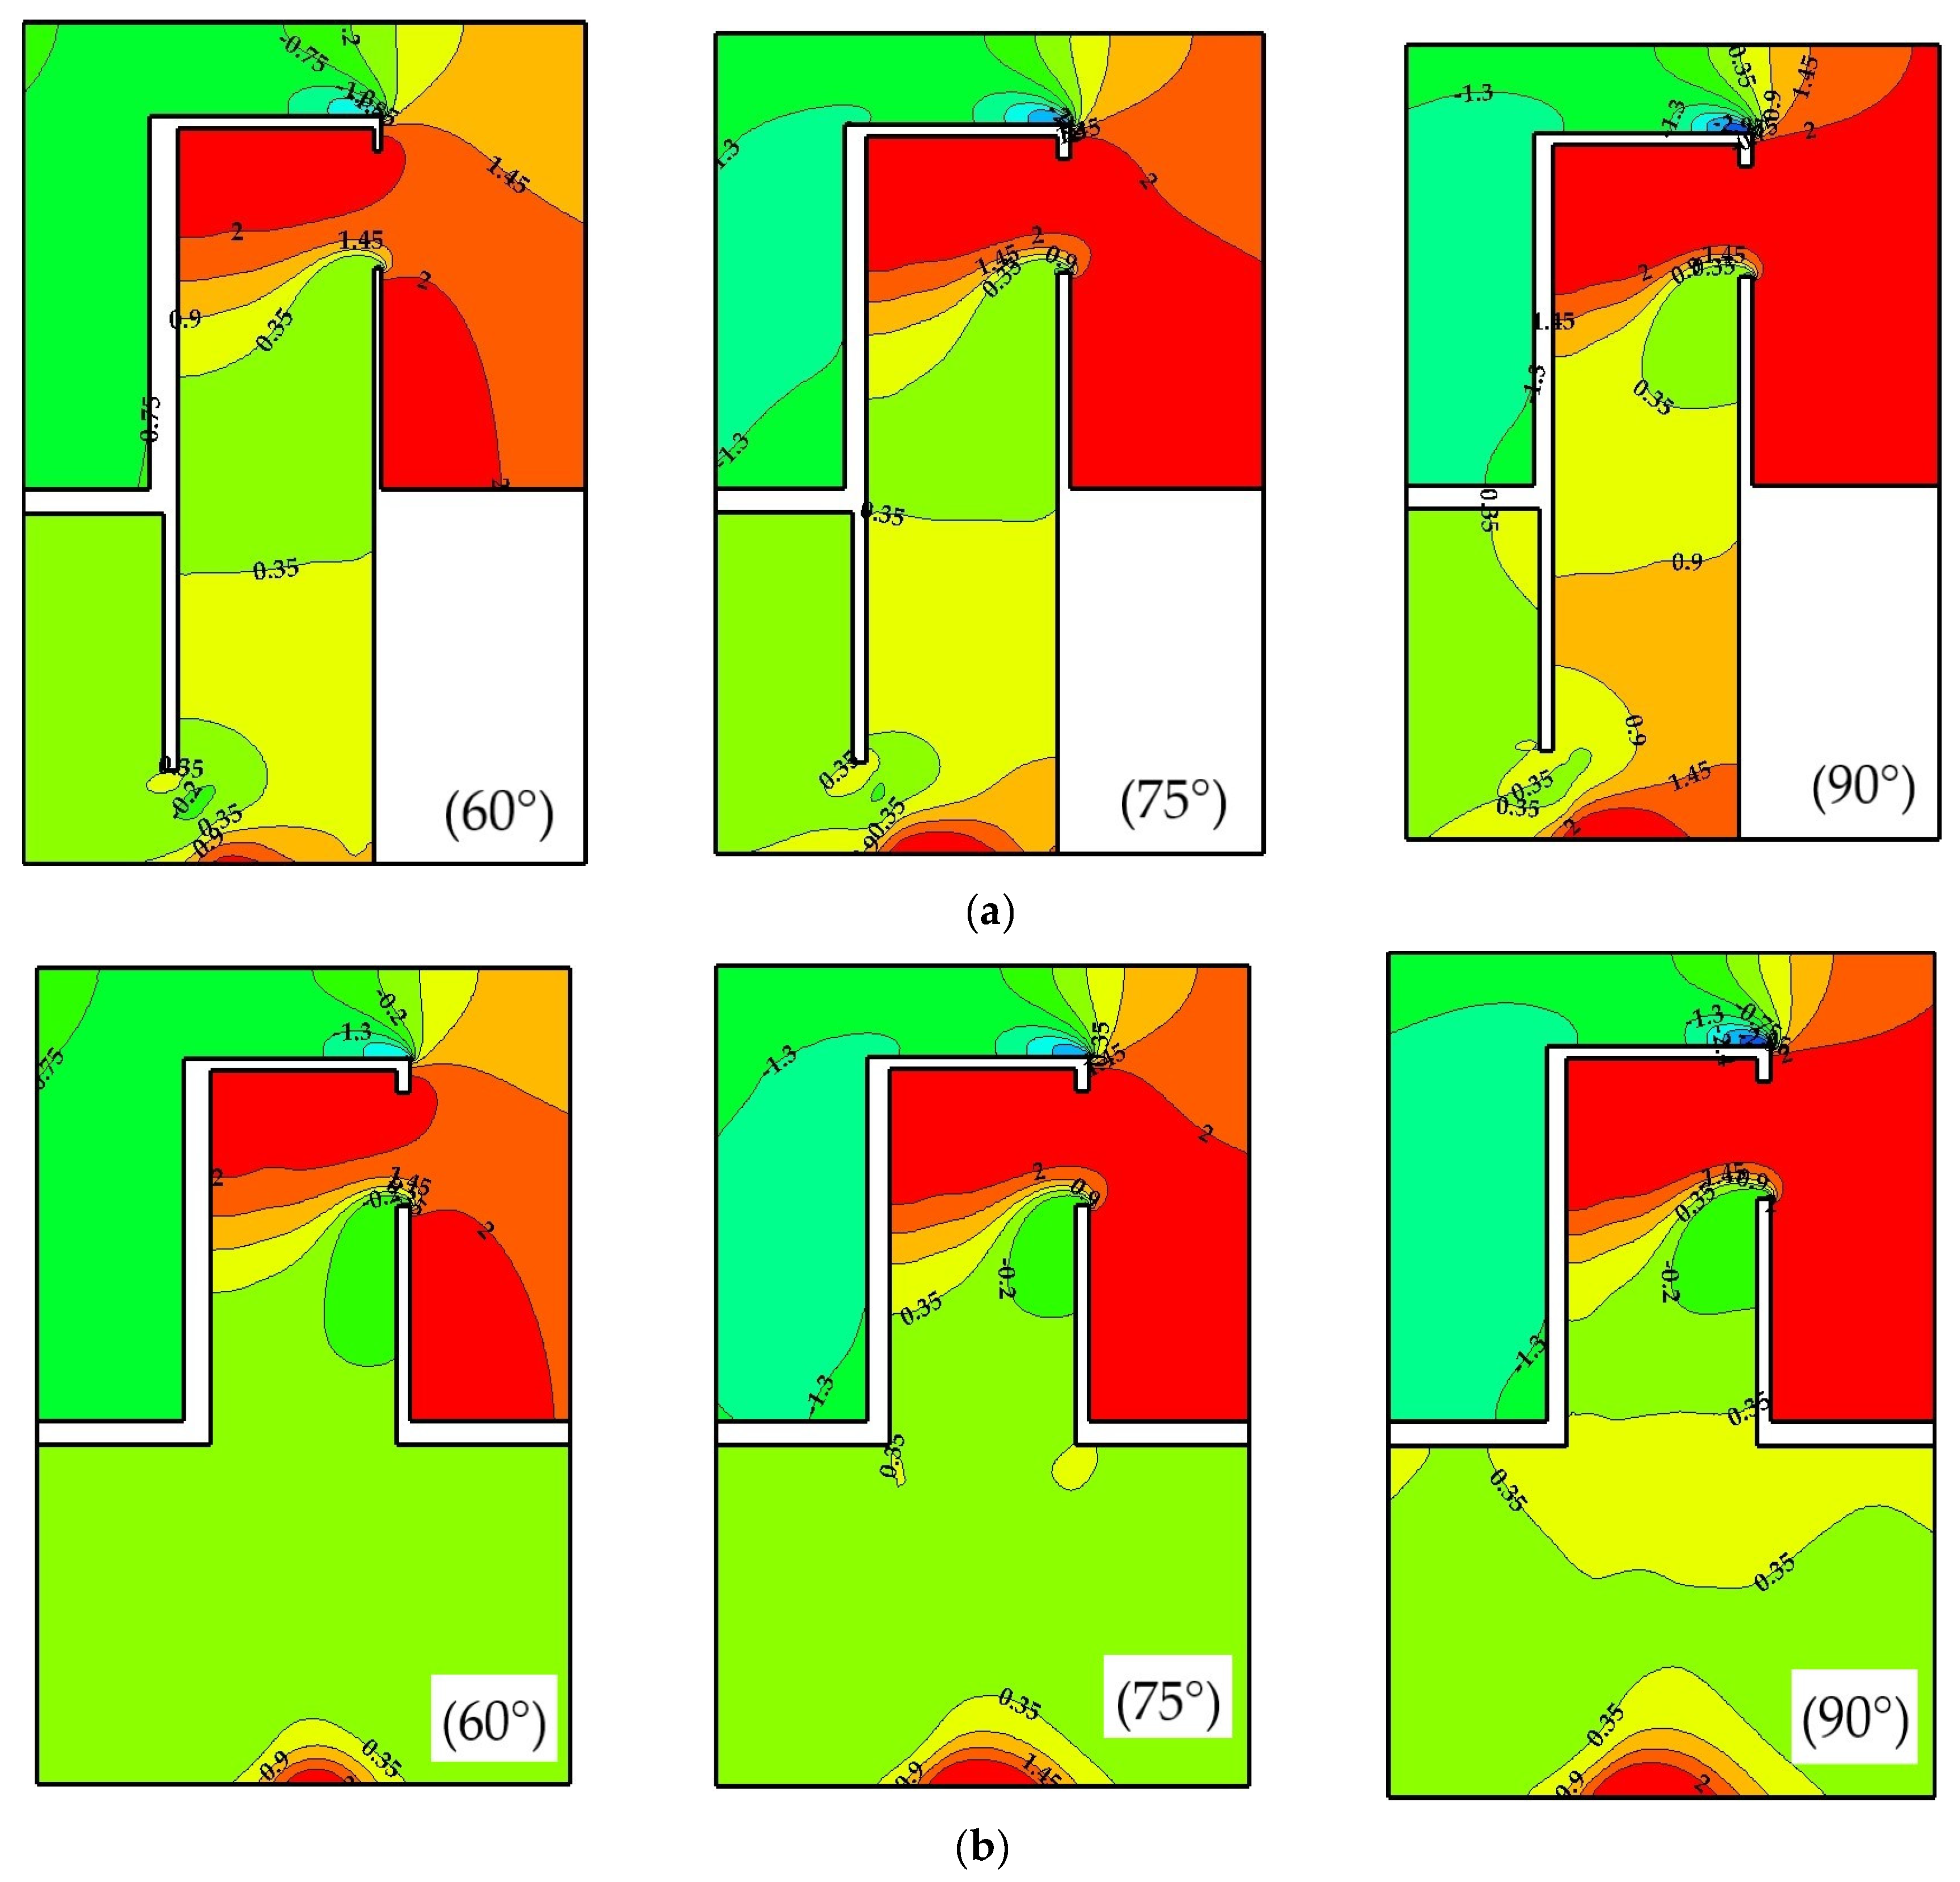
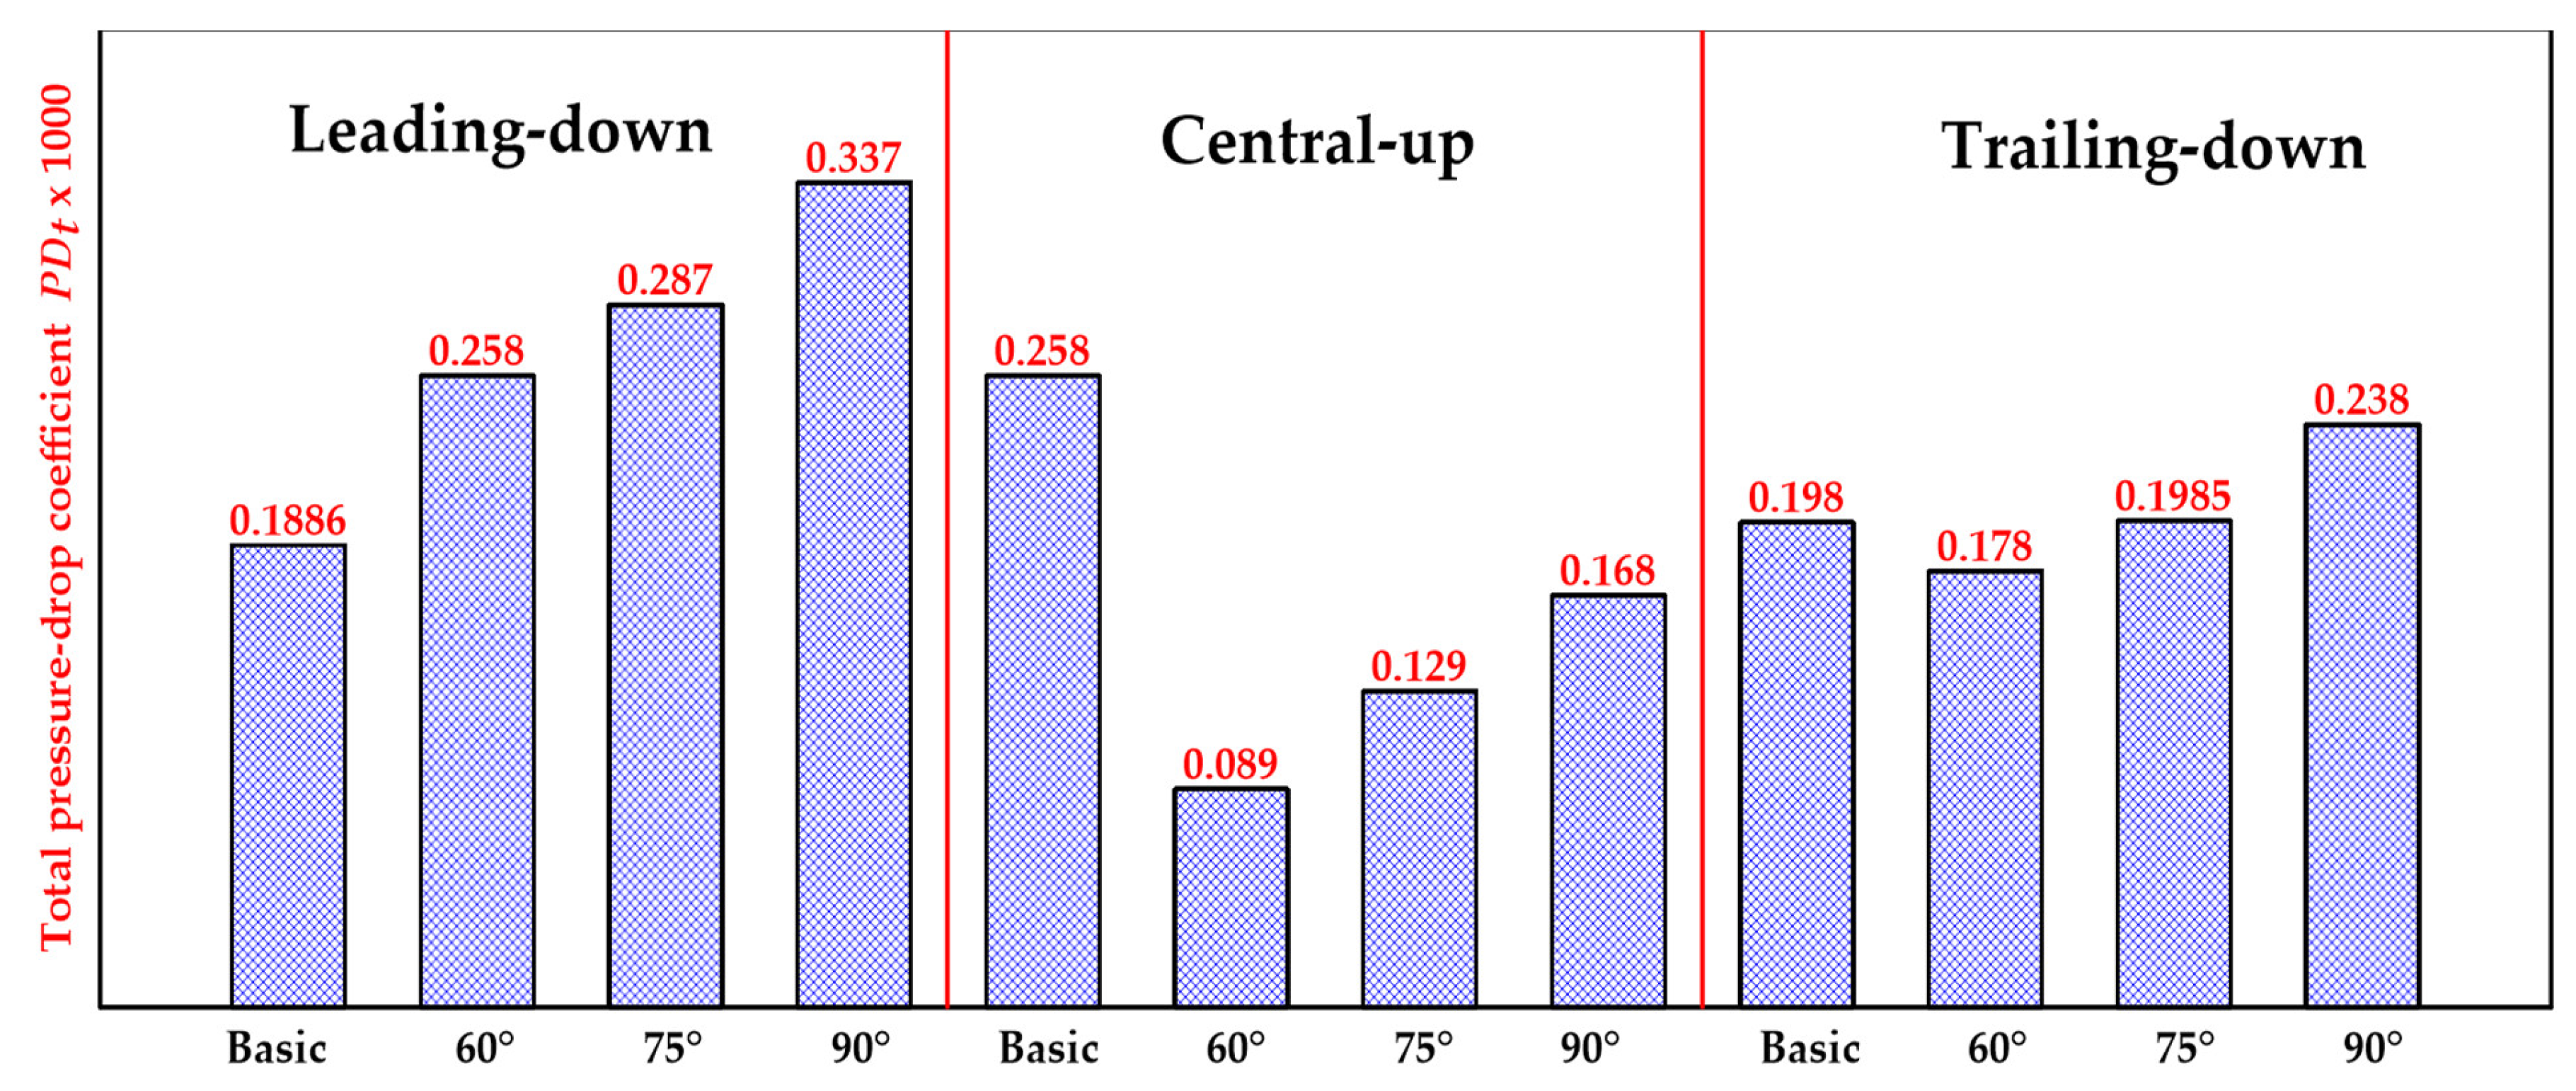
3.2.2. Total Pressure Loss Coefficient

Figure 13 introduces a bar chart of the total pressure drop coefficients at different opening angles and different feeding orientations. The total pressure-drop coefficients increased with the increase in opening angles for all new windcatcher models. Comparing the different feeding orientations, the leading-down orientation produces the highest pressure-drop values compared with the other models. Furthermore, the minimum and maximum values of the total pressure drop are found in the central-up-60° model and leading-down-90° model, respectively.

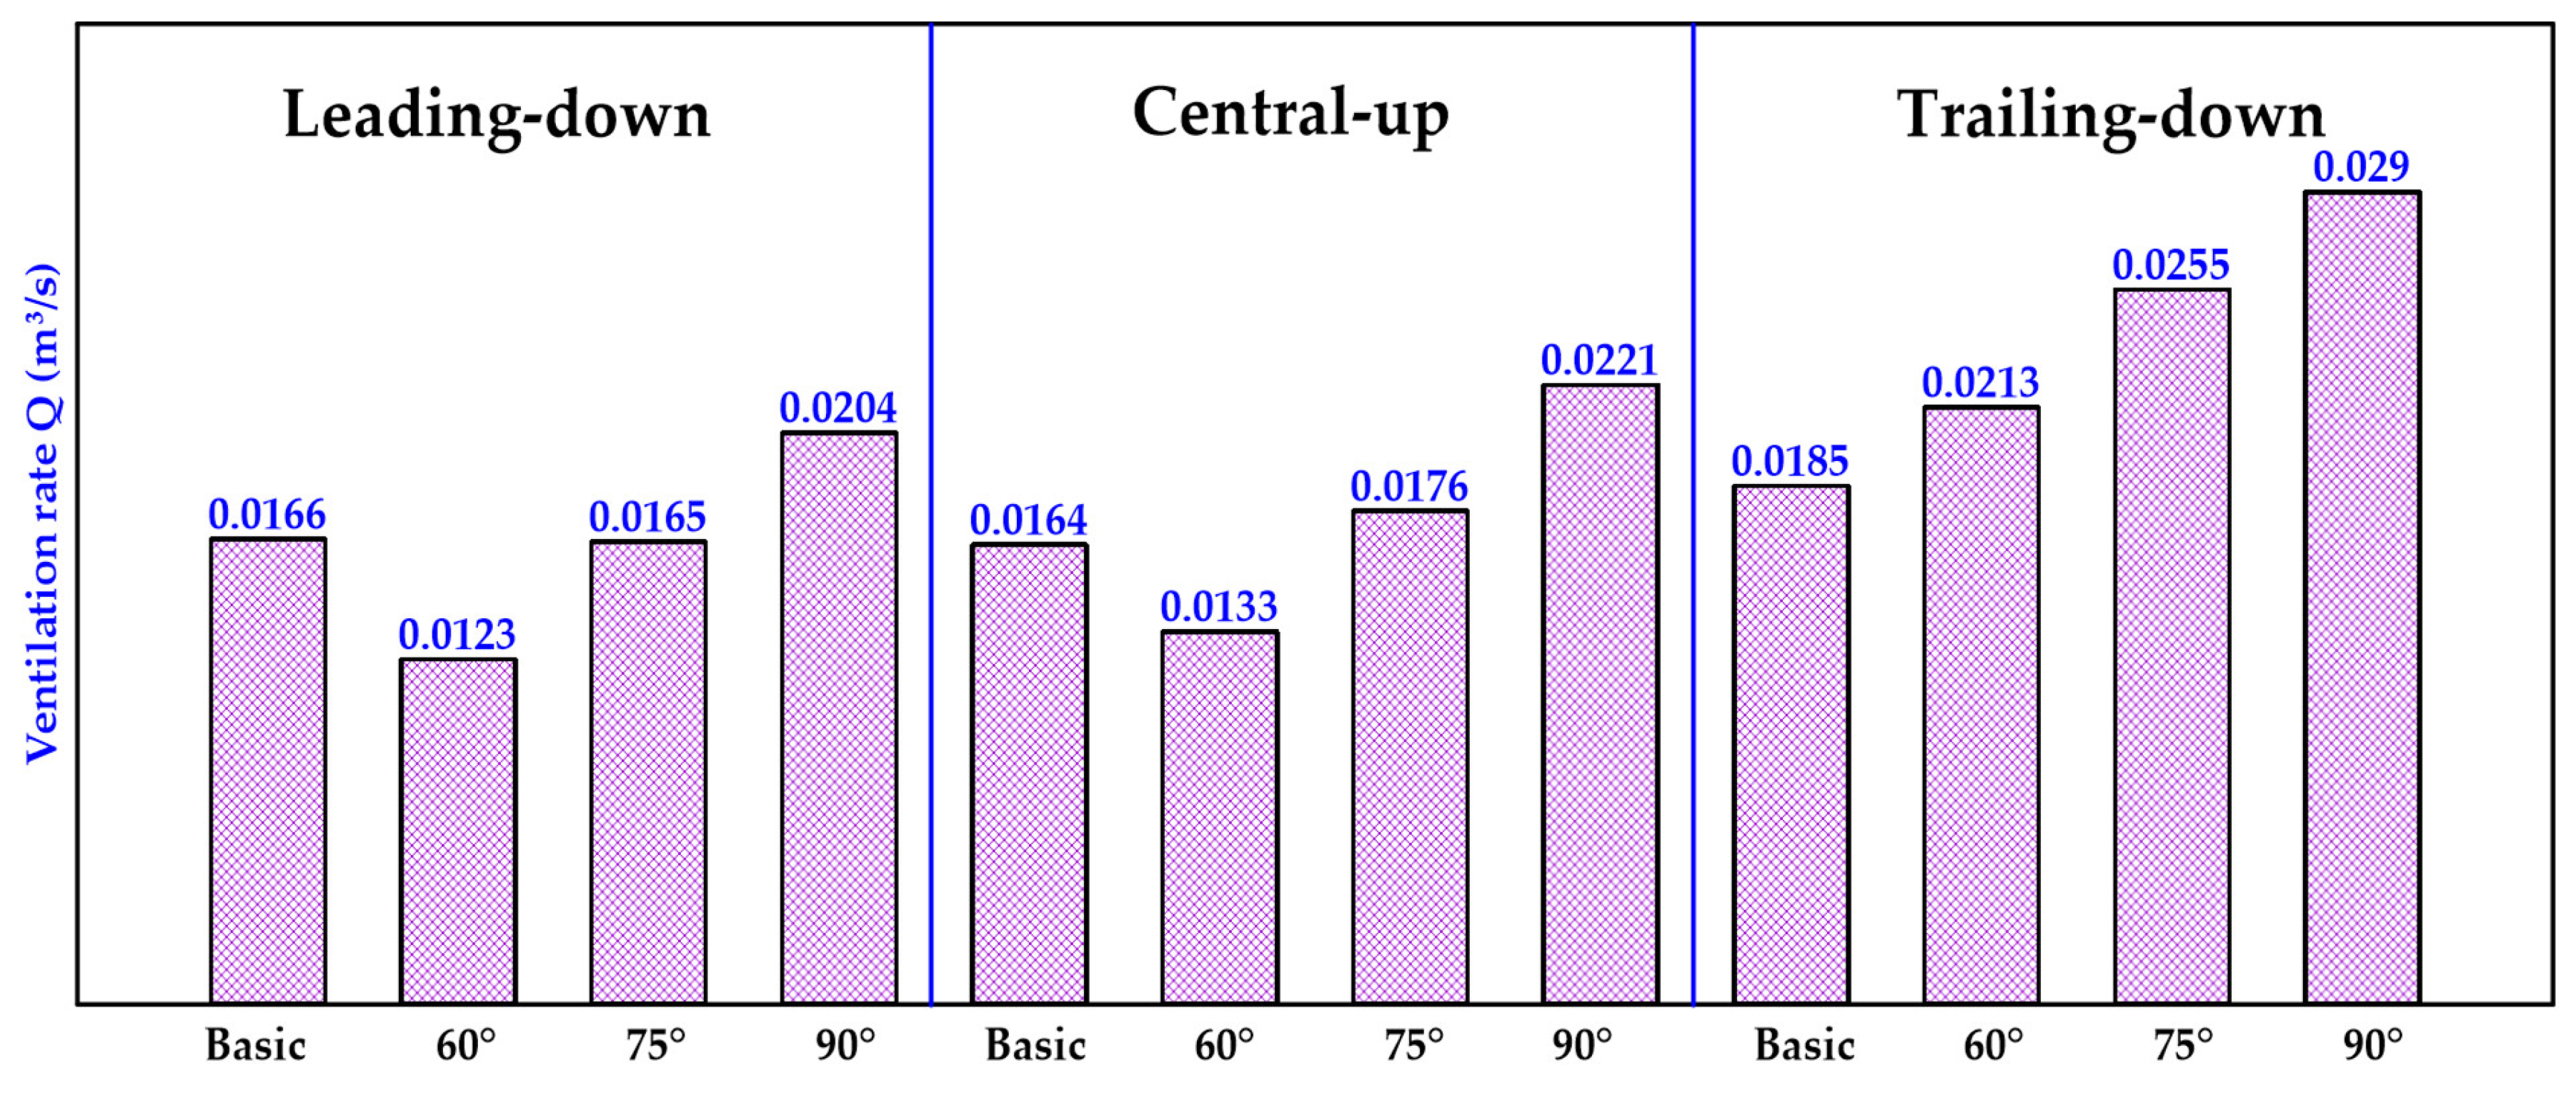
3.3. Natural Ventilation Rate

Figure 14 presents the ventilation rates for all windcatcher models under a constant wind speed of 5 m/s. For all new windcatcher models, increasing the opening angle from 60° to 90° leads to an increase in the ventilation rates. In addition, the trailing-down windcatcher models generate the highest rates compared with the other models. Further, the leading-down-60° model produces the minimum ventilation rate, while the trailing-down-90° model yields the maximum rate of ventilation as shown in Figure 14.

3.4. Overall Performance Evaluation

To summarize the results, Figure 15 and Figure 16 describe the effects of the main factors affecting the ventilation performance of the new windcatcher models. As depicted in Figure 15, the length-weighted average static pressure coefficient clearly increases with the increase in opening angle for all different feeding orientations at the same wind speed. In addition, when the wind speed increases, it leads to an increase in the pressure coefficient for all models except for the central-up windcatcher model at identical opening angles. Moreover, at the fixed conditions of φ = 90° and U0 = 5, the trailing-down model has a higher pressure coefficient than the leading-down and central-up models by 20.55% and 37.37%, respectively. Furthermore, the trailing-down windcatcher model could achieve a superior ventilation rate compared to the central-up model and leading-down model by 31% and 42%, respectively. This may be attributed to the flow acceleration through the windcatcher tower in the same flow path toward the exit opening as shown in Figure 10c. Based on the above analyses, the trailing-down windcatcher model can be recommended as the best choice to provide natural ventilation in the selected target area.

4. Conclusions

The effect of the opening angle and the inner feeding orientations on the ventilation performance of an inventive one-sided windcatcher was numerically studied under different wind speeds. The outdoor mainstream flow was selected for the weather conditions of Taif city in Saudi Arabia. A detailed fluid flow analysis was carried out to investigate the induced air distribution, static pressure coefficient, total pressure-drop, and the ventilation rate using ANSYS CFX 17.0. The numerical model was validated using the k-epsilon turbulence model, which achieved good agreement with the experimental data. The CFD results were generated for various models of the new windcatcher and compared to a basic windcatcher model under the same conditions to explore the new flow feature of the new one. The ventilation performance of the new windcatcher was examined at different opening angles from 60° to 90° for three different feeding orientations, and the following conclusions can be extracted.
The flow velocity increased through the new windcatcher tower due to the increase in the inlet opening angle from 60° to 90°, which in turn led to an increase in the fluid momentum inside the ventilated room. However, the flow momentum decreased gradually through the windcatcher tower at the same opening angle of the new windcatcher. For the leading-down orientation model, the flow velocity deteriorated at the end of the windcatcher tower due to the existence of a corner vortex at the sharp edge of the exit opening. The indoor flow maintained its high fluid momentum due to the short tower of the central-up windcatcher model. Therefore, it led to an increase in the induced ventilation rate inside the ventilated room. In the case of the trailing-down orientation, the indoor flow had the same behavior as the leading-down model, except at the end of the windcatcher tower, where the flow had a higher flow momentum. The sharp edge at the inlet opening led to an increase in the flow separation and recirculation zone especially when the opening angle increased.
The static pressure coefficient increased with the increase in the opening angle from 60° to 90°. According to the feeding orientation parameter, all new windcatcher models produced high-pressure coefficients except at φ = 60° compared to the basic model. In the case of the trailing-down model, the highest pressure coefficient was achieved at φ = 90°compared with the other windcatcher models.
The increase in the opening angle from 60° to 90° led to an increase in the total pressure drop for all new windcatcher models. The leading-down model at φ = 90° had the maximum pressure-drop, while the central-up model at φ = 60° generated the minimum value. For all new windcatcher models, the ventilation flow rates increased when the opening angle increased from 60° to 90°. The leading-down model at φ = 60° provided the minimum ventilation rate, while the trailing-down model at φ = 90° gave the maximum ventilation rate.
At the fixed conditions of φ = 90° and U0 = 5 m/s, the trailing-down model had a higher pressure coefficient than the leading-down and central-up models, by 20.55% and 37.37%, respectively. Furthermore, in the same conditions, the trailing-down model achieved a superior ventilation rate compared with the central-up and leading-down models, by 31% and 42%, respectively. Finally, the trailing-down windcatcher model can be recommended as the best choice to provide natural ventilation in Taif City.

Author Contributions

All the authors have contributed their efforts to complete the paper. Conceptualization, A.B.; project administration, supervision, methodology, data curation, formal analysis, M.A.; methodology, investigation, formal analysis, W.A.E.-A.; investigation, resources, writing—original draft preparation, H.F.; software, validation, visualization, writing—review and editing, H.F. All authors have read and agreed to the published version of the manuscript.

Funding

This study was funded by Taif University, Researchers Support Project Number (TURSP-2020/196) Taif University, Taif, Saudi Arabia.

Institutional Review Board Statement

Not applicable.

Informed Consent Statement

Not applicable.

Data Availability Statement

All necessary data are provided in the manuscript.

Acknowledgments

Authors would like to thank Taif University, Researchers Support Project Number (TURSP-2020/196) Taif University, Taif, Saudi Arabia.

Conflicts of Interest

The authors declare no conflict of interest.

References

  1. Oropeza-Perez, I.; Østergaard, P.A. Active and passive cooling methods for dwellings: A review. Renew. Sustain. Energy Rev. 2018, 82, 531–544. [Google Scholar] [CrossRef]
  2. Badla, O.; Bouzid, T.; Vazquez, P.M. Inelastic Analysis of Mdof Systems Damaged by Earthquakes, Posteriorly Subjected to Wind Load. Civil Eng. J. 2021, 7, 575–593. [Google Scholar] [CrossRef]
  3. Zafra, R.G.; Mayo, J.; Villareal, P.J.M.; De Padua, V.M.N.; Castillo, M.H.T.; Sundo, M.B.; Madlangbayan, M.S. In Structural and Thermal Performance Assessment of Shipping Container as Post-Disaster Housing in Tropical Climates. Civil Eng. J. 2021, 7. [Google Scholar] [CrossRef]
  4. Montazeri, H.; Montazeri, F. CFD simulation of cross-ventilation in buildings using rooftop wind-catchers: Impact of outlet openings. Renew. Energy 2018, 118, 502–520. [Google Scholar] [CrossRef]
  5. Dehghani-sanij, A.R.; Soltani, M.; Raahemifar, K. A new design of wind tower for passive ventilation in buildings to reduce energy consumption in windy regions. Renew. Sustain. Energy Rev. 2015, 42, 182–195. [Google Scholar] [CrossRef] [Green Version]
  6. Sadeghi, M.; Samali, B.; Wood, G.; de Dear, R. Comfort cooling by wind towers in the Australian residential context e experimental wind tunnel study of comfort. J. Wind Eng. Ind. Aerod. 2020, 196, 104014. [Google Scholar] [CrossRef]
  7. Pakari, A.; Ghani, S. Airflow assessment in a naturally ventilated greenhouse equipped with wind towers: Numerical simulation and wind tunnel experiments. Energy Build. 2019, 199, 1–11. [Google Scholar] [CrossRef]
  8. Heidari, A.; Sahebzadeh, S.; Dalvand, Z. Natural ventilation in vernacular architecture of Sistan, Iran; Classification and CFD study of compound rooms. Sustainability 2017, 9, 1048. [Google Scholar] [CrossRef] [Green Version]
  9. Alzaed, A.; Balabel, A. A new modern Design of four-sided Windcatcher for Natural Ventilation in Residential Building in Saudi Arabia. Int. J. Appl. Environ. Sci. 2017, 12, 27–36. [Google Scholar]
  10. Ashraf, B.; Mohammad, F.; Ali, A. Towards a Computational Fluid Dynamics-Based Fuzzy Logic Controller of the Optimum Windcatcher Internal Design for Efficient Natural Ventilation in Buildings. Math. Prob. Eng. 2021, 2021, 10. [Google Scholar] [CrossRef]
  11. Zaki, A.; Richards, P.; Sharma, R. Analysis of airflow inside a two-sided wind catcher building. J. Wind Eng. Ind. Aerod. 2019, 190, 71–82. [Google Scholar] [CrossRef]
  12. Montazeri, H.; Azizian, R. Experimental study on natural ventilation performance of one-sided wind catcher. Build. Environ. 2008, 43, 2193–2202. [Google Scholar] [CrossRef]
  13. Montazeri, H.; Montazeri, F.; Azizian, R.; Mostafavi, S. Two-sided wind catcher performance evaluation using experimental, numerical and analytical modeling. J. Renew. Energy 2010, 35, 1424–1435. [Google Scholar] [CrossRef]
  14. Montazeri, H. Experimental and numerical study on natural ventilation performance of various multi-opening wind catchers. Build. Environ. 2011, 46, 370–378. [Google Scholar] [CrossRef]
  15. Kazemi Esfeh, M.; Dehghan, A.A.; Dehghan Manshadi, M.; Mohagheghian, S. Visualized flow structure around and inside of one-sided wind-catchers. Energy Build. 2012, 55, 545–552. [Google Scholar] [CrossRef]
  16. American Society of Heating, Refrigerating and Air-Conditioning Engineers. ASHRAE Hand Book Fundamentals; American Society of Heating, Refrigerating and Air-Conditioning Engineers: Atlanta, GA, USA, 1993. [Google Scholar]
  17. Elmualim, A.A.; Awbi, H.B. Wind tunnel and CFD investigation of the performance of wind catcher ventilation systems. J. Vent. 2002, 1, 53–64. [Google Scholar]
  18. Dehghan, A.A.; Esfeh, M.K.; Manshadi, M.D. Natural ventilation characteristics of one-sided wind catchers: Experimental and analytical evaluation. Energy Build. 2013, 61, 366–377. [Google Scholar] [CrossRef]
  19. Nejat, P.; Calautit, J.K.; Majid, M.Z.A.; Hughes, B.R.; Zeynali, I.; Jomehzadeh, F. Evaluation of a two-sided windcatcher integrated with wing wall (as a new design) and comparison with a conventional windcatcher. Energy Build. 2016, 126, 287–300. [Google Scholar] [CrossRef] [Green Version]
  20. Nejat, P.; Jomehzadeh, F.; Hussen, H.; Calautit, J.; Abd Majid, M. Application of wind as a renewable energy source for passive cooling through windcatchers integrated with wing walls. Energies 2018, 11, 2536. [Google Scholar] [CrossRef] [Green Version]
  21. Cruz-Salas, M.V.; Castillo, J.A.; Huelsz, G. Effect of wind exchanger duct cross-section area and geometry on the room airflow distribution. J. Wind Eng. Ind. Aerod. 2018, 179, 514–523. [Google Scholar] [CrossRef]
  22. Hosseini, S.H.; Shokry, E.; Ahmadian Hosseini, A.J.; Ahmadi, G.; Calautit, J.K. Evaluation of airflow and thermal comfort in buildings ventilated with wind catchers: Simulation of conditions in Yazd City, Iran. Energy Sustain Dev. 2016, 35, 7–24. [Google Scholar] [CrossRef]
  23. Ghadiri, M.H.; Ibrahim, N.L.N.; Mohamed, M.F. Applying computational fluid dynamic to evaluate the performance of four-sided rectangular wind catcher with different height. Res. J. Appl. Sci. Eng. Technol. 2014, 7, 502–509. [Google Scholar] [CrossRef]
  24. Sheikhshahrokhdehkordi, M.; Khalesi, J.; Goudarzi, N. High-performance building: Sensitivity analysis for simulating different combinations of components of a two-sided windcatcher. J. Build Eng. 2020, 28, 101079. [Google Scholar] [CrossRef]
  25. Hughes, B.R.; Ghani, S.A.A.A. Investigation of a windvent passive ventilation device against current fresh air supply recommendations. Energy Build. 2008, 40, 1651–1659. [Google Scholar] [CrossRef]
  26. Su, Y.; Riffat, S.B.; Lin, Y.; Khan, N. Experimental and CFD study of ventilation flow rate of a MonodraughtTM wind catcher. Energy Build. 2008, 40, 1110–1116. [Google Scholar] [CrossRef]
  27. Hughes, B.R.; Abdul Ghani, S.A.A. A numerical investigation into the effect of Windvent louvre external angle on passive stack ventilation performance. Build. Environ. 2010, 45, 1025–1036. [Google Scholar] [CrossRef]
  28. Jones, B.M.; Kirby, R. The performance of natural ventilation windcatchers in schools e a comparison between prediction and measurement. Int. J. Vent. 2010, 9, 273–286. [Google Scholar] [CrossRef] [Green Version]
  29. Jordaan, H.; Stephan Heyns, P.; Hoseinzadeh, S. Numerical Development of a Coupled One-Dimensional/Three-Dimensional Computational Fluid Dynamics Method for Thermal Analysis with Flow Maldistribution. J. Therm. Sci. Eng. Appl. 2021, 13. [Google Scholar] [CrossRef]
  30. Hoseinzadeh, S.; Heyns, P.S. Thermo-structural fatigue and lifetime analysis of a heat exchanger as a feedwater heater in power plant. Eng. Fail. Anal. 2020, 113, 104548. [Google Scholar] [CrossRef]
  31. Hoseinzadeh, S.; Sohani, A.; Samiezadeh, S.; Kariman, H.; Ghasemi, M.H. Using computational fluid dynamics for different alternatives water flow path in a thermal photovoltaic (PVT) system. Int. Numer. Methods Heat Fluid Flow 2021, 31, 1618–1637. [Google Scholar] [CrossRef]
  32. Elmualim, A.A. Effect of damper and heat source on wind catcher natural ventilation performance. Energy Build. 2006, 38, 939–948. [Google Scholar] [CrossRef]
  33. Ghadiri, M.H.; Lukman, N.; Ibrahim, N.; Mohamed, M.F. Analysis of wind-driven natural ventilation in a two-sided rectangular wind catcher. Int. J. Vent. 2013, 12, 51–62. [Google Scholar] [CrossRef]
  34. Calautit, J.K.; Tien, P.W.; Wei, S.; Calautit, K.; Hughes, B. Numerical and experimental investigation of the indoor air quality and thermal comfort performance of a low energy cooling windcatcher with heat pipes and extended surfaces. Renew. Energy 2020, 145, 744–756. [Google Scholar] [CrossRef]
  35. Alsailani, M.; Montazeri, H.; Rezaeiha, A. Towards optimal aerodynamic design of wind catchers: Impact of geometrical characteristics. Renew. Energy 2021, 168, 1344–1363. [Google Scholar] [CrossRef]
  36. Climate at Taif (Saudi Arabia). Available online: https://en.climate-data.org/asia/saudi-arabia/makkah-region/at-taif-5872/8 (accessed on 7 August 2021).
  37. Calautit, J.K.; O’Connor, D.; Hughes, B.R. A natural ventilation wind tower with heat pipe heat recovery for cold climates. Renew. Energy 2016, 87, 1088–1104. [Google Scholar] [CrossRef]
  38. Aminoroayaie Yamini, O.; Mousavi, S.H.; Kavianpour, M.R.; Movahedi, A. Numerical modeling of sediment scouring phenomenon around the offshore wind turbine pile in marine environment. Environ. Earth Sci. 2018, 77, 776. [Google Scholar] [CrossRef]
  39. Calautit, J.K.; O’Connor, D.; Tien, P.W.; Wei, S.; Pantua, C.A.J.; Hughes, B. Development of a natural ventilation windcatcher with passive heat recovery wheel for mild-cold climates: CFD and experimental analysis. Renew. Energy 2020, 160, 465–482. [Google Scholar] [CrossRef]
  40. ANSYS Solver Theory Guide, Release CFX-17.0. ANSYS Inc. 2016. Available online: https://pdfcoffee.com/ansys-cfx-solver-theory-guide-pdf-free.html (accessed on 12 October 2021).
Figure 1. Schematic diagrams of: (a) Basic windcatcher model [15]; (b) new partial-cylinder windcatcher model. Dimensions are in millimeters.
Sustainability 13 11310 g001
Figure 2. Isometric drawing of the new windcatcher model mounted on a ventilated room with two typical side exit-openings at different feeding orientations: (a) Leading-down; (b) central-up; (c) trailing-down. Dimensions are in millimeters.
Sustainability 13 11310 g002aSustainability 13 11310 g002b
Figure 3. Schematic view of the computational domain with full dimension details.
Sustainability 13 11310 g003
Figure 4. Schematic diagram of main boundary conditions of the computational domain (central-up model).
Sustainability 13 11310 g004
Figure 5. Perspective view of details of unstructured fine mesh for the new windcatcher (central-up model).
Sustainability 13 11310 g005aSustainability 13 11310 g005b
Figure 6. Contours of dimensionless velocity magnitude distributions on the symmetrical plane of the central-up windcatcher model for different mesh node numbers.
Sustainability 13 11310 g006
Figure 7. Schematic diagram of dimensionless velocity magnitude distributions along the centerline (X = 0, Z = 0) of the central-up windcatcher model for different mesh node numbers.
Sustainability 13 11310 g007
Figure 8. Pressure coefficient distributions on the internal walls of the basic windcatcher model at a zero-incidence angle [15]: (a) Right surface; (b) leeward surface.
Sustainability 13 11310 g008
Figure 9. Contours of dimensionless velocity magnitude (V/U0) on the symmetrical plane of the new windcatcher model at U0 = 5 m/s at different inlet-opening angles for (a) leading-down, (b) central-up, and (c) trailing-down.
Sustainability 13 11310 g009aSustainability 13 11310 g009b
Figure 10. CFD streamlines of the airflow on the symmetrical plane of the new windcatcher model at U0 = 5 m/s at different inlet-opening angles for (a) leading-down, (b) central-up, and (c) trailing-down.
Sustainability 13 11310 g010
Figure 11. Pressure coefficient distributions on the intersection line of the leeward surfaces for all windcatcher models at U0 = 5 m/s at different feeding orientations: (a) Leading-down, (b) central-up, and (c) trailing-down.
Sustainability 13 11310 g011aSustainability 13 11310 g011b
Figure 12. Contours of static pressure coefficient on the symmetrical plane of the new windcatcher model at different inlet-opening angles at U0 = 5 m/s for (a) leading-down, (b) central-up, and (c) trailing-down.
Sustainability 13 11310 g012aSustainability 13 11310 g012b
Figure 13. Total pressure-drop coefficient for different windcatcher models at U0 = 5 m/s.
Sustainability 13 11310 g013
Figure 14. Ventilation rates for different windcatcher models at U0 = 5 m/s.
Sustainability 13 11310 g014
Figure 15. Length-weighted average static pressure coefficient on the centerline of the leeward surfaces for all new windcatcher models.
Sustainability 13 11310 g015
Figure 16. Area-weighted average ventilation rate at the exit openings for all new windcatcher models.
Sustainability 13 11310 g016
Table 1. CFD model boundary conditions for all cases.
Steady State, Stationary Domain
Velocity inlet (m/s) 1, 3, 5
Turbulence intensity (%) 1
Pressure outlet (Pa) 100,700 [36]
Openings 100,700 [36]
Walls no-slip [34,37]
Temperature (°C) 25
Table 2. Average dimensionless velocity magnitude for different meshes.
Mesh Node (Million) ( V / U ¯ 0 ) %Error
0.5231.37-
0.8941.3491.48
1.491.3953.3
2.151.411.07
Publisher’s Note: MDPI stays neutral with regard to jurisdictional claims in published maps and institutional affiliations.

