Perspective

Effects of COVID-19 on the Australian Economy: Insights into the Mobility and Unemployment Rates in Education and Tourism Sectors

1
School of Built Environment, University of New South Wales, Kensington, Sydney, NSW 2052, Australia
2
Faculty of Chemical Energy, University of New South Wales, Kensington, Sydney, NSW 2052, Australia
3
School of Civil Engineering and Surveying, University of Southern Queensland, Springfield Central, Toowoomba, QLD 4300, Australia
4
School of Engineering, Deakin University, Geelong, VIC 3216, Australia
*
Author to whom correspondence should be addressed.
Sustainability 2021, 13(20), 11300; https://doi.org/10.3390/su132011300
Submission received: 19 September 2021 / Revised: 9 October 2021 / Accepted: 12 October 2021 / Published: 13 October 2021
(This article belongs to the Section Tourism, Culture, and Heritage)

Abstract

:
Coronavirus Disease 2019 (COVID-19) has affected global economies due to lockdowns, business closures, and travel and other restrictions. To control the spread of the virus, several countries, including Australia, imposed strict border restrictions and lockdown measures. Accordingly, international borders have been closed, and all incoming international passengers are mandated to a 14-day hotel quarantine. Residents’ movements and businesses have been limited to essential services only. Employees have been directed to work from home while businesses moved to a remote working model. Due to such stringent measures, small and medium businesses such as cafes, restaurants, hotels, childcare centers, and tourism-based institutions incurred heavy losses, pushing a considerable portion of such small businesses to close. The airlines, education, tourism, and hospitality sector were the worst impacted among all. Due to such closures and associated effects of COVID-19, the unemployment rates are assumed to be significantly increased in countries like Australia. However, a study investigating this unemployment and reporting its status does not exist for Australia. Therefore, in this study, we investigated the effects of COVID-19 control measures such as travel restriction and lockdown on Australia’s employment status and labor markets. The data for the local transport network, unemployment rates and impacts on the tourism industry in Australia were extracted from the public data sources to assess the unemployment rates at both national and state-wide levels. Further, we also looked into the rehabilitation measures by the Australian government, such as the Job Keeper and Job Seeker programs in March 2020, that aim to provide support to people who are unable to run their businesses or have lost their jobs due to the pandemic. Overall, we observed that despite the global crisis, the Australian unemployment rate has reduced in the last year.

1. Introduction

Coronavirus Disease 2019 (COVID-19) has caused serious damage worldwide, including deaths and health issues and severely denting global economies [1,2]. Australia is no exception to such effects and has seen its share of economic impacts. The first COVID-19 case was confirmed in Australia in January 2020, when a positive patient traveled from Wuhan to Melbourne [3]. Victoria has seen nearly four times the number of COVID-19 cases as New South Wales despite being the smaller state of the two and spending more time in lockdown. The Australian government took drastic measures to prevent the virus from spreading across the states and imposed strict border and travel restrictions. These measures adversely impacted several small businesses such as local cafes, restaurants, childcare, rental houses, and hotels [4]. In addition, the airline and tourism industry suffered heavy losses due to both local and international travel restrictions.
Around 97% of visitors arrived in Australia before border restrictions were implemented in March 2020 [5,6,7]. In 2020, 1.8 million visitors arrived, which was around 80% lower than the last year and the lowest since 1987 [8]. The largest number of visitors were from New Zealand (242,500), followed by China (207,700). Most of the visitors traveled for holidays and spent around a fortnight in Australia. Due to travel restrictions, the visitors from source countries changed with a decline in the number of visitors from the top five countries due to COVID-19 [9,10,11]. Before the pandemic, China was the largest source country with the highest visitors to Australia. These restrictions also impacted the arrivals of international students, who are pivotal to the Australian education sector. Due to travel restrictions, many international students were stuck overseas and unable to arrive in Australia. As a result, the arrival of international students declined by 99.4%, with only 260 students arriving in Australia in 2021 [12]. This left a mark on the education sector of Australia, resulting in thousands of job losses and associated unemployment.
Overall, around 800,000 Australians have lost their jobs since 2020 due to the pandemic. The government has responded to the economic fallout by introducing a wage subsidy scheme, i.e., Job Keeper [13,14,15]. Under this scheme, permanent full-time, part-time, and casual employees who held their jobs for over 12 months were paid $1500 per fortnight to meet their essential expenditures during lockdowns and joblessness [16]. Additionally, Job Seeker payment was initiated for short-term casual workers paid at $550 per fortnight. An estimated 1 million casual employees in Australia have worked for less than a year with their employers. Over 26% of these were young people aged between 15 and 24 years, which is four times the proportion of casual employees over 25 [17,18]. This is not surprising as most industries employ casual workers in construction, manufacturing, retail, health care, accommodation, and food service industries [19]. These industries have been hit hard during the current pandemic. Accordingly, employed young people have not only lost their jobs but were also ineligible for a higher-paying wage subsidy. A significant portion of these young people comprises women who are impacted by the COVID-19 lockdowns [20,21,22]. Most projects initiated during COVID-19 are mainly focused on infrastructure development, particularly favoring men, depending on the nature of the work. This is increasing the gender gap in the Australian labor market, which is highly gender-segregated, and the employment gap between men and women remains high [23].
During the pandemic, the demand-side factors of the goods, low substitutability in consumption and irregular labor supply shocks can lead to reductions in the demand. A larger drop in the demand than in supply is possible due to labor supply restrictions, leading to the downfall in investments [24]. However, the COVID-19 pandemic has also caused sudden changes in the buying pattern and consumer demand, in view of the government guidelines and restrictions. As the earning of people drop, there is an expected negative impact on the demand and a downward trend in output, employment, revenue, and supply. With the reduction in supply, shortages will be experienced through supply chains, resulting in downsizing and more job losses [25,26].
The economic response policy to COVID-19 has overwhelmingly affected the younger workforce. Hence, it is important to understand the social and economic impacts of the coronavirus on Australian society due to travel restrictions and lockdown, where the younger people are at higher risk of unemployment [27]. Therefore, the government needs to rethink its current strategies and take mitigation measures to curb the rising unemployment. For this to materialize, the current unemployment status of various sectors in Australia must be investigated and reported [28,29]. However, this has not been done so far by a scientific study, presenting a research gap. This paper targets this gap and investigates the effect of COVID-19-related restrictions and policies on the unemployment rate in Australia [30]. Specifically, the key sectors of tourism and education, as the most impacted sectors of Australia due to COVID-19 lockdowns are investigated, and the unemployment rates are discussed. It is expected that this investigation and reporting will necessitate the much-needed debate around the policy level changes to curb the growing unemployment in various sectors of Australia. Such measures can help Australia move towards more inclusive, immersive, sustainable, and smart societies in line with industry 5.0 goals [30,31].
To achieve the goals of this paper, the data on the international travelers and tourists to Australia, labor market trends, and the effects of the restriction on the major industry sectors were extracted from the public data sources. In addition, the associated effects have been assessed at national and state-wide levels to compare the impacts of the pandemic.
The rest of the paper is organized as follows. Section 2 presents the methods and materials used in the study. Section 3 presents the study results related to effects of COVID-19 and associated unemployment in the four key target areas: international travel patterns and movement of passengers, tertiary education, tourism, and the Australian labor market at both national and state-wide levels. Section 4 presents the key discussions based on the results. Finally, Section 5 concludes the study and presents the key takeaways and future directions for expanding upon the current study.

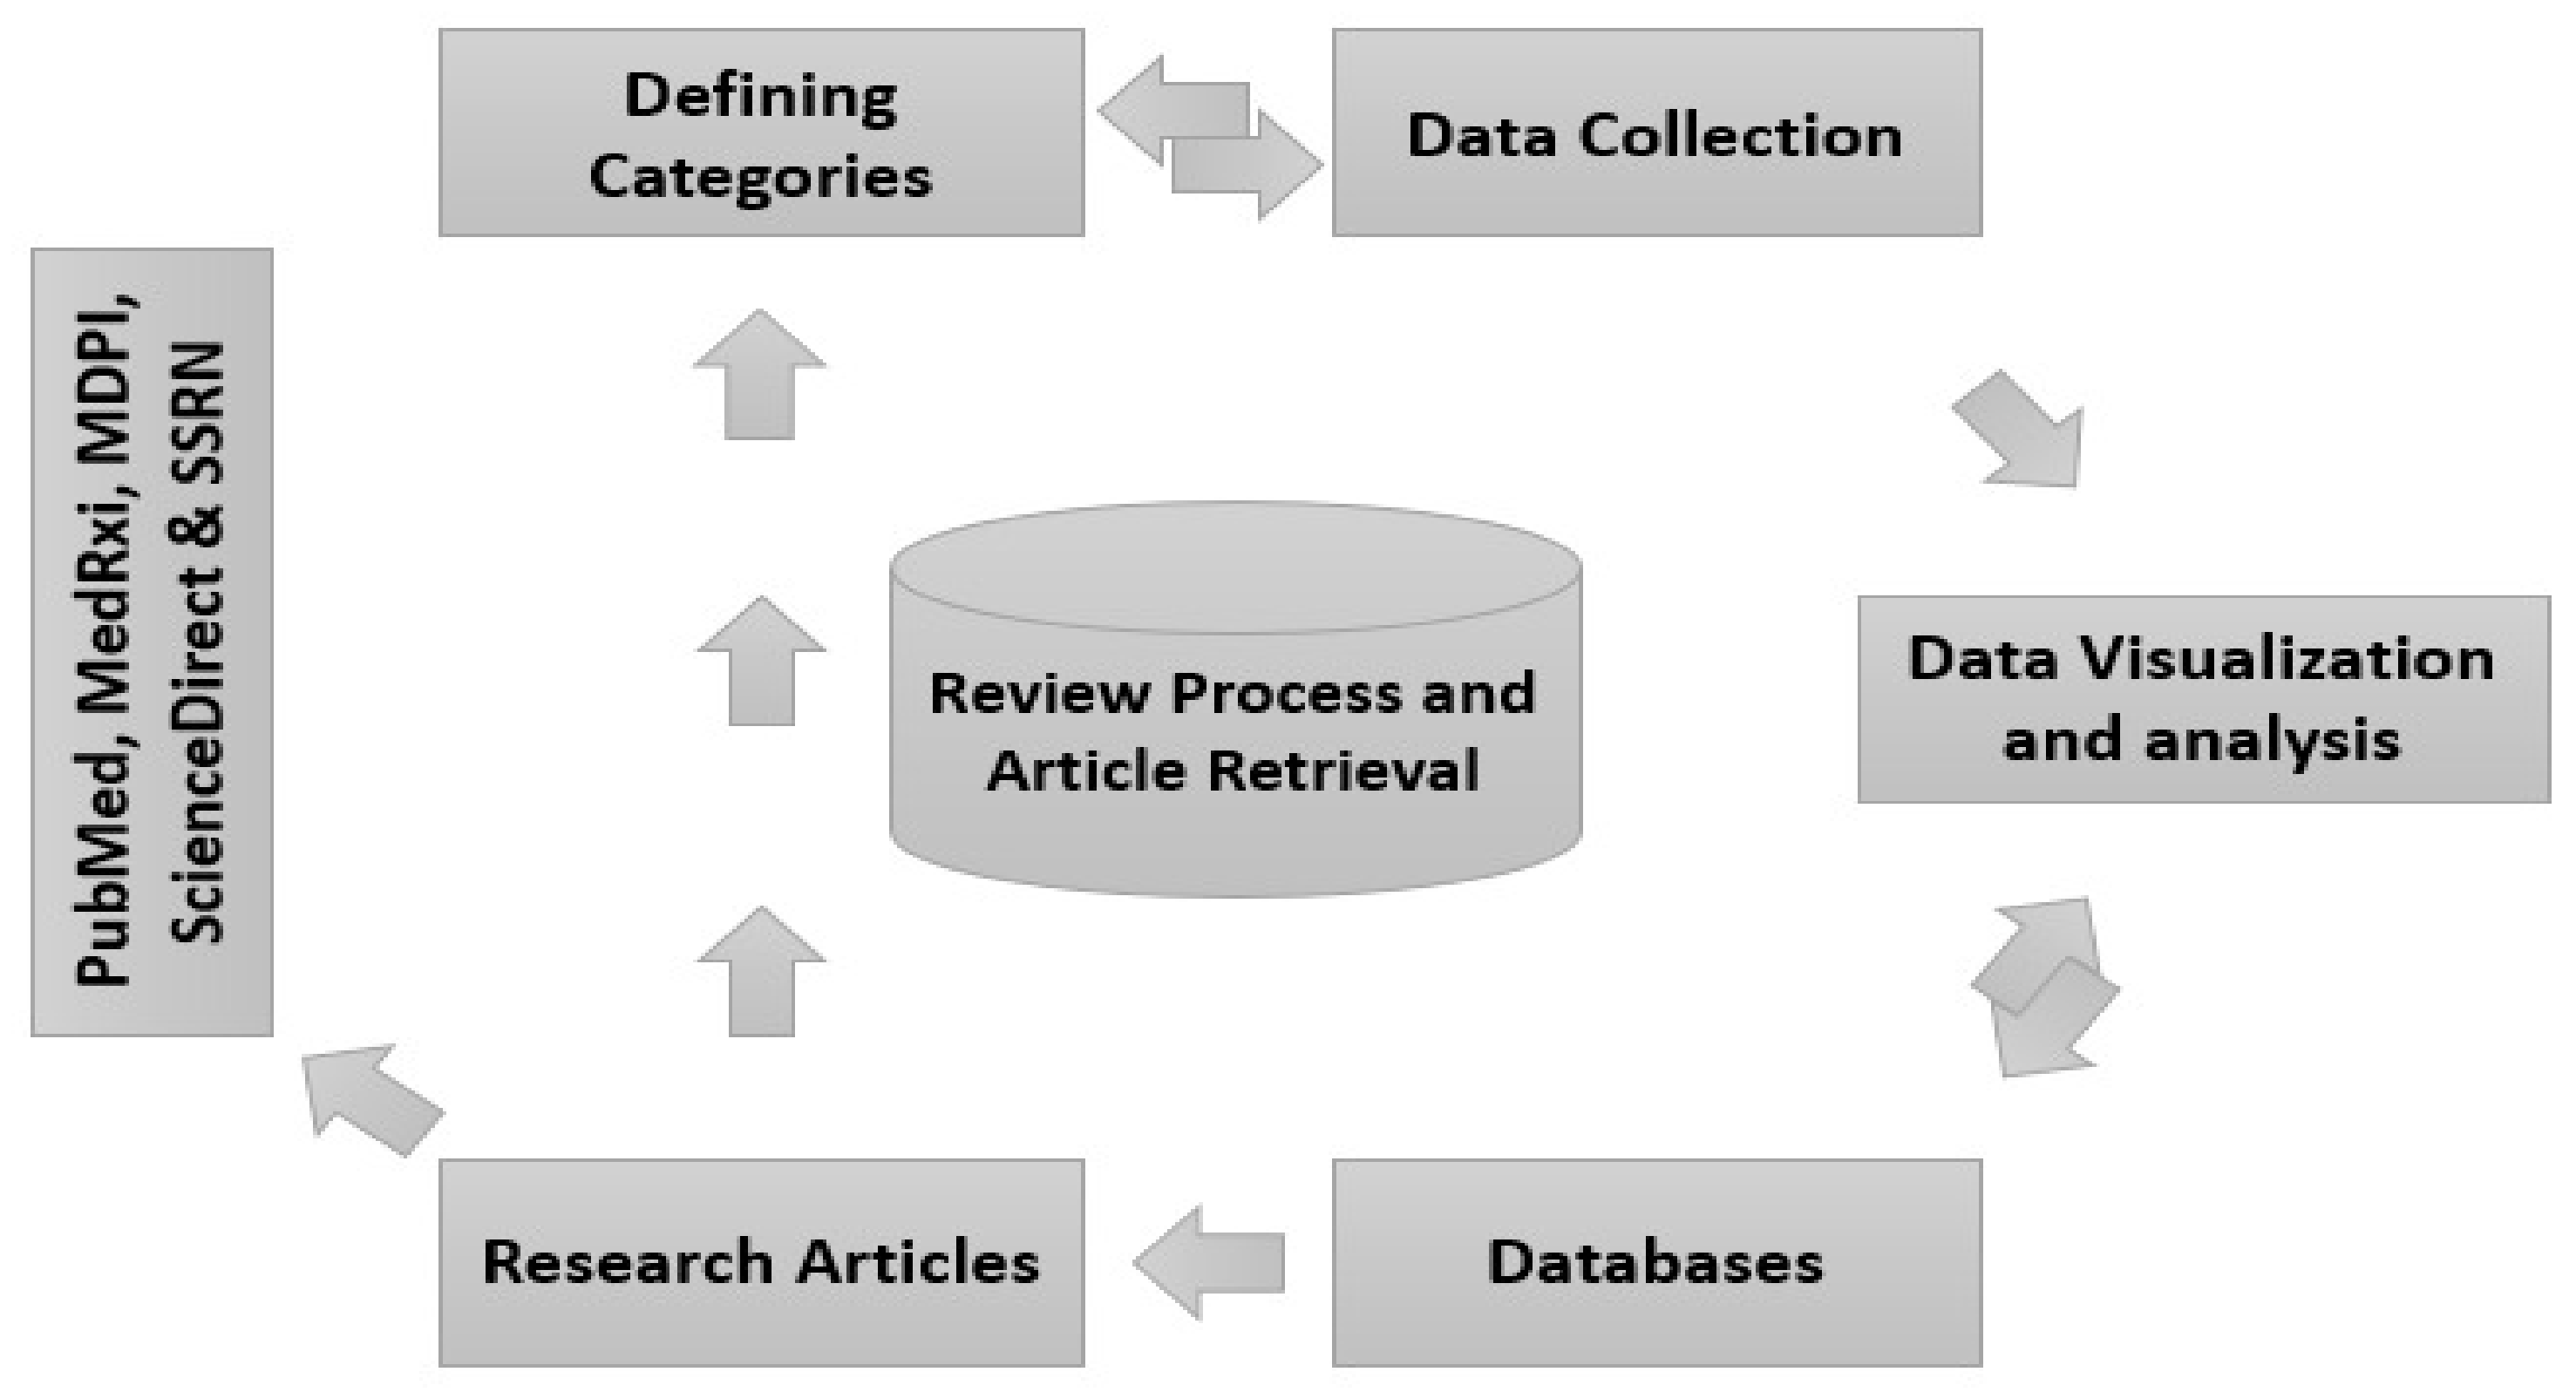
2. Materials and Method

This paper investigates and reports the effects of COVID-19 and its management policies on the unemployment rate in different states of Australia. The focus is on four important sectors: international mobility, tourism, education, and the labor market. To facilitate the data collection process, four major categories were defined, which are listed below.
  • Cat-1: Effects of COVID-19 on international travel patterns and movement of passengers;
  • Cat-2: Effects of COVID-19 on the tertiary education sector and associated unemployment;
  • Cat-3: Effects of COVID-19 on tourism and associated unemployment;
  • Cat-4: Effects of COVID-19 on the labor market and associated unemployment.
Different online sources were used to retrieve the relevant articles and publicly available data for reporting the effects of COVID-19 on the four mentioned categories. To retrieve articles related to each category, we first consulted the primary sources: official websites of scientific journals and conferences. The websites chosen for the study were PubMed, MedRxiv, MDPI, Elsevier, ScienceDirect, and SSRN. Search phrases to be used on the search engines of these websites were carefully designed to exhaust the database of each website and retrieve a maximum number of relevant articles. Figure 1 provides an overview of the article retrieval process.
To select and refine the selection the keywords, a list of basic keywords was generated. Then, more keywords related to this set of keywords were searched on the previously mentioned websites. After carrying out the keywords search, the most repetitive keywords found in the literature are shown in Figure 2. Keywords such as lockdown, industry, employment, tourism, and Job Seeker highlight that the data collected for this research revolved around the coronavirus’s effects on the unemployment rate in Australia. Search strings were developed using a combination of these keywords. Accordingly, the article search process was extended to retrieve a maximum number of relevant articles from the search engines.
As a result of these searches, a list of ranked research articles was retrieved from each website. A screening method was applied to assess and filter the articles. Each article was assessed based on the following criteria:
  • Published in or after 2021;
  • English language only;
  • Article type should be research paper, review, or book chapter only;
  • No duplicates.
After an initial screening of the articles, the articles were downloaded. Each paper was then studied and carefully analyzed for its relevance to the current study. This involved reading the abstract, introduction, and results section of each paper. Each article was finalized only after it had been found to be relevant to one or all the four defined categories. However, this exercise resulted in a limited number of articles. This was expected as there are not many studies conducted on the topic focusing on the Australian context. Therefore, the scope of the study was extended to include other data sources. These include the official government documents at national and state levels, local news and media outlet reports, reports of local data reporting organizations, and other relevant sources.
To collect data related to the most recent policies adopted by the Government of Australia, the official websites of the Australian government at both national and state levels were consulted. The interstate travel restrictions and various mobility-related policies during the pandemic were also collected from these websites. The data on the unemployment rate, travel pattern, and travels of international students, visitors, and citizens were gathered from the Australian Bureau of Statistics. The raw data were visualized in charts in Microsoft Excel. Facts and figures were gained from media platforms, including but not limited to BBC News, 7 News, ABC News, University World News, and reports from local organizations.

3. Results

In line with the method section, the effects of COVID-19 on the four sectors are presented below.

3.1. Effects of COVID-19 on International Travel Pattern and Movement of Passengers

Due to travel restrictions, there has been a significant decline in the number of visitors to Australia. Before the pandemic, China was the largest source country with the highest number of visitors to Australia. In 2020, around 1.8 million visitors arrived in Australia, which was 80% lower than the last year and the lowest since 1987 [32,33,34]. The largest number of visitors was from New Zealand (242,500) followed by China (207,700). Most of the visitors traveled for holidays and spent around 14 to 15 days in Australia. The largest number of citizens arriving from other countries also decreased during the pandemic. Table 1 provides the numbers of travelers from the top ten countries to Australia. An approximately 98% decrease in trips was observed in April–May 2021 compared to April–May 2019. Most of the travelers were returning Australian residents (60%) who returned from New Zealand, which was the most popular travel destination [33]. In terms of other countries, there was a decline in visitors from the top ten countries. This includes a 126.2 times reduction in the number of travelers from Malaysia, followed by Japan (74 times), China (64.4), USA (52.6), India (44.4), Philippines (26.4), UK (21.4), South Africa (11.1), New Zealand (2.9), and Vanuatu (1.8). However, these may not reflect the real impact of travelers due to the variable numbers. Table 1 provides these numbers.
Figure 3 provides a comparison of international arrivals of travelers in various Australian states. This is developed by the authors based on the data provided. In terms of the arrivals in different Australian states, NSW saw a reduction in travelers by 569,090, amounting to a 93.3% reduction. This is followed by VIC, with a reduction of 420,600 (95.5%), QLD 260,340 (87.1%), WA 157,570 (95.6%), SA 37,770 (91.5%), NT 11,260 (85.8%), and ACT 3590 (99.1%). Data for Tasmania were not recorded.

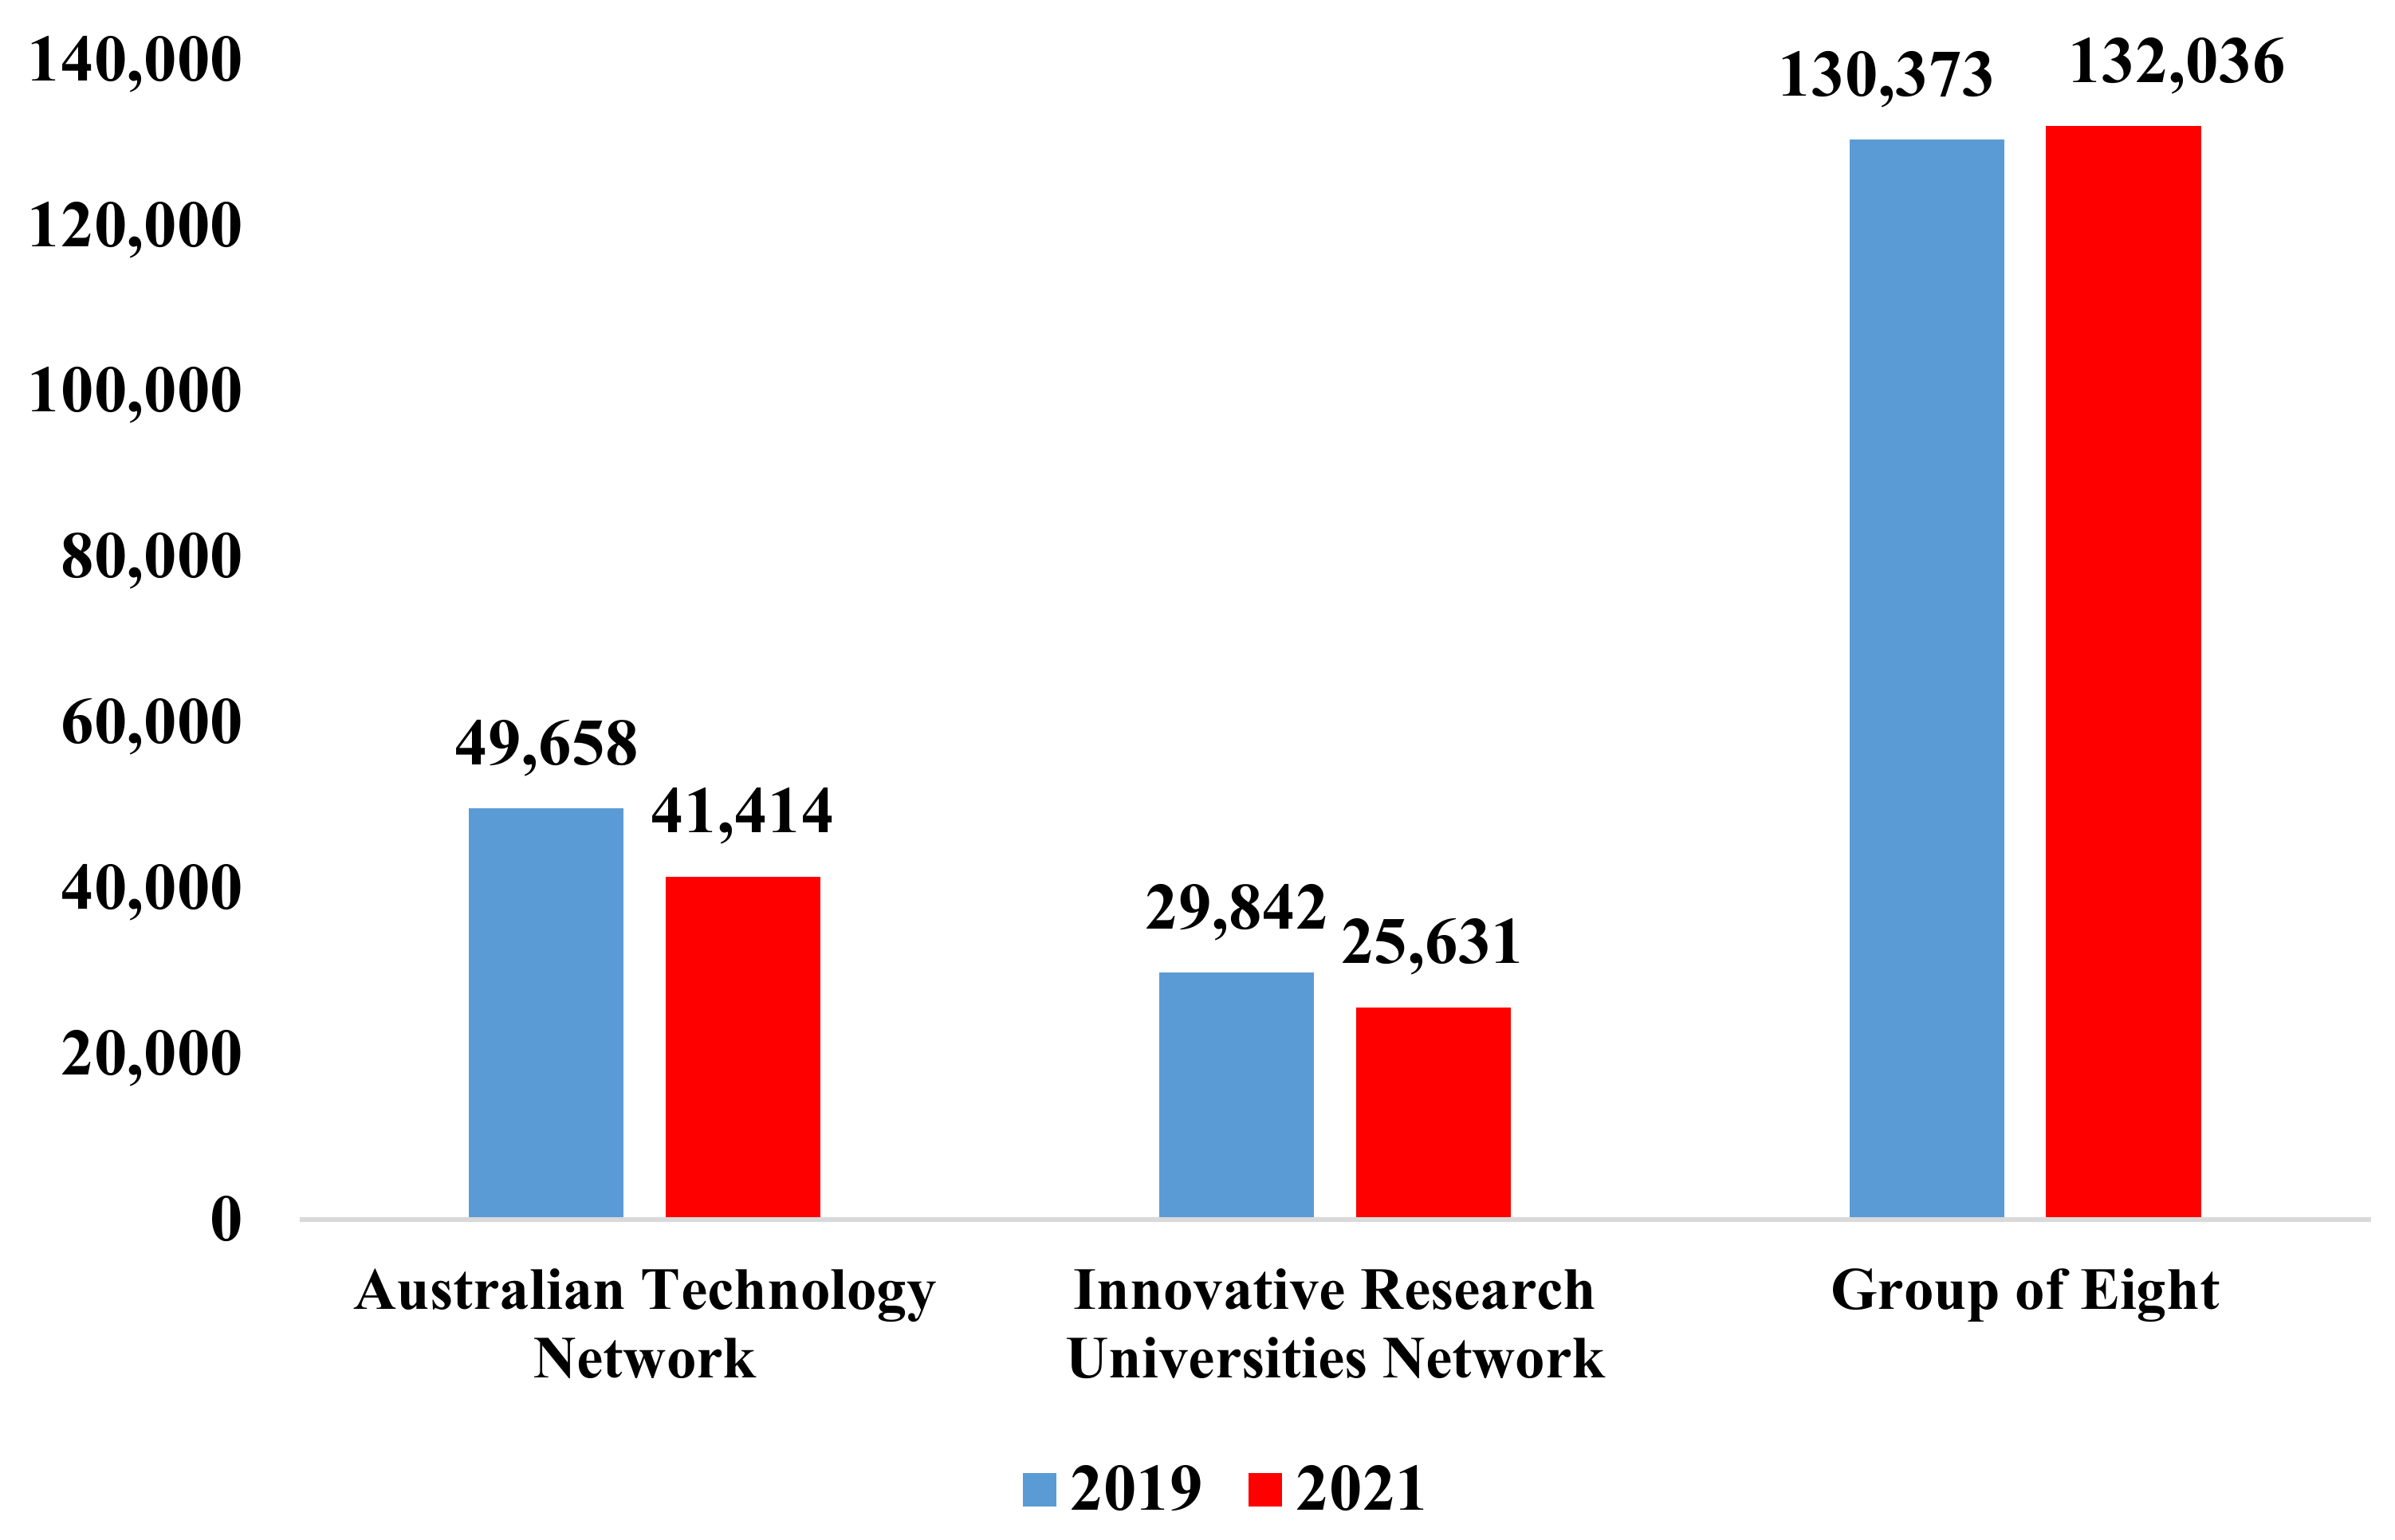
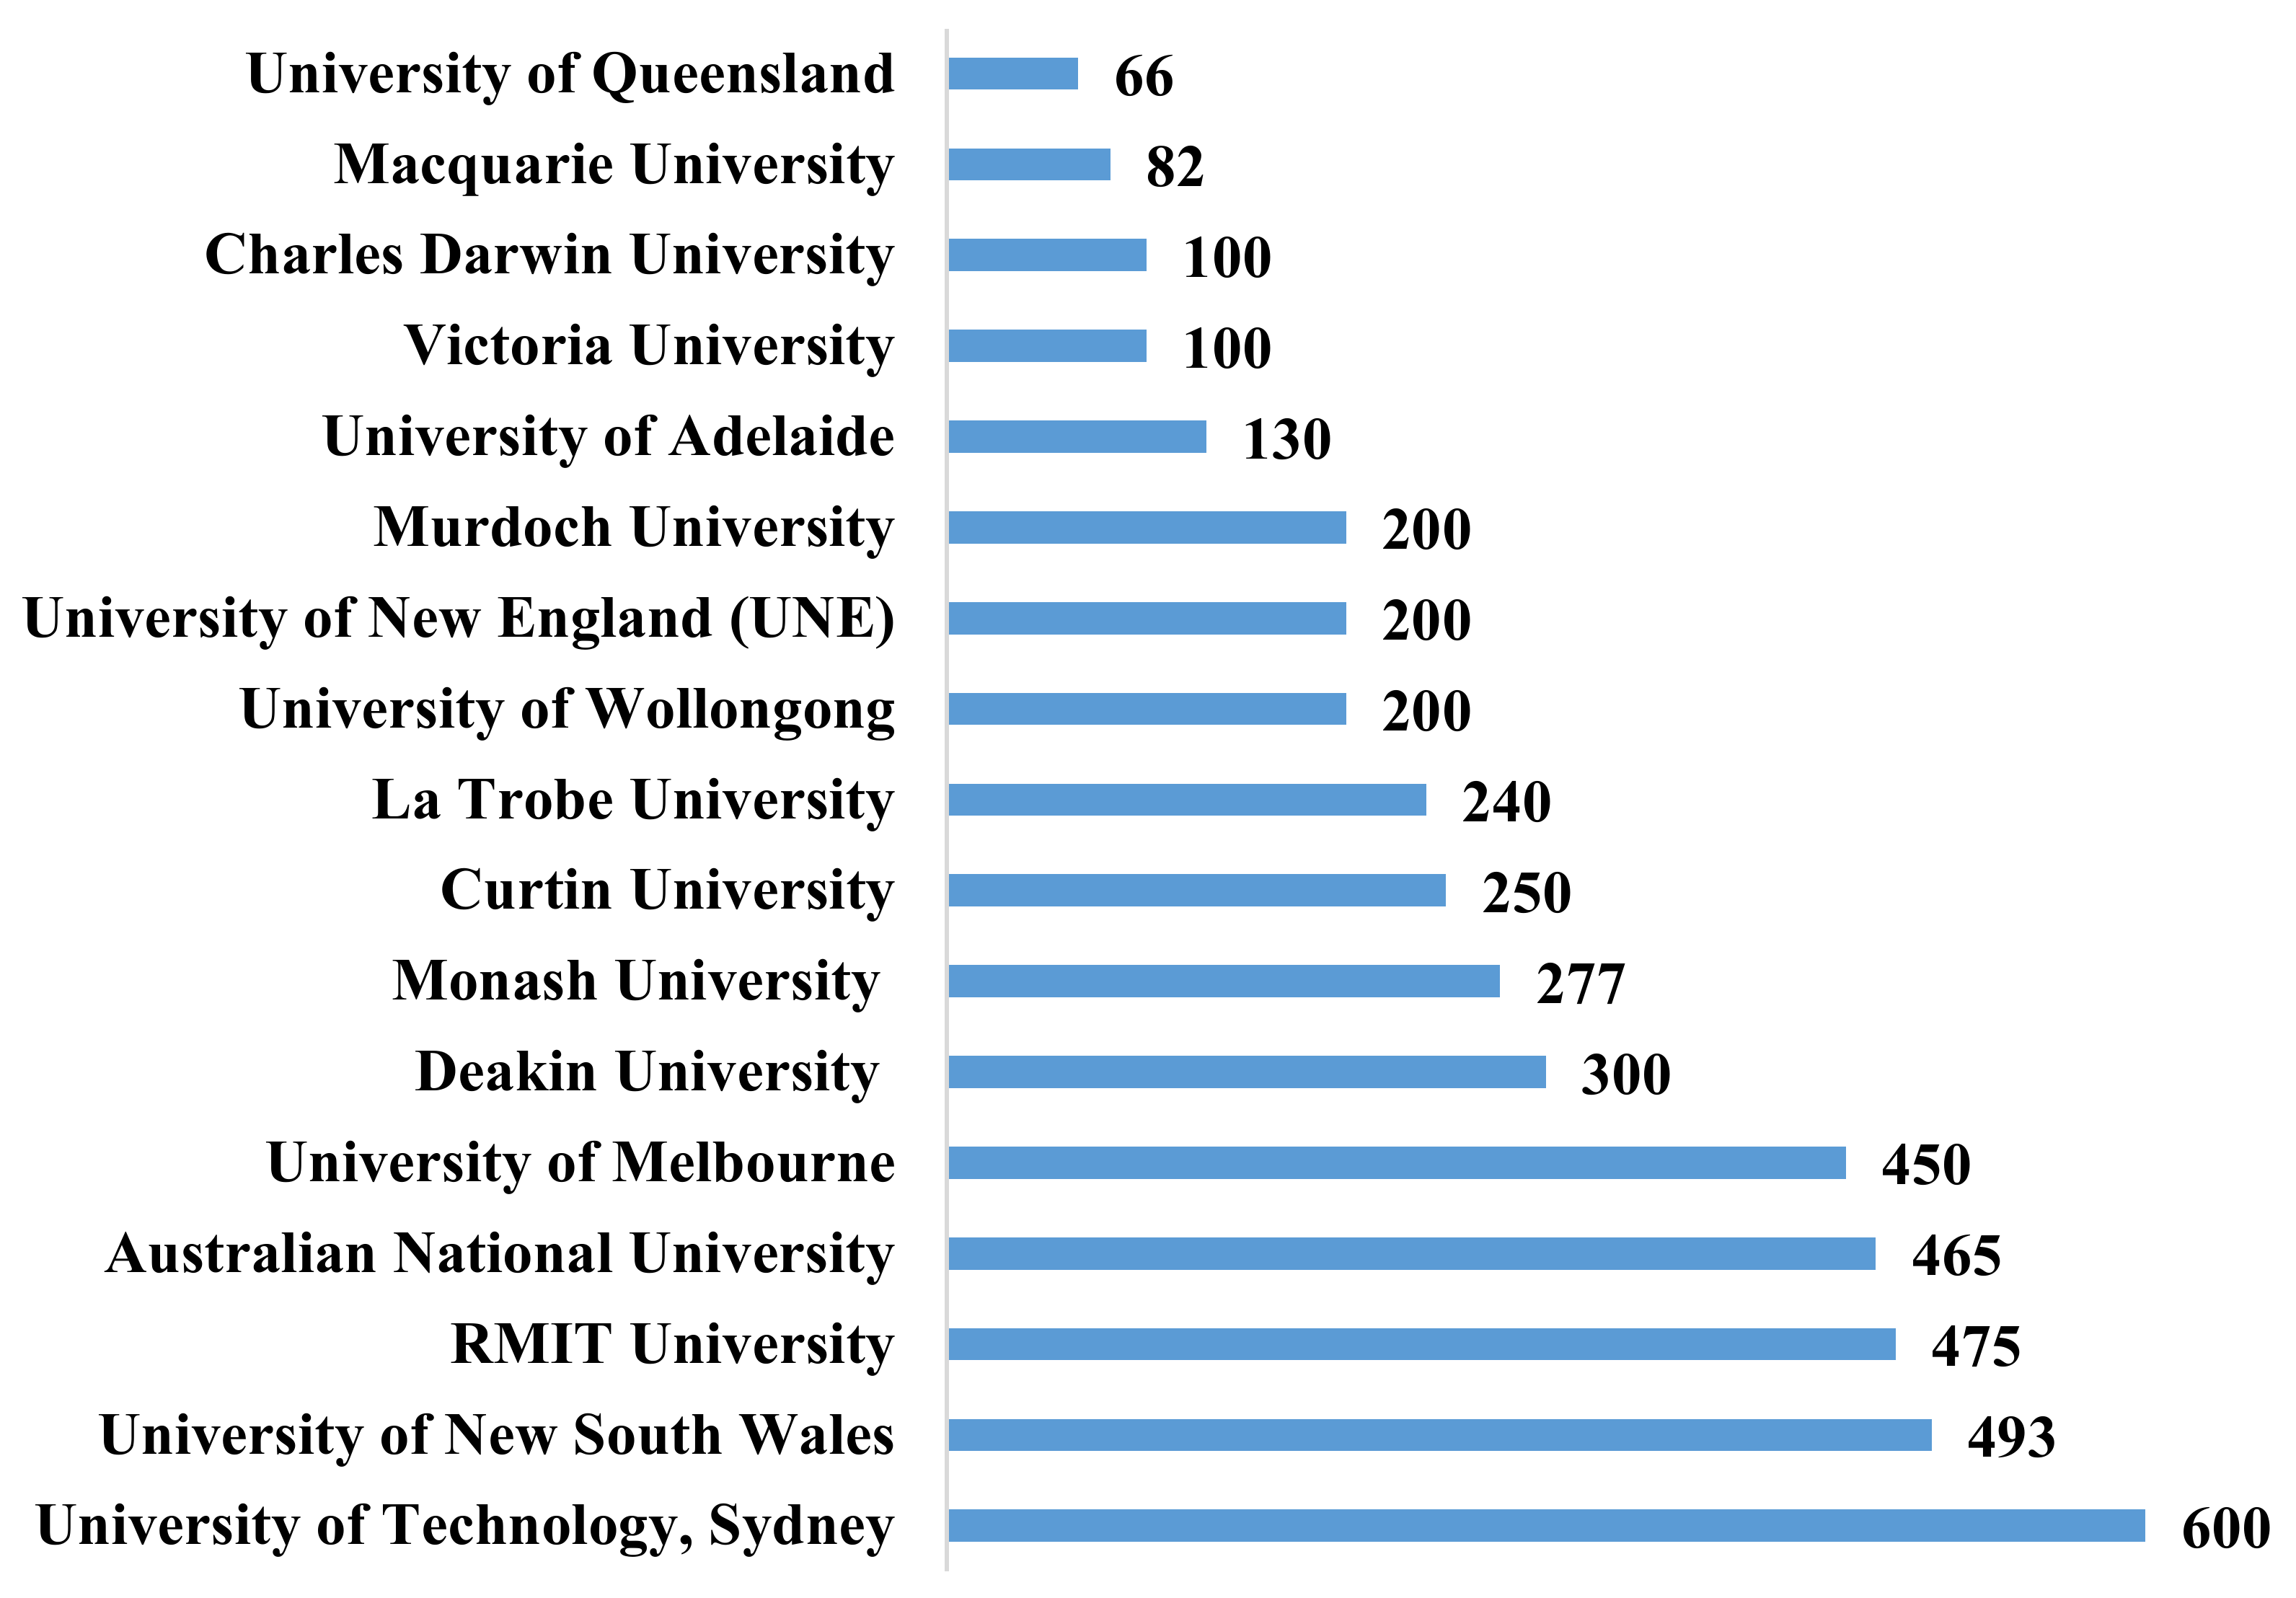
3.2. Effects of COVID-19 on the Tertiary Education Sector and Associated Unemployment

Australian universities can be divided into three main groups: the Australian technologies network, the innovative research universities network, and the group of eight. The Australian technologies network consists of universities such as the University of Technology Sydney, RMIT University, and Deakin University, where a decline of more than 8000 students has been observed from 2019 to 2021. It must be remembered that these universities have maintained their number of enrollments from previous years and observed a steady increase over the years. This makes it even more concerning when the universities fail to maintain their number of enrollments from previous years. The next group is the innovative research universities network, consisting of universities such as Western Sydney, James Cook, and Griffith University. Again, this group saw a major decline, missing their 2019 enrollments number by around 14%. The only group that successfully managed to maintain their numbers is that of the Group of Eight, consisting of universities such as the University of Sydney and the University of NSW. However, these universities generally see a significant rise in enrollment every year, and barely maintaining the numbers from 2019 means the universities have not met their previous trends. Figure 4 developed by the authors based on [35] (https://www.smh.com.au/national/nsw/regional-universities-are-going-to-struggle-the-unis-worst-hit-by-COVID-19-20210622-p583be.html, accessed on 9 July 2021) compares the enrollments in the three universities’ groups for 2019 and 2021.
Many international students could not arrive in Australia and were stuck overseas after imposed restrictions and closed borders. As a result, the arrival of international students declined by 99.4% since 2019, with only 260 students arriving in Australia in 2021, causing huge financial losses in the education, tourism, and transport sectors, as shown in Figure 5. Overall, the tourism sector was hit the worst, with more than five-billion-dollar losses, followed by education, at around 3 billion loss and transportation of around one-billion-dollar losses. This is magnified by the fact that these losses occurred in one year only, which has seriously strained the Australian economy.
In 2020 alone, Australian universities lost 6% of their revenue, as shown in Figure 6, and the next two years are looking worse. Looking into the revenue since 2015, there has been a steady and sustained increase in the Australian universities’ revenue. In fact, this is the first time a decline has been observed since 1995. It is expected that the closed borders could cost $20 billion a year in 2022, amounting to almost half the sector’s value. Figure 6 was developed by the authors based on [36] (https://theconversation.com/universities-lost-6-of-their-revenue-in-2020-and-the-next-2-years-are-looking-worse-166749, accessed on 13 July 2021).
As a result of the decreased revenues, Australian universities have undergone serious job cuts, leading to increased unemployment in the education sector. Overall, Australian universities have seen more than 17,000 job losses [37]. Being Australia’s third-largest export, the education sector has suffered serious losses due to international border closures. These losses are expected to continue beyond 2021 as the universities battle to overcome the effects of COVID-19. Figure 7 shows the expected or confirmed number of permanent job losses in Australian universities. The figure was developed by the authors. It must be noted that these numbers do not include the massive reduction (in some cases, complete ban on) in the casual appointments. This has seriously impacted the educational sector in Australia.

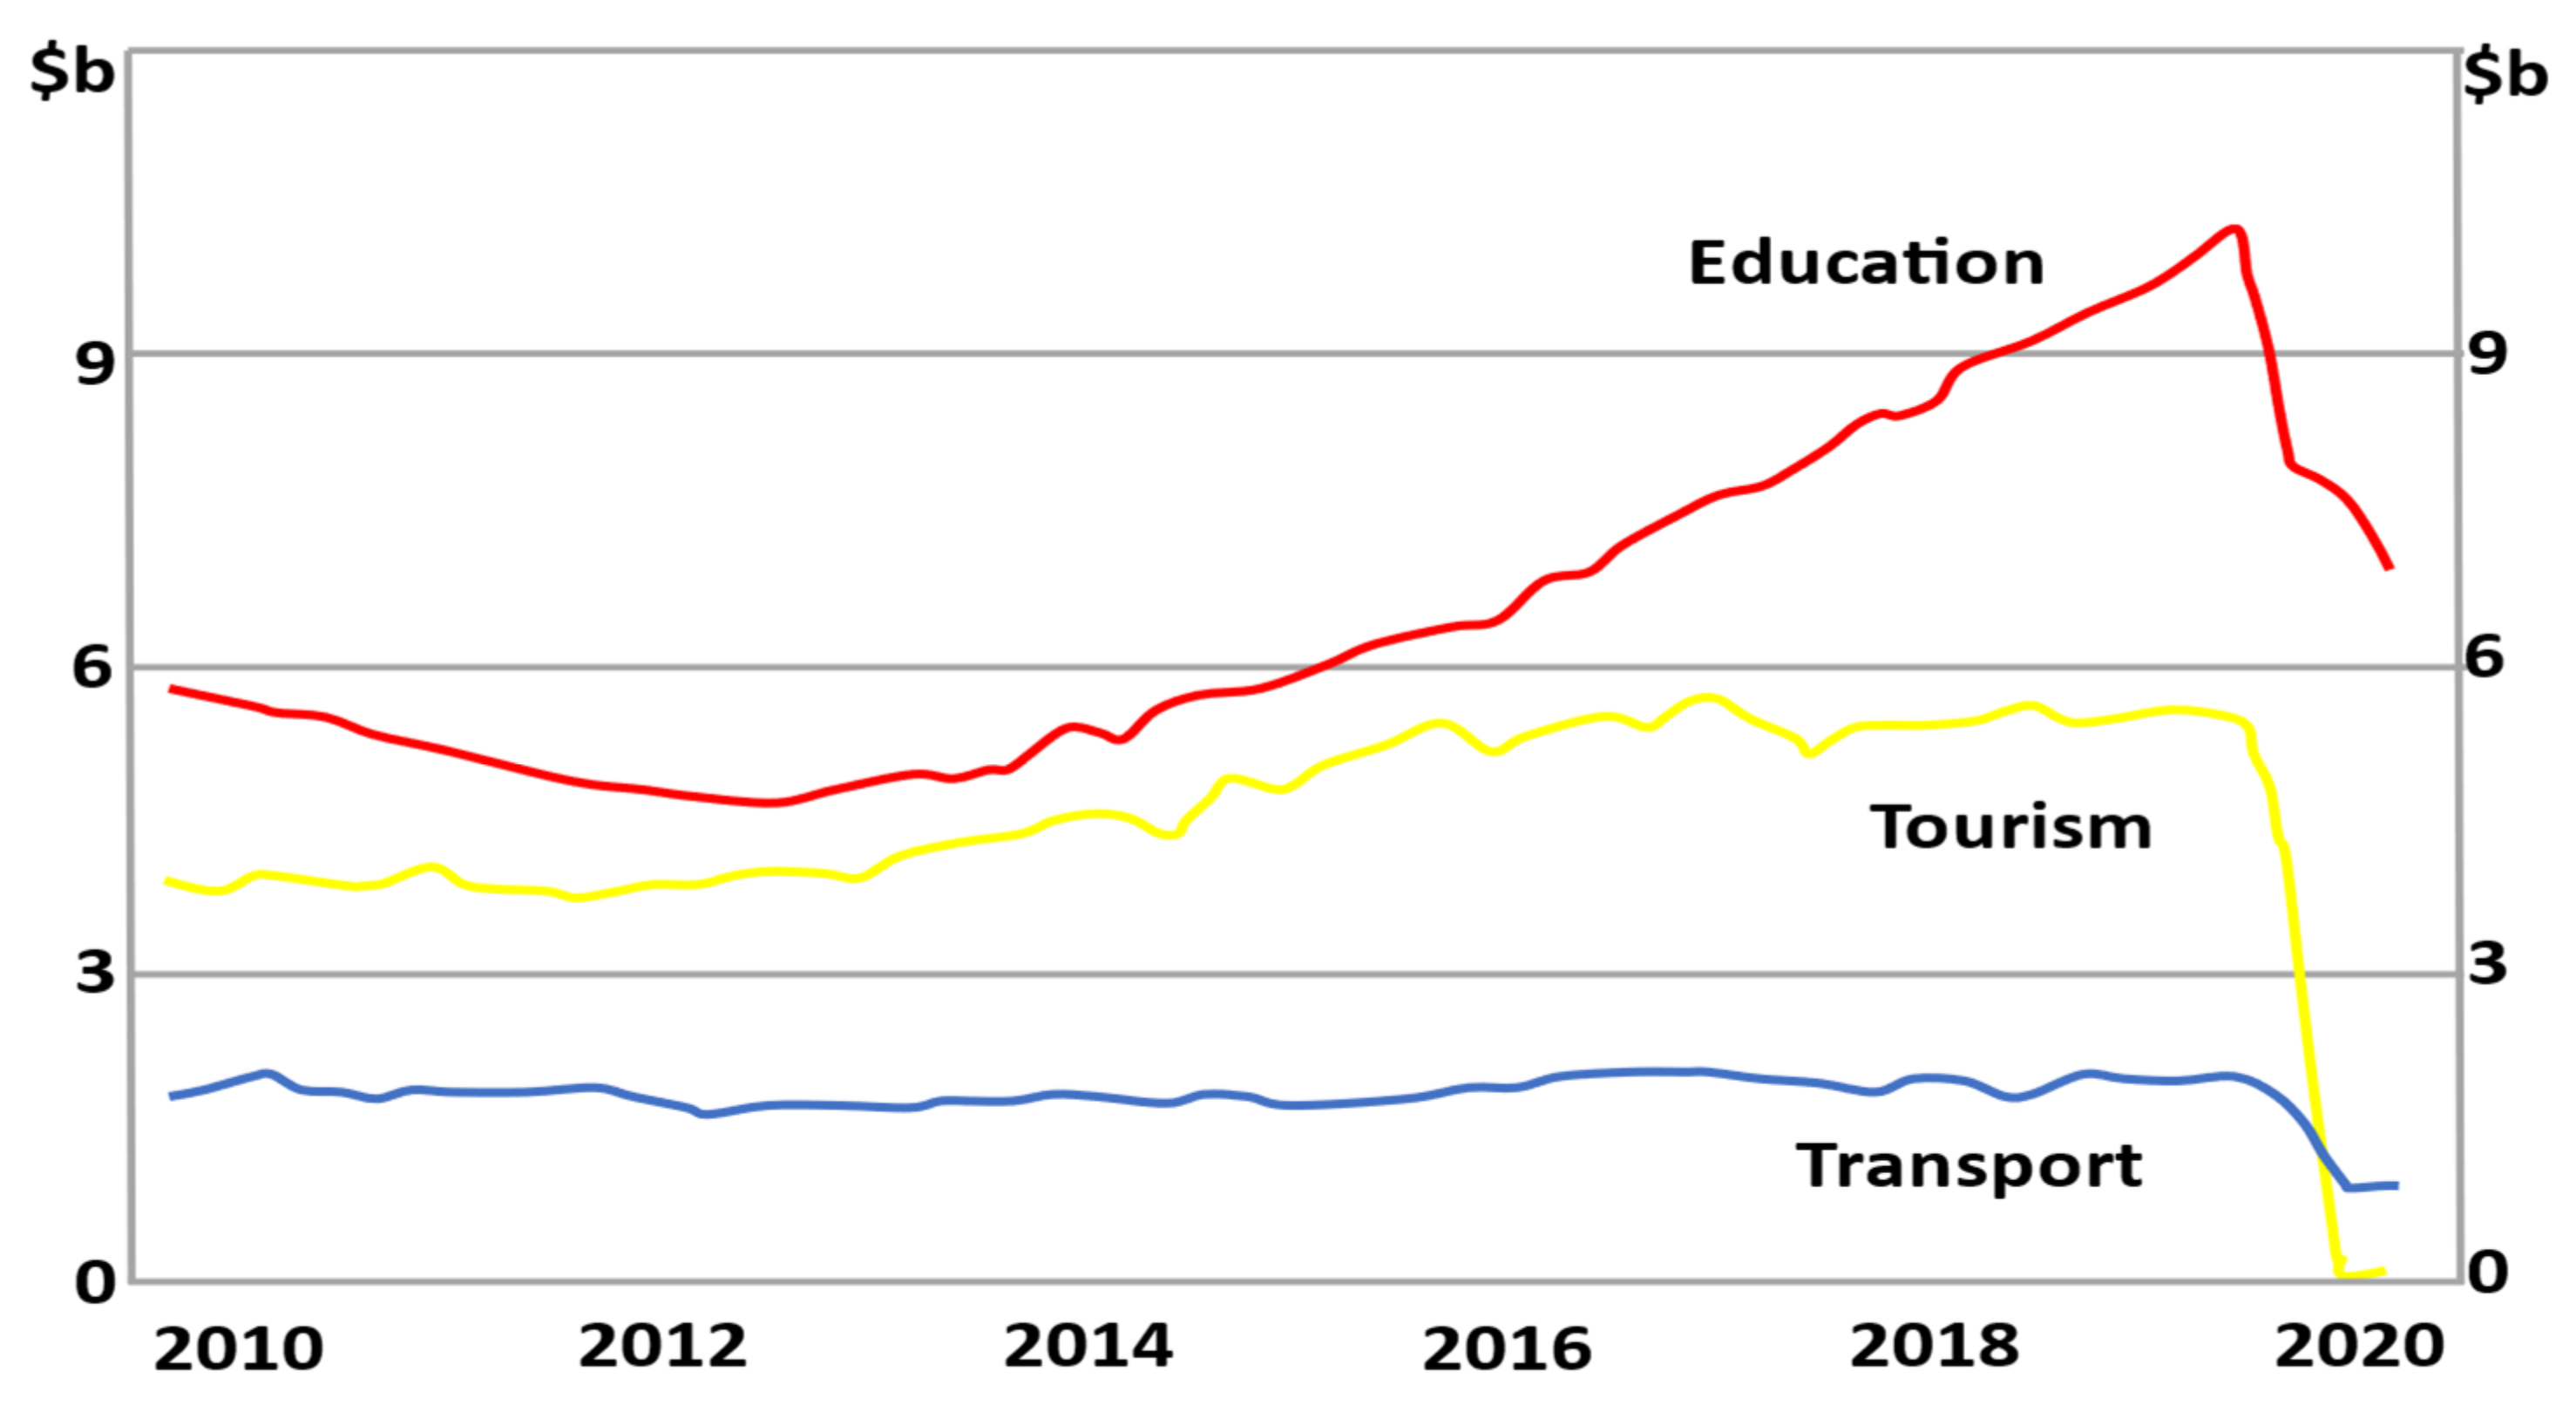
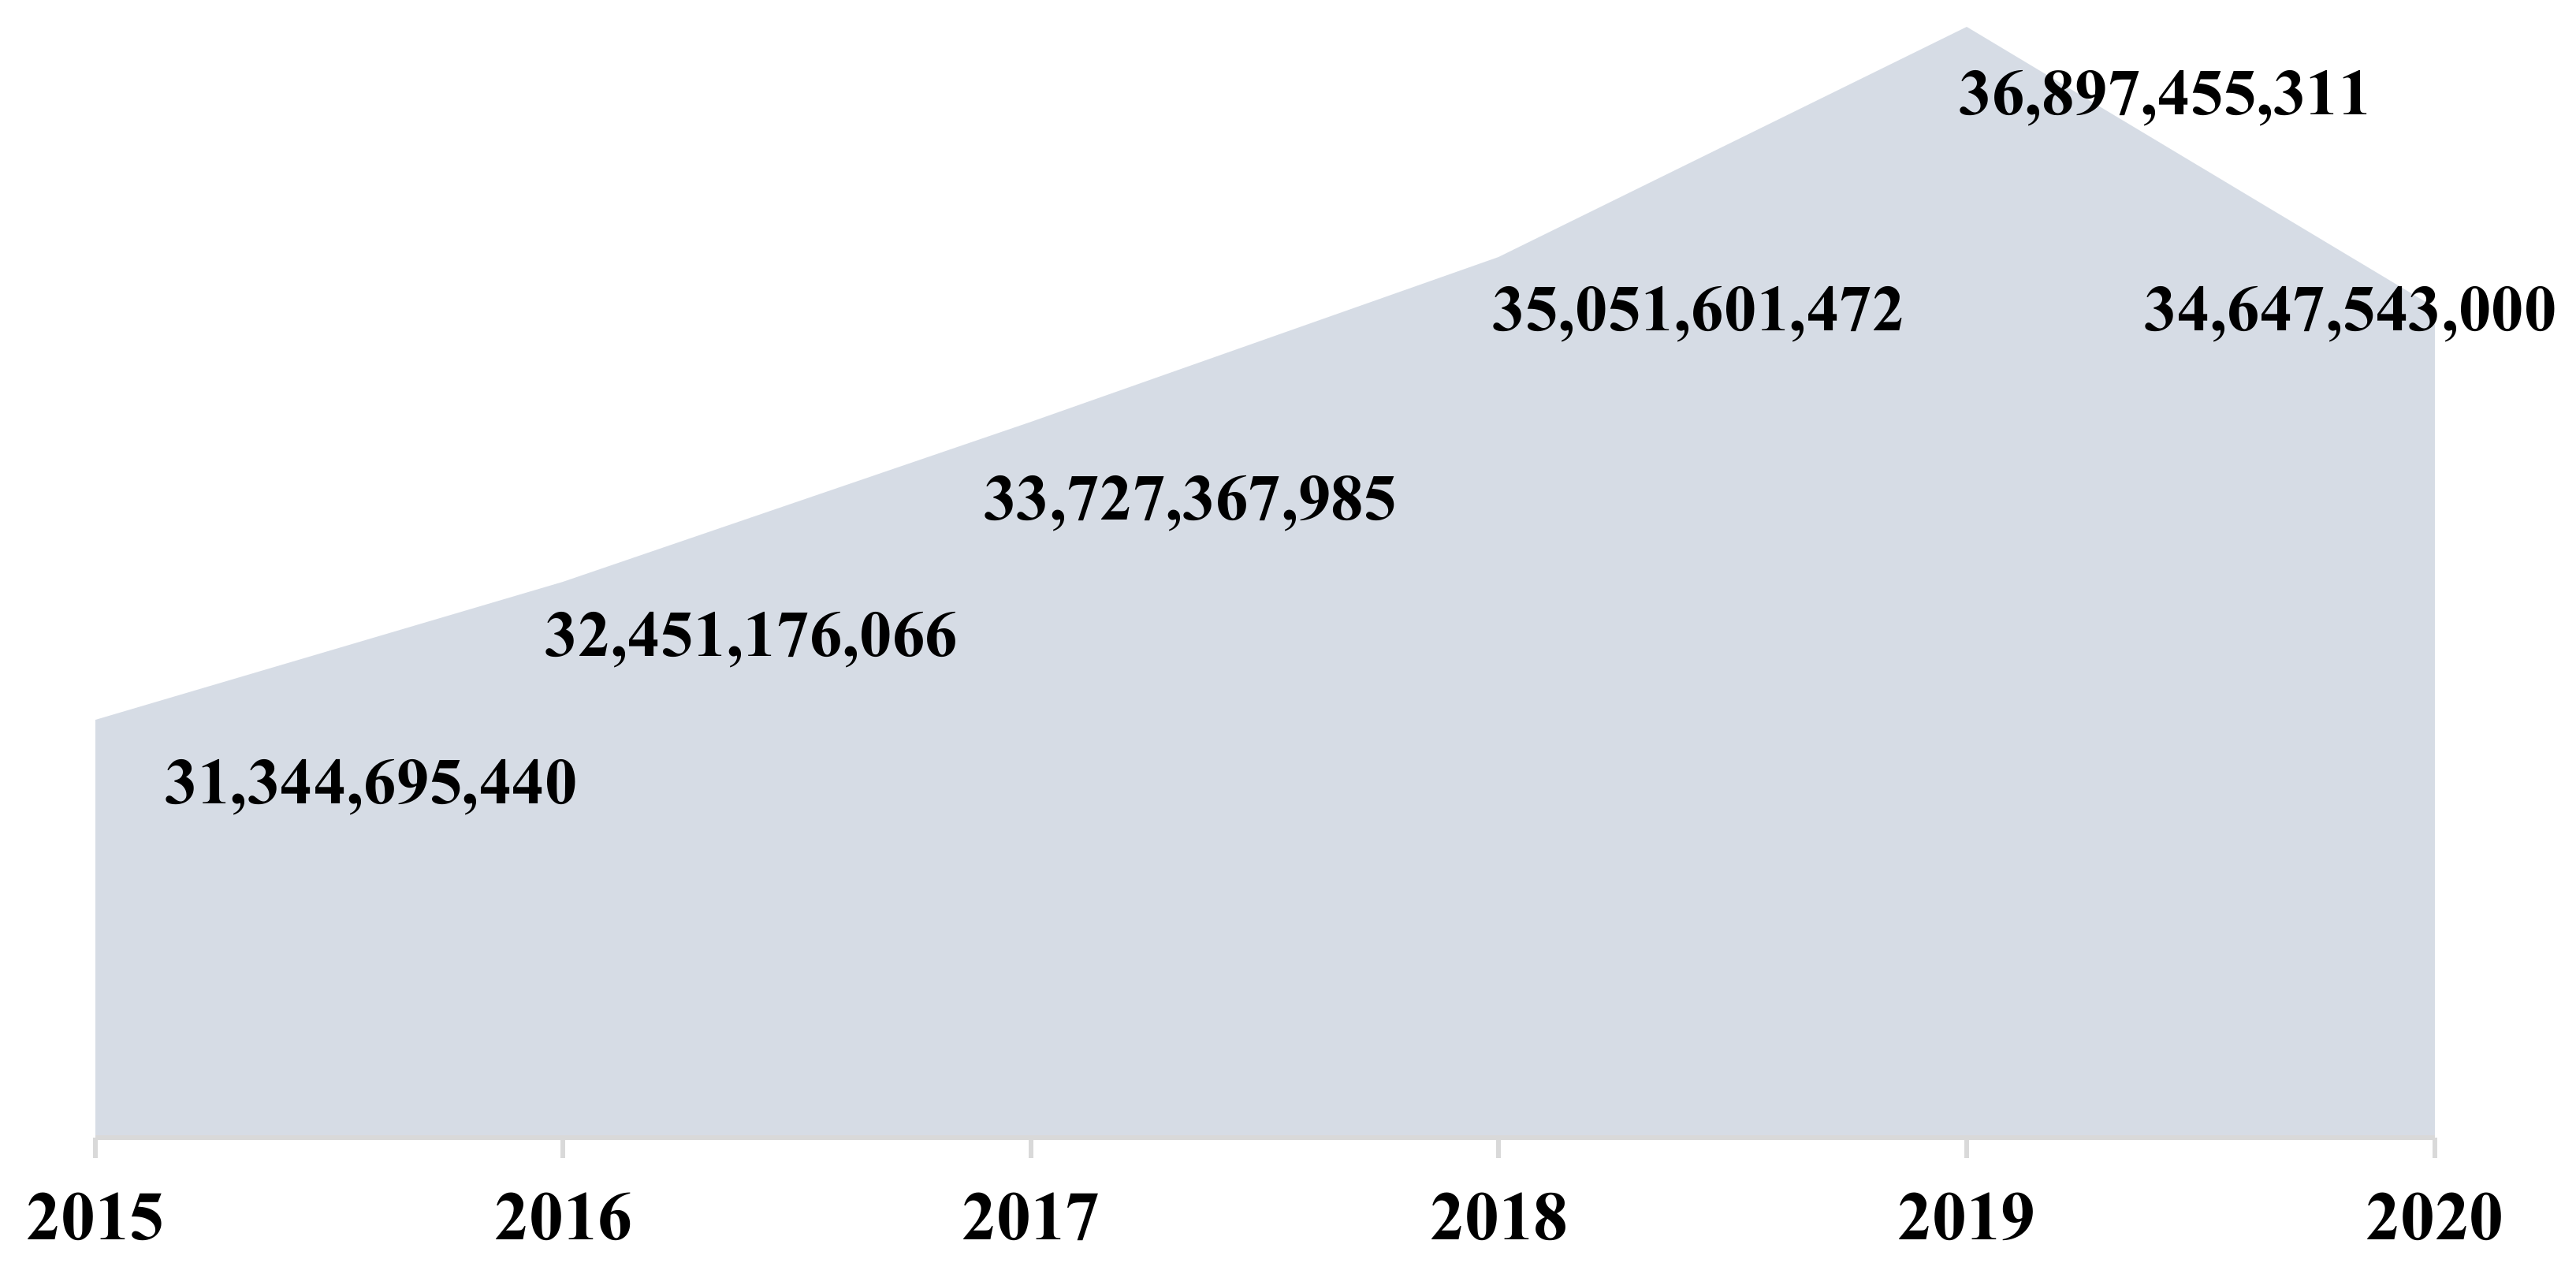
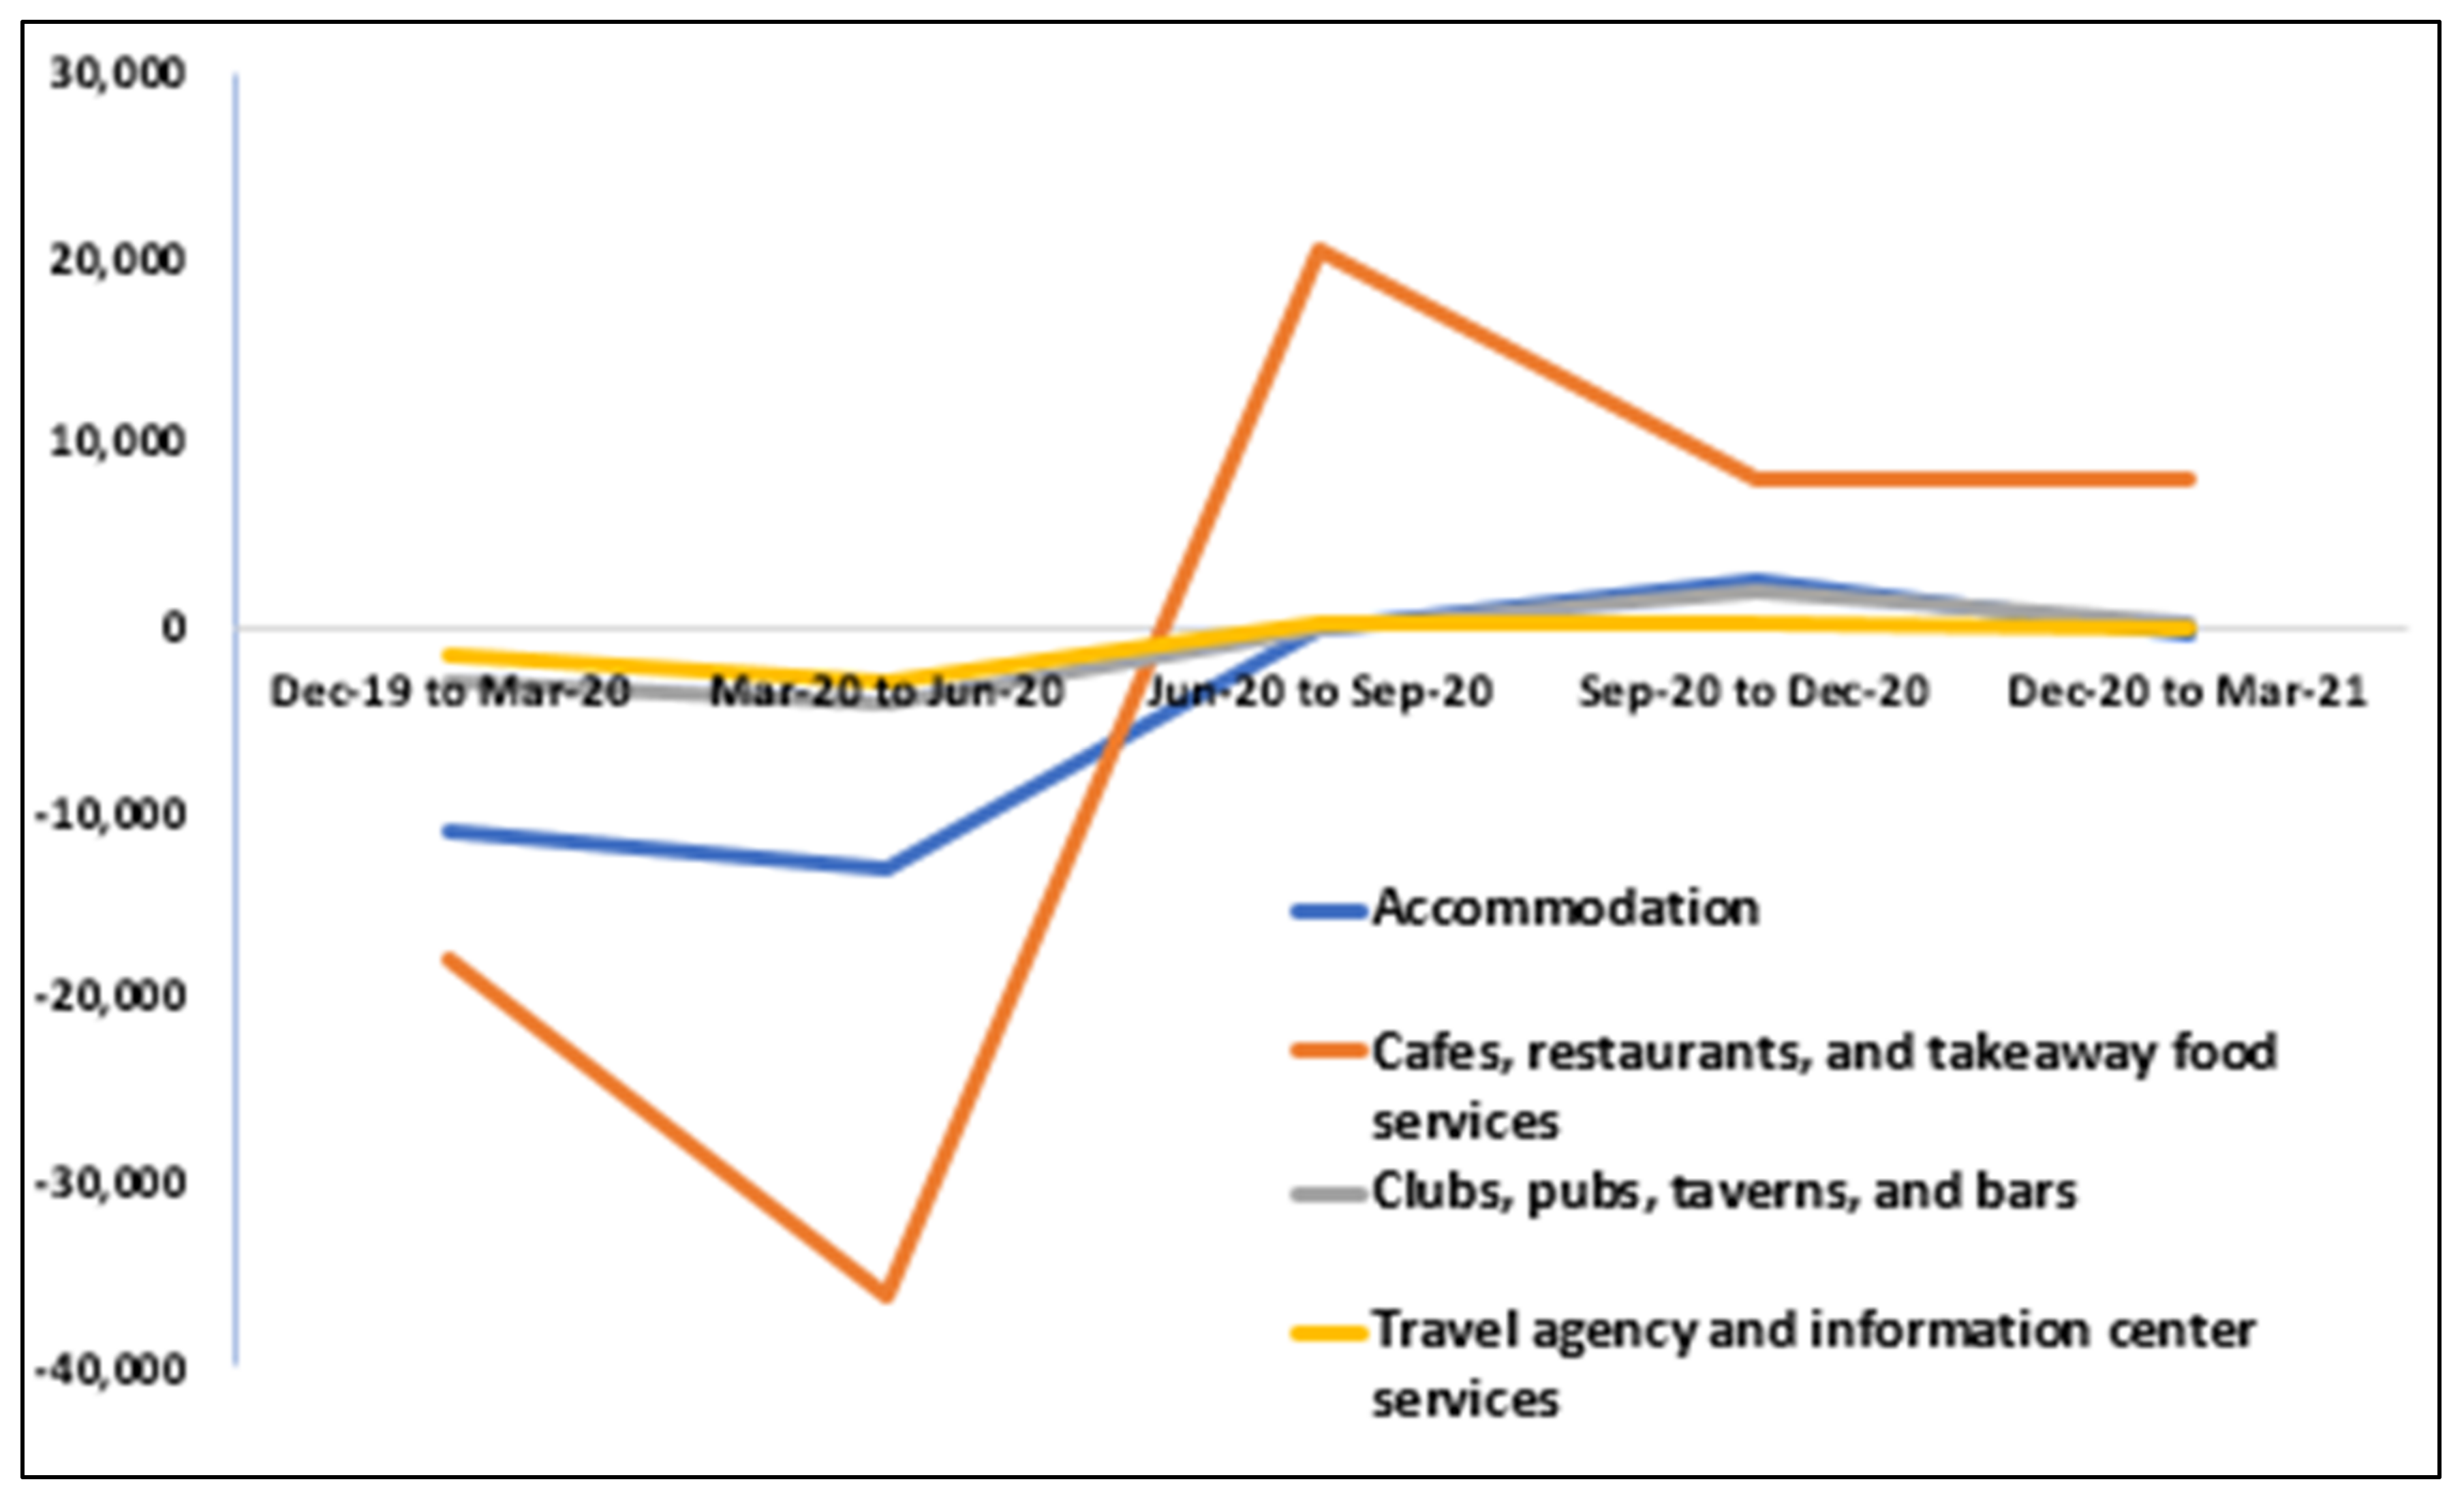
3.3. Effects of COVID-19 on Tourism and Associated Unemployment

Due to interstate and international border restrictions, tourism has been extensively reduced across Australia. The tourism industry has faced heavy loss of business and jobs due to reduced numbers of people taking holidays. In March, there were 662,700 tourism jobs. This was 3100 (0.5%) more jobs than December 2020, 35,500 (−5.1%) fewer jobs than March 2020, and almost 1 in 20 (4.7%) filled jobs in the economy [38,39] (Table 2).
Since the closure of the Australian borders to international travelers, there have been 5.8 million fewer international visitors (in the Jan to Oct period). This has resulted in an estimated loss of around $30 billion in expenditure. To add to this, the domestic market is down about $40 billion over this period, with overnight-trip spending down $32 billion (−47%) and day-trip spending down $8 billion (−37%). Further, interstate travel is down two-thirds, with intrastate travel also down about 30% compared to last year [40]. Table 3 presents the contribution of overnight domestic and international tourism in terms of percentage in 2019 and its percentage reduction in 2020.
Figure 8 presents the hotel occupancy rates (in percentage) for the months of July 2019 to June 2020. A significant drop can be seen from March 2020 and onwards when the impacts of COVID-19 began in Australia. The graph was developed based on the data in [41].
The employment rates across the hospitality and tourism industry were worst impacted due to COVID-19. Figure 9 displays the job trends across different sectors of the tourism industry. Due to restricted movements and travel, accommodations such as hotels, motels, Airbnb, resorts recorded an all-time low in reservations, leading to reduction in numbers of employees from −15% to −18% per quarter from March 2020 to March 2021 [42,43,44]. In addition, cafes and restaurants offered limited dine-in facilities or takeaway services only. As a result, these businesses reduced staff heavily from March 2020 to June 2020. However, with limited options available and takeaway categorized as an essential service, the employment in the cafes and restaurants saw a positive surge after June 2020, adding about 11% additional staff to facilitate home deliveries [45,46,47].

3.4. Effects of COVID-19 on Labor Market and Associated Unemployment

Australia imposed major social distancing rules and other business-related restrictions such as working from home, office usage limits, number of people per square meter, restrictions to travel, and restrictions in group activities to slow the spread of COVID-19. The government also announced support packages, such as Job Keeper and Job Seeker, to ensure the increasing unemployment rates and jobs losses were taken care of [48].

3.4.1. Unemployment Rates in Australia

As per the key statistical estimates for May 2020, the unemployment rate increased to 7.1% and the employee participation rate decreased to 63% [49]. The underemployment rate decreased to 13.1%, while monthly hours worked decreased to 1605 million hours. The unemployment rate increased by 0.7 pts to 7.1% (1.9 pts higher than a year ago), while the unemployed people increased by 85,700 to 927,600 (and increased by 219,200 over the year to May 2020). The youth unemployment rate increased by 2.0 pts to 16.1% (and increased by 4.1 pts over the year to May 2020). Employment decreased by 227,700 people (1.8%) to 12,154,100 people. Over the year to May 2021, employment increased by 987,200 people (8.1%). Further, the employment was 130,400 people (1.0%) higher than March 2020. Similarly, the full-time employment increased by 97,500 to 8,965,200 people, and part-time employment increased by 17,700 to 4,160,000 people. The part-time share of employment was 31.7%, 0.1 pts lower than in March 2020 and 2.1 pts higher than this time last year [50,51,52,53].

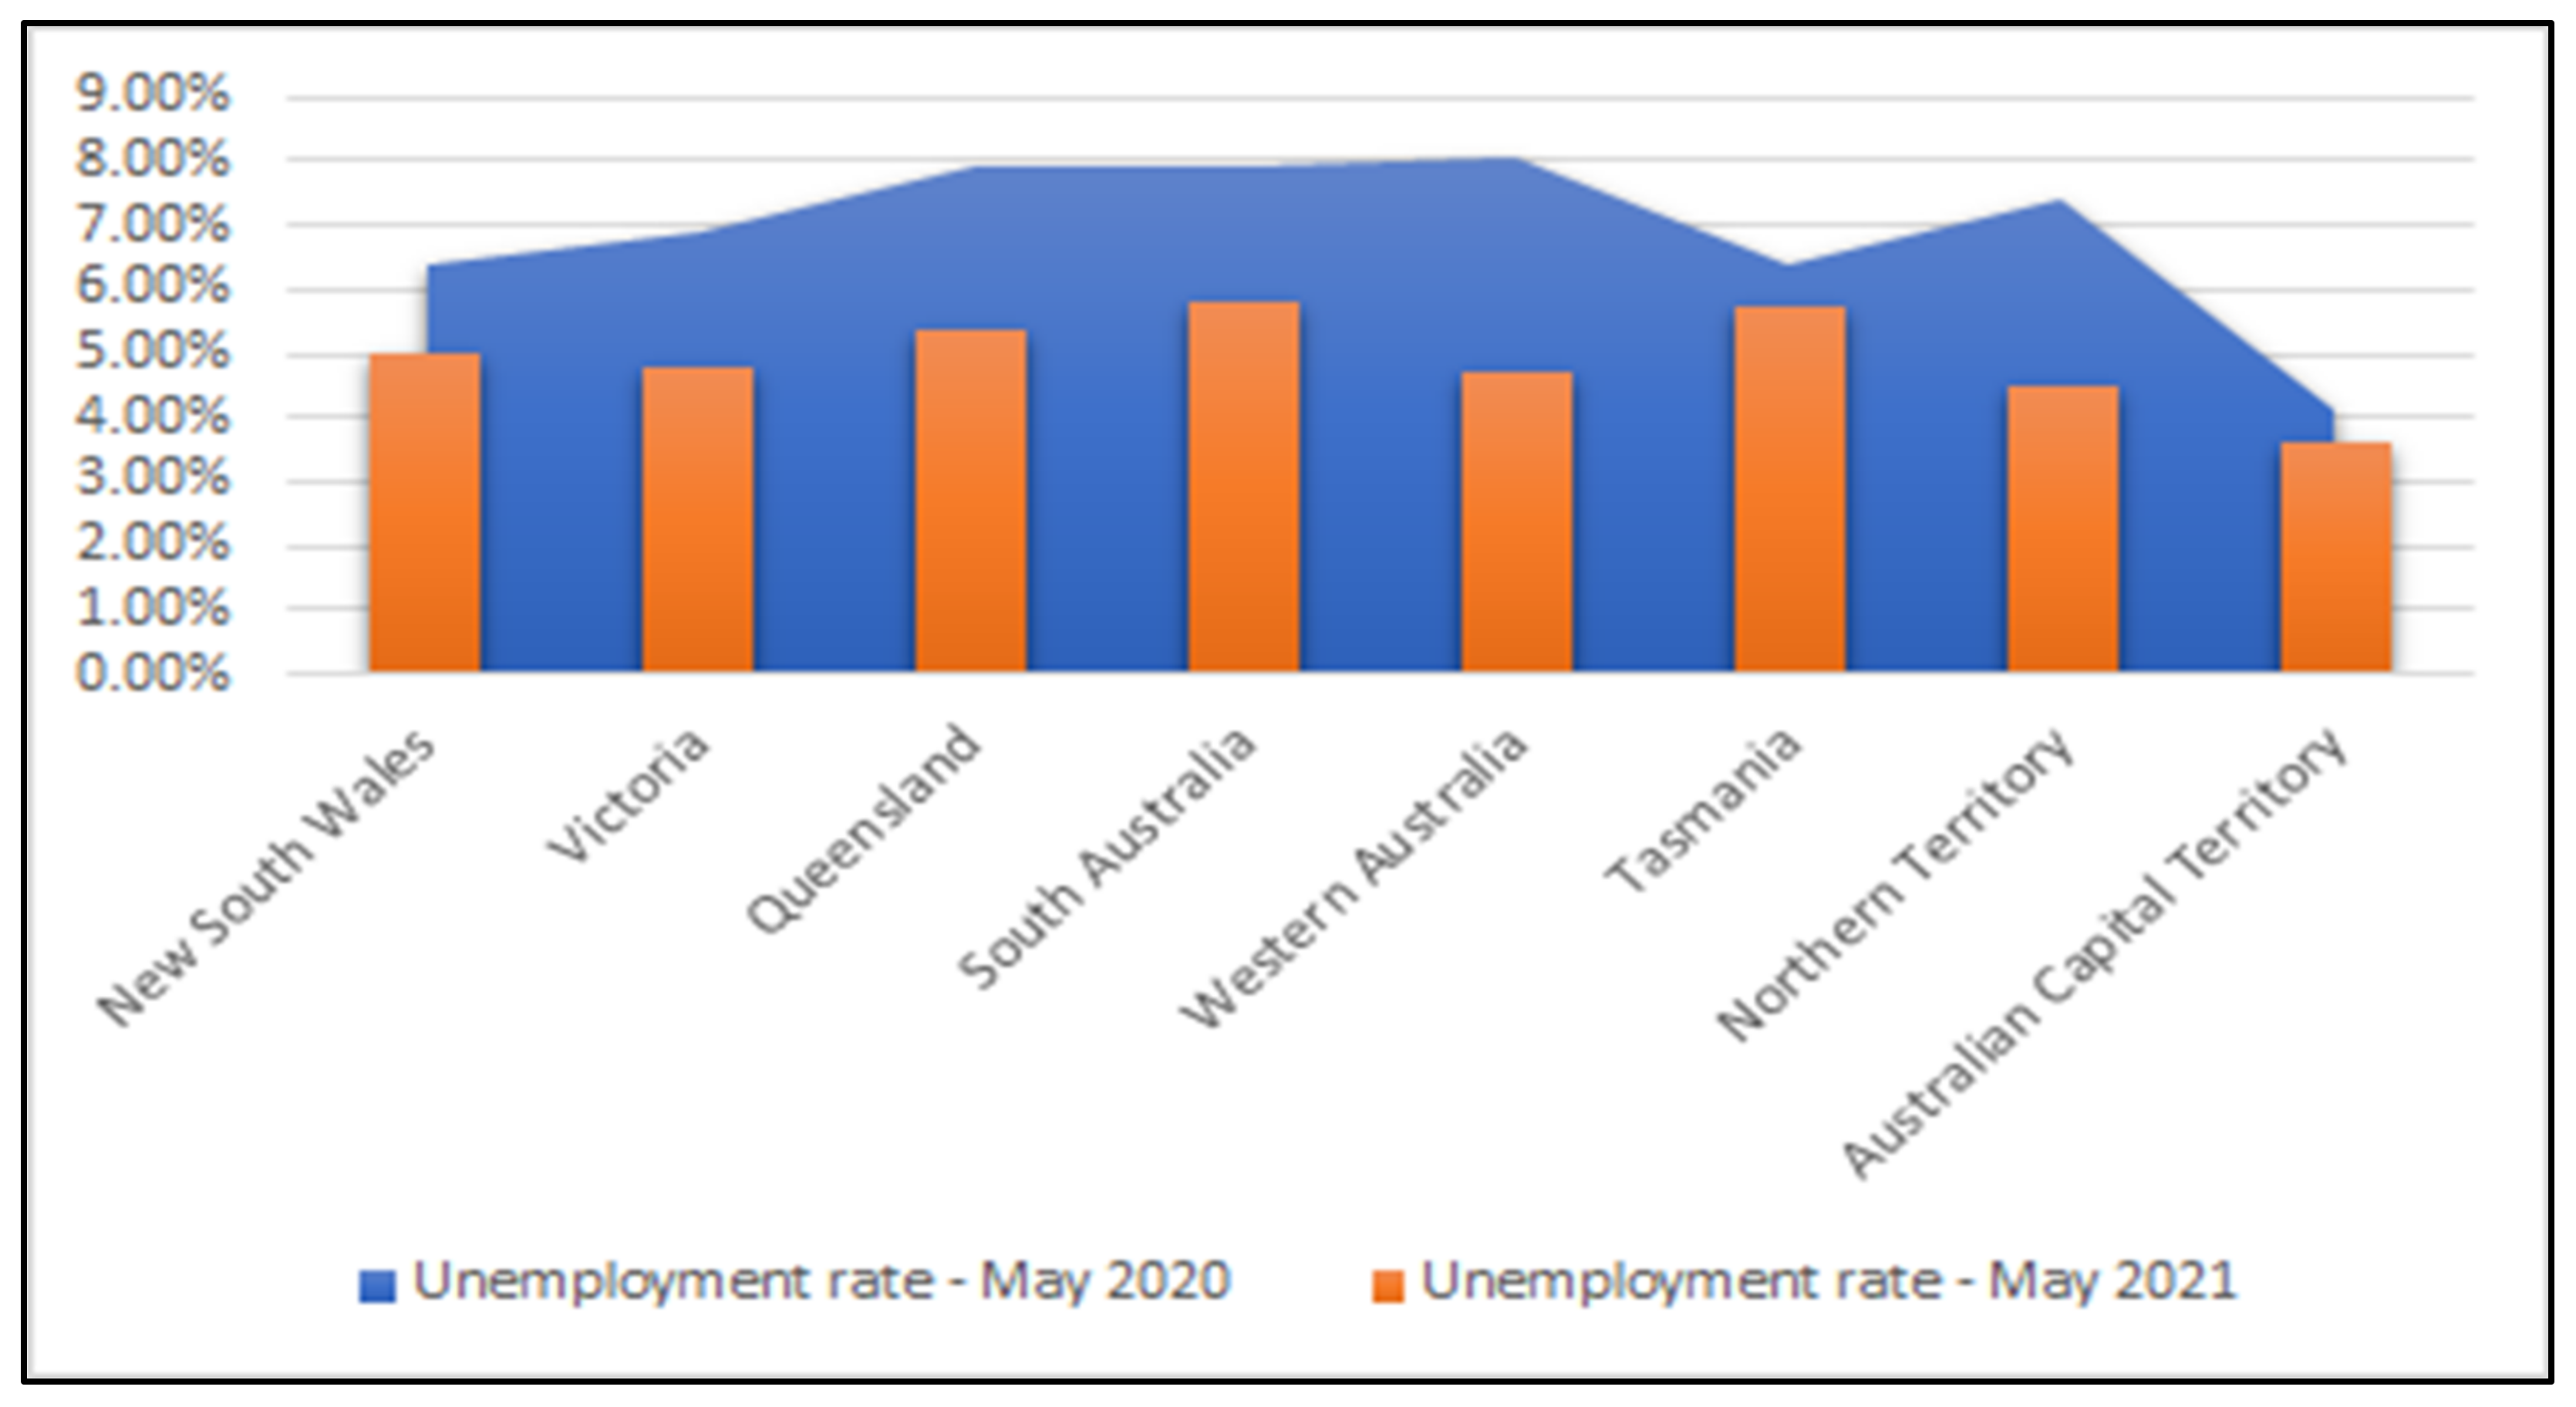
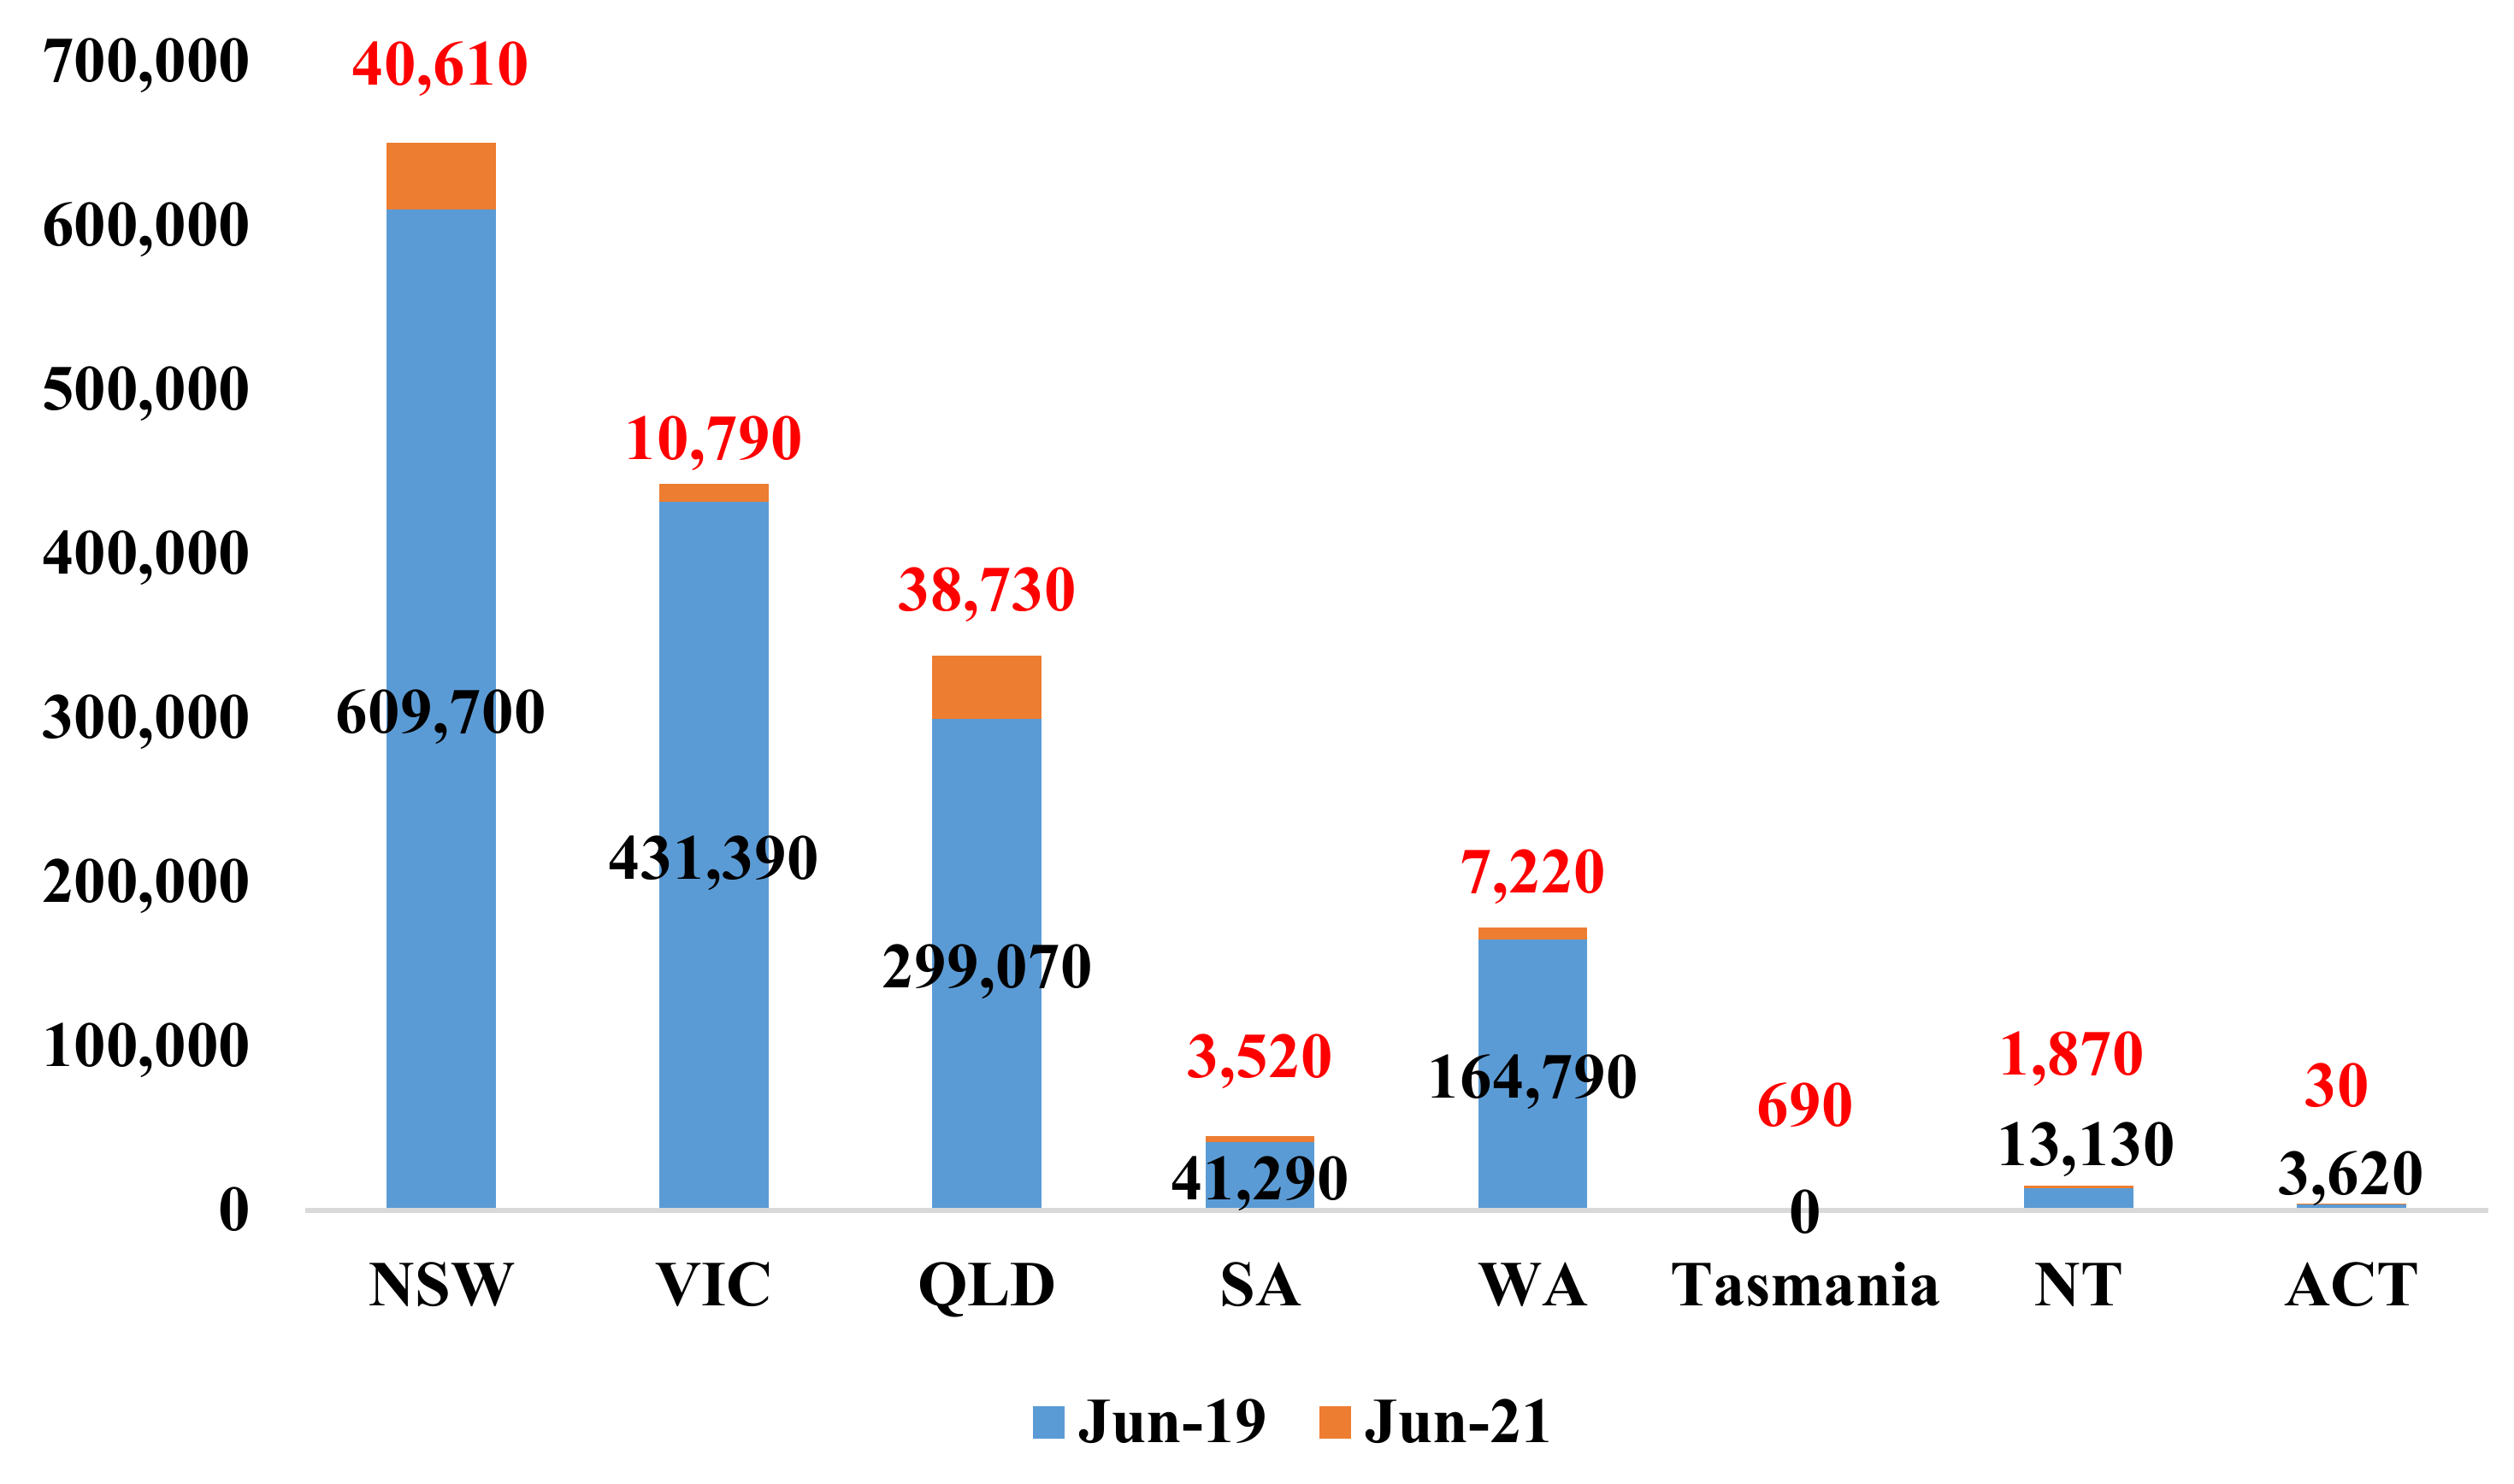
3.4.2. Unemployment Rates in States and Territories

COVID-19 had significant impacts on the Australian labor market, though the statistics have shown improvement over the last few months. Due to the shutdown of the non-essential services and several other restrictions, unemployment rates had slipped to an all-time low of 7.10% in May 2020. However, with the coronavirus cases reducing and businesses resuming trade, the unemployment rates improved to 5.1% by May 2021 [54,55,56].
In terms of the state-wise comparison, NSW employment rates went from 3,586,400 in May 2020 to 4,164,000 in May 2021, which reflects an increase of 16.0% in the overall employment across various sectors of the state. The employment-to-population ratio increased by 4.6% and the participation rate by 4.1% [57]. The overall unemployment rates and underemployment rates were reduced by 1.4% and 6.2%, respectively.
VIC employment rates went from 3,247,100 in May 2020 to 3,453,700 in May 2021, reflecting an increase of 6.4% in the overall employment across various sectors of the state. As a result, the employment-to-population ratio increased by 4.1% and the participation rate by 3.1% [58]. The overall unemployment rates and underemployment rates were reduced by 2.1% and 7.5%, respectively.
QLD employment rates went from 2,390,900 in May 2020 to 2,644,600 in May 2021, reflecting an increase of 10.6% increase in the overall employment across various sectors of the state. The employment-to-population ratio improved by 6.7%, and the participation rate by 4.0% [59]. The overall unemployment rates and underemployment rates were reduced by 2.5% and 4.1%, respectively.
NT employment rates went from 129,900 in May 2020 to 131,300 in May 2021, which reflects an increase of 1.07% increase in the overall employment across various sectors of the state [60]. However, the employment to population ratio dipped by 0.1%, and the participation rate dipped by 2.3%. The overall unemployment rates and underemployment rates were reduced by 2.9% and 5.8%, respectively [61].
WA employment rates went from 1,272,000 in May 2020 to 1,391,800 in May 2021, reflecting an increase of 9.4% in the overall employment across various sectors of the state. The employment-to-population ratio increased by 5.1%, and the participation rate increased by 2.8%. The overall unemployment rates and underemployment rates were reduced by 3.4% and 4.9%, respectively.
SA employment rates went from 806,100 in May 2020 to 871,100 in May 2021, which reflects an 8.06% increase in overall employment across various sectors of the state. The employment-to-population ratio increased by 4.0% and the participation rate by 3.0% [62]. The overall unemployment rates and underemployment rates were reduced by 2.1% and 5.3%, respectively.
ACT employment rates went from 227,500 in May 2020 to 238,200 in May 2021, which reflects a 4.7% increase in the overall employment across various sectors of the state. The employment-to-population ratio increased by 3.4% and the participation rate by 2.4% [63]. The overall unemployment rates and underemployment rates were reduced by 0.5% and 0.1%, respectively.
Tasmania employment rates went from 238,700 in May 2020 to 259,600 in May 2021, reflecting an 8.7% increase in overall employment across various sectors of the state. The employment-to-population ratio increased by 4.2% and the participation rate by 4.1% [64]. The overall unemployment rates and underemployment rates were reduced by 0.7% and 5.6%, respectively.
Figure 10 projects that the unemployment rates have shown improvements over the last year of COVID-19. The responsive measures and contact tracing have assisted in identifying the venues of concern and helped in selective lockdowns to assist with the progressive economy.

4. Discussion

Like other countries, the social and economic activities in Australia have been impacted due to COVID-19. While it increased the unemployment rate, the government wage subsidy initiatives have increased the market income for lower-income households and stabilized the income for middle- to high-income households [65]. Despite the economic shock due to the pandemic, the inequality in the gross market income has decreased. This positive outcome is due to part-time and long-term casual employees who are receiving higher income due to wage subsidy schemes than their usual wages. Hence, an overall increase in the living standard of the people has been observed for most households except for the upper higher-income households. This change has been most evident in the bottom quintile. In addition, a significant increase in disposable income has drastically reduced income inequality [66]. Government support has played a huge role in stabilizing the gross market and disposable income. The poverty rate would have increased in the absence of such measures, and the economic shock would have been difficult to tackle.
In 2019 the Australian education export totaled AUD 40 billion, including 17 billion tuition fees and AUD 23 billion living expenses of the international students. China accounted for one-third of Australian education exports as most Chinese students aspire to get an education from a reputable leading institute in Australia [67,68,69]. Other South Asian countries, including India and Nepal, also contribute heavily to the Australian education sector. With the implementation of a travel ban and restrictions, many students could not travel to Australia [70]. Most of the international students have continued to take up online classes and learn remotely. This has given some relief to the education institutes. However, the associated industries such as transportation, accommodation and tourism, which are dependent on such visitors, have suffered a lot.
Further, the declining enrollments have pushed Australian universities to cut off jobs and fire their employees. This has seriously contributed to the economic miseries of the academic community. Specifically, the Job Keeper and Job Seeker, apparently very good initiatives, are not available to casual academics, leaving them on their own in these tough times. However, the situation is expected to improve due to the recent developments, namely higher vaccination rates in Australia and the plans to open borders by the end of 2021. As such, some international students have been able to travel to Australia through pilot programs and more are expected to fly in soon. However, in the absence of a comprehensive return plan for the international students, the enrollment will further fall and contribute to the already volatile conditions of the Australian education sector [71,72].
Similarly, the tourism industry will continue to suffer until the international travel ban is lifted. Additionally, it will take time for the international tourists to build confidence for traveling again and visiting Australia without spending money on hotel quarantine and other similar expenses [73,74,75]. Similar negative consequences have been observed in European countries, and some of them have been hardest hit by the pandemic, such as Spain, Italy, and the UK. Accordingly, the employment rates have plunged, and many industries have had to close. Some of the countries in the European Union (EU) were already facing an economic crisis before the pandemic due to unemployment, temporary work contracts, income inequality, and higher poverty compared to the other countries in the EU [45]. The COVID-19 crisis has fueled the crisis further. For Australia, to avoid ending in a similar situation, a more dexterous, considerate, and smart approach is needed.
Overall, it can be stated that social, economic, and policy implications have been prominent throughout this pandemic in Australia. The tourism and education industry has been hit hardest by COVID-19. However, strong measures and strategies can help revive these industries. Furthermore, tourism is a source of seasonal income for lower-income groups and has faced adverse impacts due to its closure. Therefore, it is essential that the government prioritize this sector, step up the vaccination process, and take such measures that allow the industries to restart their activities and tackle the negative outcome of the pandemic.

5. Conclusions

This study investigated the unemployment rates across the different states of Australia during the pandemic. The international mobility patterns were studied, and the unemployment rates were investigated in three key sectors: education, tourism, and the labor market. The employment rates during the COVID-19 across each state were studied in detail and the variations were tracked from March 2020 to May 2021. The study used data from the WHO publications, Australian government websites, local news agencies, and other authentic online resources like articles, websites, and papers.
For the effects of COVID-19 on international mobility, it was observed that 1.8 million visitors arrived in Australia in 2020, which was 80% lesser than previous years. These were mainly locals returning from New Zealand and China. In terms of state-wise travelers’ reduction, NSW has seen a reduction of 93.3%, followed by VIC (95.5%), QLD (87.1%), WA (95.6%), SA (91.5%), (85.8%), and ACT (99.1%).
In terms of the effects of COVID-19 on the Australian tertiary education, this sector is one of the worst hit. The technology network group of universities have reduced enrollment by more than 8000 students in a single year. Similarly, the innovative research group saw a decline of 14% in enrollments, whereas the Group of Eight universities that are renowned for their excellent increase in enrollment barely maintained their enrollment numbers from previous years. All these are linked to the borders restrictions and bans on international travel, where the arrival of international students declined by 99.4% since 2019. This resulted in revenue losses of more than 2 billion dollars in the education sector where, in 2020 alone, Australian universities lost 6% of their revenue. This resulted in more than 17,000 job losses in this sector alone, seriously increasing the unemployment rate.
In terms of the effects of COVID-19 on tourism and its associated employment, this is another badly impacted sector. Due to Australian border closures and local lockdowns, both international and domestic tourism have suffered. An estimated loss of $30 billion is observed in the international tourism sector, whereas $40 billion losses have occurred due to a lack of domestic tourism. In addition, the associated employment has decreased from 15 to 18 percent per quarter from March 2020 to March 2021. However, it is expected that the surge in home deliveries and categorizing this sector as essential will help reduce the impacts of COVID-19.
In terms of the effects of COVID-19 on the labor market and associated unemployment, the statistics have shown improvement over the last few months. Unemployment has improved from an all-time low of 7.1% to 5.1% between May 2020 to May 2021. NSW saw an increase of 16.0% in employment followed by QLD (10.6%), WA (9.4%), Tasmania (8.7%), SA (8.06%), VIC (6.4%), ACT (4.7%), and NT (1.07%). The initiatives such as Job Keepers and Job Seekers have improved the conditions of the otherwise unemployed workforce. Overall, despite the detrimental impacts of COVID-19 on the Australian economy, the employment situation has improved over the last year, which is a positive sign. The conditions will improve once the borders are opened and more travelers and international students are welcomed.
The current study investigated the effects of COVID-19 on the Australian economy. It is limited to tourism, education, and the labor market only. In the future, this can be expanded upon to include other areas such as health, import-export, supply chain, and others. Further, the study is limited to the currently available data on COVID-19 in Australia that is expected to be more holistic in coming years. Thus, if repeated after some time when more data are available, the study will yield more detailed results. Similar studies can be conducted in other developed and developing countries and global comparisons can be made to learn from global best practices.

Author Contributions

Conceptualization, H.S.M., S.I.K., F.U.; methodology H.S.M., S.I.K., F.U.; software, H.S.M.; validation, S.I.K.; formal analysis, H.S.M., the investigation, H.S.M., S.I.K., F.U. resources, A.Z.K.; data curation, M.A.P.M.; writing—original draft preparation, H.S.M., and S.I.K. writing—review and editing, F.U.; funding acquisition, M.A.P.M. All authors have read and agreed to the published version of the manuscript.

Funding

This research received no external funding.

Institutional Review Board Statement

Not applicable.

Informed Consent Statement

Not applicable.

Data Availability Statement

Not applicable.

Conflicts of Interest

The authors declare no conflict of interest.

References

  1. Bialek, S.; Boundy, E.; Bowen, V.; Chow, N.; Cohn, A.; Dowling, N.; Ellington, S.; Gierke, R.; Hall, A.; MacNeil, J.; et al. Severe outcomes among patients with coronavirus disease 2019 (COVID-19)—United States, 12 February–16 March, 2020. Morb. Mortal. Wkly. Rep. 2020, 69, 343. [Google Scholar]
  2. Qadir, Z.; Munir, A.; Ashfaq, T.; Munawar, H.S.; Khan, M.A.; Le, K. A prototype of an energy-efficient MAGLEV train: A step towards cleaner train transport. Clean. Eng. Technol. 2021, 4, 100217. [Google Scholar] [CrossRef]
  3. COVID-19 National Incident Room Surveillance Team. COVID-19, Australia: Epidemiology Report 16 (Reporting week to 23: 59 AEST 17 May 2020). Commun. Dis. Intell. 2020, 44, 1–31. [Google Scholar]
  4. Sourdin, T.; Meredith, J.; Li, B. Digital Technology and Justice; Routledge: London, UK, 2020. [Google Scholar] [CrossRef]
  5. Munawar, H.S.; Ullah, F.; Khan, S.I.; Qadir, Z.; Qayyum, S. UAV assisted Spatiotemporal Analysis and Management of Bushfires: A Case Study of the 2020 Victorian Bushfires. Fire 2021, 4, 40. [Google Scholar] [CrossRef]
  6. ABC. Coronavirus Pandemic Means Some Australian Workers Are Busier Than Ever. 2020. Available online: https://www.abc.net.au/news/2020-04-12/coronavirus-work-for-truck-driverssupermarket-workers-cleaners/12142448 (accessed on 6 June 2021).
  7. ABC. Coronavirus Disease (COVID-19) Advice for the Public: Myth Busters. 2020. Available online: https://phabc.org/coronavirus-disease-covid-19-advice-for-the-public-myth-busters-from-who/ (accessed on 9 June 2021).
  8. Munawar, H.S.; Hammad, A.W.A.; Haddad, A.; Soares, C.A.P.; Waller, S.T. Image-Based Crack Detection Methods: A Review. Infrastructures 2021, 6, 115. [Google Scholar] [CrossRef]
  9. ABC. Academics in Talks to Take Pay Cuts to Save Thousands of University Jobs during Coronavirus Pandemic. 2020. Available online: https://www.abc.net.au/news/2020-05-13/universitiesand-union-negotiate-pay-cuts-save-jobs-coronavirus/12239448 (accessed on 16 July 2021).
  10. Olsen, S.J.; Azziz-Baumgartner, E.; Budd, A.P.; Brammer, L.; Sullivan, S.; Pineda, R.F.; Fry, A.M. Decreased influenza activity during the COVID-19 pandemic—United States, Australia, Chile, and South Africa, 2020. Am. J. Transplant. 2020, 20, 3681–3685. [Google Scholar] [CrossRef]
  11. Khan, S.I.; Qadir, Z.; Munawar, H.S.; Nayak, S.R.; Budati, A.K.; Verma, K.D.; Prakash, D. UAVs path planning architecture for effective medical emergency response in future networks. Phys. Commun. 2021, 47, 101337. [Google Scholar] [CrossRef]
  12. Rockett, R.J.; Arnott, A.; Lam, C.; Sadsad, R.; Timms, V.; Gray, K.A.; Sintchenko, V. Revealing COVID-19 transmission in Australia by SARS-CoV-2 genome sequencing and agent-based modelling. Nat. Med. 2020, 26, 1398–1404. [Google Scholar] [CrossRef]
  13. First Confirmed Case of a Novel Coronavirus in Australia. 2020. Available online: https://www.health.gov.au/ministers/the-hon-greg-hunt-mp/media/first-confirmed-case-of-novel-coronavirus-in-australia (accessed on 15 May 2021).
  14. Munawar, H.S.; Aggarwal, R.; Qadir, Z.; Khan, S.I.; Kouzani, A.Z.; Mahmud, M.A.P. A Gabor Filter-Based Protocol for Automated Image-Based Building Detection. Buildings 2021, 11, 302. [Google Scholar] [CrossRef]
  15. Fisk, M.; Livingstone, A.; Pit, S.W. Telehealth in the context of COVID-19: Changing perspectives in Australia, the United Kingdom, and the United States. J. Med. Internet Res. 2020, 22, e19264. [Google Scholar] [CrossRef]
  16. Seemann, T.; Lane, C.R.; Sherry, N.L.; Duchene, S.; da Silva, A.G.; Caly, L.; Howden, B.P. Tracking the COVID-19 pandemic in Australia using genomics. Nat. Commun. 2020, 11, 4376. [Google Scholar] [CrossRef] [PubMed]
  17. Akram, J.; Javed, A.; Khan, S.; Akram, A.; Munawar, H.S.; Ahmad, W. Swarm intelligence based localization in wireless sensor networks. In Proceedings of the 36th Annual ACM Symposium on Applied Computing, New York, NY, USA, 22–26 March 2021; pp. 1906–1914. [Google Scholar] [CrossRef]
  18. Qadir, Z.; Khan, S.I.; Khalaji, E.; Munawar, H.S.; Al-Turjman, F.; Mahmud, M.A.P.; Kouzani, A.Z.; Le, K. Predicting the energy output of hybrid PV–wind renewable energy system using feature selection technique for smart grids. Energy Rep. 2021, in press. [Google Scholar] [CrossRef]
  19. Australian Bureau of Statistics. Australian Demographic Statistics. 2019. Available online: https://www.abs.gov.au/ausstats/ (accessed on 12 May 2021).
  20. Australian Government. Coronavirus (COVID-19) Current Situation and Case Numbers. 2020. Available online: https://www.health.gov.au/news/health-alerts/novel-coronavirus-2019-ncov-health-alert/coronavirus-covid-19-current-situation-and-case-numbers (accessed on 18 May 2021).
  21. Zachreson, C.; Fair, K.M.; Cliff, O.M.; Harding, N.; Piraveenan, M.; Prokopenko, M. Urbanization affects peak timing, prevalence, and bimodality of influenza pandemics in Australia: Results of a census-calibrated model. Sci. Adv. 2018, 4. [Google Scholar] [CrossRef] [Green Version]
  22. Chen, A.T.; Altschuler, K.; Zhan, S.H.; Chan, Y.A.; Deverman, B.E. COVID-19 CG enables SARS-CoV-2 mutation and lineage tracking by locations and dates of interest. Elife 2021, 10, e63409. [Google Scholar] [CrossRef]
  23. Munawar, H.S.; Khan, S.I.; Qadir, Z.; Kiani, Y.S.; Kouzani, A.Z.; Mahmud, M.A.P. Insights into the Mobility Pattern of Australians during COVID-19. Sustainability 2021, 13, 9611. [Google Scholar] [CrossRef]
  24. Eden, J.S. Genome sequencing and its use in public health responses to COVID-19. Microbiol. Aust. 2021, 42, 44–46. [Google Scholar] [CrossRef]
  25. O’Toole, Á.; Hill, V.; Pybus, O.G.; Watts, A.; Bogoch, I.I.; Khan, K.; Tegally, H.; Giandhari, J.; Pillay, S.; Tumedi, K.A.; et al. Tracking the international spread of SARS-CoV-2 lineages B. 1.1. 7 and B. 1.351/501Y-V2. Wellcome Open Res. 2021, 6, 121. [Google Scholar]
  26. Munawar, H.S.; Hammad, A.W.A.; Waller, S.T.; Thaheem, M.J.; Shrestha, A. An Integrated Approach for Post-Disaster Flood Management Via the Use of Cutting-Edge Technologies and UAVs: A Review. Sustainability 2021, 13, 7925. [Google Scholar] [CrossRef]
  27. Variants of Concern. Available online: https://www.cdgn.org.au/variants-of-concern (accessed on 19 July 2021).
  28. Surveillance for SARS-CoV-2 Variants of Concern in the Australian Context. Available online: https://www.mja.com.au/journal/2021/surveillance-sars-cov-2-variants-concern-australian-context (accessed on 23 July 2021).
  29. Munawar, H.S.; Ullah, F.; Qayyum, S.; Khan, S.I.; Mojtahedi, M. UAVs in Disaster Management: Application of Integrated Aerial Imagery and Convolutional Neural Network for Flood Detection. Sustainability 2021, 13, 7547. [Google Scholar] [CrossRef]
  30. COVID-19 in Australia. Available online: https://www.covid19data.com.au/ (accessed on 19 June 2021).
  31. COVID-19 Cases by Age Group and Sex. 2021. Available online: https://www.health.gov.au/resources/covid-19-cases-by-age-group-and-sex (accessed on 14 May 2021).
  32. Liaquat, M.U.; Munawar, H.S.; Rahman, A.; Qadir, Z.; Kouzani, A.Z.; Mahmud, M.A.P. Localization of Sound Sources: A Systematic Review. Energies 2021, 14, 3910. [Google Scholar] [CrossRef]
  33. 1.1 Impact of COVID-19 on the Australian Labour Market: Employment and Unemployment. Available online: https://www.nationalskillscommission.gov.au/11-impact-covid-19-australian-labour-market (accessed on 4 May 2021).
  34. Fana, M.; Pérez, S.T.; Fernández-Macías, E. The employment impact of the Covid-19 crisis: From short term effects to long terms prospects. J. Ind. Bus. Econ. 2020, 47, 391–410. [Google Scholar] [CrossRef]
  35. Munawar, H.S.; Khan, S.I.; Anum, N.; Qadir, Z.; Kouzani, A.Z.; Mahmud, M.A.P. Post-Flood Risk Management and Resilience Building Practices: A Case Study. Appl. Sci. 2021, 11, 4823. [Google Scholar] [CrossRef]
  36. Angelucci, M.; Angrisani, M.; Bennett, D.M.; Kapteyn, A.; Schaner, S.G. Remote Work and the Heterogeneous Impact of COVID-19 on Employment and Health (No. w27749); National Bureau of Economic Research, Inc.: Cambridge, MA, USA, 2020. [Google Scholar]
  37. Shaukat, M.A.; Shaukat, H.R.; Qadir, Z.; Munawar, H.S.; Kouzani, A.Z.; Mahmud, M.A.P. Cluster Analysis and Model Comparison Using Smart Meter Data. Sensors 2021, 21, 3157. [Google Scholar] [CrossRef] [PubMed]
  38. Clay, L.A.; Rogus, S. Impact of Employment, Essential Work, and Risk Factors on Food Access during the COVID-19 Pandemic in New York State. Int. J. Environ. Res. Public Health 2021, 18, 1451. [Google Scholar] [CrossRef] [PubMed]
  39. Munawar, H.S.; Khan, S.I.; Qadir, Z.; Kouzani, A.Z.; Mahmud, M.A.P. Insight into the Impact of COVID-19 on Australian Transportation Sector: An Economic and Community-Based Perspective. Sustainability 2021, 13, 1276. [Google Scholar] [CrossRef]
  40. Qadir, Z.; Ullah, F.; Munawar, H.S.; Al-Turjman, F. Addressing disasters in smart cities through UAVs path planning and 5G communications: A systematic review. Comput. Commun. 2021, 168, 114–135. [Google Scholar] [CrossRef]
  41. Reichelt, M.; Makovi, K.; Sargsyan, A. The impact of COVID-19 on gender inequality in the labour market and gender-role attitudes. Eur. Soc. 2021, 23, S228–S245. [Google Scholar] [CrossRef]
  42. Al-Fadly, A. Impact of COVID-19 on SMEs and employment. Entrep. Sustain. Issues 2020, 8, 629. [Google Scholar] [CrossRef]
  43. Munawar, H.S. Flood Disaster Management. In Machine Vision Inspection Systems; Wiley: New York, NY, USA, 2020; pp. 115–146. [Google Scholar] [CrossRef]
  44. Beck, M.J.; Hensher, D.A. Insights into the impact of COVID-19 on household travel and activities in Australia–The early days under restrictions. Transp. Policy 2020, 96, 76–93. [Google Scholar] [CrossRef]
  45. Li, J.; Vidyattama, Y.; La, H.A.; Miranti, R.; Sologon, D.M. The impact of COVID-19 and policy responses on Australian income distribution and poverty. arXiv 2020, arXiv:2009.04037. [Google Scholar]
  46. Munawar, H.S. Image and Video Processing for Defect Detection in Key Infrastructure. In Machine Vision Inspection Systems; Wiley: New York, NY, USA, 2020; pp. 159–177. [Google Scholar] [CrossRef]
  47. Callis, Z.; Seivwright, A.; Orr, C.; Flatau, P. The Impact of COVID-19 on Families in Hardship In Western Australia; The 100 Families WA Project: Perth, Australia, 2020. [Google Scholar]
  48. Mitchell, W.F.; Watts, M.J. Investing in a Job Guarantee for Australia. In Centre of Full Employment and Equity, Report; Centre of Full Employment and Equity: Callaghan, NSW, Australia, 2020; Volume 2, pp. 1–18. [Google Scholar]
  49. Munawar, H.S.; Qayyum, S.; Ullah, F.; Sepasgozar, S. Big Data and Its Applications in Smart Real Estate and the Disaster Management Life Cycle: A Systematic Analysis. Big Data Cogn. Comput. 2020, 4, 4. [Google Scholar] [CrossRef] [Green Version]
  50. Flew, T.; Kirkwood, K. The impact of COVID-19 on cultural tourism: Art, culture and communication in four regional sites of Queensland, Australia. Media Int. Aust. 2021, 178, 16–20. [Google Scholar] [CrossRef]
  51. Folinas, S.; Metaxas, T. Tourism: The Great Patient of Coronavirus COVID-2019. Int. J. Adv. Res. 2020, 4, 365–375. [Google Scholar] [CrossRef]
  52. Munawar, H.S. Reconfigurable Origami Antennas: A Review of the Existing Technology and its Future Prospects. Int. J. Wirel. Microw. Technol. 2020, 10, 34–38. [Google Scholar] [CrossRef]
  53. Ghosh, S. Asymmetric impact of COVID-19 induced uncertainty on inbound Chinese tourists in Australia: Insights from nonlinear ARDL model. Quant. Financ. Econ. 2020, 4, 343–364. [Google Scholar] [CrossRef]
  54. Munawar, H.S.; Awan, A.A.; Maqsood, A.; Khalid, U. Reinventing Radiology in Modern Era. IJ Wirel. Microw. Technol. 2020, 4, 34–38. [Google Scholar]
  55. Carlsson-Szlezak, P.; Reeves, M.; Swartz, P. What Coronavirus Could Mean for the Global Economy; Harvard Business Publishing: Boston, MA, USA, 2020. [Google Scholar]
  56. Munawar, H.S. Applications of Leaky-wave Antennas: A Review. Int. J. Wirel. Microw. Technol. 2020, 10, 56–62. [Google Scholar] [CrossRef]
  57. Ullah, F.; Sepasgozar, S.M.; Thaheem, M.J.; Al-Turjman, F. Barriers to the digitalisation and innovation of Australian Smart Real Estate: A managerial perspective on the technology non-adoption. Environ. Technol. Innov. 2021, 22, 101527. [Google Scholar] [CrossRef]
  58. Vandenberg, B.; Livingston, M.; O’Brien, K. When the pubs closed: Beer consumption before and after the first and second waves of COVID-19 in Australia. Addiction 2021, 116, 1709–1715. [Google Scholar] [CrossRef]
  59. Munawar, H.S. An Overview of Reconfigurable Antennas for Wireless Body Area Networks and Possible Future Prospects. Int. J. Wirel. Microw. Technol. 2020, 10, 1–8. [Google Scholar] [CrossRef] [Green Version]
  60. Pamidimukkala, A.; Kermanshachi, S. Impact of COVID-19 on field and office workforce in construction industry. Proj. Leadersh. Soc. 2021, 2, 100018. [Google Scholar] [CrossRef]
  61. Munawar, H.S.; Khalid, U.; Maqsood, A. Modern Day Detection of Mines; Using the Vehicle Based Detection Robot; International Association for Convergence Science & Technology (IACST): Busan, Korea, 2017. [Google Scholar]
  62. Craig, L.; Churchill, B. Working and caring at home: Gender differences in the effects of COVID-19 on paid and unpaid labor in Australia. Fem. Econ. 2021, 27, 310–326. [Google Scholar] [CrossRef]
  63. Munawar, H.S.; Zhang, J.; Li, H.; Mo, D.; Chang, L. Mining Multispectral Aerial Images for Automatic Detection of Strategic Bridge Locations for Disaster Relief Missions. In Lecture Notes in Computer Science (Including Subseries Lecture Notes in Artificial Intelligence and Lecture Notes in Bioinformatics); Springer: Cham, Switzerland, 2019; pp. 189–200. [Google Scholar] [CrossRef]
  64. Boehme, T.; Aitken, J.; Turner, N.; Handfield, R. COVID-19 response of an additive manufacturing cluster in Australia. Supply Chain. Manag. Int. J. 2021, 26, 767–784. [Google Scholar] [CrossRef]
  65. Churchill, B. COVID-19 and the immediate impact on young people and employment in Australia: A gendered analysis. Gend. Work Organ. 2021, 28, 783–794. [Google Scholar] [CrossRef] [PubMed]
  66. Munawar, H.S.; Hammad, A.; Ullah, F. After the flood: A novel application of image processing and machine learning for post-flood disaster management. In Proceedings of the 2nd International Conference on Sustainable Development In Civil Engineering (ICSDC 2019), Jamshoro, Pakistan, 28–29 November 2019; pp. 5–7. [Google Scholar]
  67. Ullah, F.; Al-Turjman, F. A conceptual framework for blockchain smart contract adoption to manage real estate deals in smart cities. Neural Comput. Appl. 2021, 1–22. [Google Scholar]
  68. Ullah, F.; Sepasgozar, S.M.; Shirowzhan, S.; Davis, S. Modelling users’ perception of the online real estate platforms in a digitally disruptive environment: An integrated KANO-SISQual approach. Telemat. Inform. 2021, 63, 101660. [Google Scholar] [CrossRef]
  69. Munawar, H.S.; Maqsood, A. Isotropic surround suppression based linear target detection using hough transform. Int. J. Adv. Appl. Sci. 2017, 4, 37–42. [Google Scholar] [CrossRef]
  70. ‘Regional Universities Are Going to Struggle’: The Unis Worst Hit by COVID-19. Available online: https://www.smh.com.au/national/nsw/regional-universities-are-going-to-struggle-the-unis-worst-hit-by-covid-19-20210622-p583be.html (accessed on 9 July 2021).
  71. Universities Lost 6% of Their Revenue in 2020—And the Next 2 Years Are Looking Worse. Available online: https://theconversation.com/universities-lost-6-of-their-revenue-in-2020-and-the-next-2-years-are-looking-worse-166749 (accessed on 13 July 2021).
  72. Munawar, H.S.; Awan, A.A.; Khalid, U.; Munawar, S.; Maqsood, A. Revolutionizing Telemedicine by Instilling H.265. Int. J. Image Graph. Signal Process. 2017, 9, 20–27. [Google Scholar] [CrossRef] [Green Version]
  73. COVID-19 Recovery for the Tourism Sector. Available online: https://www2.deloitte.com/au/en/pages/economics/articles/covid-19-recovery-tourism-sector.html (accessed on 6 July 2021).
  74. Tourism Investment Monitor 2019–20: Australian Tourism Investment and COVID-19 Impacts. Available online: https://www.tra.gov.au/data-and-research/reports/tourism-investment-monitor-2019-20/australian-tourism-investment-and-covid-19-impacts (accessed on 9 July 2021).
  75. Munawar, H.S.; Khalid, U.; Jilani, R.; Maqsood, A. Version Management by Time Based Approach in Modern Era. Int. J. Educ. Manag. Eng. 2017, 7, 13–20. [Google Scholar] [CrossRef] [Green Version]
Figure 1. Methodology for Article Retrieval and Review Process.
Sustainability 13 11300 g001
Figure 2. Keywords found in the literature related to COVID-19 effects on the unemployment rate.
Sustainability 13 11300 g002
Figure 3. Numbers of international arrivals in different Australian states.
Sustainability 13 11300 g003
Figure 4. Enrollments in Australian universities since COVID-19 started.
Sustainability 13 11300 g004
Figure 5. Financial losses in education and other sectors.
Sustainability 13 11300 g005
Figure 6. Australian Universities Revenue since 2015.
Sustainability 13 11300 g006
Figure 7. Expected or confirmed numbers of job losses in Australian Universities. The figure was developed by the authors.
Sustainability 13 11300 g007
Figure 8. Hotel occupancy rates (in percentage)—July 2019 to June 2020.
Sustainability 13 11300 g008
Figure 9. Impact on hospitality and tourism industry during COVID.
Sustainability 13 11300 g009
Figure 10. Impact and recovery of unemployment rates in different states of Australia from May 2020 to May 2021.
Sustainability 13 11300 g010
Table 1. Top source country citizens arrival to Australia during 2020–2021.
Country of CitizenshipMay-19May-20Apr-21May-21
New Zealand152,810232020,30052,280
UK52,27054011902440
China123,57062015401920
India62,220131017901400
USA56,8403008301080
Philippines23,010250570870
Vanuatu10600510600
South Africa5110170350460
Japan31,050110320420
Malaysia51,73080300410
Table 2. Change in the number of jobs in Australia during COVID-19.
Dec-19 to Mar-20Mar-20 to Jun-20Jun-20 to Sep-20Sep-20 to Dec-20Dec-20 to Mar-21Mar-20 to Mar-21
Tourism−47,000
(−6.3%)
−91,700
(−13.1%)
24,700
(4.1%)
28,400
(4.5%)
3100
(0.5%)
−35,500
(−5.1%)
Whole economy−118,700
(−0.8%)
−862,800
(−6.0%)
210,100
(1.5%)
449,300
(3.3%)
−7500
(−0.1%)
−210,900
(−1.5%)
Table 3. Overnight trips by source market in Australian states.
StateTravel Type20192020
NSWIntrastate60−30
Interstate30−62
International10−7
VICIntrastate64−51
Interstate27−74
International10−75
QLDIntrastate62−22
Interstate28−75
International10−79
SAIntrastate60−16
Interstate35−73
International6−73
WAIntrastate76−12
Interstate15−76
International8−73
ACTIntrastate--
Interstate92−55
International8−75
NationalIntrastate63−29
Interstate30−66
International7−76
Publisher’s Note: MDPI stays neutral with regard to jurisdictional claims in published maps and institutional affiliations.

