Article

Multi-Scenario Simulation of Urban Growth under Integrated Urban Spatial Planning: A Case Study of Wuhan, China

1
School of Resource and Environmental Science, Wuhan University, Wuhan 430079, China
2
Qingdao Surveying & Mapping Institute, Qingdao 266000, China
*
Author to whom correspondence should be addressed.
Sustainability 2021, 13(20), 11279; https://doi.org/10.3390/su132011279
Submission received: 18 September 2021 / Revised: 11 October 2021 / Accepted: 12 October 2021 / Published: 13 October 2021
(This article belongs to the Special Issue Urban Planning and Sustainable Land Use)

Abstract

:
Although many publications have noted the impact of urban planning on urban development and land-use change, the incorporation of planning constraints into urban growth simulation has not been adequately addressed so far. This study aims to develop a planning-constrained cellular automata (CA) model by combining cell-based trade-off between urban growth and natural conservation with a zoning-based planning implementation mechanism. By adjusting the preference parameters of different planning zones, multiple planning-constrained scenarios can be generated. Taking the Wuhan Urban Development Area (WUDA), China as a case study, the planning-constrained CA model was applied to simulate current and future urban scenarios. The results show a higher simulation accuracy compared to the model without planning constraints. With the weakening of planning constraints, urban growth tends to occupy more ecological and agricultural land with high conservation priority. With the increase in preference on urban growth or natural conservation, the future urban land pattern will become more fragmented. Furthermore, new urban land beyond the planned urban development area can be captured in future urban scenarios, which will provide certain early warning. The simulation of the current urban spatial pattern should help planners and decisionmakers to evaluate the past implementation of urban planning, and scenarios simulation can provide effective support for future urban planning by evaluating the consequences.

1. Introduction

Urbanization is one of the greatest social transformations in human history [1,2]. In order to meet the unprecedented demand of urban population growth and economic development, urban land presents a violent and disorderly expansion trend [3]. Nowadays, the average growth rate of urban land is twice that of their populations [4]. Although urban land is only a small part of the Earth’s surface, its rapid growth has been identified as a major contributor to natural habitat loss, cropland reduction and ecosystem services degradation [5,6,7], posing great threat to the world’s sustainable development [8,9]. Thus, it raises continuous competition for land between urban development and natural conservation [10], which is especially relevant to China due to its limited land resources and huge population living in urban areas [11]. Currently, Chinese local governments have put forward a series of administrative regulations and spatial planning policies, including major function-oriented zoning, land-use planning, urban spatial regulations, ecological redlines and so on. These policies and regulations have played a vital role in restraining the decrease in ecological and agricultural land and guiding urban compact development [12,13,14], although illegal urban encroachment on protected areas frequently occurs [15,16]. Therefore, simulation of future urban expansion and encroachment incorporating different planning policies is of great significance for authorities and planners to make effective decisions in optimizing urban spatial patterns and achieving urban sustainable development.
Since the first application of Tobler in 1979 [17], cellular automata (CA) and its derived models have been widely used in urban growth modeling and land-use simulation due to their simple and flexible structure, among which the transition rule is a core part [7,18,19]. The process of urban growth and urban land change is influenced by multiple drives across different scales, including socio-economic factors, geophysical factors, proximity factors, environmental factors and planning factors [18,20,21,22]. In order to link these multiple driving factors with the transition rules of the CA model, scholars have explored various methods including multivariate statistics methods, intelligent algorithms, agent-based models and multi-criterion decision analysis [3,23,24,25]. Although the combination of these models and cellular automata has made many important achievements in urban land-use simulation, the applicability of these models in reproducing urban patterns resembling reality and solving actual planning problems in complex urban systems is still challenging [18,20].
In recent decades, many researchers have increasingly recognized the important influence of urban planning and other policies on urban growth and land-use change [15,26,27]. Thus, scenario simulation of urban land use incorporated with planning information and conventional urban CA models has attracted considerable attention from scholars and planners. Through the constraint layers or exclusion layers in urban CA models, policy information including supportive planning and restrictive planning can be implemented to simulate and predict urban growth by either a Boolean-constraint mechanism or a gradual mechanism [27,28,29]. With regard to Boolean-constraint, for example, He et al. consider the primary farmland protection area as mandatory constraints to prohibit urban encroachment [12]; Zhou et al. set water areas, historical protection areas, restricted development areas, prohibited development areas and large-scale parks in planning as constraint layers to simulate urban spatial patterns under the planning intervention scenario [3]. While the binary planning constraint design is too absolute and simplistic [30], some studies have attempted to simultaneously consider the gradual constraints into their urban CA models. Onsteda et al. incorporated zoning policy information into the CA-based SLEUTH model by assigning gradual values to the different zoning categories, which obviously improves model performance with respect to a model without zoning [26]. Liang et al. proposed a random seeding mechanism to simulate the potential effect of planning development zones [20]. Wang et al. integrated a series of urban spatial planning to construct synthetical planning constraint layers in urban CA model by a multi-criteria evaluation (MCE)-based weighting method [31]. These studies have achieved remarkable results and provide good references for building a realistic planning constraint mechanism.
However, in previous studies, the planning constraints in a planning zone are often set to a unified value, ignoring the spatial heterogeneity of different cells in the same planning zone [32,33]. In the real complex urban systems, the planning influence on the cells in a specific planning zone is often not homogeneous. The application of planning constraints in urban CA models should not be restricted to considering the zone effects; it should take the natural environment and socio-economic factors based on the land-use cell into account [34,35,36]. For example, in the planned ecological protection area, cells with high ecological importance tend to be retained, while cells with low ecological importance located in urban fringe areas are more likely to be occupied. Currently, the influence effects of planning policies based on the trade-off between urban growth and conservation has received little attention. In addition, existing studies often set the restriction or impact coefficients of different planning zones based on subjective or historical experience [27,37]. Once these parameters are determined, they will not change with time in the simulation process, which is not conducive to the dynamic urban growth scenario simulation.
This study aims to explore the potential influence of integrated urban spatial planning on urban growth and realize the planning-constrained urban multi-scenario simulation. Thus, we propose an innovative synthetical planning-constrained strategy to quantitatively characterize the influence of integrated urban spatial planning on realistic urban growth process by combining the cell-based trade-off between urban growth and conservation with a zoning-based planning implementation mechanism. By incorporating the strategy into urban CA models, a planning-constrained CA model is developed. Taking Wuhan city, one of the mega cities in China, as a case study, we applied the planning-constrained CA model to assess the impact of urban planning implementation on the urban growth process and simulate the urban spatial patterns under different future scenarios. The results should help planners and authorities evaluate the guiding effects of urban planning implementation.
The rest of the sections of this article are organized as follows. Section 2 describes the study area and the datasets used in this study. Section 3 introduces in detail the methodology of the planning-constrained CA model. Section 4 presents the multi-scenario simulation results under planning constraints. The discussion and conclusion are given in Section 5 and Section 6.

2. Study Area and Datasets
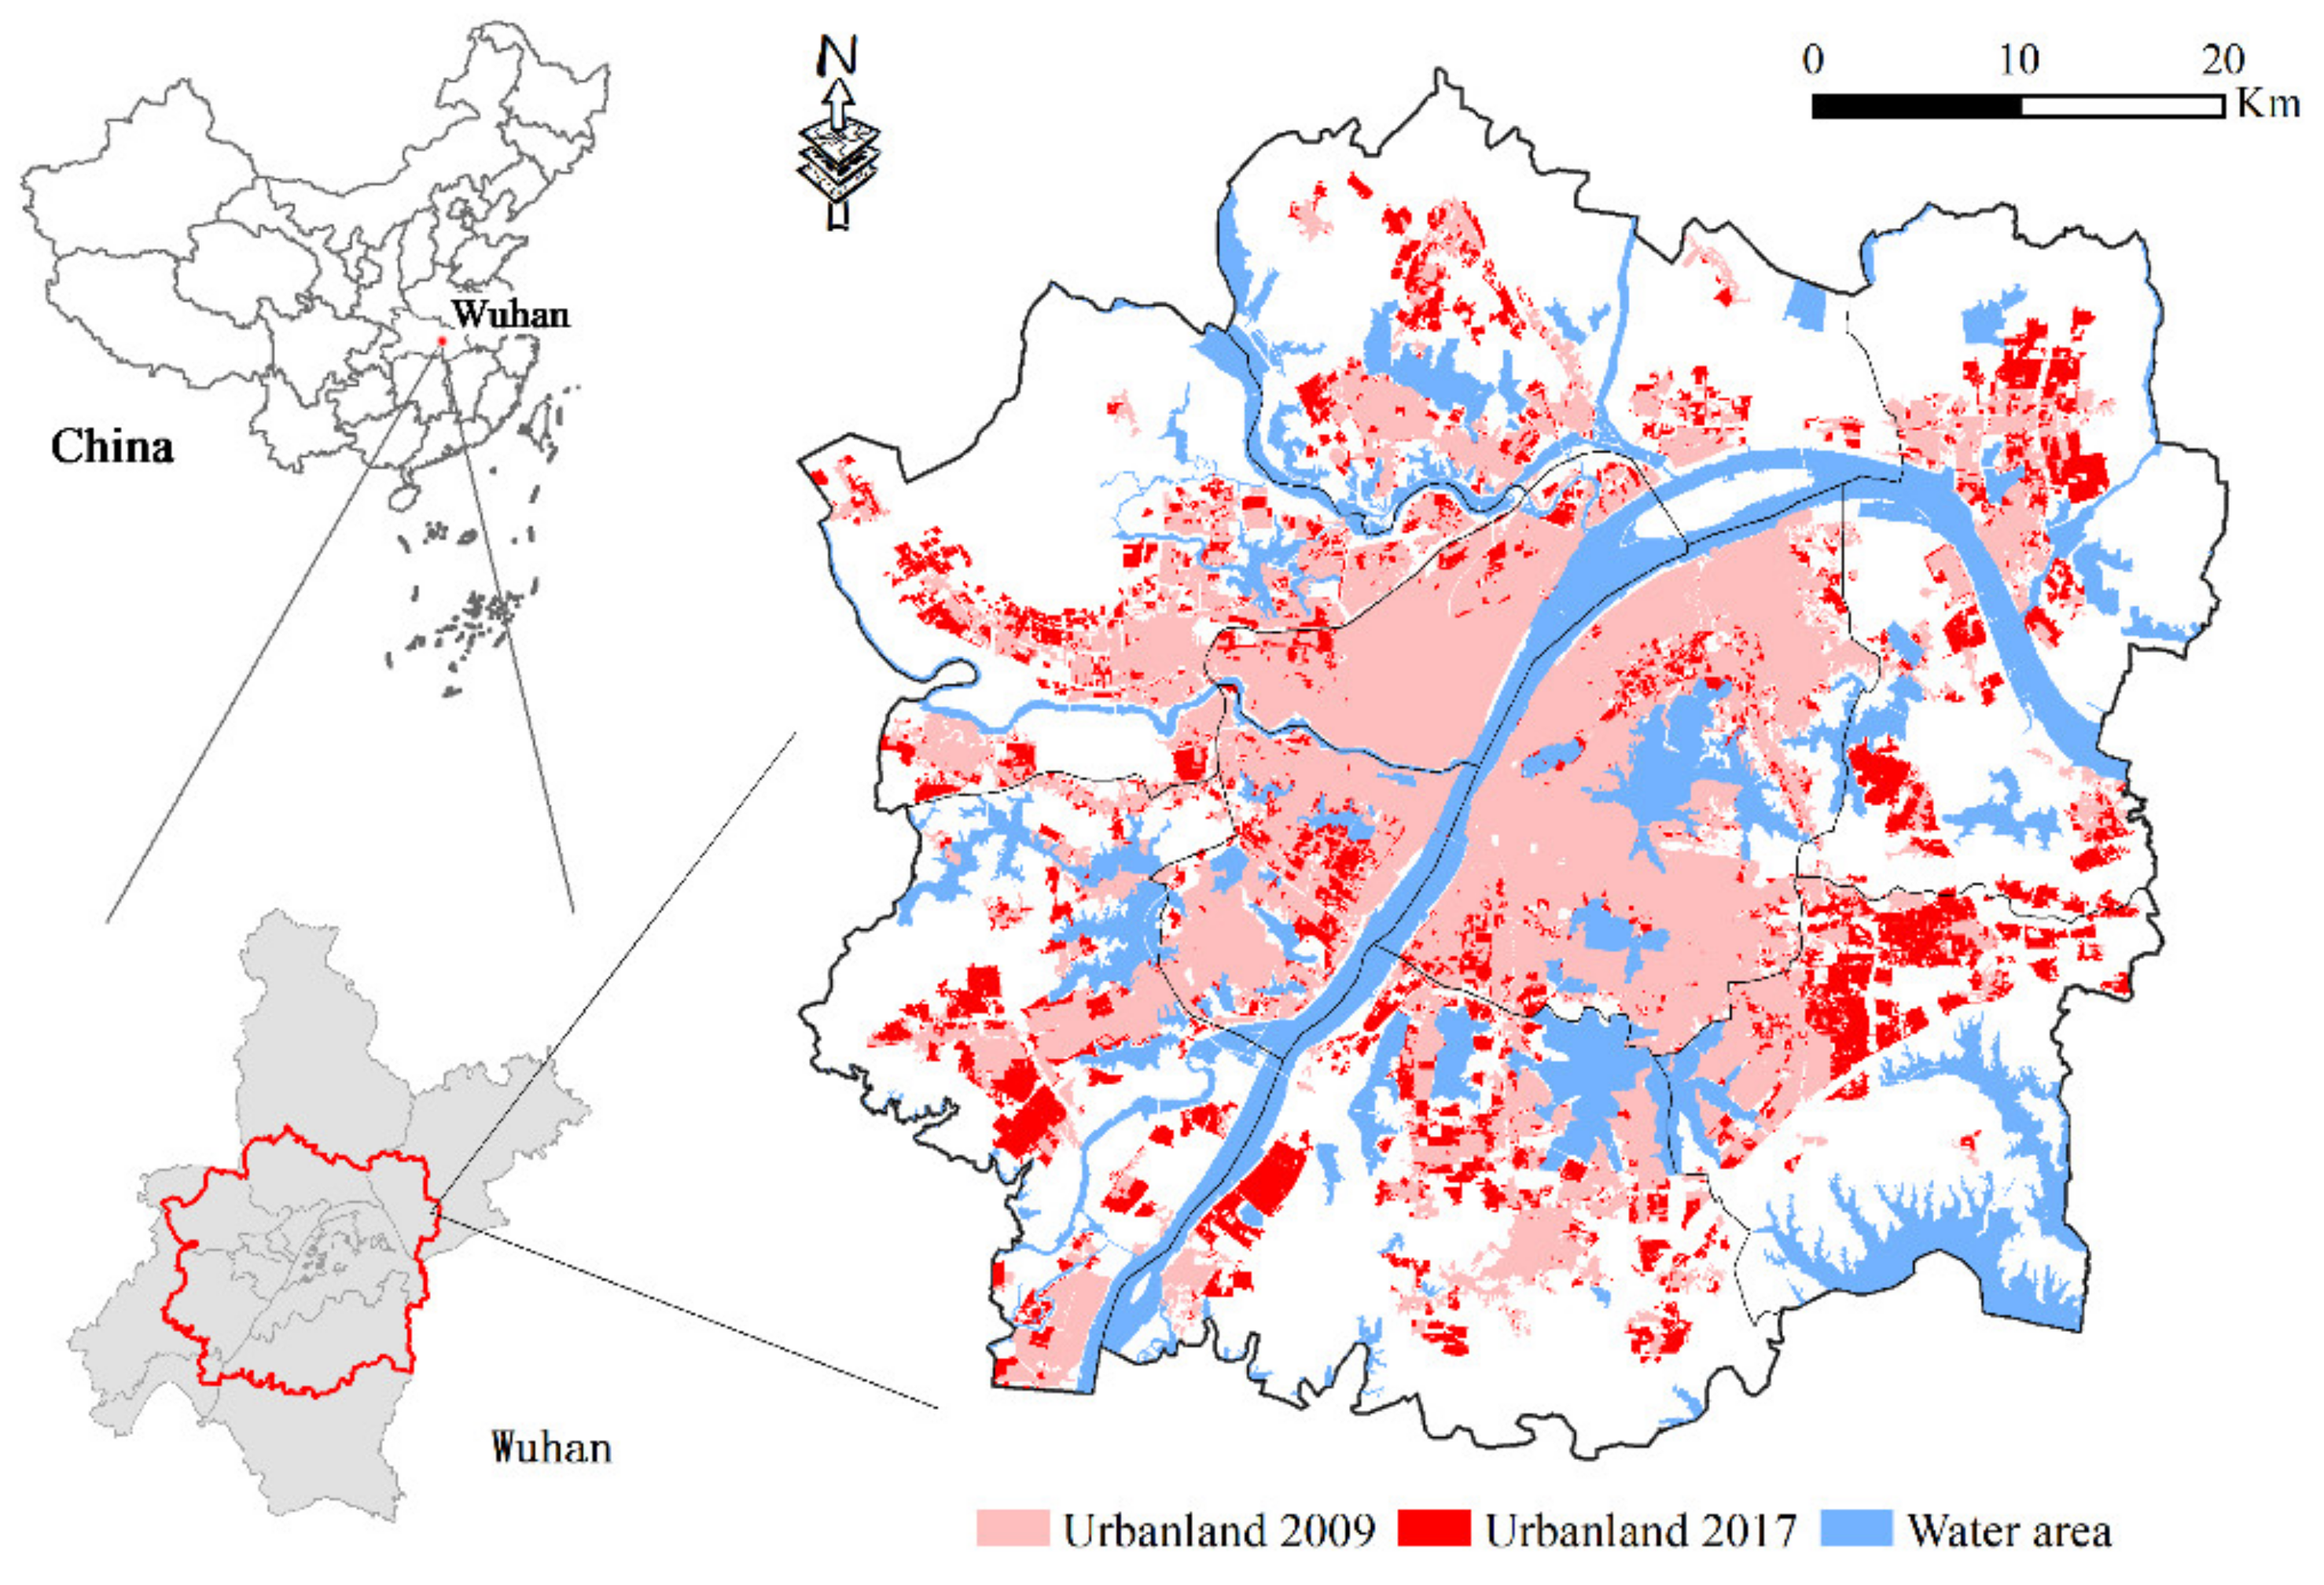
2.1. Study Area

Wuhan, the capital city of Hubei Province, is the key city in Central China and one of the core cities in the Yangtze River economic belt. As shown in Figure 1, Wuhan administers seven central districts (Hanyang, Hongshan, Jiangan, Jianghan, Qiaokou, Qingshan, Wuchang) and six suburban districts (Caidian, Dongxihu, Hannan, Huangpi, Jiangxia, Xinzhou), covering a total area of 8569.15 km2. In past decades, Wuhan has experienced an unprecedented urbanization process. By the end of 2020, the total population of Wuhan was 12.32 million, of whom 10.39 million were urban residents. Rapid urbanization has led to a large amount of urban land expansion and encroachment on other lands, resulting in strong contradictions between urban growth and natural conservation [38,39]. From 2002 to 2019, the area of urban construction land increased by 98.7%, from 1338.75 km2 to 2646.26 km2. Therefore, Wuhan has formulated a series of spatial planning policies, which have greatly affected the process of urban growth [11,13,28]. In this study, we will specifically target the Wuhan Urban Development Area (WUDA), which was designated as the centralized area of urban development in the 2010–2020 Wuhan Master Plan. The WUDA spans a total area of 3261 km2, consists of all central districts and parts of the six suburban districts.

2.2. Datasets

The datasets used in this study consist of land-use, socioeconomic, natural eco-environment and planning datasets, including the following:
  • Land-use maps of 2009 and 2017 in vector format were obtained from Wuhan Natural Resources and Planning Information Center. The original land-use maps were categorized into 38 classes and, then, reclassified into nine land-use types: urban land, rural settlements, cropland, orchard land, forests, grassland, waterbodies, traffic land and other land.
  • Socioeconomic datasets were collected from various sources. The demographic and GDP data of 2015 were downloaded from the Resource and Environment Data Cloud Platform website http://www.data.ac.cn (accessed on 20 October 2018). POI data were obtained from Baidu Map website http://map.baidu.com (accessed on 20 December 2017). The vector road network and park data were derived from Wuhan Geographical Conditions Monitoring Datasets, which are produced by Wuhan Geomatics Institute in 2017. Other socioeconomic datasets, including land value, urban centers, commercial centers and subway stations, were downloaded in picture format from the Wuhan Natural Resources and Planning Bureau website http://zrzyhgh.wuhan.gov.cn/ (accessed on 6 January 2019) and, then, digitized in ArcGIS 10.2 software. These socioeconomic datasets were mainly used to process the driving factors of the urban CA model.
  • Natural eco-environment datasets include topographical, meteorological, soil, vegetation and farmland quality data. The topographical information was derived from a digital elevation model (DEM) in raster format with a resolution of 30 m × 30 m, supplied by Geospatial Data Cloud website http://www.giscloud.cn/ (accessed on 30 January 2017). Meteorological data for 2015 obtained from China Meteorological Data Sharing Service System website http://data.cma.cn/site/index.html (accessed on 9 March 2016) include monthly air temperature, monthly rainfall and monthly radiation. Soil data, such as soil type, soil particle proportion and soil organic matter, were extracted from the Harmonized World Soil Database version 1.2 website http://westdc.westgis.ac.cn (accessed on 30 August 2019). Vegetation data, incorporating normalized difference vegetation index (NDVI) and leaf area index (LEI), were obtained from MODIS products. Farmland quality data were derived from the grade evaluation result of cultivated land quality in 2015, produced by Wuhan Natural Resources and Planning Information Center. These natural eco-environment datasets were mainly utilized to evaluate the cell-based conservation priority.
  • Planning datasets, consisting of the Wuhan City Master Plan (2010–2020), Wuhan Land Use Master Plan (2006–2020) and its adjustment and improvement result (2017), Wuhan Basic Farmland Protection Plan (2006–2020), Wuhan Comprehensive Transportation Plan (2009–2020) and Wuhan Ecological Protection Plan (2012), were acquired from Wuhan Natural Resources and Planning Bureau website http://zrzyhgh.wuhan.gov.cn/ (accessed on 30 January 2019). These planning datasets were integrated to produce urban growth scenarios based on dynamic planning constraints.
All these datasets were preprocessed and rasterized with a spatial resolution of 30 m in ArcGIS 10.2 software as input of the urban CA model.

3. Methodology

A planning-constrained CA model is developed in this study to simulate urban growth and encroachment under different scenarios. Figure 2 shows the model procedure and flowchart. Firstly, cell-based conservation priority and urban growth potential can be calculated by multi criteria analysis and a logistic regression model, respectively. In terms of conservation priority, it consists of ecological land conservation priority and cultivated land conservation priority. The ecological priority is mainly based on relevant indicators such as ecosystem functional importance and ecological vulnerability, while the cultivated land conservation priority mainly depends on the agricultural production suitability of cultivated land. The urban development potential is determined by natural, socioeconomic and location-based factors. Secondly, we defined the synthetical planning-constrained mechanism by integrating the cell-based tradeoff between urban growth potential and conservation priority with zoning-based planning preference. By adjusting the preference parameters of different planning zones, multiple planning-constrained urban growth scenarios can be generated. Thirdly, we combine the synthetical planning-constrained mechanism with urban development potential, neighborhood effect and random disturbance to construct the transition rule of urban CA model. Markov chain is used to predict the amount of urban land-use change. Kappa and FoM coefficients are used to calibrate and verify the model. Finally, future urban growth pattern under different scenarios are simulated. These phases are presented separately as following.

3.1. Cell-Based Conservation Priority and Urban Growth Potential

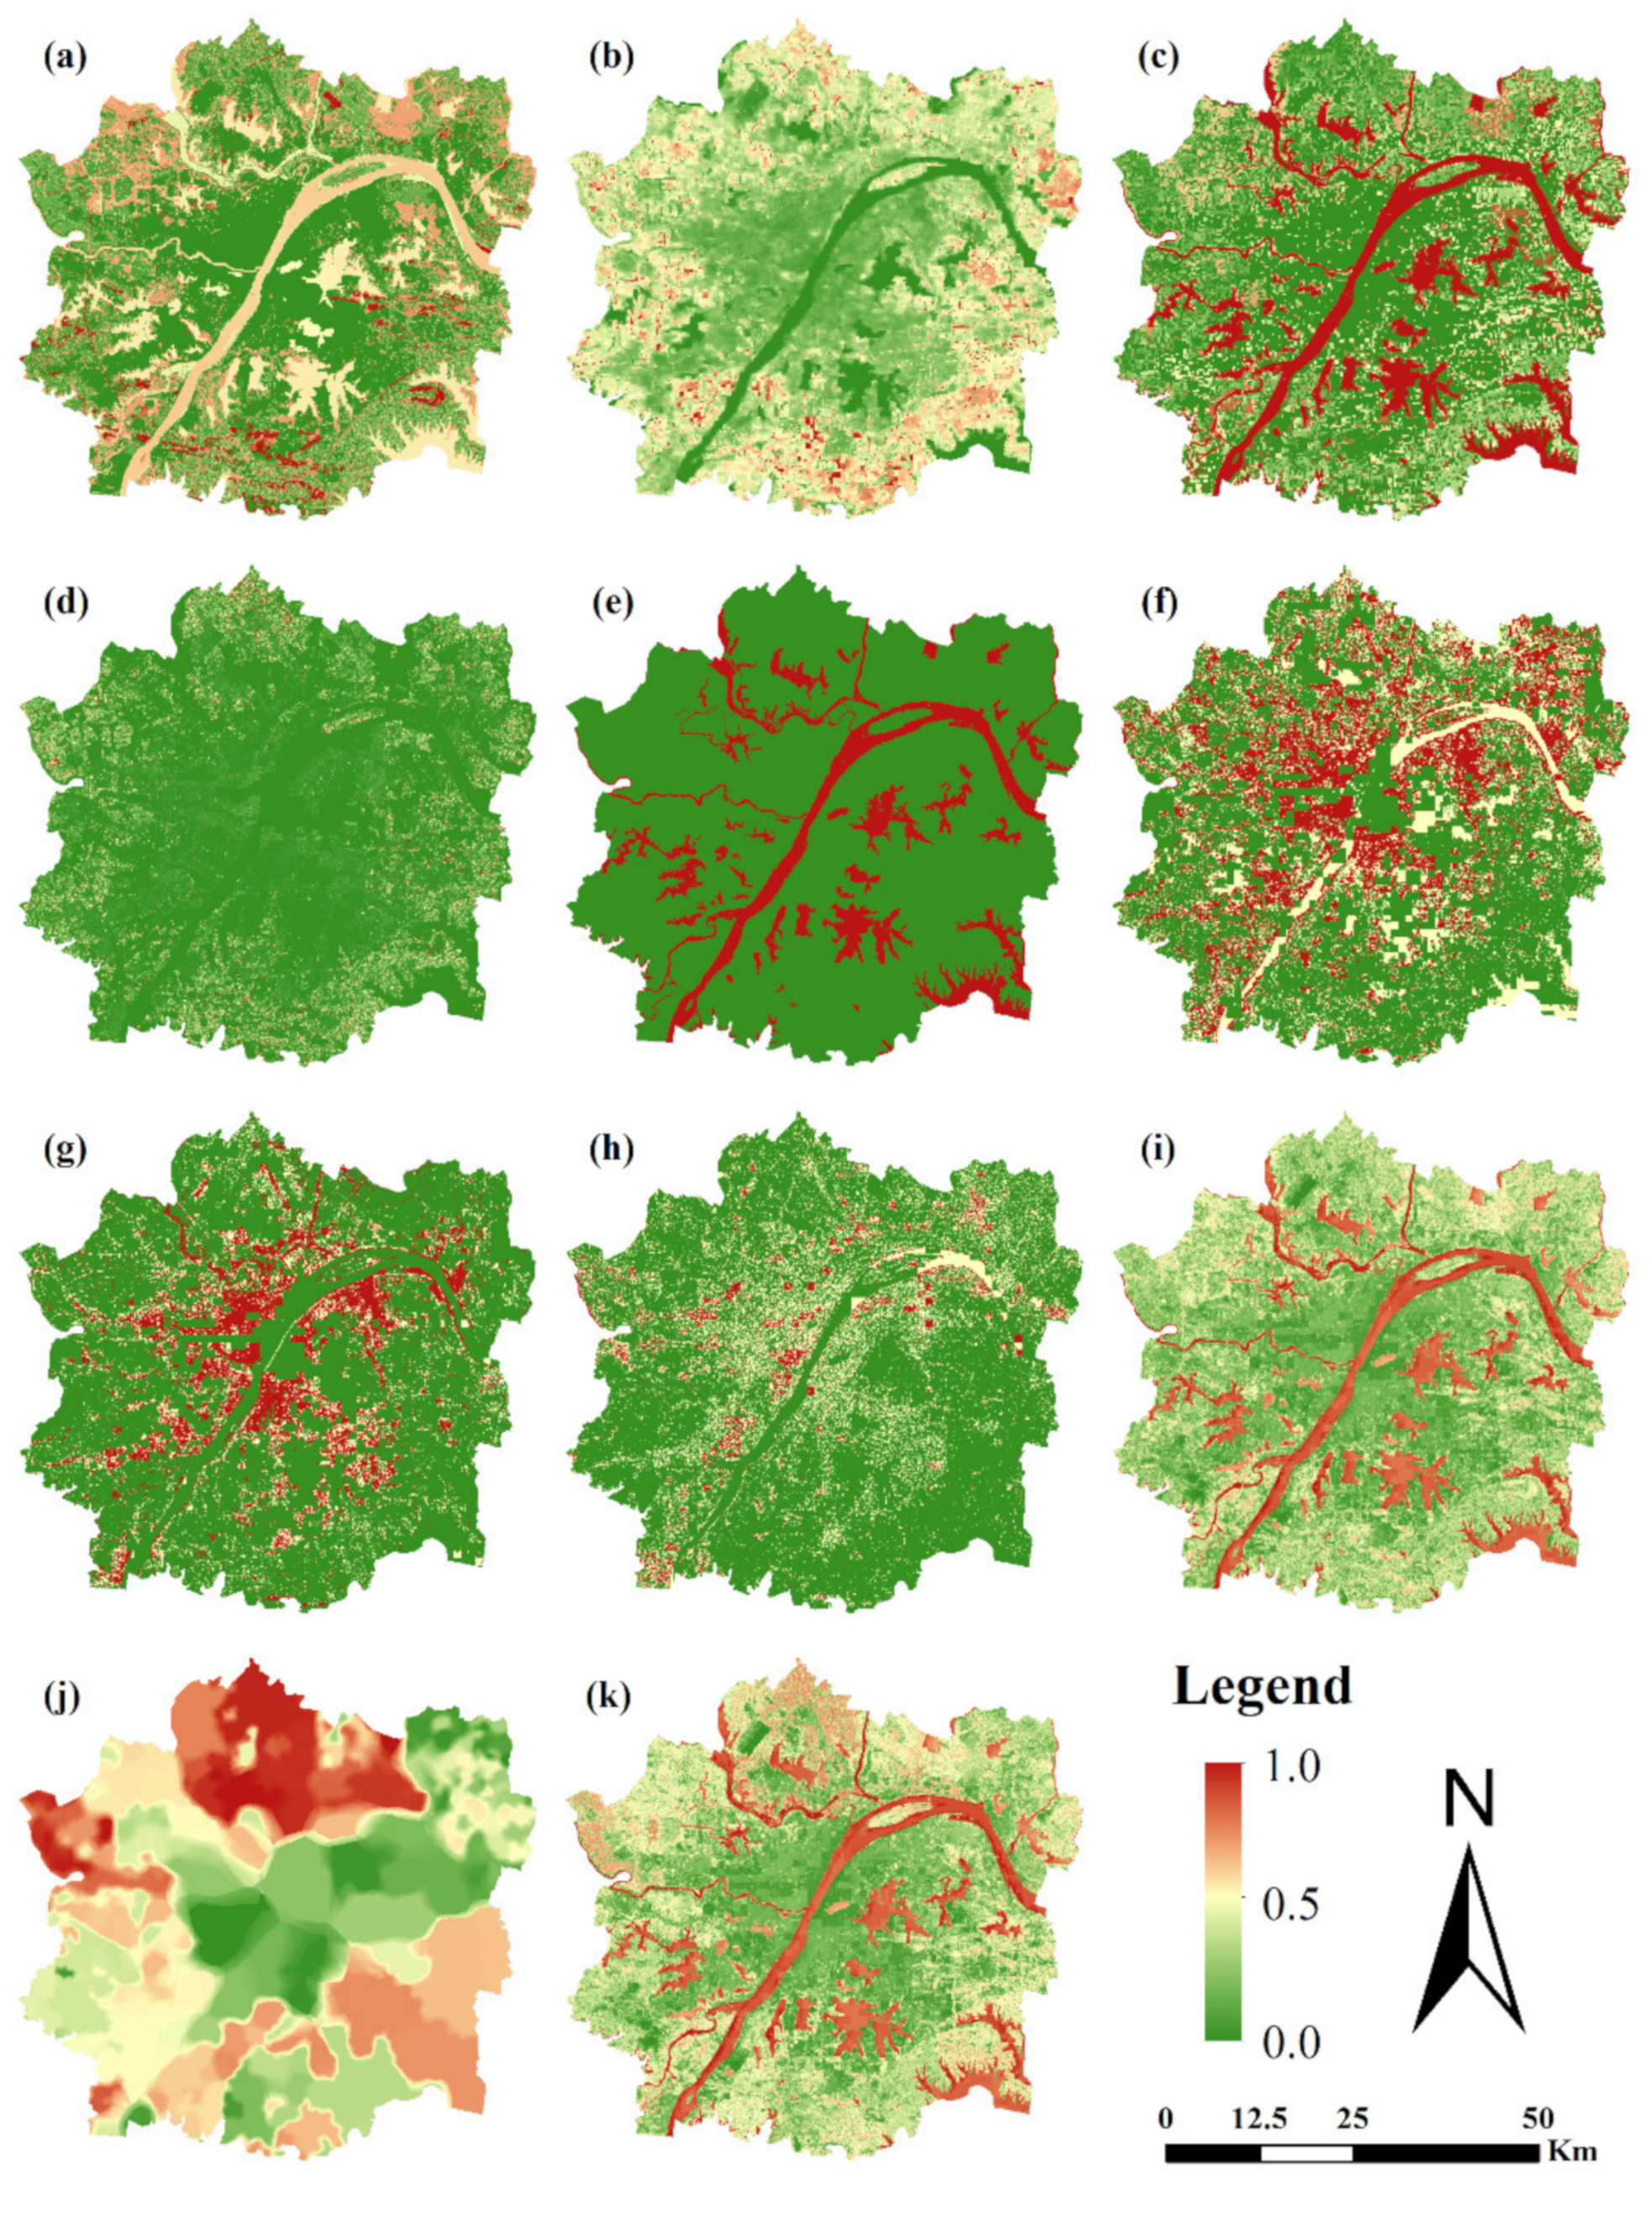
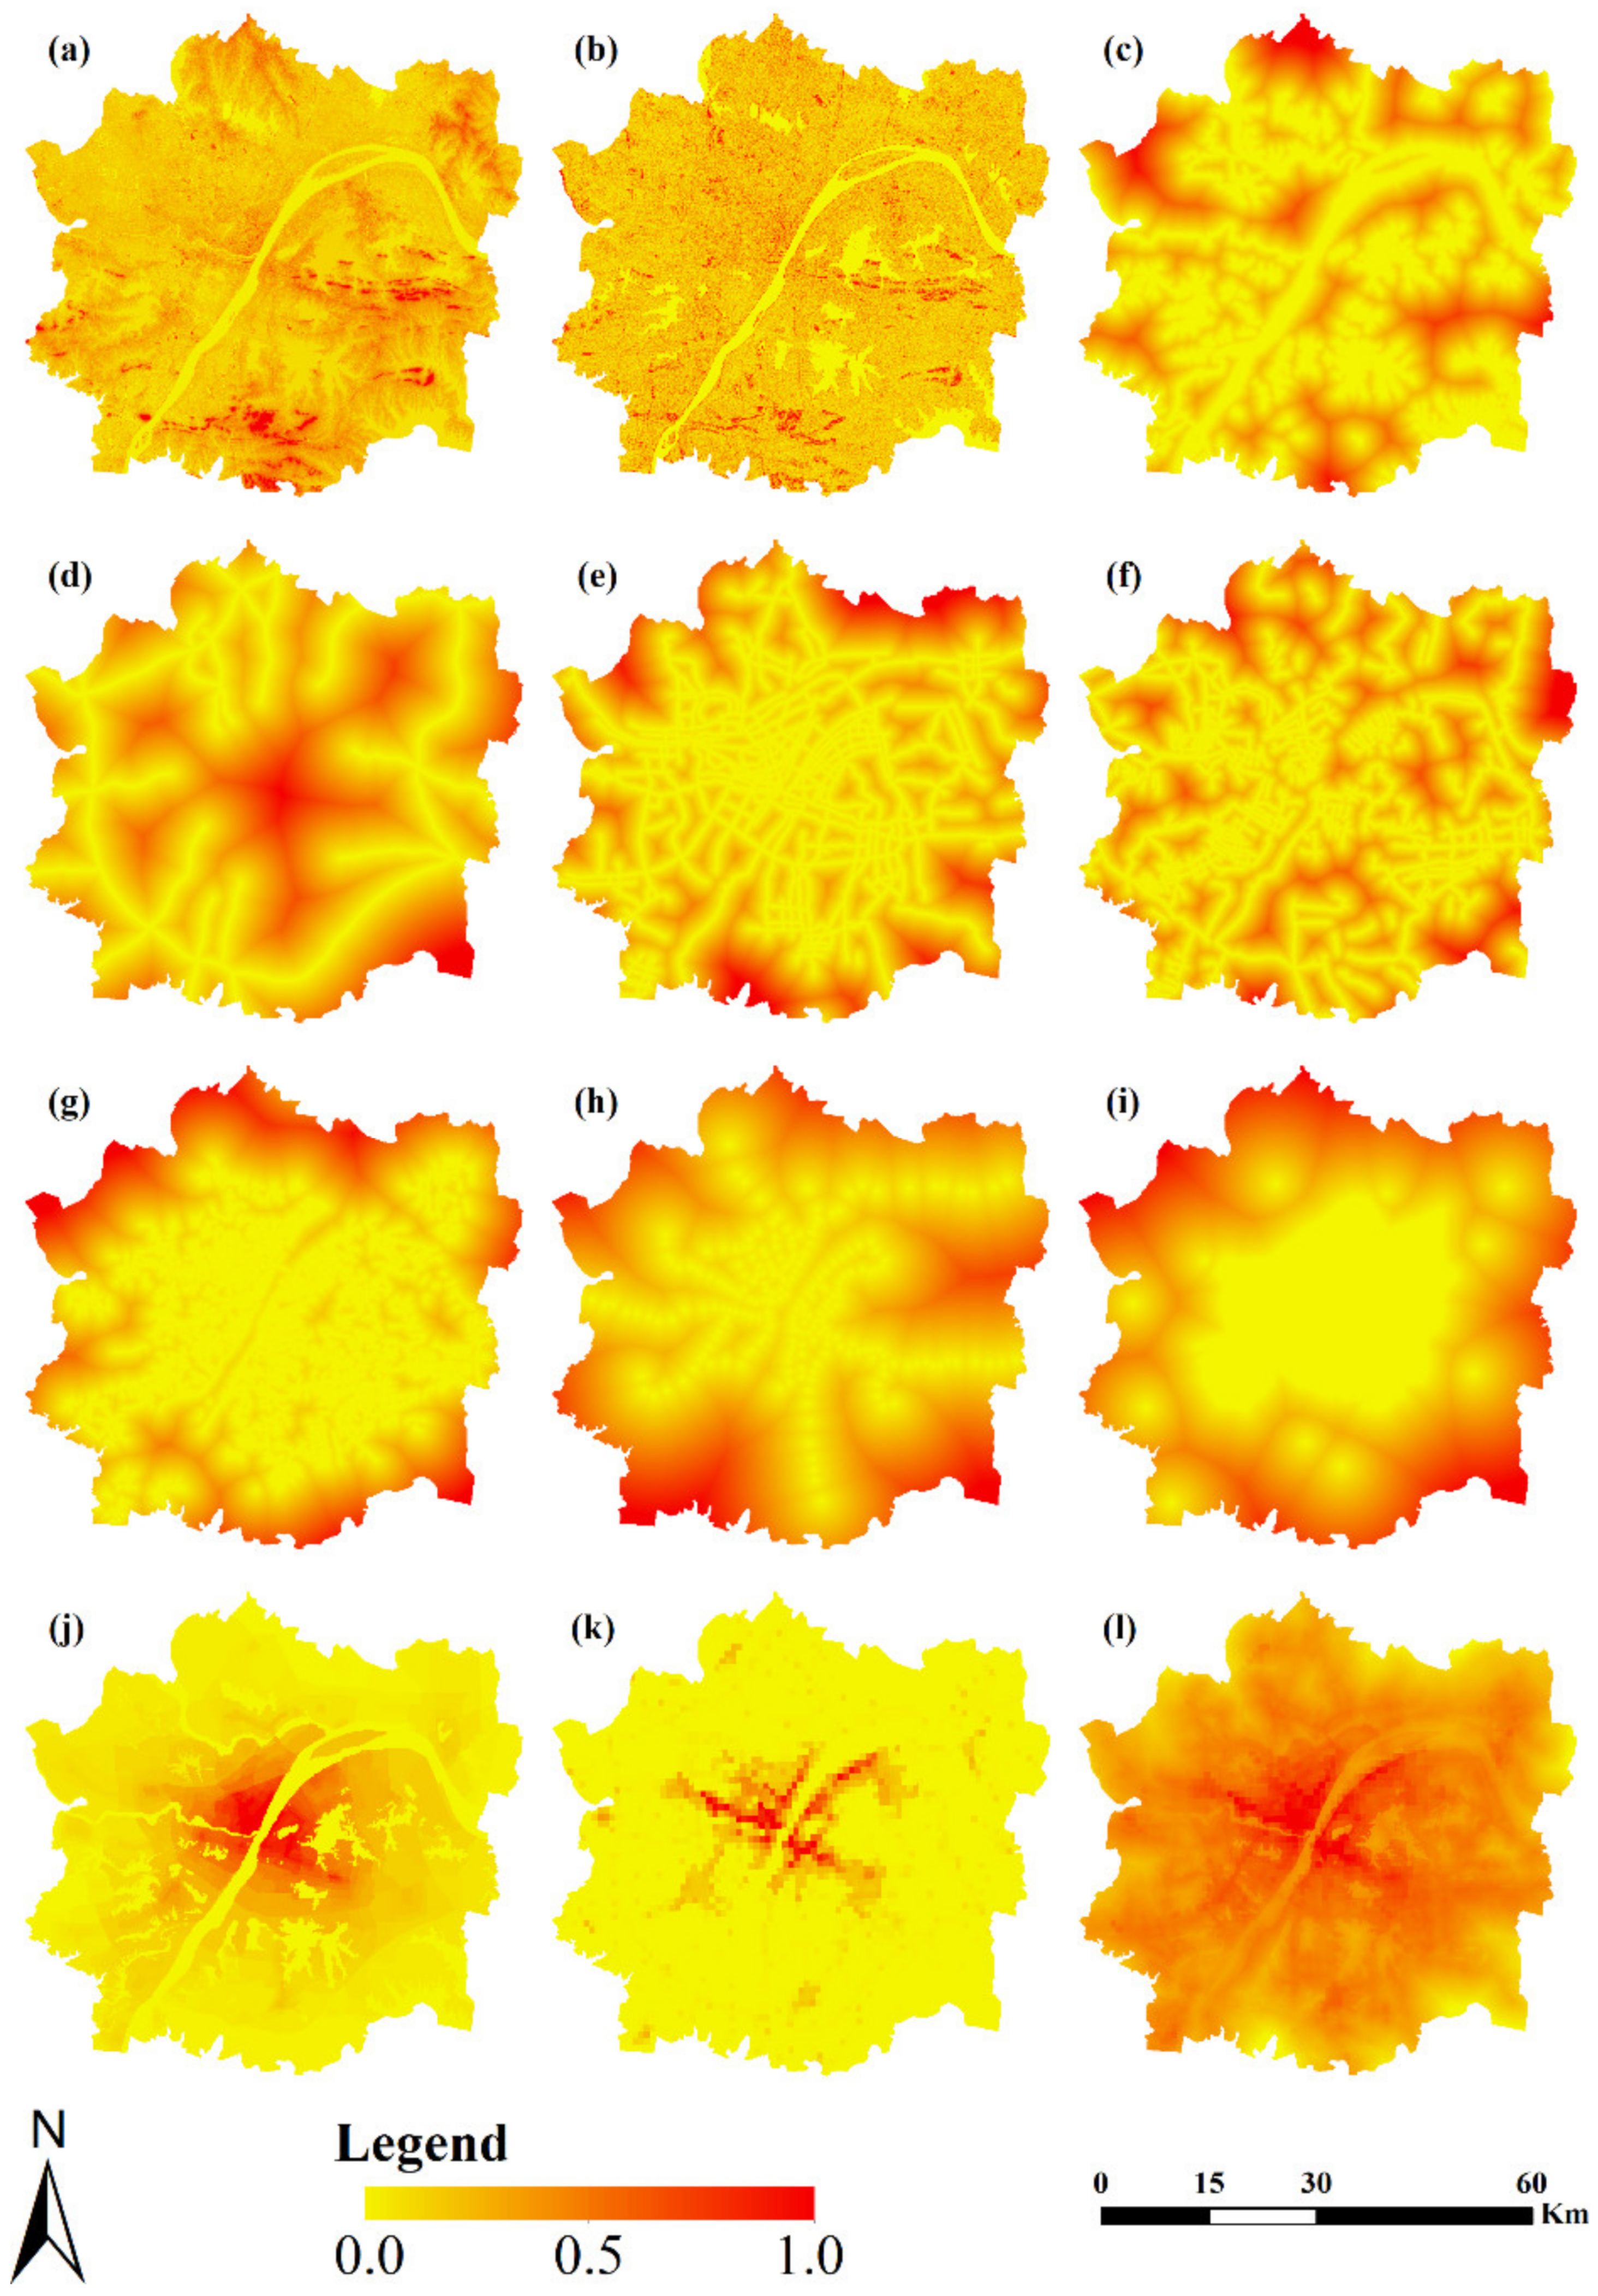
3.1.1. Conservation Priority Evaluation

Urban growth is often at the expense of the loss of ecological land and cultivated land [12,40,41]. In this study, conservation priority includes ecological land conservation priority (ELCP) and cultivated land conservation priority (CLCP). For an ecological land unit such as forest land, grassland, water area and garden land, its conservation priority depends on relevant factors of ecosystem functional importance and ecological vulnerability [42,43], while for a cultivated land unit, its conservation priority should also consider agricultural production suitability [44].
The ecosystem functional importance refers to the ecological conditions and utility formed in the ecosystem and its ecological process, which are conducive to human survival and development [45,46]. According to the ecological status of the study area, biodiversity conservation (BC), carbon storage (CS), water conservation (WR), soil conservation (SC) and flood regulation (FR) are selected as the factors for the evaluation of ecosystem functional importance. Ecological vulnerability refers to the sensitive response and self-recovery ability of ecosystem relative to external interference at a specific time and space scale, wherein a higher vulnerability indicates worse self-recovery ability of the ecosystem [47]. Here, ecological vulnerability includes soil erosion sensitivity (SES), land desertification sensitivity (LDS) and stony desertification sensitivity (SDS). The acquisition and calculation of ecological related factors are mainly based on the Technical Guide for Delimitation of Ecological Protection Red Line issued by the Ministry of Environment Protection of China in 2015 and partly adjusted according to the study area. Table 1 presents the methods for ecosystem functional importance evaluation. Cultivated land quality grade data were used to describe the agricultural production suitability. Then, through ArcGIS 10.2 software, each factor was reclassified to values ranging from 0 to 1, by using the standardized function. The higher the value, the higher the conservation priority. The weight of each factor is obtained by the analytic hierarchy process (AHP) model. Finally, the conservation priority equation can be expressed as:
C i = w e × E L C P + w c × C L C P
E L C P = k = 1 M b k x k
where Ci is the conservation priority for cell i, ranging from 0 to 1; we and wc are the weights of ELCP and CLCP, respectively; we = 1.0 and wc = 0.0 for an ecological land unit, while we = 0.5 and wc = 0.5 for a cultivated land unit; xk represents the value of kth factor, and bk is the corresponding weight. M is the total number of variables. Figure 3 illustrates the results for conservation priority evaluation.

3.1.2. Urban Growth Potential Evaluation

While urban growth is affected by various factors, the literature shows that the following factors are crucial: natural environment, socio-economic status and location conditions [22,34,48]. A variety of methods, such as multivariate statistics, intelligent algorithms and multi-criterion analysis, were used by researchers to define the contribution of diverse driving factors to historical urban growth [18,49,50,51]. In this study, a widely used binary logistic regression (BLR) method [6] was used to produce the urban growth potential map. The BLR equation can be expressed as:
U i = e x p b 0 + k = 1 N b k x k 1 + e x p b 0 + k = 1 N b k x k
where Ui is the urban growth potential for cell i, ranging from 0 to 1. b0 is the constant, xk represents the kth independent variable, and bk is the corresponding weight. N is the total number of independent variables.
Based on previous researches [15,51], we selected 14 driving factors, such as dem, slope, distance from water area, distance from highway, distance from main road, distance from secondary road, distance from branch road, distance from subway station, distance from city center, distance from parks, distance from commercial center, land value, POI density and population density, to evaluate their impacts on Wuhan urban growth and produce the urban growth potential map. In addition to the population density data from 2015, other factor layers were acquired in 2017. We mapped all factors using ArcGIS 10.2 software and processed them by standardized methods. Thirty thousand sample points were extracted from the actual urban land-use change map (2009–2017) and the variable maps by a stratified random sampling method to construct the logistic regression equation. Table 2 presents the variables and their coefficients of BLR model. Figure 4 illustrates their spatial distributions and the final urban growth potential map.

3.2. Planning-Constrained Mechanism

Urban spatial planning, widely used in urban growth management, has an obvious impact on guiding and controlling the urban development [3,20]. Planning constraints have become an indispensable part of urban simulation. Different planning zones represent the different preferences of the government and planners for urban development and natural conservation. Previous studies established the planning constraint mechanism through binary planning constraints or preset planning zoning preferences [32,33], ignoring the cell-based trade-off between urban growth and conservation in the same planning zone [35]. In this study, by integrating the cell-based tradeoff between urban growth potential and conservation priority with zoning-based planning preference, a synthetical planning-constrained mechanism was defined as follows.
P C i = f U i , C i , Z j = U i × Z j U i × Z j + C i × 1 Z j
where PCi is the planning constraints for cell i, ranging from 0 to 1. Ui and Ci are the value of urban growth potential and conservation priority, respectively. Zj represents the planning preference on urban growth in planning zone j, ranging from 0 to 1. Zj = 0 means planning zone j is completely unbuildable, Zj = 1 means planning zone j has no planning restrictions on urban development.
In past decades, Chinese local governments have issued a series of spatial planning policies to restrain the decrease in ecological and agricultural land and guide urban compact development, among which Overall Land Use Planning, Urban Master Planning, Primary Farmland Protection Planning and Ecological Protection Planning played extremely important roles [13,28,52]. By integrating these plans of the study area, we classified the study area into three categories of planning zones: the urban development zone (UDZ), ecological and agricultural conservation zone (EAZ) and completely prohibited undevelopable zone (PUZ). The UDZ refers to areas where cities and towns are intensively developed and constructed and can meet the needs of urban production and life. The value of the ZUDZ is set to 1, considering a higher preference on urban growth in the UDZ. The PUZ includes primary farmland protection area, mountains, water bodies and natural reserves wherein urban development is strictly prohibited. Thus, the value of ZPUZ is set to 0 in this study. The EAZ refers to agricultural and ecological areas besides the PUZ that need to retain their original appearance, strengthen natural conservation and ecological construction and restrict urban development. The value range of the ZEAZ is [0,1]. By adjusting the planning preference parameter in the EAZ, various planning constraints can be generated. Furthermore, considering the timeliness of planning, planning in different time stages should be applied to build the corresponding planning zones. In this study, the planning zones of 2009–2017 and 2017–2025 were established, respectively, and applied to simulate the urban growth process of corresponding phases.

3.3. Planning-Constrained CA Model

CA is a dynamic system with a finite set of state elements, which evolves in discrete time intervals based on transition rules [53,54]. CA-based models have been widely used in urban growth modeling and land-use simulation due to its simple and flexible structure. In general, the conceptual formula of the urban CA model can be described as follows [48]:
S i t + 1 = f S i t , U i , i t , C o n , R
where S i t + 1 and S i t denote the state of the cell i at the moment of t+1 and t, respectively; Ui is the urban growth potential of cell i, i t is the neighborhood effect, Con is a constraint function, R is the random perturbation, and f represents the function of transition rules.
Specifically, the urban growth potential has been described in Section 3.1.2. The neighborhood effect is defined and calculated based on the ratio of adjacent developed cells by using a regular n × n Moore neighborhood [25], which is expressed in Equation (6). Con can be replaced by PCi, which has been introduced in Section 3.2. R represents the uncertainties and random perturbations in the urban land evolution process, which is calculated by Equation (7).
i t = c n × n 1
R = 1 + l n γ α
where c is the number of adjacent developed cells, γ is a random number ranging from 0 to 1, and α is a parameter for adjusting the stochastic magnitude, which was set to 1 to represent a small probability of randomness in this study.
By combining the aforementioned planning-constrained mechanism with urban development potential, neighborhood effect and random disturbance, the final transition probability T P i t of urban CA model can be expressed as follows:
T P i t = U i × i t × P C i × R  
Furthermore, the amount of urban land development was calculated by the Markov chain model, which has been widely and successfully used in the quantitative prediction of land-use change [3,55]. The Kappa index [56] and FoM coefficient [57] were used to calibrate the urban CA model and assess the simulation outcomes. By a pixel-by-pixel comparison between the simulation result and reference map, the Kappa index and FoM coefficient can be calculated as follows:
K a p p a = P o P c 1 P o
P c = a 0 × b 0 + a 1 × b 1 N 2
F o M = B A + B + C
where PO is the observation consistency, which refers to the ratio of the number of correctly simulated cells to the total number of cells; PC is the expected consistency; N is the total number of cells; a0 and a1 are the number of non-urban and urban cells, respectively; b0 and b1 are the number of cells simulated as non-urban land and urban land, respectively; A is the number of error cells observed as urban but simulated as persisted non-urban; B is the number of correctness cells observed and predicted as change; C is the number of error cells observed persistence but simulated to be urban land.

3.4. Multi-Scenario Design of Planning Constraints on Urban Growth

Multi-scenario analysis of planning constraints on the urban growth process has been conducted in this study. By adjusting the planning preference parameters of different planning zones, multiple planning-constrained urban growth scenarios can be derived. Considering the actual situation, the planning preference parameters of the UDZ and PUZ were preset to 1 and 0, respectively. To model the actual planning preference in the EAZ, 11 values, ZEAZ∈ {0,0.1,0.2,0.3,0.4,0.5,0.6,0.7,0.8,0.9,1}, were selected to generate different planning constraints. Among these values, 0 means corresponding planning zone is completely unbuildable, and 1 means corresponding planning zone has no planning restrictions on urban development. Then, multiple scenarios of urban land patterns were simulated for Wuhan in 2025 through integrating the multiple planning constraints into the urban CA model.

4. Model Application and Results

4.1. Urban Growth and Encroachment in 2009–2017

Based on the land-use maps in 2009 and 2017, we obtained the spatial pattern of urban growth in the WUDA from 2009 to 2017. Then, by superimposing it with the integrated urban spatial planning map, the spatial distribution of urban growth in different planning zones was produced, as shown in Figure 5. In addition, through further statistical analysis, the area and proportion of urban growth and encroachment on other lands in different planning zones are calculated, as shown in Table 3. During 2009–2017, the urban growth of the WUDA presented obvious infilling and edge sprawling characteristics, with a total area of 26,351.21 ha. At the same time, the expansion of urban land has led to the occupation of cultivated land, forest land, garden land, grassland and water areas. Among them, the occupied area of cultivated land accounts for 57.96% of the increased area of urban land, the occupied area of water area accounts for 23.69%, and the occupied areas of forest land, garden land and grassland account for 4.25%, 1.96% and 1.96%, respectively. These show that the urban growth in the WUDA during 2009–2017 is mainly at the cost of the reduction in cultivated land and water area. In addition, we found that the integrated urban spatial planning of Wuhan has an obvious guiding and restricting effect on the expansion of urban land at this stage, with 73.26% of the new urban land occurring in the UDZ. However, the urban land expansion beyond the preset UDZ should not be ignored, with 23.53% of the new urban land appearing in the EAZ, and even 3.21% in the PUZ.

4.2. Calibration and Validation of the Simulation Model

This paper analyzes the impact of urban spatial planning policies on urban growth during 2009–2017. By adjusting the planning preference coefficients of different planning zones in this time stage, we obtain the corresponding planning-constrained mechanism. Considering the practical significance of planning zones, the planning preference parameters of the UDZ and PUZ were preset to 1 and 0, respectively, while 11 values ranging from 0.0 to 1.0 on 0.1 intervals are used to generate different planning-constrained scenarios in the EAZ. By using the planning-constrained CA model described in Section 3.3, the urban growth process and spatial pattern from 2009 to 2017 under different planning constraints were simulated. Finally, the actual land-use map of 2017 is used to verify the simulation results.
Figure 6 shows the changes in the Kappa index and FoM coefficient with the adjustment of planning constraints during the verification process. The results show that with the increase in planning preference coefficient of AEZ planning zone, Kappa index and FoM coefficient increase first and, then, decrease, which means that the simulation accuracy has the same change trend. The planning preference coefficient indicates the preference degree of different planning zones for urban growth relative to ecological or agricultural protection. The results show that the actual urban growth violates the urban spatial planning to a certain extent and pays more attention to urban development than ecological and agricultural protection. When the ZEAZ value is 0.7, the accuracy of the model is the highest. This shows that from 2009 to 2017, the urban growth of the WUDA is based on the development strategy that urban growth takes precedence over ecological and agriculture protection. Although this development strategy considers the trade-off relationship between urban development and ecological and agricultural protection to a certain extent, it obviously pays more attention to the economic benefits brought by urban development and largely ignores the ecosystem functional importance, ecological sensitivity and agricultural production suitability in the EAZ. This will cause higher risk of ecological and agricultural loss and further lead to the deterioration of ecological environment and the reduction in grain production.

4.3. Multi-Scenario Simulation of Urban Growth Based on Planning Constraints

Figure 7 shows the spatial distribution of urban growth probability under different planning constraints, which is calculated by the method described in Section 3.2. It can be found that with the adjustment of planning zoning preference parameters, the transition probability map of urban growth shows obvious differences. Overall, with the increase in ZAEZ, the area of land with high transition probability increases significantly, showing obvious influence of planning constraints. From the perspective of the planning zone, the land located in the UDZ shows significantly higher transition probability and remains unchanged with the increase in planning zoning preference parameters, mainly because the planned UDZ is often located around the existing urban land, and it is not affected by the spatial containment function of the planning zone. The land in the EAZ shows obvious spatial heterogeneity, which is mainly located at the urban fringe and suburban area. The farther away from the urban center, the lower the transition probability. At the same time, with the reduction in the planning zone preference parameters, the effect of planning constraints enhanced, resulting in lower transition probability. When the ZEAZ = 0, it means that the EAZ is subject to the strictest planning constraint, and the urban growth probability of all land located in this area is 0. When ZEZA = 1, it means that the EAZ is not affected by the planning constraint; thus, its transition probability only depends on its urban growth potential. When the ZEAZ < 1, it means that the transition probability of the EAZ area depends on the joint action of conservation priority and urban growth potential, and the land with higher urban growth potential and lower conservation priority is easier to convert to urban land. The transition probability of the land located in the PUZ is always 0, because it is subject to the strictest planning constraint.
Based on the urban growth potential map and the planning-constrained CA model introduced in Section 3.3, we simulate the spatial distribution of the WUDA urban growth in 2025 under different planning-constrained scenarios. We used the Markov chain model to predict the urban land demand in 2025, showing that the total area of urban land would be 1342.21 km2. Figure 8 illustrates the simulation results under different planning constraints. During 2017–2025, urban growth in the WUDA continued to occur around the existing urban land, showing obvious characteristics of edge and infilling expansion. At the same time, the urban growth in this stage is more distributed in the new town groups far from the urban center. The central urban area shows weak urban growth due to strict urban spatial planning policies and few land areas for urban growth. With continuous changes in the ZEAZ value, the urban spatial pattern evolved in a steady and gradient mode; however, a sharp transformation was observed with significant changes to the parameter. In comparison to the weak planning-constrained scenarios (when Z > 0.5), the strong planning-constrained scenarios (when Z < 0.5) showed an obvious reduction in urban encroachment on farmland with high agricultural production suitability and ecological land with high ecological importance. This shows that the strong planning constraint scheme proposed in this paper can effectively avoid the occupation of cultivated land and ecological land with high conservation priority, which is conducive to the urban sustainable development.
Table 4 presents the landscape indexes of urban growth simulation results under different planning constraints, including number of patch (NP), mean patch size (MPS), mean Euclidean nearest neighbor distance (ENN_MN), mean perimeter area ratio (PARA_MN) and aggregation index (AI). Overall, NP and PARA_MN decrease first and, then, increase, MPS, AI and ENN_MN show the opposite trend. When the ZEAZ ≤ 0.5, NP and PARA_MN values decrease gradually, MPS, AI and ENN_MN values increased gradually with the increase in the ZEAZ. When the ZEAZ > 0.5, with the increase in the ZEAZ, NP and PARA_MN values increase slowly, while MPS, AI and ENN_MN values decrease gradually. This indicates that when there is no obvious preference on urban growth or ecological land and cultivated land protection in the EAZ, the patch number of urban lands is the least, the patch shape is more regular, and the spatial distribution is the most concentrated. With the increase in preference on urban growth or ecological land and cultivated land protection in the EAZ, the patch number of urban lands increases, the patch shape is more irregular, and its spatial distribution is more fragmented. Further, the urban spatial distribution under weak planning constraints is more concentrated than that under strong planning constraints.
Based on the spatial structure of three main urban areas (Wuchang, Hankou and Hanyang) and six new city clusters (North, East, Southeast, South, Southwest and West) in the WUDA determined by the master plan of Wuhan, we have made zoning statistics on the simulation results of urban growth in the study area in 2025. Table 5 shows the area of urban growth and its proportion in the UDZ across different regions under multi-scenarios. With the increase in Z value in the EAZ, the proportion of urban growth in the UDZ will decrease in 2025, from 100% to 68.24%, which clearly shows the impact of planning constraints proposed in this paper on urban growth. In addition, we note that the South and Southwest new city clusters show more obvious changes, while the Hanyang main urban area has the least change. This shows that with the weakening of the impact of planning constraints, the urban growth of the South and Southwest new city cluster is more likely to exceed the UDZ preset in the urban spatial plans, while the urban growth of Hanyang tends to occur in the UDZ.

5. Discussion

CA-based models have been widely used to simulate urban growth and land-use change in past decades. Although there are many practices of using technologically sophisticated methods to construct the urban CA model, the incorporation of planning constraints into modeling has not been adequately addressed so far. By combining the cell-based trade-off between urban growth and conservation with a zoning-based planning implementation mechanism, we proposed a new planning-constrained CA model to simulate urban growth and encroachment under different planning scenarios and explore the potential influence of integrated urban spatial planning on urban growth process. In comparison to the earlier publications [15,26,27,28], our research incorporated the synthetical urban planning constraints into the CA model, so as to make the predicted future urban scenario closer to reality and provide a useful evaluation tool for the urban planning implementation.
Taking the Wuhan Urban Development Area as a case study, the planning-constrained CA model was applied to simulate the spatial pattern of urban growth from 2009 to 2017 and predict the urban scenarios under different planning constraints in 2025. We find that a higher simulation accuracy can be achieved by considering planning constraints in the simulation. When the ZEAZ value is 0.7, the accuracy of the model is the highest, which indicates that the actual urban growth of the WUDA from 2009 to 2017 violates the urban spatial planning to a certain extent and pays more attention to urban development than ecological and agricultural protection. In future scenarios, with the weakening of planning constraints, urban growth tends to occupy more ecological and agricultural land with high conservation priority. With the increase in preference on urban growth or ecological land and cultivated land protection in the EAZ, the spatial distribution of future urban land becomes more fragmented. This shows that the planning constraint scheme proposed in this paper can effectively guide urban compact development and protect the ecological environment and food security. Furthermore, in the simulation process, the location and quantity of new urban land beyond the planned urban development area can be captured, which will provide certain early warning.
At present, the Chinese government and local governments are formulating a series of new spatial planning policies, one of which is to optimize the regional spatial pattern. It mainly includes the delineation of the three lines (ecological protection red line, permanent basic farmland protection red line and urban expansion boundary line), as well as the determination of planning zoning such as urban development area, rural development area, ecological protection area and agricultural protection area. Policymakers are faced with the problem of how to evaluate spatial planning policies and how to integrate ecological priority into urban spatial planning [32,33]. The methods and models proposed in this study can provide effective support.
However, there are several limitations in our work. First, the Markov model was used to predict the quantity of future urban land in this study, neglecting the impact of different policies and planning schemes, which should be addressed in further research. Second, this study mainly considers the natural and socio-economic driving factors to construct the transformation rules of the urban CA model, ignoring the impact of people’s behaviors and decisions. Future research needs to focus on multi-objective human decision-making behaviors and their impact on the urban growth process. Finally, this study predicts the spatial pattern of urban growth based on the 30 m grid, ignoring that the actual land development process is based on the plot. Future research can consider building the conversion rules of urban CA model based on the land-use plot, so as to produce more accurate simulation results.

6. Conclusions

Spatial planning policies are important factors affecting urban development. How urban growth is impacted by urban spatial planning policies needs to be understood in order to better simulate the future urban patterns [28]. Many other publications have made significant contributions to the urban CA model and application [18]. However, so far, the scenario simulation considering the actual urban spatial planning policies has not been adequately addressed, which weakens the ability of CA to provide insight into the future urban spatial patterns and inform the sustainable development strategy [20]. In this paper, we developed a planning-constrained CA model to simulate urban growth and encroachment under different planning scenarios by integrating cellular automata and actual urban spatial planning. In the planning-constrained CA model, a synthetical planning-constrained mechanism was proposed by combing the cell-based tradeoff between urban growth potential and conservation priority with zoning-based planning preference. By adjusting the preference parameters of different planning zones, multiple planning-constrained scenarios can be generated. Taking the Wuhan Urban Development Area as a case study, the planning-constrained CA model was applied to simulate current (2017) and future (2025) urban scenarios. The main conclusions were:
  • The planning-constrained CA model demonstrated a higher simulation accuracy compared to the model without planning constraints.
  • The simulation result of 2017 shows that a weak planning-constrained urban development was consistent with the actual situation.
  • With the weakening of planning constraints, urban growth tends to occupy more ecological and agricultural land with high conservation priority. With the increase in preference on urban growth or ecological land and cultivated land protection in the EAZ, the future urban land pattern becomes more fragmented.
  • Location and quantity of new urban land beyond the planned urban development area can be captured in future urban scenarios, which will provide certain early warning.
The method proposed in this study can provide effective support for planners and decisionmakers to evaluate the impact of actual urban spatial planning policies on urban growth and generate urban future scenarios in which urban development and natural protection are coordinated, so as to realize the urban sustainable development.

Author Contributions

Conceptualization, H.W. and Y.L.; methodology, H.W.; software, H.W. and Y.W.; formal analysis, H.W.; data curation, H.W. and J.Z.; writing—original draft preparation, H.W.; writing—review and editing, H.W. and Y.L.; visualization, H.W. and G.Z.; All authors have read and agreed to the published version of the manuscript.

Funding

This research was funded by the National Key Research and Development Program (Grant No: 2017YFB0503505).

Institutional Review Board Statement

Not applicable.

Informed Consent Statement

Not applicable.

Data Availability Statement

The data presented in this study are available on request from the corresponding author.

Conflicts of Interest

The authors declare no conflict of interest.

References

  1. Bai, X.; Shi, P.; Liu, Y. Society: Realizing China’s urban dream. Nature 2014, 509, 158–160. [Google Scholar] [CrossRef] [Green Version]
  2. Mcphearson, T. Scientists must have a say in the future of cities. Nature 2016, 538, 165–166. [Google Scholar] [CrossRef] [Green Version]
  3. Zhou, L.; Dang, X.; Sun, Q.; Wang, S. Multi-scenario simulation of urban land change in Shanghai by random forest and CA-Markov model. Sustain. Cities Soc. 2020, 55, 102045. [Google Scholar] [CrossRef]
  4. Seto, K.C.; Güneralp, B.; Hutyra, L.R. Global forecasts of urban expansion to 2030 and direct impacts on biodiversity and carbon pools. Proc. Natl. Acad. Sci. USA 2012, 109, 16083–16088. [Google Scholar] [CrossRef] [Green Version]
  5. Grimm, N.B.; Faeth, S.H.; Golubiewski, N.E.; Redman, C.L.; Wu, J.; Bai, X.; Briggs, J.M. Global Change and the Ecology of Cities. Science 2008, 319, 756–760. [Google Scholar] [CrossRef] [Green Version]
  6. Grêt-Regamey, A.; Altwegg, J.; Sirén, E.A.; van Strien, M.J.; Weibel, B. Integrating ecosystem services into spatial planning—A spatial decision support tool. Landsc. Urban Plan. 2017, 165, 206–219. [Google Scholar] [CrossRef] [Green Version]
  7. Li, Y.; Ma, Q.; Song, Y.; Han, H. Bringing conservation priorities into urban growth simulation: An integrated model and applied case study of Hangzhou, China. Resour. Conserv. Recycl. 2019, 140, 324–337. [Google Scholar] [CrossRef]
  8. McCormick, K.; Anderberg, S.; Coenen, L.; Neij, L. Advancing sustainable urban transformation. J. Clean. Prod. 2013, 50, 1–11. [Google Scholar] [CrossRef] [Green Version]
  9. Godwin, C.; Chen, G.; Singh, K.K. The impact of urban residential development patterns on forest carbon density: An integration of LiDAR, aerial photography and field mensuration. Landsc. Urban Plan. 2015, 136, 97–109. [Google Scholar] [CrossRef]
  10. Haberl, H. Competition for land: A sociometabolic perspective. Ecol. Econ. 2015, 119, 424–431. [Google Scholar] [CrossRef] [Green Version]
  11. Ke, X.; van Vliet, J.; Zhou, T.; Verburg, P.H.; Zheng, W.; Liu, X. Direct and indirect loss of natural habitat due to built-up area expansion: A model-based analysis for the city of Wuhan, China. Land Use Policy 2018, 74, 231–239. [Google Scholar] [CrossRef]
  12. He, J.; Liu, Y.; Yu, Y.; Tang, W.; Xiang, W.; Liu, D. A counterfactual scenario simulation approach for assessing the impact of farmland preservation policies on urban sprawl and food security in a major grain-producing area of China. Appl. Geogr. 2013, 37, 127–138. [Google Scholar] [CrossRef]
  13. Zhang, Y.; Liu, Y.; Zhang, Y.; Kong, X.; Jing, Y.; Cai, E.; Zhang, L.; Liu, Y.; Wang, Z.; Liu, Y. Spatial Patterns and Driving Forces of Conflicts among the Three Land Management Red Lines in China: A Case Study of the Wuhan Urban Development Area. Sustainability 2019, 11, 2025. [Google Scholar] [CrossRef] [Green Version]
  14. Long, Y.; Han, H.; Tu, Y.; Shu, X. Evaluating the effectiveness of urban growth boundaries using human mobility and activity records. Cities 2015, 46, 76–84. [Google Scholar] [CrossRef]
  15. Tong, X.; Feng, Y. How current and future urban patterns respond to urban planning? An integrated cellular automata modeling approach. Cities 2019, 92, 247–260. [Google Scholar] [CrossRef]
  16. Li, X.; Lao, C.; Liu, Y.; Liu, X.; Chen, Y.; Li, S.; Ai, B.; He, Z. Early warning of illegal development for protected areas by integrating cellular automata with neural networks. J. Environ. Manag. 2013, 130, 106–116. [Google Scholar] [CrossRef]
  17. Tobler, W.R. Cellular Geography. In Philosophy in Geography; Gale, S., Olsson, G., Eds.; Springer: Dordrecht, The Netherlands, 1979; pp. 379–386. [Google Scholar] [CrossRef]
  18. Liu, Y.; Batty, M.; Wang, S.; Corcoran, J. Modelling urban change with cellular automata: Contemporary issues and future research directions. Prog. Hum. Geogr. 2021, 45, 3–24. [Google Scholar] [CrossRef]
  19. Berberoğlu, S.; Akın, A.; Clarke, K.C. Cellular automata modeling approaches to forecast urban growth for Adana, Turkey: A comparative approach. Landsc. Urban Plan. 2016, 153, 11–27. [Google Scholar] [CrossRef]
  20. Liang, X.; Liu, X.; Li, D.; Zhao, H.; Chen, G. Urban growth simulation by incorporating planning policies into a CA-based future land-use simulation model. Int. J. Geogr. Inf. Sci. 2018, 32, 2294–2316. [Google Scholar] [CrossRef]
  21. Zhang, Q.; Su, S. Determinants of urban expansion and their relative importance: A comparative analysis of 30 major metropolitans in China. Habitat Int. 2016, 58, 89–107. [Google Scholar] [CrossRef]
  22. Li, J.; Deng, X.; Seto, K.C. Multi-level modeling of urban expansion and cultivated land conversion for urban hotspot counties in China. Landsc Urban Plan. 2012, 108, 131–139. [Google Scholar] [CrossRef]
  23. Tian, G.; Ma, B.; Xu, X.; Liu, X.; Xu, L.; Liu, X.; Xiao, L.; Kong, L. Simulation of urban expansion and encroachment using cellular automata and multi-agent system model—A case study of Tianjin metropolitan region, China. Ecol. Indic. 2016, 70, 439–450. [Google Scholar] [CrossRef]
  24. Lagarias, A. Urban sprawl simulation linking macro-scale processes to micro-dynamics through cellular automata, an application in Thessaloniki, Greece. Appl. Geogr. 2012, 34, 146–160. [Google Scholar] [CrossRef]
  25. Liao, J.; Tang, L.; Shao, G.; Su, X.; Chen, D.; Xu, T. Incorporation of extended neighborhood mechanisms and its impact on urban land-use cellular automata simulations. Environ. Model. Softw. 2016, 75, 163–175. [Google Scholar] [CrossRef] [Green Version]
  26. Onsted, J.A.; Chowdhury, R.R. Does zoning matter? A comparative analysis of landscape change in Redland, Florida using cellular automata. Landsc Urban Plan. 2014, 121, 1–18. [Google Scholar] [CrossRef]
  27. Yin, H.; Kong, F.; Yang, X.; James, P.; Dronova, I. Exploring zoning scenario impacts upon urban growth simulations using a dynamic spatial model. Cities 2018, 81, 214–229. [Google Scholar] [CrossRef] [Green Version]
  28. Li, L.; Song, Y.; Wei, X.; Dong, J. Exploring the impacts of urban growth on carbon storage under integrated spatial regulation: A case study of Wuhan, China. Ecol. Indic. 2020, 111, 106064. [Google Scholar] [CrossRef]
  29. Xi, F.; He, H.S.; Hu, Y.; Bu, R.; Chang, Y.; Wu, X.; Liu, M.; Shi, T. Simulating the impacts of ecological protection policies on urban land use sustainability in Shenyang-Fushun, China. Int. J Urban Sustain. Dev. 2010, 1, 111–127. [Google Scholar] [CrossRef] [Green Version]
  30. Wang, W.; Jiao, L.; Jia, Q.; Liu, J.; Mao, W.; Xu, Z.; Li, W. Land use optimization modelling with ecological priority perspective for large-scale spatial planning. Sustain. Cities Soc. 2021, 65, 102575. [Google Scholar] [CrossRef]
  31. Wang, H.; Xia, C.; Zhang, A.; Deng, Y. Scenario simulation and control of metropolitan outskirts urban growth based on constrained CA: A case study of Jiangxia District of Wuhan City. Prog. Geogr. 2016, 35, 793–805. [Google Scholar] [CrossRef] [Green Version]
  32. Yeh, A.G.O.; Li, X.; Xia, C. Cellular Automata Modeling for Urban and Regional Planning. In Urban Informatics; Shi, W., Goodchild, M.F., Batty, M., Kwan, M.-P., Zhang, A., Eds.; Springer: Singapore, 2021; pp. 865–883. [Google Scholar] [CrossRef]
  33. Hersperger, A.M.; Grădinaru, S.; Oliveira, E.; Pagliarin, S.; Palka, G. Understanding strategic spatial planning to effectively guide development of urban regions. Cities 2019, 94, 96–105. [Google Scholar] [CrossRef]
  34. Dadashpoor, H.; Azizi, P.; Moghadasi, M. Analyzing spatial patterns, driving forces and predicting future growth scenarios for supporting sustainable urban growth: Evidence from Tabriz metropolitan area, Iran. Sustain. Cities Soc. 2019, 47, 101502. [Google Scholar] [CrossRef]
  35. Shoemaker, D.A.; BenDor, T.K.; Meentemeyer, R.K. Anticipating trade-offs between urban patterns and ecosystem service production: Scenario analyses of sprawl alternatives for a rapidly urbanizing region. Comput. Environ. Urban Syst. 2019, 74, 114–125. [Google Scholar] [CrossRef]
  36. Olagunju, A.; Gunn, J.A.E. Integration of environmental assessment with planning and policy-making on a regional scale: A literature review. Environ. Impact Assess. Rev 2016, 61, 68–77. [Google Scholar] [CrossRef]
  37. York, A.M.; Munroe, D.K. Urban encroachment, forest regrowth and land-use institutions: Does zoning matter? Land Use Policy 2010, 27, 471–479. [Google Scholar] [CrossRef]
  38. Du, N.; Ottens, H.; Sliuzas, R. Spatial impact of urban expansion on surface water bodies—A case study of Wuhan, China. Landsc. Urban Plan. 2010, 94, 175–185. [Google Scholar] [CrossRef]
  39. Jin, G.; Shi, X.; He, D.W.; Guo, B.S.; Li, Z.H.; Shi, X.B. Designing a spatial pattern to rebalance the orientation of development and protection in Wuhan. J. Geog. Sci. 2020, 30, 569–582. [Google Scholar] [CrossRef]
  40. Long, H.; Liu, Y.; Hou, X.; Li, T.; Li, Y. Effects of land use transitions due to rapid urbanization on ecosystem services: Implications for urban planning in the new developing area of China. Habitat Int. 2014, 44, 536–544. [Google Scholar] [CrossRef]
  41. Kraxner, F.; Nordström, E.-M.; Havlík, P.; Gusti, M.; Mosnier, A.; Frank, S.; Valin, H.; Fritz, S.; Fuss, S.; Kindermann, G.; et al. Global bioenergy scenarios – Future forest development, land-use implications, and trade-offs. Biomass Bioenergy 2013, 57, 86–96. [Google Scholar] [CrossRef]
  42. Haase, D.; Larondelle, N.; Andersson, E.; Artmann, M.; Borgstrom, S.; Breuste, J.; Gomez-Baggethun, E.; Gren, A.; Hamstead, Z.; Hansen, R.; et al. A quantitative review of urban ecosystem service assessments: Concepts, models, and implementation. Ambio 2014, 43, 413–433. [Google Scholar] [CrossRef] [Green Version]
  43. Nguyen, A.K.; Liou, Y.-A.; Li, M.-H.; Tran, T.A. Zoning eco-environmental vulnerability for environmental management and protection. Ecol. Indic. 2016, 69, 100–117. [Google Scholar] [CrossRef]
  44. Wang, W.; Jiao, L.; Zhang, W.; Jia, Q.; Su, F.; Xu, G.; Ma, S. Delineating urban growth boundaries under multi-objective and constraints. Sustain. Cities Soc. 2020, 61, 102279. [Google Scholar] [CrossRef]
  45. Peng, J.; Liu, Y.; Wu, J.; Lv, H.; Hu, X. Linking ecosystem services and landscape patterns to assess urban ecosystem health: A case study in Shenzhen City, China. Landsc. Urban Plan. 2015, 143, 56–68. [Google Scholar] [CrossRef]
  46. Luederitz, C.; Brink, E.; Gralla, F.; Hermelingmeier, V.; Meyer, M.; Niven, L.; Panzer, L.; Partelow, S.; Rau, A.-L.; Sasaki, R.; et al. A review of urban ecosystem services: Six key challenges for future research. Ecosyst. Serv 2015, 14, 98–112. [Google Scholar] [CrossRef] [Green Version]
  47. Hong, W.; Jiang, R.; Yang, C.; Zhang, F.; Su, M.; Liao, Q. Establishing an ecological vulnerability assessment indicator system for spatial recognition and management of ecologically vulnerable areas in highly urbanized regions: A case study of Shenzhen, China. Ecol. Indic. 2016, 69, 540–547. [Google Scholar] [CrossRef]
  48. Xia, C.; Zhang, B. Exploring the effects of partitioned transition rules upon urban growth simulation in a megacity region: A comparative study of cellular automata-based models in the Greater Wuhan Area. GIScience Remote Sens. 2021, 58, 693–716. [Google Scholar] [CrossRef]
  49. Feng, Y.; Tong, X. Dynamic land use change simulation using cellular automata with spatially nonstationary transition rules. Giscience Remote Sens. 2018, 55, 678–698. [Google Scholar] [CrossRef]
  50. Li, X.; Chen, Y.; Liu, X.; Xu, X.; Chen, G. Experiences and issues of using cellular automata for assisting urban and regional planning in China. Int. J. Geogr. Inf. Sci. 2017, 31, 1606–1629. [Google Scholar] [CrossRef]
  51. He, Q.; Tan, S.; Yin, C.; Zhou, M. Collaborative Optimization of Rural Residential Land Consolidation and Urban Con-struction Land Expansion: A Case Study of Huangpi in Wuhan, China. Comput. Environ. Urban Syst. 2019, 74, 218–228. [Google Scholar] [CrossRef]
  52. Bai, Y.; Wong, C.P.; Jiang, B.; Hughes, A.C.; Wang, M.; Wang, Q. Developing China’s Ecological Redline Policy using ecosystem services assessments for land use planning. Nat. Commun. 2018, 9, 3034. [Google Scholar] [CrossRef] [Green Version]
  53. Batty, M.; Xie, Y.; Sun, Z. Modeling urban dynamics through GIS-based cellular automata. Comput. Environ. Urban Syst. 1999, 23, 205–233. [Google Scholar] [CrossRef] [Green Version]
  54. Li, X.; Yeh, A.G.-O. Modelling sustainable urban development by the integration of constrained cellular automata and GIS. Int. J. Geogr. Inf. Sci. 2000, 14, 131–152. [Google Scholar] [CrossRef]
  55. Aburas, M.M.; Ho, Y.M.; Ramli, M.F.; Ash’Aari, Z.H. The simulation and prediction of spatio-temporal urban growth trends using cellular automata models: A review. Int. J. Appl. Earth Obs. Geoinf. 2016, 52, 380–389. [Google Scholar] [CrossRef]
  56. Pontius, R.G. Quantification Error versus Location Error in Comparison of Categorical Maps. Photogramm. Eng. Remote Sens. 2000, 66, 1011–1016. [Google Scholar]
  57. Pontius, R.G.; Boersma, W.; Castella, J.-C.; Clarke, K.; de Nijs, T.; Dietzel, C.; Duan, Z.; Fotsing, E.; Goldstein, N.; Kok, K.; et al. Comparing the input, output, and validation maps for several models of land change. Ann. Reg. Sci. 2008, 42, 11–37. [Google Scholar] [CrossRef] [Green Version]
Figure 1. Location of the Wuhan Urban Development Area (WUDA).
Sustainability 13 11279 g001
Figure 2. Flowchart for planning-constrained CA model.
Sustainability 13 11279 g002
Figure 3. Conservation priority evaluation indicators and results. (a) biodiversity conservation (BC); (b) carbon storage (CS); (c) water conservation (WR); (d) soil conservation (SC); (e) flood regulation (FR); (f) soil erosion sensitivity (SES); (g) land desertification sensitivity (LDS); (h) stony desertification sensitivity (SDS); (i) ecological land conservation priority (ELCP); (j) cultivated land conservation priority (CLCP); (k) conservation priority.
Sustainability 13 11279 g003
Figure 4. Urban growth potential evaluation indicators and results. (a) dem; (b) slope; (c) distance from water area; (d) distance from highway; (e) distance from main road; (f) distance from secondary road; (g) distance from branch road; (h) distance from subway station; (i) distance from city center; (j) land value; (k) population density; (l) urban growth potential.
Sustainability 13 11279 g004
Figure 5. Spatial distribution of urban growth in different planning zones.
Sustainability 13 11279 g005
Figure 6. Simulation accuracy assessment. (a) Kappa index; (b) FoM coefficient.
Sustainability 13 11279 g006
Figure 7. Urban growth probability under different planning constraints.
Sustainability 13 11279 g007
Figure 8. Urban growth pattern under different planning-constrained scenarios.
Sustainability 13 11279 g008
Table 1. Methods for ecosystem functional importance evaluation.
IndicatorsModelsParameter Explanation
Biodiversity conservation (BC)The habitat quality model of InVEST: Q x i = H i 1 D x i 2   D x i 2 + k 2   Q x i is the habitat quality index of patch group x in L U L C i (dimensionless). H i and D x i are the habitat suitability score and the total stress level of grid x in L U L C i , respectively. k is the scale factor (constant).
Carbon storage (CS)Carnegie–Ames–Stanford approach model (CASA):   N P P x t = APAR x t × ε x t ; A P A R x t = S O L x t × F R A P x t × 0.5 ; ε x t = T 1 x t × T 2 x t × W x t × ε m a x N P P x t is the ecosystem net primary productivity of pixel x in tst month (gC·m-2·month-1), A P A R x t and ε x t are its corresponding absorbed photosynthetic effective radiation and actual light energy utilization, respectively. S O L x t , F R A P x t ,and W x t are the total solar radiation, the absorption ratio of vegetation layer to incident photosynthetic effective radiation, the influence coefficient of water stress of pixel x in tst month, respectively. T1 and T2 indicate the stress effect of low and high temperature on light energy utilization, ε m a x is the maximum light energy utilization under ideal conditions.
Water conservation (WR)Water balance equation:
WR = i = 1 n W R i ; W R i = P i R i E T i × A i × 10 3
W R i is the water conservation capacity of type i (m3), and n is the number of ecosystem types. P i , R i , E T i and A i are the rainfall, surface runoff, evapotranspiration and ecosystem area of type i, respectively.
Soil conservation (SC)Revised universal soil loss equation (RUSLE): S C = S p S a ; S p = R × K × L S ; S a = R × K × L S × C × P SC is the quantity of soil conservation (t/hm2·a),   S p and S a are the quantity of potential and actual soil erosion, respectively. R, K, LS, C and P are the rainfall erosivity, soil erosion factor, slope factor, vegetation cover factor and the soil conservation practices factor, respectively.
Flood regulation (FR)The assessment is based on the water level and area of the water body.The main rivers of the Yangtze River and Han River, large lakes (>1 km2), large- and medium-sized reservoirs are extremely important flood control ecological function areas; others belong to important areas.
Soil erosion sensitivity (SES) S E S = R × K × L S × C 4 SES is the sensitivity index of soil erosion (dimensionless). R, K, LS and C are the sensitivity grades of rainfall erosivity, soil erosion, slope factor and vegetation cover, respectively.
Land desertification sensitivity (LDS) L D S = I × W × K × C 4 LDS is the sensitivity index of land desertification (dimensionless). I, W, K and C are the sensitivity grades of dryness index, sand-driving wind days, soil texture and vegetation cover, respectively.
Stony desertification sensitivity (SDS). S D S = D × S × C 3 SDS is the sensitivity index of stony desertification (dimensionless). D, S and C are the sensitivity grades of exposed area percentage of carbonate stony, terrain slope and vegetation coverage, respectively.
Table 2. Independent variables and coefficients of logistic regression model.
Independent VariablesCoefficientsSig.
Constant1.7880.000
Dem−2.5070.000
Slope−0.8010.000
Distance from water area1.7630.000
Distance from highway−1.5570.000
Distance from main road−6.1350.000
Distance from secondary road−2.6270.000
Distance from branch road−1.4810.000
Distance from subway station−0.2990.000
Distance from city center−2.4240.000
Land value6.3580.000
Population density8.5280.000
Table 3. Area and percent of different land occupied in different planning zones.
EAZUDZPUZTotal
Area
(km2)
Percent
(%)
Area
(km2)
Percent
(%)
Area
(km2)
Percent
(%)
Area
(km2)
Percent
(%)
Cultivated land33.4112.68116.4644.202.871.09152.7357.96
Garden land1.170.443.951.500.050.025.171.96
Forest land2.741.047.692.920.770.2911.204.25
Grassland0.590.224.541.720.040.015.171.96
Water areas14.315.4344.5616.913.561.3562.4323.69
Rural settlement9.413.5714.035.331.140.4324.589.33
Unused land0.390.151.810.690.030.012.220.84
Total62.0223.53193.0573.268.453.21263.51100.00
Table 4. Landscape index of different planning scenarios.
ZEAZNPMPSPARA_MNENN_MNAI
01301031.6834310.3234202.34298.3563
0.11241081.3902309.9919203.571798.3664
0.21121197.3471281.6773242.907998.3771
0.31011326.1127260.7926267.212498.377
0.4991354.608266.4246270.45298.3699
0.5941425.4162241.3943274.802198.3691
0.6941424.8101258.2396265.533498.3561
0.7961391.0121269.231275.871598.358
0.8991354.4294258.9014276.884398.3501
0.91041287.8022286.3029234.419598.3556
11071251.6569307.4349224.564198.3379
Table 5. Urban growth area and percent in the UDZ across different regions.
ZEAZ = 0ZEAZ = 0.2ZEAZ = 0.5ZEAZ = 0.8ZEAZ = 1.0
Area
(km2)
Percent
(%)
Area
(km2)
Percent
(%)
Area
(km2)
Percent
(%)
Area
(km2)
Percent
(%)
Area
(km2)
Percent
(%)
Wuchang16.68100.0022.6668.3222.2866.0122.2465.3721.7166.09
Hankou2.80100.003.5376.283.7671.143.7969.203.7970.06
Hanyang8.48100.009.0789.068.7388.918.6987.988.4788.19
North40.69100.0035.7191.7936.7879.5636.8874.8238.3971.78
East45.32100.0044.2679.1843.0670.3042.2467.6341.1067.14
Southeast26.40100.0025.8484.0525.2274.3725.6471.8625.0770.68
South36.93100.0038.3577.9640.9164.1841.5160.0842.7758.85
Southwest38.20100.0037.0178.3436.3966.8837.4961.9437.2261.09
West44.80100.0043.8885.1643.1879.1841.8278.2141.7977.51
Total260.31100.00260.3181.46260.3172.30260.3169.25260.3168.24
Publisher’s Note: MDPI stays neutral with regard to jurisdictional claims in published maps and institutional affiliations.

