Article

A TOPSIS—Risk Matrix and Monte Carlo Expert System for Risk Assessment in Engineering Projects

by
Georgios K. Koulinas
1,*,
Olympia E. Demesouka
1,
Konstantinos A. Sidas
2 and
Dimitrios E. Koulouriotis
1
1
Department of Production and Management Engineering, Democritus University of Thrace, 12 Vas. Sofias St., 67100 Xanthi, Greece
2
Department of Engineering Project Management, Faculty of Science & Technology, Hellenic Open University, Parodos Aristotelous 18 St., 26335 Patra, Greece
*
Author to whom correspondence should be addressed.
Sustainability 2021, 13(20), 11277; https://doi.org/10.3390/su132011277
Submission received: 11 September 2021 / Revised: 4 October 2021 / Accepted: 9 October 2021 / Published: 13 October 2021
(This article belongs to the Special Issue Risk Management Trends in Project-Based Organizations)

Abstract

:
In this paper, we propose a process that combines the Risk Matrix approach with the Technique for Order of Preference by Similarity to Ideal Solution (TOPSIS) and the Monte Carlo Simulation for assessing risk factors that have an impact on the duration of a construction project’s activities and predict if it is feasible to terminate the project within the prescribed deadlines. Initially, we identified the risks affecting each task of the specific project, and then, we applied the risk matrix approach for determining the probability and impact of every risk to each activity. The resulting ranking is used to assign uncertainty to activities’ durations and estimate the probability of on-time project completion, employing the Monte Carlo Simulation approach. The main contribution of this paper is the development of an innovative framework that coordinates an established qualitative and quantitative risk classification approach, with a popular multicriteria method and a powerful simulation approach, to effectively predict time deviations while executing complex construction projects under uncertainty. The proposed framework was applied to estimate the possibility of a timely execution of an artificial lake real project on the island of Alonissos, Greece. The analysis results illustrate that this approach clearly could help the project risk manager proactively perform risk mitigation measures while allocating budget and programming a project with a significant impact on the quality of life of residents and tourists of a small island.

1. Introduction

Freshwater supply is an essential aspect of the sustainable development platform since it is critical for food production, health preservation, and energy security. The total demand for drinking water has exceeded population growth and, according to United Nations [1], half of the population worldwide experiences lack of water for at least one month per year. These facts raise the importance of complex and large projects for ensuring water supply to a residential or agriculture area. The prompt execution of complex projects with a substantial effect on the quality of life of inhabitants and visitors is a severe subject to be discussed by project risk managers and engineers. Provided that the duration of tasks includes volatility related to future threats, the cumulative planning and costs of the project are likely to become uncertain. Hence, more accurate duration predictions are also beneficial when designing initial project schedules. The goal of this research is to implement a method that uses a multicriteria decision-making approach to assess risks that affect the length of operations, then estimate the likelihood of presence and impact for the design of the corresponding risk matrix and use triangular distributions to represent activities’ durations while applying Monte Carlo Simulation iterations (MCS) to predict timely project termination possibilities. The remainder of the paper consists of the following sections: (2) the literature review, (3) the proposed approach, (4) the description of the application in a construction project, and (5) the conclusions section.

2. Literature Review

Project risk management is one of the most challenging processes impacting the project’s expense, time, and complexity.
Risk identification plays a critical role in the first stage of the risk management process since it imposes the analysis framework. Many recent studies focus on identifying risks in construction projects. Qazi et al. [2] proposed an approach which identifies risks considering the corresponding decision problem, and then, selects the best risk mitigation strategies during the commencement stage of a project, while Derakhshanfar et al. [3] developed a delay risk terminology and taxonomy by incorporating data from numerous articles and performing qualitative analysis. In addition, Le et al. [4] analyzed the relative literature and proposed a framework for risks classification in Public Private Partnership (PPP) transportation projects. Recently, Derakhshanfar et al. [5] used a questionnaire survey to identify the most critical risks of delaying construction projects in Australia and their interactions at the various project phases.
Regarding the risk analysis stage, there is a vast number of papers that employ the Monte Carlo Simulation approach. More specifically, Vanhoucke [6] employed Monte-Carlo Simulation while proposing new methods for tracking projects with uncertain durations, and Wang et al. [7] introduced a novel formulation and an algorithmic process for reducing operational costs in a building energy system, and then applied MCS for validating results.
In the study Ntzeremes and Kirytopoulos [8], a new approach for fire risk analysis and assessment was developed and applied in underground road tunnel construction projects, while Koulinas et al. [9] developed a framework that combines Monte Carlo Simulation with the risk manager’s experience for project duration predictions. Additionally, few papers studied risks that appeared in water management projects. Islam et al. [10] proposed a multicriteria model for studying impacts of risk factors on water quality failure potential in water distribution systems. In the study of Song and Chung [11], an approach for quantifying risks within the climate change vulnerability assessment process developed, while Song et al. [12] used classic multicriteria methods for enhancing the inspection process for a first-stage dam construction diversion scheme selection.
Furthermore, the multicriteria methods have been widely used for assessing risks in various scientific fields. Grassi et al. [13] used Fuzzy TOPSIS for risks evaluation in workplaces, and in Karimiazari et al. [14], applied TOPSIS for assessing the risk assessment models instead of simple assessment of risks. Fouladgar et al. Employing the TOPSIS method, [15] employed TOPSIS method for performing performed risk evaluation in complex tunneling projects, and (Samvedi et al. [16] studied the assessment of risks in a supply chain using Fuzzy AHP and Fuzzy TOPSIS, while Vahdani et al. [17] proposed a novel joint FMEA (Failure Mode and Effect Analysis) and TOPSIS framework for risk assessment in the steel production process. In the study of Chen et al. [18], the improved TOPSIS-RSR method was used to perform road safety risk evaluation, based on a composite Road Safety Risk Index (RSRI), while Mangla et al. [19] applied for a fuzzy TOPSIS extension, to determine the priorities of the responses in a successful accomplishment of green initiatives within a green supply chain environment. In the study of Chang [20], a soft-TOPSIS approach was developed to treat the risk assessment problem while designing products and planning production, and Song and Chung [11] proposed a hybrid TOPSIS approach for risks quantification within the process of climate change vulnerability assessment.
In addition, Yazdi [21] proposed the intuitionistic fuzzy hybrid TOPSIS method to smooth the disadvantages of a classic risk matrix and uncertainty from the group decision making process, and Wan et al. [22] introduced an extended failure mode and an effects analysis approach with environmental impacts accounted for and used a rough-sets TOPSIS based technique to cope with incomplete information while performing risk assessment in the manufacturing process. Furthermore, Song et al. [23] developed an extended TOPSIS method to analyze risk factors of direct delivery business from oil refineries, while Faghih-Roohi et al. [24] used an intuitionistic fuzzy hybrid TOPSIS approach to select shipping lanes for pharmaceutical products. Recently, Zhong et al. [25] employed TOPSIS, along with alpha cut levels, for ranking TRIZ-based strategies priorities of renewable energy investments based on a house of quality technique, while Karamoozian and Wu [26] used a joint failure mode and effects analysis (FMEA) to consider risks and, then, applied a Fuzzy Decision-Making Trial and Evaluation Laboratory (FDEMATEL) method to consider interdependencies among the failure modes found by the fuzzy FMEA. In addition, Zhang et al. [27] proposed a slack-oriented robustness measuring method consisted of optimization and a decision-making part and used Monte Carlo Simulation to check the effectiveness of their approach, and Koc and Gurgun [28] used the TOPSIS method to assess the impact of ambiguity factors on construction conflicts. Additionally, (Kaur and Prakash Singh [29] used a joint Data Envelopment Analysis (DEA), Fuzzy Analytical Hierarchical Process, and TOPSIS approach for ranking suppliers according to a set of suitable criteria within an Industry 4.0 environment.
In addition, many papers combined TOPSIS and Monte Carlo Simulation for risk analysis, especially for performing sensitivity analysis to the judgments that the decision-maker assigns to the problem’s elements. More specifically, Islam et al. [10] developed a fuzzy-TOPSIS model for impact identification of several different factors on the overall water quality failure potential in water distribution systems, and applied Monte Carlo simulation-for sensitivity analysis, and Zhu et al. [30] proposed a stochastic multicriteria acceptability analysis and TOPSIS model for group decision making under uncertainty, and performed Monte Carlo Simulation to solve it. In the study of Adetunji et al. [31], TOPSIS and MCS were used for selecting a more suitable system for obsolesce management in military applications.
Recently, Wu et al. [32] proposed a method based on TOPSIS and MCS for the classification of rock masses under uncertainty, while Yatsalo et al. [33] introduced a novel fuzzy extension of the TOPSIS method and implemented the Fuzzy Multi-criteria Acceptability Analysis (FMAA) concept within it, while they used MCS to compare the Fuzzy TOPSIS and FMAA models. Moreover, Chen et al. [34] proposed a method for evaluating slope stability results based on TOPSIS and Monte Carlo Simulation, and Jun et al. [35] ranked alternative scenarios with TOPSIS while introducing a framework for measuring the innovation capacities of financial institutions. Finally, Song et al. [12] used TOPSIS and ELECTRE I multicriteria methods for the implementation of an inspection process for first-stage dam construction diversion scheme selection.
Compared to state of the art technology in its research field, the proposed approach combines in an innovative manner for the risk matrix approach, used for qualitative classification, and the TOPSIS method, which treats the risks as the method’s “criteria” to prioritize activities’ risks. Then, after extracting risk rankings, we apply MCS as beneficial in its computational solid capabilities and compose a compact, effective tool that supports the risk manager in making informed decisions.

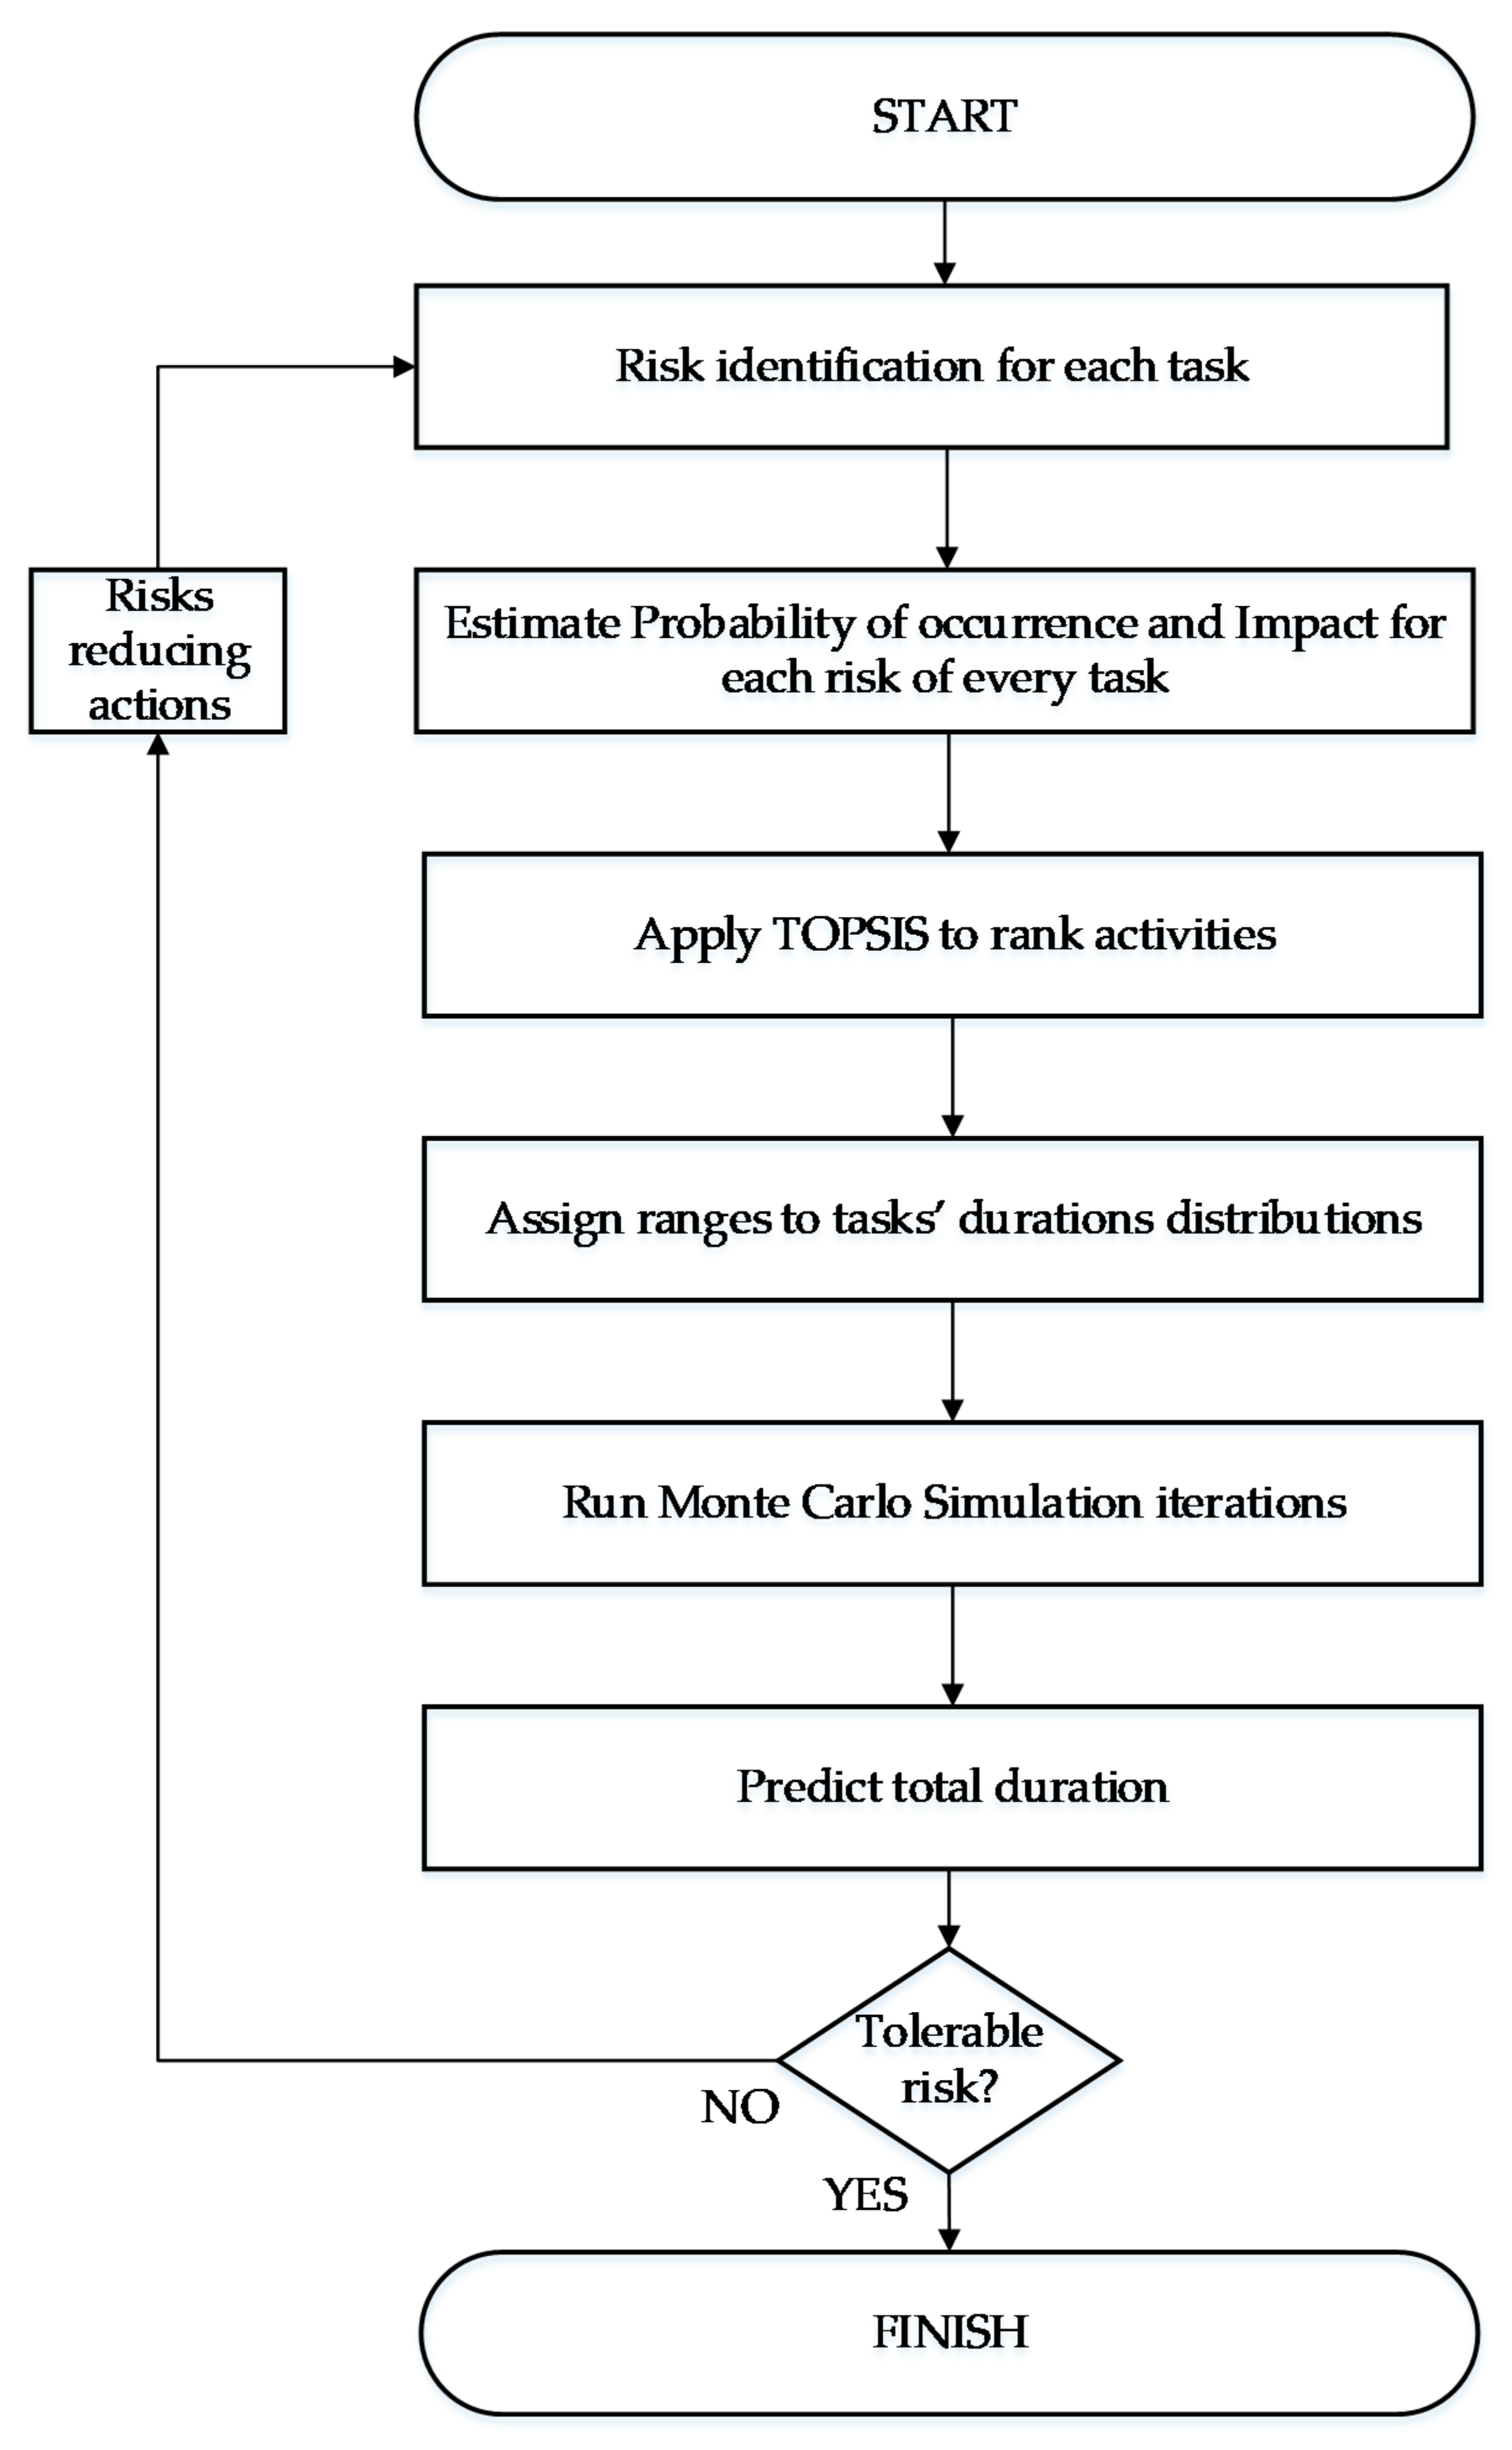
3. The Proposed Framework

The flowchart of the proposed framework is illustrated in Figure 1. Initially, the risks with impact to the tasks of a specific project under study are considered using brainstorming sessions with the expert risk manager and by reviewing comparative scientific literature. Then, for the risk of each activity, the Probability and Impact are estimated by the principles of the Risk Matrix approach for risk categorization. Next, the TOPSIS multicriteria method was applied to construct the ranking of the activities with a descending order of uncertainty level that they contain. This resulting ranking is used to assign duration deviation ranges to activities and quantitatively express the uncertainty. These duration ranges and distributions are input to the Monte Carlo Simulation process, which completes numerous iterations. The constructed scenarios are analyzed, and conclusions are extracted from the risk manager about how tolerable the project’s total risk is. If the total risk level is acceptable, then the process returns results; otherwise, risk mitigation actions are applied, and the process loops back to the first step.
As stated in ref. [36], experts with relevant experience in similar projects or business areas can specifically recognize risks. The project manager should identify these consultants and encourage them to consider, based on their past knowledge and areas of expertise, all dimensions of the project and recommend potential risks. The bias of the professionals in this process should be taken into consideration. In line with this recommendation, risk factors impacting the project under study are identified by recording the judgments of an experienced risk manager while reviewing and analyzing the relative research literature. Furthermore, provided that not all risk factors can influence all tasks according to the nature of each operation, the manager considers a risk list for each task containing the factors influencing the proper completion of the particular job.
After considering the most significant risk factors for each project operation, the risk manager continues to create a probability-impact matrix for all risks. This section of the process explores how risk may occur and discusses how the scope of a job varies due to a risk occurrence. This matrix integrates the probability and impact on activities of all risk factors on the project [36]. The risks are then graded by the value of the multiplication (Probability × Impact) that the program director specifies for all the risks impacting each activity. The specific categories for risk probability of occurrence and risk impact on time, considered for the classification of risks for the present case are showed in Table 1. High-risk factors are found in the red category, yellow represents a medium risk, and the green region reflects low-risk factors. Note that the linguistic variable “VH” corresponds to “Very High”, while the “H-VH” to “High to Very High”, “H” to “High”, “M-H” to “Medium to High”, “M” to “Medium”, “L-M” to “Low to Medium”, “L” to “Low”, “VL-L” to “Very Low to Low”, and “VL” corresponds to “Very Low”.

3.1. Ranking Activities with TOPSIS Method

The Technique for Order of Preference by Similarity to Ideal Solution (TOPSIS), introduced by Hwang, C.L., & Yoon [37], is a popular end-effective multicriteria method for ranking and selection of alternatives with the use of distance measures. The TOPSIS method function is based on setting two “ideal” solutions, the positive and the negative. The method then operates to determine the shortest distance from the ideal positive solution and the longest distance from the ideal negative solution. Given that TOPSIS is a compromise programming method, its central principle is that the ranking of the possible solutions sets depends on their proximity to the Positive Ideal Solution PIS (Equation (1) and at the same time to the Negative Ideal Solution NIS (Equation (2) [38]. The method’s steps are described as follows:
The normalized decision matrix, in the case of m alternatives and n criteria, is constructed with the use of the following equation:
R = r i j m × n
The weighted normalized value v i j derives from the multiplication of weights w j with the normalized decision matrix r i j . The weighted normalized decision matrix is obtained as:
V =   w j r i j   = v i j m × n   i = 1 , 2 , m   j = 1 , 2 , n
Considering that, in TOPSIS, the Euclidean distance measure is employed (p = 2) to calculate the distance from the positive ideal solution and the negative ideal solution, and it is considered a particular case of the compromise programming methods. The model of the method can be simplified by expressing the distances from the optimum positive and the optimum negative points of the analysis as the closeness coefficient of every alternative in a function form, as shown for the benefit criteria and the cost criteria, respectively (Equations (3) and (4)). After that, the PIS and NIS are estimated as:
                                  A + =   v 1 + , v 2 + , , v n +   = ( max i v i j i = 1 , 2 , , m ; j = 1 , 2 , , n   i n   c a s e   o f   b e n e f i t   c r i t e r i a ( min i v i j i = 1 , 2 , , m ; j = 1 , 2 , , n   i n   c a s e   o f   c o s t   c r i t e r i a
                                  A =   v 1 , v 2 , , v n   = ( min i v i j i = 1 , 2 , , m ; j = 1 , 2 , , n   i n   c a s e   o f   b e n e f i t   c r i t e r i a ( max i v i j i = 1 , 2 , , m ; j = 1 , 2 , , n   i n   c a s e   o f   b e n e f i t   c r i t e r i a
Finally, each alternative’s distance from the PIS d i + and NIS d i points is calculated to be ranked using the closeness coefficient C i as follows:
      d i + = j = 1 n d v i j , v j +
  d i = j = 1 n d v i j , v j
The core functionality of the technique is based on the increasingly or decreasingly monotonicity of each criterion, which indicates how easy the positive ideal solution and the negative ideal solution be defined. As a result, the alternatives’ final ranking depends on their distance from the best and the worst ideal solutions. A given alternative is considered better than another if it is closer to the optimum solution and has a farther distance from the worst solution than the other alternative. The closeness coefficient C i , for the ranking of the alternatives, is measured according to Equation (5) based on their distance from the positive ideal solution ( S i + ) and the negative ideal solution ( S i ) ([37,38]).
C i = d i d i + + d i
With   d i + ,   d i 0   a n d   C i 0 , 1

3.2. Uncertainty Representation and Duration Range Estimation

Although no empirical data about the actual durations for each project task are accessible, we have chosen the triangular distribution to represent the durations. The explanation behind this selection is that it will accurately illustrate the inherent volatility of such a project with the only need to assume the most likely duration value, which demonstrates the base case scenario, and minimum and maximum duration values for representing the optimistic and pessimistic duration estimates, respectively. Risk managers often choose this distribution since it reflects more general the uncertainty in situations where, except the knowledge and experience of the risk manager, no more details are utilized to determine the period values [39].
According to the ranking of activities with descending order of significance regarding the actual risk they include, a range is considered to illustrate the delay estimation, which is used as input to the triangular distribution representing each task’s duration during the Monte Carlo Simulation process. In the present case, the most influential task is assigned a 50% delay, the second more critical task takes a 45% delay, etc., until the 11th more influential task, which no delay prediction assigned. In that manner, the Monte Carlo Simulation process analyzes the project’s sensitivity to the duration deviations of the ten most important activities. Notice that these classifications and assignments are set, for this instance, and may be updated in another example project.
The Monte Carlo Simulation is a standard quantitative risk analysis methodology most used for uncertainty analysis and confirmation. It involves selecting a statistical distribution to represent a risk factor, which in our case is the duration of each activity, and then running a large number of iterations creating an equal number of different schedules for the project and calculating its total duration. The probability of implementing the project within a given time limit is determined after completing the total number of runs. The statistical metrics derived by these iterations are useful when concluding a task or even a project’s overall risk level tolerance.

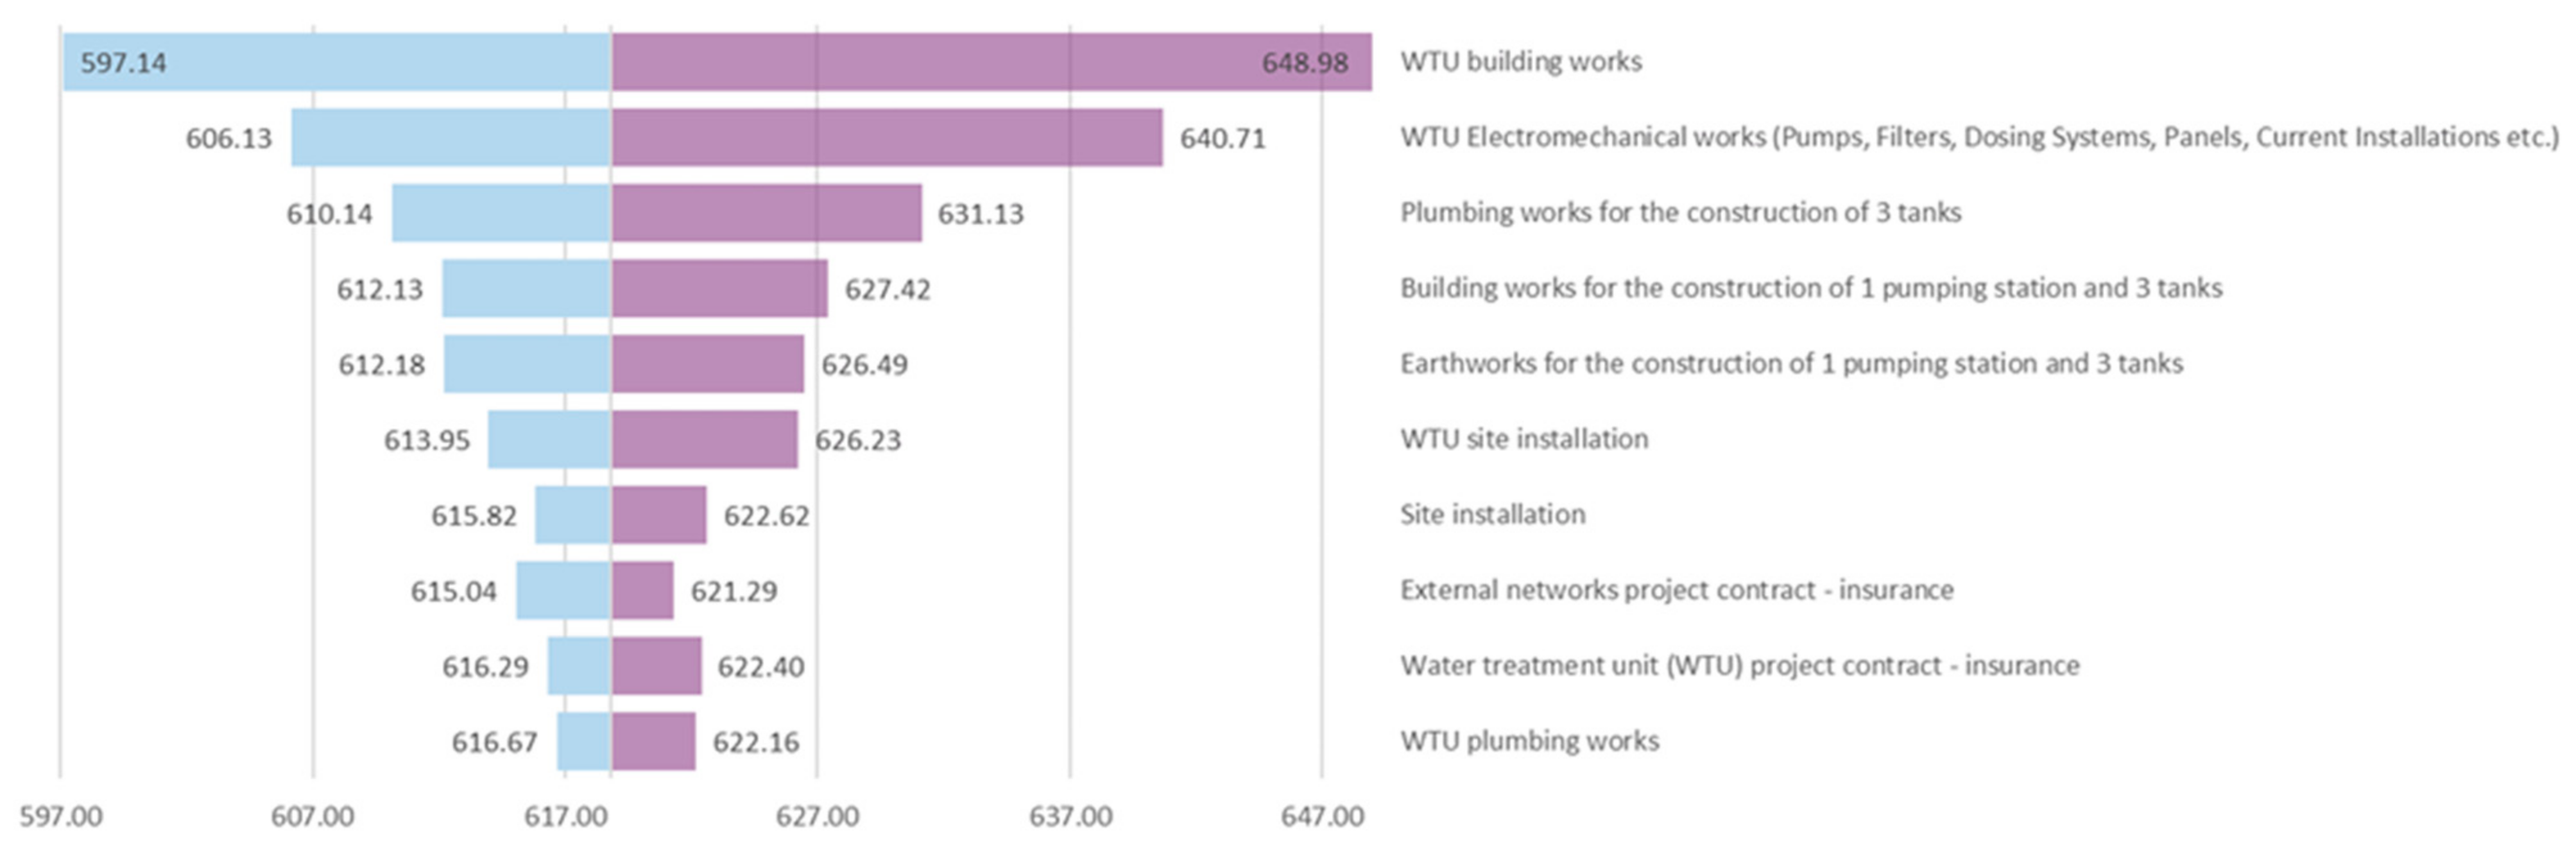
4. Application in an Artificial Lake Construction Project

The proposed approach is used to analyze durations risks in an artificial lake construction project. The valuable capacity of water is 510,000.00 m3, and the project includes the related technical works, i.e., overflow of diversion, water intake, and discharge pipeline on the island of Alonissos, for the collection of nearby river effluents and its storage for consumption. The object of the project also includes the construction of two pumping stations, the lake, and the appropriations needed for the provision of services of the technical consultant, who will perform the geotechnical and quality control of the project. In addition, the compensation of the producers’ lost harvest, the relocation of electricity networks, and the construction of a water transfer pipeline of the reservoir to the area to be utilized for irrigation and water supply are also determined.
The project aims to treat the water supply problem mainly during periods of intense tourism in the island of Alonissos, which is the responsibility of the Municipality of Alonissos. It must be mentioned that today’s water supply is comparatively small. The project aims to improve the life quality of residents by increasing the storage capacity and exploitation of surface runoff water quantities of the Kastania river, which now flow into the sea during the winter season and as a result of the rational water management. Additionally, the satisfaction of irrigation needs for an area of 700 acres would improve the residents’ quality of life. The project’s timely completion is essential for the sustainability of the island, enhancement of the quality of life of its residents, and environmental conservation. Under the contract, the lake shall commence service after 600 project days at the latest. A short description of the artificial lake and the supporting facilities follows: The “Kastania” artificial lake will be used as an inland reservoir pod, formed on the bed of the “Kastania” river. The total storage volume of the lake is 610,000 m3, with the valuable capacity being 510,000 m3. The area occupied by the whole project is about 120 acres.
The sealing of the flood basin of the lake is based on the installation of a sealing membrane. More specifically, a drainage layer of 0.20 m thickness will be constructed, and a substrate of 0.15 m thick, along with a layer of protection against the rubble, will be 0.25 m thick. The sealing membrane is a geosynthetic membrane of high polyethylene content (HPDE) with an embossed upper lip (1.5 mm thick). A non-woven polypropylene geotextile of 400 gr/m2 was used to protect the upper side of the sealing membrane. The dam’s embankment was made of clay core and supporting bodies from excavation materials, mainly from shale and phyllite and limestone formations, with the necessary protection filter zones and drains. The necessary materials for constructing the core and the supporting bodies of the embankment, with a total volume of approximately 185,000 m3, were obtained from the excavation products of the flood reservoir and the relative technical works with a total volume of approximately 350,000 m3. The materials of the protection filters and drains of the embankment, the installation and protection zones of the sealing membrane, and the materials of the permeable embankment, with a total volume of approximately 100,000 m3, came from an existing private quarry, which has the production capacity of the above quantity and is located south of the site of the lake.
The Monte Carlo Simulation experiments were applied within Microsoft Excel 2016 using the embedded programming language Visual Basic for Applications. According to the Critical Path Method calculations, the project has a duration of 562 days, while the contract imposes an acceptable total duration of 600 days from the project start. This deadline works as a “hard constraint” for the artificial lake construction project since, after that date, penalties are activated. Nevertheless, the risk manager knows that he has a 38-day time buffer without performing risk analysis actions before the “hard” deadline. The critical data, including tasks’ names and initial durations and predecessors for the example project that was input to the Monte Carlo Simulation process, are illustrated in Table 2. Note that, durations are expressed in days.
As the process of Figure 1 describes, at first, we have reviewed the relative literature and recorded the expert’s judgments to identify the risk factors that may have an impact on the activities of the example project of the artificial lake construction. The following Table 3 illustrates the complete risk list for the current project.
Next, the risk manager defines the probability of occurrence and impact for each risk of every activity of the project according to the classification rules of Table 1. The following Table 4 illustrates the manager’s judgments regarding the risks with impact on every task, expressed using the linguistic variables described in Table 1.
Table 5 illustrates the results of the product P × I   (namely Probability × Impact) for each risk that has an impact to a certain task. Note that every P and I value is considered because of the choices made by the manager for each risk of a specific task. A given potential risk should have a variable probability of occurring for different activities and may have a different effect on the duration of various tasks.
The application of the TOPSIS method on the judgments of Table 5, results in a ranking for the activities, as illustrated in Table 6. The tasks are listed in order of decreasing risk significance. (e.g., T12 is the riskiest; T1 is the 2nd riskiest, etc.). Next, we give a duration deviation range from the original length to each activity based on this rating, beginning with a maximum deviation of 50%. Additionally, each subsequent activity on the ranking list includes a minor deviation of about 3% (i.e., the second highest—risk activity has a 47 percent deviation from its initial duration, the third has a 44 percent, etc.).
For instance, the first-ranked (riskiest) activity T12 will have an optimistic value equal to the initial (5 days), but its pessimistic value will be 50% more than the initial (namely 7.5 days). Thus, the column “Pessimistic Length” in Table 6 depicts the activity’s worst-case duration. Notably, the most likely and optimistic numbers are identical to the initial duration of each activity, as utilized in the CPM calculation. These values are input to the triangular distribution for running 1000 iterations of the Monte Carlo Simulation process.
After performing the simulation, the minimum (569.91), maximum (677.38), and mean value (618.78) for the total project duration are extracted, along with the standard deviation (20.72) of the make span. These statistics illustrate that the constructor cannot complete the project within the initial project duration of 562 days, as computed by the CPM. In addition, there is only a probability of 20% that the project will end within 600 days, which is a hard time constraint, and it is estimated that the make span will be less than 656.09 days, with a 95 percent chance. Additionally, the percentiles (5%, 25%, 50%, 75%, 90%, and 95%) were found to be of durations (589.10, 602.87, 616.88, 632.88, 646.16, 656.09), respectively. This hybrid multicriteria and simulation-based methodology, which we applied, further supports the message that the project is at risk of not being finished within the prescribed time limits.
Because of the great importance of the artificial lake project to the water supply of the island of Allonissos, a possible considerable delay of completion could have a severe negative impact on the constructor. Moreover, for the reason of comparison, we have applied the classic PERT method to the case example, and we found that there is a 25.60% probability for the project to end within the 562 days deadline and a probability of 28.75% to end the project within the hard constraint of 600 days. These findings might confuse the risk manager to behave as though the project was subject to significantly less delay danger.
In addition, we realized a separate analysis to determine how each task impacts the total project duration (Figure 2). For a mean value of the project duration to 618.78 days, the “WTU building works” task affected most of the duration since its uncertain duration could lead the project to a make span from 597.14 to 648.98 days because of its sizeable initial duration and relatively high level of uncertainty that it includes. Among the other influential tasks, the “WTU Electromechanical works”, “Plumbing works for the construction of 3 tanks”, “Building works for the construction of 1 pumping station and 3 tanks”, and “Earthworks for the construction of 1 pumping station and 3 tanks” could have a considerable significant impact on the total project duration. In contrast, the other five activities cause a relatively slighter deviation of the make span. The knowledge extracted from this graph will be highly beneficial to the project risk manager as it facilitates decision-making concerning activities’ prioritization and more efficient budget allocation for risk reduction actions.

5. Conclusions

This paper suggested an approach based on the risk matrix, along with the well-known TOPSIS method and Monte Carlo Simulation. The proposed framework was implemented to quantify the delay risks in a significant artificial lake construction project. The proposed framework draws its qualitative analysis capabilities from the risk matrix approach and uses a powerful and effective multicriteria compromise programming method (TOPSIS) to assess risks that impact each project task. Then, employing the triangular statistical distribution and MCS, we perform an extensive sensitivity analysis to predict the possibilities of timely project completion. The efficiency of this method has been tested against the classic PERT method, and the findings have been promising as this methodology will help managers to make forecasts about time discrepancies in operations and, generally, assist the risk manager in allocating the budget for risk reduction steps. The critical contribution of this paper is the introduction of an integrated framework that uses an efficient multicriteria decision-making method, such as TOPSIS, the risk matrix approach for classifying risks, and the Monte Carlo Simulation technique for performing sensitivity analysis. The innovation of the proposed approach is that it combines the risk matrix approach for qualitative classification with the TOPSIS method, which ranks the risks as “criteria”, and then gives the risks rankings, with the MCS applied for making duration predictions and generally supporting the risk manager in the decision making process.
Although the proposed framework could be a valuable tool during the project risk management process, it has some limitations. More specifically, the expert’s judgments are subjective and depend on the experience and the value system of the risk manager, which can affect the risk ranking. Additionally, the classic TOPSIS method is used, which uses crisp numbers to represent judgments, something that cannot correspond to the uncertainty of the expert’s judgments. Future enhancements to the current framework may include a fuzzy extension of TOPSIS or another multicriteria method for performing risk assessment and comparing the results with the current approach. Additionally, the proposed framework could be extended to include group decision-making, which is more realistic in practice. At the same time, different statistical distributions may be substituted for the triangle and the resultant performance evaluated.

Author Contributions

Conceptualization, G.K.K., O.E.D. and D.E.K.; Data curation, G.K.K., O.E.D. and K.A.S.; Formal analysis, G.K.K., O.E.D. and D.E.K.; Investigation, G.K.K. and O.E.D.; Methodology, G.K.K., O.E.D. and D.E.K.; Software, O.E.D.; Supervision, G.K.K. and D.E.K.; Validation, G.K.K., O.E.D. and D.E.K.; Visualization, G.K.K.; Writing—original draft, G.K.K., O.E.D. and K.A.S.; Writing—review & editing, G.K.K., O.E.D. and D.E.K. All authors have read and agreed to the published version of the manuscript.

Funding

This research received no external funding.

Data Availability Statement

Some or all data, models, or codes that support the findings of this study are available from the corresponding author upon reasonable request.

Conflicts of Interest

The authors declare no conflict of interest.

References

  1. The Sustainable Development Goals Report; United Nations: New York, NY, USA, 2019.
  2. Qazi, A.; Quigley, J.; Dickson, A.; Kirytopoulos, K. Project Complexity and Risk Management (ProCRiM): Towards modelling project complexity driven risk paths in construction projects. Int. J. Proj. Manag. 2016, 34, 1183–1198. [Google Scholar] [CrossRef] [Green Version]
  3. Derakhshanfar, H.; Ochoa, J.J.; Kirytopoulos, K.; Mayer, W.; Tam, V.W.Y. Construction delay risk taxonomy, associations and regional contexts: A systematic review and meta-analysis. Eng. Constr. Archit. Manag. 2019, 26, 2364–2388. [Google Scholar] [CrossRef]
  4. Le, P.T.; Kirytopoulos, K.; Chileshe, N.; Rameezdeen, R. Taxonomy of risks in PPP transportation projects: A systematic literature review. Int. J. Constr. Manag. 2019. [Google Scholar] [CrossRef]
  5. Derakhshanfar, H.; Ochoa, J.J.; Kirytopoulos, K.; Mayer, W.; Langston, C. A cartography of delay risks in the Australian construction industry: Impact, correlations and timing. Eng. Constr. Archit. Manag. 2020, 28, 1952–1978. [Google Scholar] [CrossRef]
  6. Vanhoucke, M. On the dynamic use of project performance and schedule risk information during projecttracking. Omega 2011, 39, 416–426. [Google Scholar] [CrossRef]
  7. Wang, C.; Jiao, B.; Guo, L.; Tian, Z.; Niu, J.; Li, S. Robust scheduling of building energy system under uncertainty. Appl. Energy 2016, 167, 366–376. [Google Scholar] [CrossRef]
  8. Ntzeremes, P.; Kirytopoulos, K. Applying a stochastic-based approach for developing a quantitative risk assessment method on the fire safety of underground road tunnels. Tunn. Undergr. Sp. Technol. 2018, 81, 619–631. [Google Scholar] [CrossRef]
  9. Koulinas, G.K.; Xanthopoulos, A.S.; Tsilipiras, T.T.; Koulouriotis, D.E. Schedule Delay Risk Analysis in Construction Projects with a Simulation-Based Expert System. Buildings 2020, 10, 134. [Google Scholar] [CrossRef]
  10. Islam, M.S.; Sadiq, R.; Rodriguez, M.J.; Najjaran, H.; Francisque, A.; Hoorfar, M. Evaluating Water Quality Failure Potential in Water Distribution Systems: A Fuzzy-TOPSIS-OWA-based Methodology. Water Resour. Manag. 2013, 27, 2195–2216. [Google Scholar] [CrossRef]
  11. Song, J.Y.; Chung, E.-S. Robustness, Uncertainty and Sensitivity Analyses of the TOPSIS Method for Quantitative Climate Change Vulnerability: A Case Study of Flood Damage. Water Resour. Manag. 2016, 30, 4751–4771. [Google Scholar] [CrossRef]
  12. Song, Z.; Liu, Q.; Hu, Z. Decision-Making Framework, Enhanced by Mutual Inspection for First-Stage Dam Construction Diversion Scheme Selection. Water Resour. Manag. 2020, 34, 563–577. [Google Scholar] [CrossRef]
  13. Grassi, A.; Gamberini, R.; Mora, C.; Rimini, B. A fuzzy multi-attribute model for risk evaluation in workplaces. Saf. Sci. 2009, 47, 707–716. [Google Scholar] [CrossRef]
  14. Karimiazari, A.; Mousavi, N.; Mousavi, S.F.; Hosseini, S. Risk assessment model selection in construction industry. Expert Syst. Appl. 2011, 38, 9105–9111. [Google Scholar] [CrossRef]
  15. Fouladgar, M.M.; Yazdani-Chamzini, A.; Zavadskas, E.K. Risk evaluation of tunneling projects. Arch. Civ. Mech. Eng. 2012, 12, 1–12. [Google Scholar] [CrossRef]
  16. Samvedi, A.; Jain, V.; Chan, F.T.S. Quantifying risks in a supply chain through integration of fuzzy AHP and fuzzy TOPSIS. Int. J. Prod. Res. 2013, 51, 2433–2442. [Google Scholar] [CrossRef]
  17. Vahdani, B.; Salimi, M.; Charkhchian, M. A new FMEA method by integrating fuzzy belief structure and TOPSIS to improve risk evaluation process. Int. J. Adv. Manuf. Technol. 2015, 77, 357–368. [Google Scholar] [CrossRef]
  18. Chen, F.; Wang, J.; Deng, Y. Road safety risk evaluation by means of improved entropy TOPSIS-RSR. Saf. Sci. 2015, 79, 39–54. [Google Scholar] [CrossRef]
  19. Mangla, S.K.; Kumar, P.; Barua, M.K. Prioritizing the responses to manage risks in green supply chain: An Indian plastic manufacturer perspective. Sustain. Prod. Consum. 2015, 1, 67–86. [Google Scholar] [CrossRef]
  20. Chang, K.-H. A novel general risk assessment method using the soft TOPSIS approach. J. Ind. Prod. Eng. 2015, 32, 408–421. [Google Scholar] [CrossRef]
  21. Yazdi, M. Risk assessment based on novel intuitionistic fuzzy-hybrid-modified TOPSIS approach. Saf. Sci. 2018, 110, 438–448. [Google Scholar] [CrossRef]
  22. Wan, N.; Li, L.; Ye, C.; Wang, B. Risk assessment in intelligent manufacturing process: A case study of an optical cable automatic arranging robot. IEEE Access 2019, 7, 105892–105901. [Google Scholar] [CrossRef]
  23. Song, W.; Zhu, J.; Wang, H.; Chang, A. Multistage risk assessment of direct delivery business from local oil refineries in Sinopec Group based on normal cloud model. Int. J. Prod. Res. 2019, 58, 5624–5650. [Google Scholar] [CrossRef]
  24. Faghih-Roohi, S.; Akcay, A.; Zhang, Y.; Shekarian, E.; de Jong, E. A group risk assessment approach for the selection of pharmaceutical product shipping lanes. Int. J. Prod. Econ. 2020, 229, 107774. [Google Scholar] [CrossRef]
  25. Zhong, J.; Hu, X.; Yuksel, S.; Dincer, H.; Ubay, G.G. Analyzing the Investments Strategies for Renewable Energies Based on Multi-Criteria Decision Model. IEEE Access 2020, 8, 118818–118840. [Google Scholar] [CrossRef]
  26. Karamoozian, A.; Wu, D. A hybrid risk prioritization approach in construction projects using failure mode and effective analysis. Eng. Constr. Archit. Manag. 2020, 27, 2661–2686. [Google Scholar] [CrossRef]
  27. Zhang, L.; Dai, G.; Zou, X.; Qi, J. Robustness-based multi-objective optimization for repetitive projects under work continuity uncertainty. Eng. Constr. Archit. Manag. 2020, 27, 3095–3113. [Google Scholar] [CrossRef]
  28. Koc, K.; Gurgun, A.P. Ambiguity factors in construction contracts entailing conflicts. Eng. Constr. Archit. Manag. 2021, in press. [Google Scholar] [CrossRef]
  29. Kaur, H.; Prakash Singh, S. Multi-stage hybrid model for supplier selection and order allocation considering disruption risks and disruptive technologies. Int. J. Prod. Econ. 2021, 231, 107830. [Google Scholar] [CrossRef]
  30. Zhu, F.; Zhong, P.-A.; Sun, Y. Multi-criteria group decision making under uncertainty: Application in reservoir flood control operation. Environ. Model. Softw. 2018, 100, 236–251. [Google Scholar] [CrossRef]
  31. Adetunji, O.; Bischoff, J.; Willy, C.J. Managing system obsolescence via multicriteria decision making. Syst. Eng. 2018, 21, 307–321. [Google Scholar] [CrossRef]
  32. Wu, L.Z.; Li, S.H.; Zhang, M.; Zhang, L.M. A new method for classifying rock mass quality based on MCS and TOPSIS. Environ. Earth Sci. 2019, 78, 199. [Google Scholar] [CrossRef]
  33. Yatsalo, B.; Korobov, A.; Öztayşi, B.; Kahraman, C.; Martínez, L. A general approach to fuzzy TOPSIS based on the concept of fuzzy multicriteria acceptability analysis. J. Intell. Fuzzy Syst. 2020, 38, 979–995. [Google Scholar] [CrossRef]
  34. Chen, W.; Zhao, Y.; Liu, L.; Wang, X. A New Evaluation Method for Slope Stability Based on TOPSIS and MCS. Adv. Civ. Eng. 2020, 2020, 1209470. [Google Scholar] [CrossRef]
  35. Jun, Q.; Dinçer, H.; Yüksel, S. Stochastic hybrid decision-making based on interval type 2 fuzzy sets for measuring the innovation capacities of financial institutions. Int. J. Financ. Econ. 2020, 26, 573–593. [Google Scholar] [CrossRef]
  36. PMI. PMBOK Guide, 6th ed.; Project Management Institute: Newtown Square, PA, USA, 2017. [Google Scholar]
  37. Hwang, C.L.; Yoon, K. Multiple Attribute Decision Making Methods and Applications; Springer: Berlin, Germany, 1981. [Google Scholar] [CrossRef]
  38. Hwang, C.-L.C.-L.; Lai, Y.-J.Y.-J.; Liu, T.-Y.T.-Y. A new approach for multiple objective decision making. Comput. Oper. Res. 1993, 20, 889–899. [Google Scholar] [CrossRef]
  39. Rees, M. Business Risk ans Simulation Modelling in Practice Using Excel, VBA and @RISK; John Wiley & Sons Ltd.: Hoboken, NJ, USA, 2015. [Google Scholar]
Figure 1. The flowchart of the proposed process.
Sustainability 13 11277 g001
Figure 2. Sensitivity graph for the ten most affective activities.
Sustainability 13 11277 g002
Table 1. The rules for the construction of the risk matrix.
Linguistic VariableProbability of OccurrenceValueProbability × Impact (P × I)
VH>90%0.900.090.180.270.360.450.540.630.720.81
H-VH71–80%0.800.080.160.240.320.400.480.560.640.72
H61–70%0.700.070.140.210.280.350.420.490.560.63
M-H51–60%0.600.060.120.180.240.300.360.420.480.54
M41–50%0.500.050.100.150.200.250.300.350.400.45
L-M31–40%0.400.040.080.120.160.200.240.280.320.36
L21–30%0.300.030.060.090.120.150.180.210.240.27
VL-L11–20%0.200.020.040.060.080.100.120.140.160.18
VL1–10%0.100.010.020.030.040.050.060.070.080.09
No Probability0%0.000.100.200.300.400.500.600.700.800.90
1–10%11–20%21–30%31–40%41–50%51–60%61–70%71–80%>90%
VLVL-LLL-MMM-HHH-VHVH
Risk Impact on time
Table 2. The key data for the example project.
IDActivityDurationPredecessors
T0Start0
T1External networks project contract—insurance5T0
T2Site installation5T2
T3Earthworks for the constr. of 1 pumping station and 3 tanks30T3
T4Earthworks for the construction of networks163T3
T5Building works for 1 pumping station and 3 tanks92T4
T6Electromechanical works for the constr. of 1 pumping station41T6
T7Plumbing works for the construction of 3 tanks64T6
T8Building works for the construction of networks193T5,T7
T9Plumbing works for the construction of networks170T8
T10Other completion works of 1 pumping station and 3 tanks170T8
T11Other network integration tasks55T9,T10,T11
T12Water treatment unit (WTU) project contract—insurance5T6,T7,T8
T13WTU site installation5T13
T14WTU building works173T14
T15WTU plumbing works152T15
T16WTU Electromechanical works (Pumps, Filters etc.)183T15
T17Other works (Landscaping, fencing, green projects, etc.)31T16
Finish0T17,T18
Table 3. The complete risk list for the artificial lake construction project.
Risk IDDescriptionRisk IDDescription
S1Changes in laws and regulationsS11Delay of subcontractors
S2Delay due to protest by residentsS12Piping equipment supplier delay
S3Lack of specialized materialsS13Increased transport costs in an island area
S4Inability to transport materials to the islandS14Aged programming study
S5Inability to find funding for the implementation (and completion) of the projectS15Errors and omissions in the study
S6Possible need for administrative support from another public body due to lack of technical competence of the MunicipalityS16Unexpected soil conditions
S7Possible discovery of antiquities and intervention of archeologyS17Lack of technological knowledge, skills, applied techniques for the implementation of work
S8Refusal to accept the projectS18Perceived environmental impacts from the Project
S9Possible poor coordination between Project Owner, Supervisor and Contractor (and Technical Consultant, if any)S19Difficulty in finding and buying fields for the installation of pumping stations, etc.
S10Delays in licensing procedures, tendersS20Objections during the award procedures
S21Serious work accident
Table 4. The judgements of the expert as linguistic variables.
Task
T1T2T3T4T5T6T7T8T9T10T11T12T13T14T15T16T17
PIPIPIPIPIPIPIPIPIPIPIPIPIPIPIPIPI
RiskS1MVL-L0 0 0 0 0 0 0 0 0 0 ML0 0 0 0 0
S20 LM0 0 0 0 0 0 0 0 0 0 VL-LVH0 0 0 0
S30 0 0 0 0 0 M-HM0 0 0 0 0 0 0 0 MM0
S40 0 0 0 M-HMHMM-HL-MM- HLHM0 0 0 0 HMHL-MHL0
S5VHH-VH0 0 0 0 0 0 0 0 0 0 VHVH0 0 0 0 0
S6HHHM0 0 0 0 0 0 0 0 0 HH-VH0 0 0 0 0
S70 0 MLL-MVL-L0 0 0 0 0 0 0 0 0 0 0 0 0
S80 0 VLLVLL-MVLLVLL-MVLMVLMVLVL-L0 0 0 0 VLL-MVLLVLM0
S9LH-VHLH0 0 0 0 0 0 0 0 0 LVHLH0 0 0 0
S10MM0 0 0 0 0 0 0 0 0 0 MM-H0 0 0 0 0
S110 0 L-MHMH-VHL-MH-VHMH-VHMML-MM-HMHLL-MLL-M0 0 MHL-MMLM0
S120 0 0 0 0 0 0 MMMM-H0 0 0 0 0 0 0 0
S130 0 0 0 HLHL-MHL-MHLH-VHL-M0 0 0 0 HLM-HLHVL-L0
S14VHH0 0 0 0 0 0 0 0 0 0 VHH-VH0 0 0 0 0
S15MM0 0 0 0 0 0 0 0 0 0 MM-H0 0 0 0 0
S160 0 LLLM0 0 0 0 0 0 0 0 0 L-MLL-ML0 VL-LM
S170 0 0 0 0 HH-VH0 0 0 0 0 0 0 0 0 HH0
S180 0 0 0 0 0 0 0 0 LVL0 0 0 LL0 0 LVL-L
S190 0 MMM-HM0 0 0 0 0 0 0 0 0 0 0 0 0
S20HM0 0 0 0 0 0 0 0 0 0 HM-H0 0 0 0 0
S210 0 L-MHMH-VHL-MH-VHMH-VHMML-MM-HMHLL-MLL-M0 0 MH0 LM0
Table 5. The P × I values for each risk of every activity.
Task
T1T2T3T4T5T6T7T8T9T10T11T12T13T14T15T16T17
RiskS10.100000000000.1500000
S200.1500000000000.180000
S30000000.3000000000.250
S400000.30.350.240.180.3500000.350.280.210
S50.7200000000000.8100000
S60.490.350000000000.5600000
S7000.150.080000000000000
S8000.030.040.030.040.050.050.0200000.040.030.050
S90.240.210000000000.270.210000
S100.2500000000000.300000
S11000.280.40.320.40.250.240.350.120.12000.350.20.150
S1200000000.250.300000000
S1300000.210.280.280.210.3200000.210.180.140
S140.6300000000000.7200000
S150.2500000000000.300000
S16000.090.150000000000.120.1200.1
S17000000.560000000000.490
S180000000000.030000.09000.06
S19000.250.30000000000000
S200.3500000000000.4200000
S21000.280.40.320.40.250.240.350.120.12000.3500.150
Table 6. TOPSIS ranking results for the activities.
Ranking Deviation (%)Pessimistic Duration
T1217higher risk
Sustainability 13 11277 i001
507.5
T116477.35
T41544234.72
T3144142.30
T141338238.74
T6123555.35
T91132224.40
T161029236.07
T792680.64
T8823237.39
T27206.00
T136175.85
T5514104.88
T15411168.72
T173833.48
T1025178.50
T111256.10
Publisher’s Note: MDPI stays neutral with regard to jurisdictional claims in published maps and institutional affiliations.

